The pro-regenerative effects of hyperIL6 in drug-induced liver injury are unexpectedly due to competitive inhibition of IL11 signaling
- Cardiovascular and Metabolic Disorders Program, Duke-National University ofSingapore Medical School, Singapore
- National Heart Research Institute Singapore, National Heart Centre Singapore, Singapore
- MRC-London Institute of Medical Sciences, Hammersmith Hospital Campus, United Kingdom
Figures
Figure 1 with 2 supplements
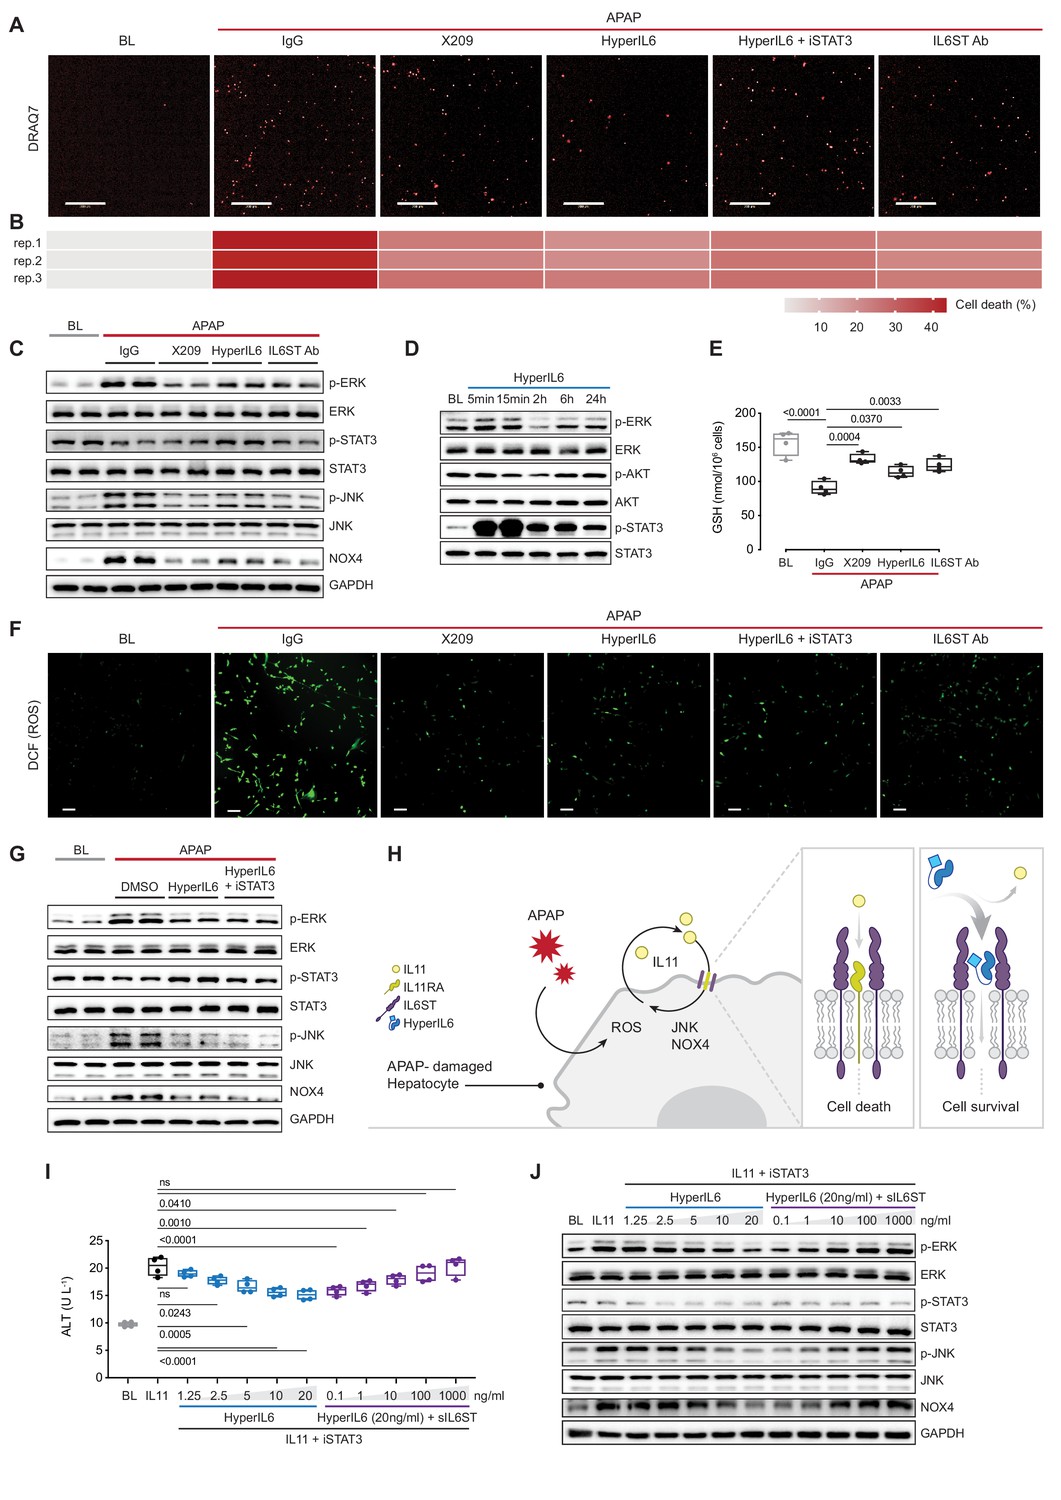
STAT-independent HyperIL6 activity inhibits APAP- or IL11-stimulated cell death through competitive binding to the IL6ST co-receptor.
(A) Representative fluorescent images and (B) quantification of DRAQ7 staining for cell death (scale bars, 200 µm) (n = 3 independent experiments, 23 images per experiment) in APAP (20 mM) treated hepatocytes in the presence of IgG (2 µg/ml), DMSO, anti-IL11RA (X209, 2 µg/ml), HyperIL6 (20 ng/ml), HyperIL6 supplemented with iSTAT3 (S3I-201, 20 µM), or anti-IL6ST (2 µg/ml). (C) Western blots showing phospho-ERK, ERK, phospho-STAT3, STAT3, phospho-JNK, JNK, NOX4, and GAPDH levels in APAP-treated hepatocytes in the presence of IgG, X209, HyperIL6, or anti-IL6ST. (D) Western blots of phosphorylated ERK, AKT, and STAT3 protein and their respective total expression in hepatocytes in response to HyperIL6 stimulation. (E) GSH levels (n = 4) in APAP-treated hepatocytes. (F) Representative fluorescent images of DCFDA (2’,7’-dichlorofluorescein diacetate) staining for ROS detection (scale bars, 100 µm) (n = 4 independent experiments, 10 images per experiment) in APAP-treated hepatocytes. (G) Western blots showing ERK, STAT3, and JNK activation status, NOX4 protein expression in APAP-treated hepatocytes in the presence of DMSO, HyperIL6, or HyperIL6 supplemented with iSTAT3. (H) Proposed mechanism for competition of IL11 cis-signaling and IL6 trans-signaling by binding to IL6ST. (I) ALT secretion (n = 4) and (J) western blots showing ERK, STAT3, and JNK activation status, NOX4 protein expression by rhIL11 (10 ng/ml) treated hepatocytes following a dose range stimulation of either HyperIL6 or sIL6ST in the presence of iSTAT3. (A–G, I–J) Primary human hepatocytes; (A–C, E–G, I–J) 24 hr stimulation. (E, I) Data are shown as box-and-whisker with median (middle line), 25th–75th percentiles (box), and min–max values (whiskers), one-way ANOVA with Dunnett’s correction.
-
Figure 1—source data 1
Raw data, western blot quantification, and fluorescence intensity for panels A–G, I–J.
- https://cdn.elifesciences.org/articles/68843/elife-68843-fig1-data1-v2.xlsx
-
Figure 1—source data 2
Western blot images (original and annotated) for panels C, D, G, J.
- https://cdn.elifesciences.org/articles/68843/elife-68843-fig1-data2-v2.zip
Figure 1—figure supplement 1
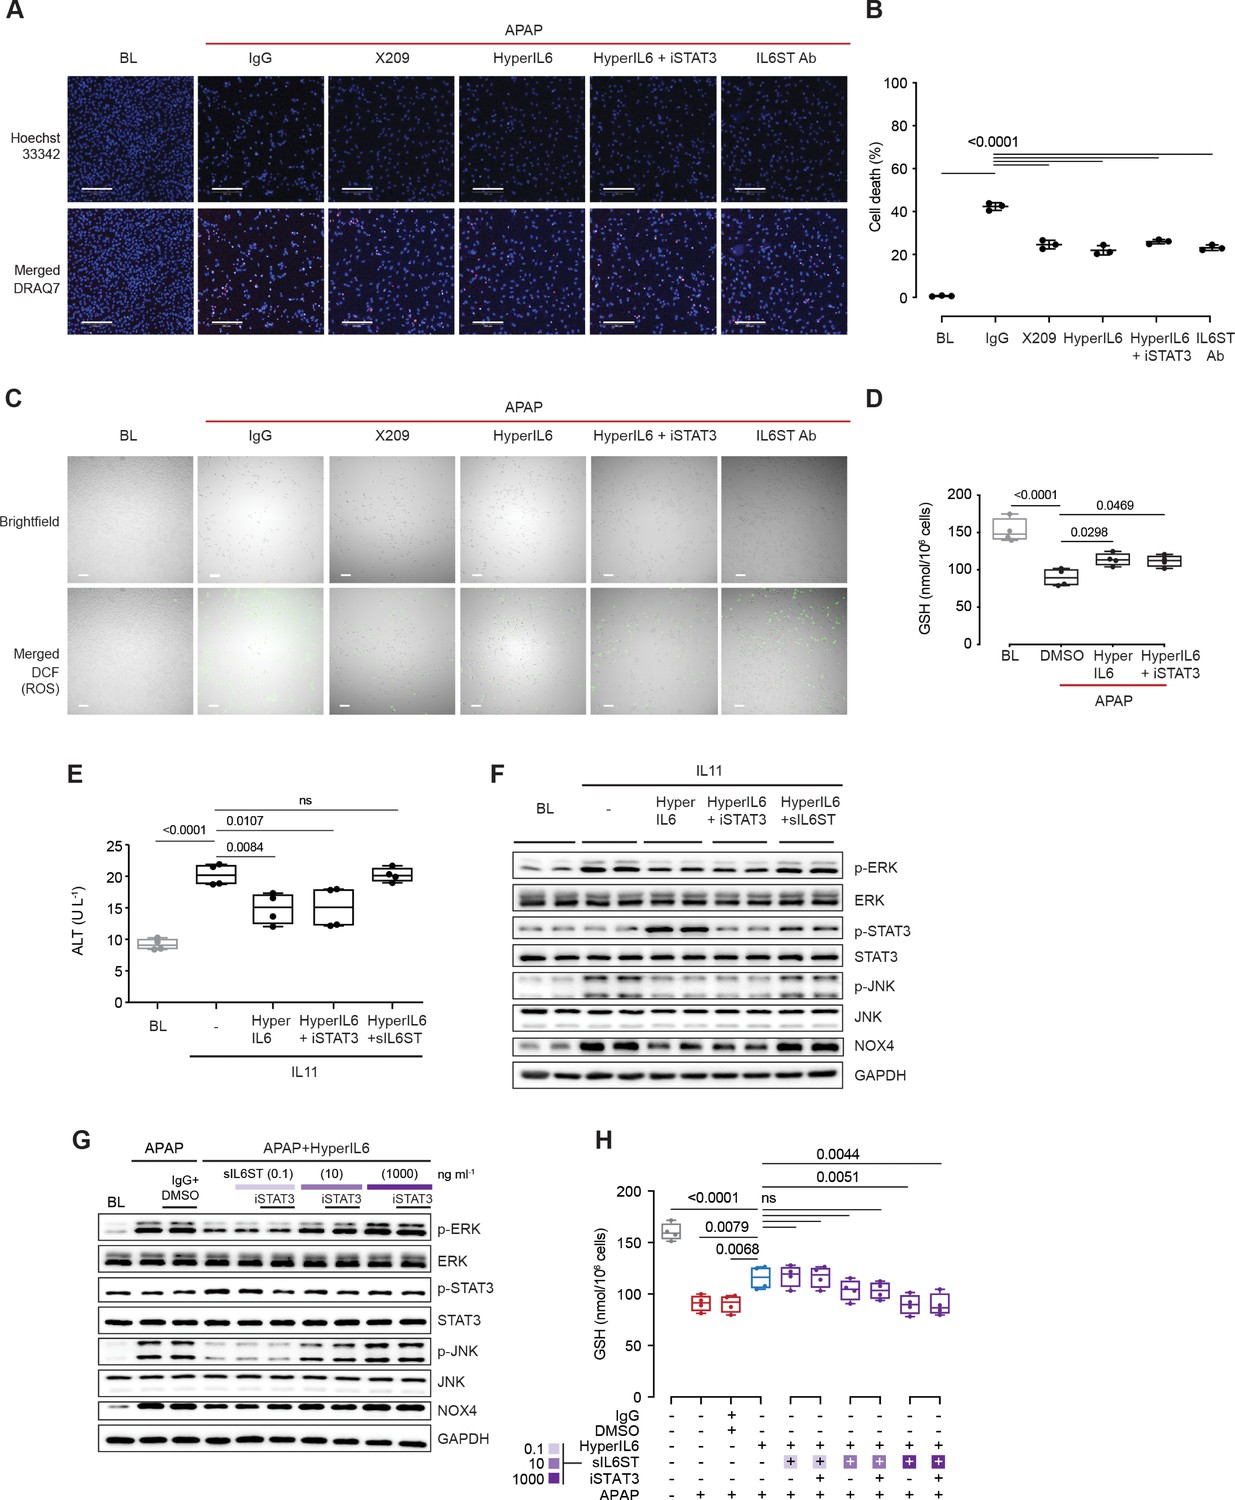
STAT-independent HyperIL6 activity inhibits APAP- or IL11-stimulated hepatocyte cell death.
(A) Representative Hoechst 33,342 and merged fluorescence images (scale bars, 200 µm) and (B) quantification of cell death for DRAQ7 staining experiment (n = 3 independent experiments, 23 images per experiment) shown in Figure 1A,B. (C) Representative brightfield images and merged fluorescence-brightfield images (scale bars, 100 µm) for DCFDA staining experiment (n = 4 independent experiments, 10 images per experiment) shown in Figure 1F. (D) GSH levels (n = 4) in APAP-treated hepatocytes. (E) ALT secretion (n = 4) and (F) western blots showing ERK, STAT3, and JNK activation status, NOX4 protein expression in rhIL11 (10 ng/ml) treated hepatocytes in the presence of HyperIL6 (20 ng/ml), HyperIL6 supplemented with iSTAT3 (S3I-201, 20 µM), or sIL6ST (1 µg/ml). (G) Western blots showing ERK, STAT3, and JNK activation status, NOX4 protein expression, and (H) GSH levels (n = 4) in APAP (20 mM) treated hepatocytes in the presence of HyperIL6 (20 ng/ml), HyperIL6 supplemented with a dose range of sIL6ST, or HyperIL6 supplemented with iSTAT3 (S3I-201, 20 µM) and a dose range of sIL6ST. (B, D, E, H) Data are shown as box-and-whisker with median (middle line), 25th–75th percentiles (box), and min–max values (whiskers), one-way ANOVA with Dunnett’s correction.
-
Figure 1—figure supplement 1—source data 1
Raw data, western blot quantification, and fluorescence intensity for panels A–H.
- https://cdn.elifesciences.org/articles/68843/elife-68843-fig1-figsupp1-data1-v2.xlsx
-
Figure 1—figure supplement 1—source data 2
Western blot images (original and annotated) for panels F–G.
- https://cdn.elifesciences.org/articles/68843/elife-68843-fig1-figsupp1-data2-v2.zip
Figure 1—figure supplement 2
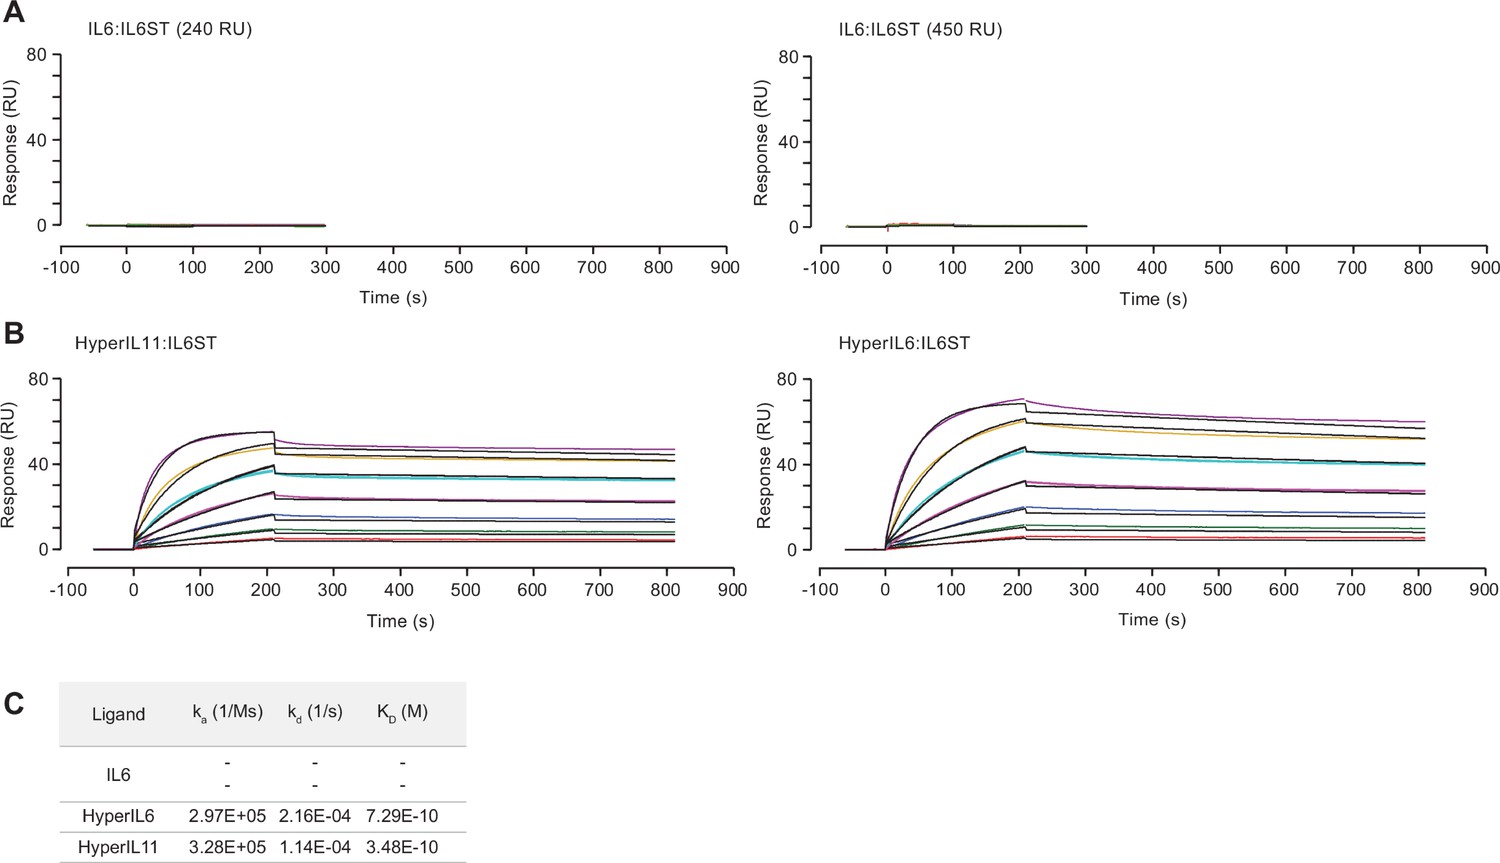
Surface plasmon resonance analysis of IL6, HyperIL11, or HyperIL6 binding to IL6ST.
Sensorgrams showing binding of (A) IL6, (B) HyperIL11 (left) and HyperIL6 (right) to immobilized IL6ST. The colored lines represent the experimental data; the black lines represent a theoretically fitted curve (1:1 Langmuir). (C) Binding affinity, association, and dissociation constants for experiments shown in (A) and (B).
Figure 2 with 1 supplement

Hepatocyte-specific HyperIl6 expression reduces APAP-induced liver injury and phenocopies inhibition of IL11 signaling.
(A) Schematic of mice receiving rh-HyperIL6 or rm-HyperIL6 (500 µg/kg) administration 2 hr prior to APAP injection; mice were harvested 6 hr post-saline or APAP injection. (B) Serum ALT levels, (C) serum AST levels, (D) hepatic GSH levels, (E) western blot analysis of hepatic ERK, STAT3, and JNK activation, and (F) representative H&E-stained liver images (scale bars, 50 µm) for experiments shown in (A). (G) Schematic of APAP-injected mice with hepatocyte-specific expression of HyperIl6/sIl6st or IgG/X209 administration. Three weeks following AAV8-Alb-Null, AAV8-Alb-HyperIl6, or AAV8-Alb-sIl6st virus injection, mice were injected with APAP (400 mg/kg); X209 or IgG (20 mg/kg) was administered at the beginning of fasting period, 16 hr prior to APAP injection; control mice received saline injection; mice were harvested 24 hr post-saline or APAP injection. (H) Western blots of hepatic HyperIL6 expression and GAPDH as internal control, (I) serum ALT levels, (J) serum AST levels, (K) western blots showing hepatic levels of sIL6ST, PCNA, Cyclin D1, and GAPDH as internal control, (L) western blots showing hepatic levels of phospho-ERK, ERK, phospho-STAT3, STAT3, phospho-JNK, and JNK, (M) hepatic GSH levels, and (N) representative H&E-stained liver images (scale bars, 50 µm) for experiments shown in (G). (B–D) N = 5 mice/group; (I–J, M) n = 6 mice/group. (B–D, I–J, M) Data are shown as box-and-whisker with median (middle line), 25th–75th percentiles (box), and min–max values (whiskers), one-way ANOVA with Tukey’s correction.
-
Figure 2—source data 1
Raw data, western blot quantification, and necrotic area (%) of H&E-stained liver images for panels B–F, H–N.
- https://cdn.elifesciences.org/articles/68843/elife-68843-fig2-data1-v2.xlsx
-
Figure 2—source data 2
Western blot images (original and annotated) for panels E, H–K, L.
- https://cdn.elifesciences.org/articles/68843/elife-68843-fig2-data2-v2.zip
Figure 2—figure supplement 1
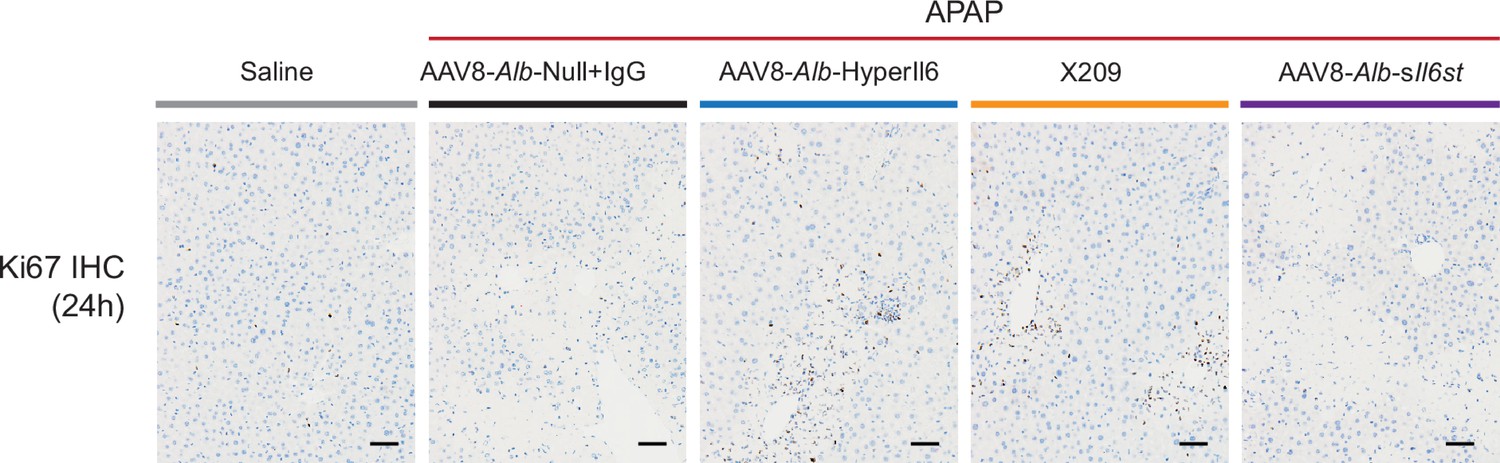
Hepatocyte-specific HyperIl6 expression promotes liver regeneration following APAP-induced liver injury and phenocopies inhibition of IL11 signaling.
Immunohistochemistry staining of Ki67 in the livers of mice (scale bars, 50 µm) for experiments shown in Figure 2G.
-
Figure 2—figure supplement 1—source data 1
Positive cell counts of Ki67-stained liver images.
- https://cdn.elifesciences.org/articles/68843/elife-68843-fig2-figsupp1-data1-v2.xlsx
Figure 3 with 1 supplement

Hepatocyte-specific HyperIl6 expression reduces APAP- or IL11-induced liver injury independent of STAT3 activation.
(A) Schematic of APAP-injected mice with hepatocyte-specific expression of HyperIl6± iSTAT3 administration. Three weeks following AAV8-Alb-Null or AAV8-Alb-HyperIl6 virus injection, mice were injected with APAP (400 mg/kg); iSTAT3 (S3I-201, 10 mg/kg) was administered at the beginning of fasting period, 16 hr prior to APAP injection; control mice received saline injection; mice were harvested 6 hr post-saline or APAP injection. (B) Serum ALT levels, (C) hepatic GSH levels, (D) western blots showing hepatic phospho-ERK, ERK, phospho-STAT3, STAT3, phospho-JNK, and JNK, and (E) representative H&E-stained liver images (scale bars, 50 µm) for experiments shown in (A). (F) Schematic of APAP-injected mice with hepatocyte-specific expression of HyperIl6 or DMSO/X209/iSTAT3 administration. Three weeks following AAV8-Alb-Null or AAV8-Alb-HyperIl6 virus injection, mice were injected with APAP (400 mg/kg). DMSO (0.2 ml/kg), X209 (20 mg/kg), or iSTAT3 (10 mg/kg) were administered at the beginning of fasting period, 16 hr prior to APAP injection; control mice received saline injection; mice were harvested 48 hr post-saline or APAP injection. (G) Serum ALT levels, (H) hepatic GSH levels, and (I) western blots showing hepatic levels of phospho-ERK, ERK, phospho-STAT3, STAT3, phospho-JNK, JNK, PCNA, Cyclin D1, and GAPDH as internal control, (J) representative H&E-stained liver images (scale bars, 50 µm), (K) immunohistochemistry staining of Ki67 in the livers of mice (scale bars, 50 µm) for experiments shown in (F). (L) Schematic of rmIL11-injected mice with hepatocyte-specific expression of HyperIl6 ± iSTAT3 administration. Mice were injected with rmIL11 (500 µg/kg), 3 weeks following AAV8-Alb-Null or AAV8-Alb-HyperIl6 virus injection; iSTAT3 (10 mg/kg) was administered at the beginning of fasting period, 16 hr prior to rmIL11 injection; control mice received saline injection; mice were harvested 6 hr post-saline or IL11 injection. (M) Serum ALT levels and (N) western blots showing hepatic ERK, STAT3, and JNK activation status for experiments shown in (L). (B–C, G–H, M) N = 5 mice/group; data are shown as box-and-whisker with median (middle line), 25th–75th percentiles (box), and min–max values (whiskers), one-way ANOVA with Tukey’s correction.
-
Figure 3—source data 1
Raw data, western blot quantification, necrotic area (%) of H&E-stained liver images, and positive cell counts of Ki67-stained liver images for panels B–E, G–K, M, N.
- https://cdn.elifesciences.org/articles/68843/elife-68843-fig3-data1-v2.xlsx
-
Figure 3—source data 2
Western blot images (original and annotated) for panels D, I, N.
- https://cdn.elifesciences.org/articles/68843/elife-68843-fig3-data2-v2.zip
Figure 3—figure supplement 1
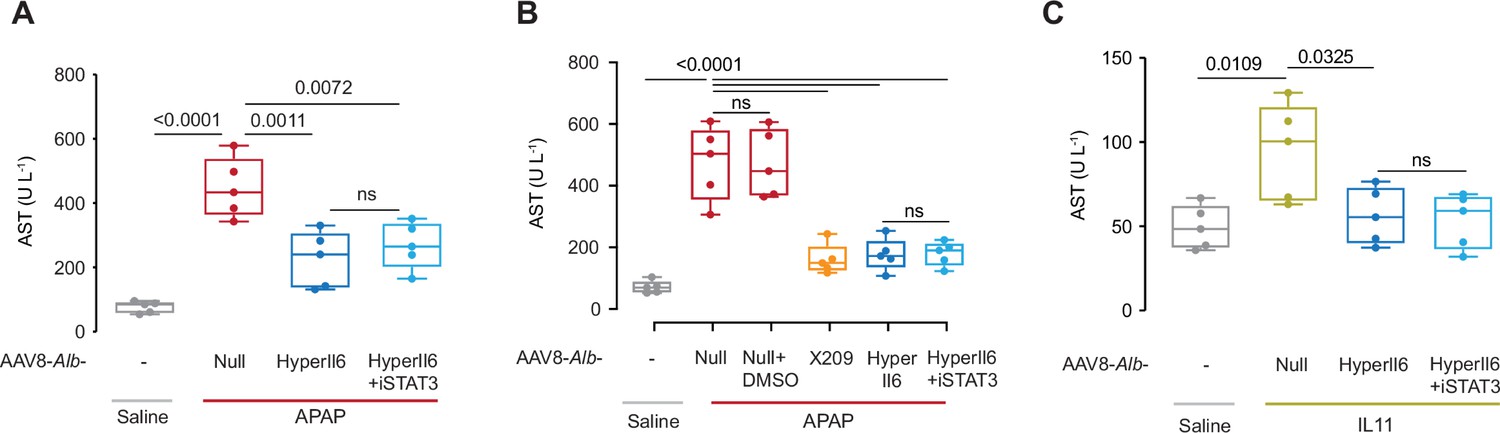
Hepatocyte-specific HyperIl6 expression reduces APAP- or IL11-induced liver injury independent of STAT3 activation.
(A) Mice serum AST levels for experiments shown in Figure 3A. (B) Mice serum AST levels for experiments shown in Figure 3F. (C) Mice serum AST levels for experiments shown in Figure 3L. (A–C) N = 5 mice/group; data are shown as box-and-whisker with median (middle line), 25th–75th percentiles (box), and min–max values (whiskers), one-way ANOVA with Tukey’s correction.
-
Figure 3—figure supplement 1—source data 1
Raw data for panels A–C.
- https://cdn.elifesciences.org/articles/68843/elife-68843-fig3-figsupp1-data1-v2.xlsx
Figure 4 with 1 supplement
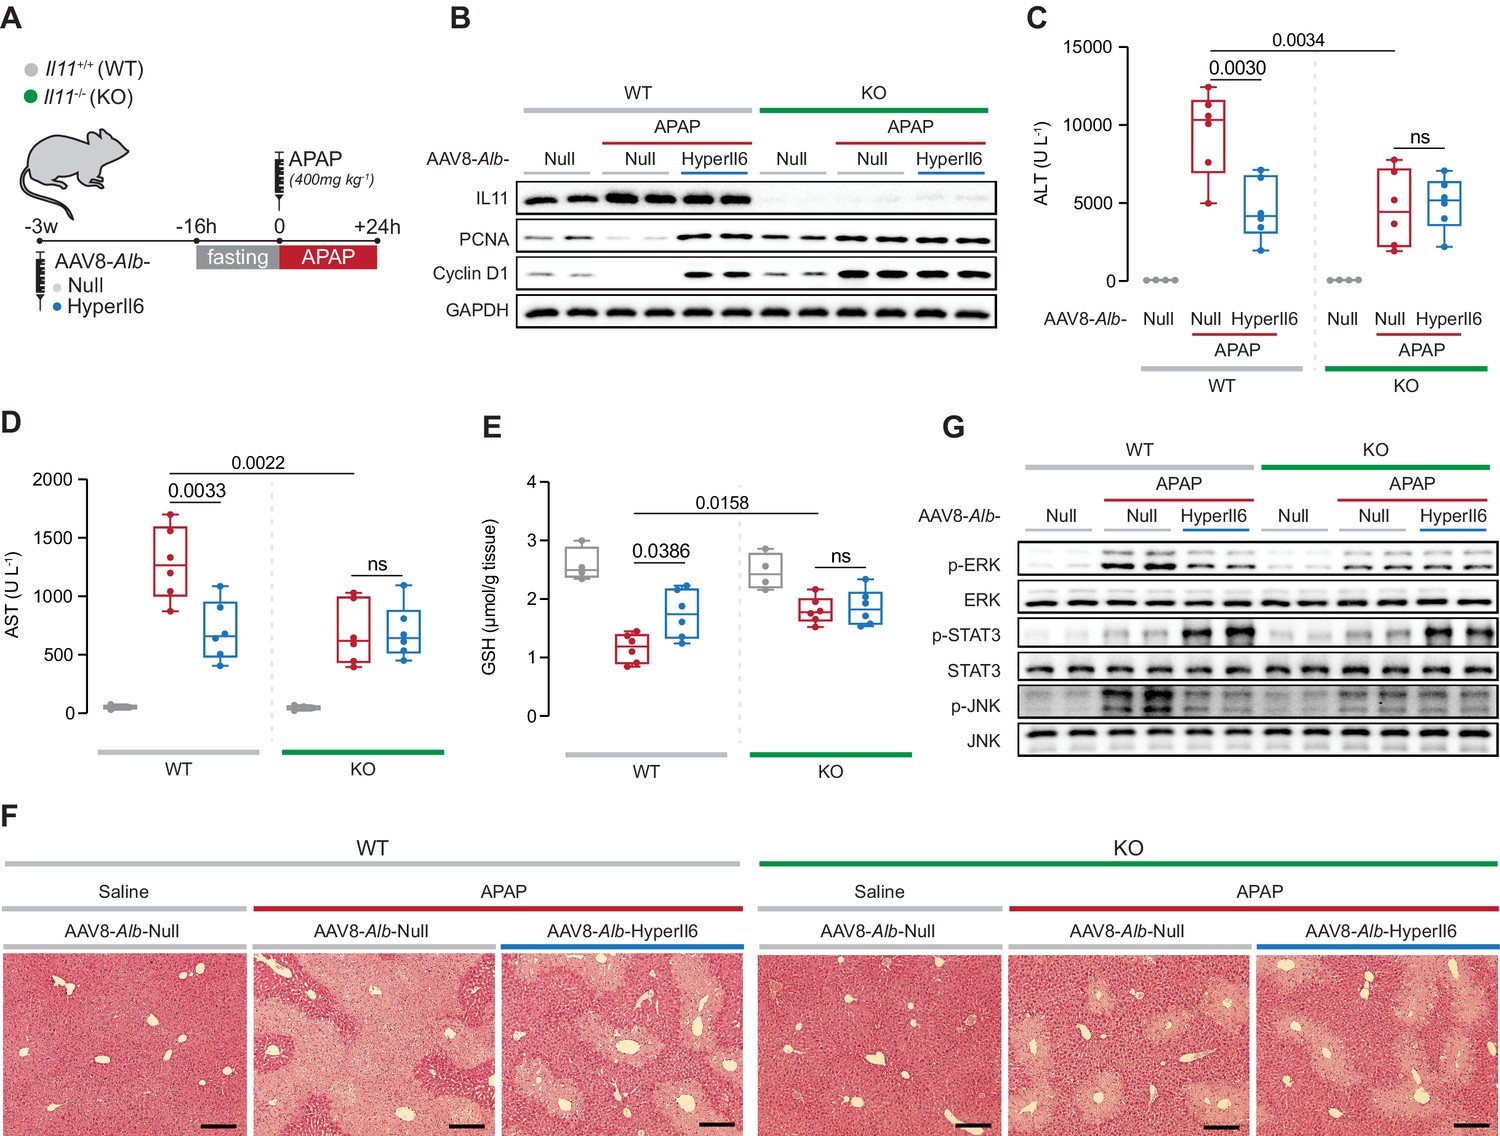
Il11−/− mice exhibit spontaneous liver regeneration following APAP injury and HyperIL6 has no beneficial effect in this strain.
(A) Schematic of APAP injury in Il11−/− and Il11+/+ mice (control) with hepatocyte-specific expression of HyperIl6. Three weeks following AAV8-Alb-Null or AAV8-Alb-HyperIl6 virus injection, overnight-fasted Il11+/+ and Il11−/− mice were injected with saline or APAP (400 mg/kg); mice were harvested 24 hr post-saline or APAP injection. (B) Western blots showing hepatic levels of IL11, PCNA, Cyclin D1, and GAPDH as internal control. (C) Serum ALT levels. (D) Serum AST levels. (E) Hepatic GSH levels. (F) Representative H&E-stained liver images (scale bars, 50 µm). (G) Western blots showing hepatic phospho-ERK, ERK, phospho-STAT3, STAT3, phospho-JNK, and JNK. (C–E) Saline (n = 4 mice/group), APAP (n = 6 mice/group); data are shown as box-and-whisker with median (middle line), 25th–75th percentiles (box), and min–max values (whiskers), two-way ANOVA with Sidak’s correction.
-
Figure 4—source data 1
Raw data, western blot quantification, and necrotic area (%) of H&E-stained liver images for panels B–F.
- https://cdn.elifesciences.org/articles/68843/elife-68843-fig4-data1-v2.xlsx
-
Figure 4—source data 2
Western blot images (original and annotated) for panels B and G.
- https://cdn.elifesciences.org/articles/68843/elife-68843-fig4-data2-v2.zip
Figure 4—figure supplement 1
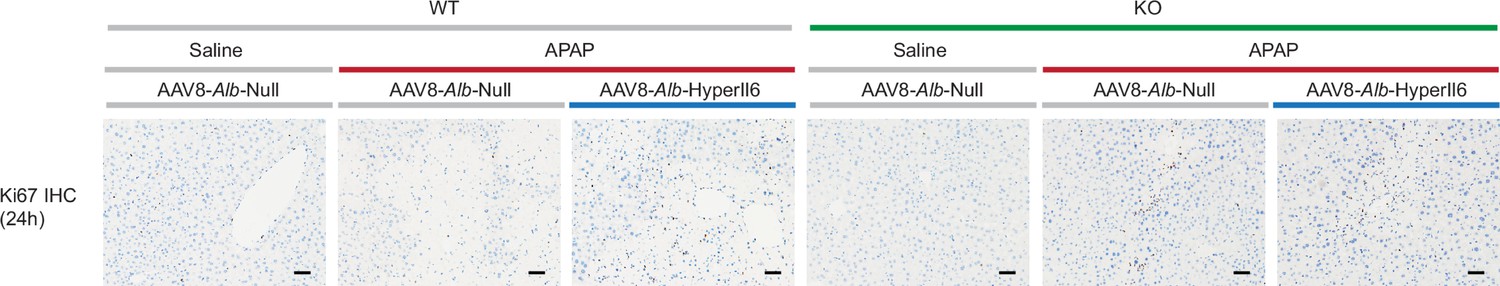
Hepatocyte-specific HyperIl6 expression has no effect on hepatocyte regeneration in Il11−/− mice.
Immunohistochemistry staining of Ki67 in the livers of wild-type (WT) or Il11−/− mice (KO) for experiments shown in Figure 4A (scale bars, 50 µm).
-
Figure 4—figure supplement 1—source data 1
Positive cell counts of Ki67-stained liver images.
- https://cdn.elifesciences.org/articles/68843/elife-68843-fig4-figsupp1-data1-v2.xlsx
Author response image 1
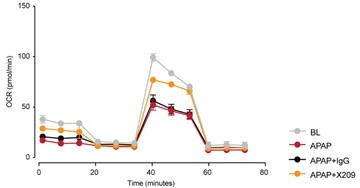
Seahorse assay showing mitochondrial oxygen consumption rate (OCR) in primary human hepatocytes exposed to APAP (24 h) as compared to baseline (BL) control cells (N=5/group).
IgG, isotype antibody control; X209, anti-Il11RA antibody.
Author response image 2

Serum ALT and AST levels in APAP-injected mice treated with or without DMSO.
DMSO (0.2ml/kg) was administered 16 h prior to APAP injection; control mice received saline injection; mice were harvested 24 h post injection. N=5 mice/group. Data are shown as box-and-whisker with median (middle line), 25th–75th percentiles (box) and min-max values (whiskers), one-way ANOVA with Tukey’s correction.
Tables
Key resources table
| Reagent type (species) or resource | Designation | Source or reference | Identifiers | Additional information |
|---|---|---|---|---|
| Strain, strain background (mouse) | Il11-/- mice C57BL/6 J | PMID:34239012 | Crispr/Cas9 technique was used to knock out the Il11 gene. | |
| Cell line (Homo sapiens) | Hepatocytes | ScienCell | Cat# 5,200 | Primary cell line |
| Antibody | Phospho-AKT (Rabbit monoclonal) | CST | Cat# 4060; RRID:AB_2315049 | WB (1:1000) |
| Antibody | AKT (Rabbit monoclonal) | CST | Cat# 4691; RRID:AB_915783 | WB (1:1000) |
| Antibody | Cyclin D1 (Rabbit monoclonal) | CST | Cat# 55506; RRID:AB_2827374 | WB (1:1000) |
| Antibody | phospho-ERK1/2 (Rabbit monoclonal) | CST | Cat# 4370; RRID: AB_2315112 | WB (1:1000) |
| Antibody | ERK1/2 (Rabbit monoclonal) | CST | Cat# 4695; RRID: AB_390779 | WB (1:1000) |
| Antibody | GAPDH (Rabbit monoclonal) | CST | Cat# 2118; RRID: AB_561053 | WB (1:1000) |
| Antibody | IgG (11E10; mouse IgM isotype control) | PMID:31078624; Aldevron | In vivo neutralizing experiment (20 mg/kg) | |
| Antibody | IL6 (Goat polyclonal) | R&D systems | Cat# AF506; RRID:AB_355398 | WB (1 μg/ml) |
| Antibody | IL6ST (extracellular; Rabbit polyclonal) | Thermo Fisher | Cat# PA5-77476; RRID:AB_2735869 | WB (1:1000) |
| Antibody | IL6ST (Mouse monoclonal) | R&D systems | Cat# MAB628; RRID:AB_2125962 | In vitro neutralizing experiment (2 μg/ml) |
| Antibody | IL11 (X203; mouse monoclonal) | PMID:31078624; Aldevron | WB (1 μg/ml) | |
| Antibody | IL11RA (X209; mouse monoclonal) | PMID:31078624; Aldevron | In vivo neutralizing experiment (20 mg/kg) | |
| Antibody | p-JNK (Rabbit monoclonal) | CST | Cat# 4668; RRID:AB_823588 | WB (1:1000) |
| Antibody | JNK (Rabbit polyclonal) | CST | Cat# 9252; RRID:AB_2250373 | WB (1:1000) |
| Antibody | Ki67 (Rabbit monoclonal) | Abcam | Cat# ab16667; RRID:AB_302459 | IHC (1:200) |
| Antibody | NOX4 (Rabbit monoclonal) | Thermo Fisher | Cat# MA5-32090; RRID: AB_2809383 | WB (1:1000) |
| Antibody | PCNA (Rabbit monoclonal) | CST | Cat# 13110; RRID:AB_2636979 | WB (1:1000) |
| Antibody | phospho-STAT3 (Mouse monoclonal) | CST | Cat# 4113; RRID: AB_2198588 | WB (1:1000) |
| Antibody | STAT3 (Rabbit monoclonal) | CST | Cat# 4904; RRID: AB_331269 | WB (1:1000) |
| Antibody | anti-mouse HRP (Horse polyclonal) | CST | Cat# 7076; RRID:AB_330924 | WB (1:2000) |
| Antibody | anti-rabbit HRP (Goat polyclonal) | CST | Cat# 7074; RRID:AB_2099233 | WB (1:2000);IHC (1:200) |
| Antibody | anti-rat HRP (Goat polyclonal) | Abcam | Cat# ab97057; RRID:AB_10680316 | WB (1:2000) |
| Recombinant DNA reagent | AAV8-Alb-HyperIl6 | This paper; Vector Biolabs | AAV8 vector expressing mouse HyperIL6. See Materials and methods, AAV8 vectors. | |
| Recombinant DNA reagent | AAV8-Alb-sIl6st | PMID:33397952; Vector Biolabs | AAV8 vector expressing mouse sIL6ST. | |
| Peptide, recombinant protein | rhIL11 | PMID:29160304; Genscript | Cat# Z03108 | UniProtKB: P20809 |
| Peptide, recombinant protein | rmIL11 | PMID:29160304; Genscript | Cat# Z03052 | UniProtKB: P47873 |
| Peptide, recombinant protein | rh-HyperIL6 | R&D systems | Cat# 8954 SR | Human IL6R:IL6 fusion protein |
| Peptide, recombinant protein | rm-HyperIL6 | R&D systems | Cat# 9038 SR | Mouse IL6R:IL6 fusion protein |
| Peptide, recombinant protein | soluble IL6ST Fc | R&D systems | Cat# 671-GP-100 | |
| Commercial assay or kit | ALT Activity Assay Kit | Abcam | Cat# ab105134 | |
| Commercial assay or kit | AST Activity Assay Kit | Abcam | Cat# ab105135 | |
| Commercial assay or kit | Glutathione Colorimetric Detection Kit | Thermo Fisher | Cat# EIAGSHC | |
| Chemical compound, drug | APAP | Sigma | Cat# A3035 | |
| Chemical compound, drug | DMSO | Sigma | Cat# D2650 | |
| Chemical compound, drug | iSTAT3 (S3I-201) | Sigma | Cat# SML0330 | |
| Software, algorithm | GraphPad Prism | GraphPad Prism | RRID:SCR_002798 | Version 6.07 |
| Software, algorithm | ImageJ | ImageJ | RRID:SCR_003070 | |
| Other | Hoechst 33,342 | Thermo Fisher | Cat# 62,249 | Operetta high-throughput phenotyping assay |
| Other | DRAQ7 | Thermo Fisher | Cat# D15106 | Operetta high-throughput phenotyping assay |
| Other | DCFDA | Abcam | Cat# ab113851 | ROS stain |
| Other | BOND Polymer Refine Detection Kit | Leica | Cat# DS9800; RRID:AB_2891238 | IHC stain |
Additional files
Download links
A two-part list of links to download the article, or parts of the article, in various formats.
Downloads (link to download the article as PDF)
Open citations (links to open the citations from this article in various online reference manager services)
Cite this article (links to download the citations from this article in formats compatible with various reference manager tools)
The pro-regenerative effects of hyperIL6 in drug-induced liver injury are unexpectedly due to competitive inhibition of IL11 signaling
eLife 10:e68843.
https://doi.org/10.7554/eLife.68843


