A projectome of the bumblebee central complex
- Lund University, Lund Vision Group, Department of Biology, Sweden
- Macquarie University, Department of Biological Sciences, Australia
- Queensland Brain Institute, University of Queensland, Sweden
- Lund University, NanoLund, Sweden
Figures
Figure 1
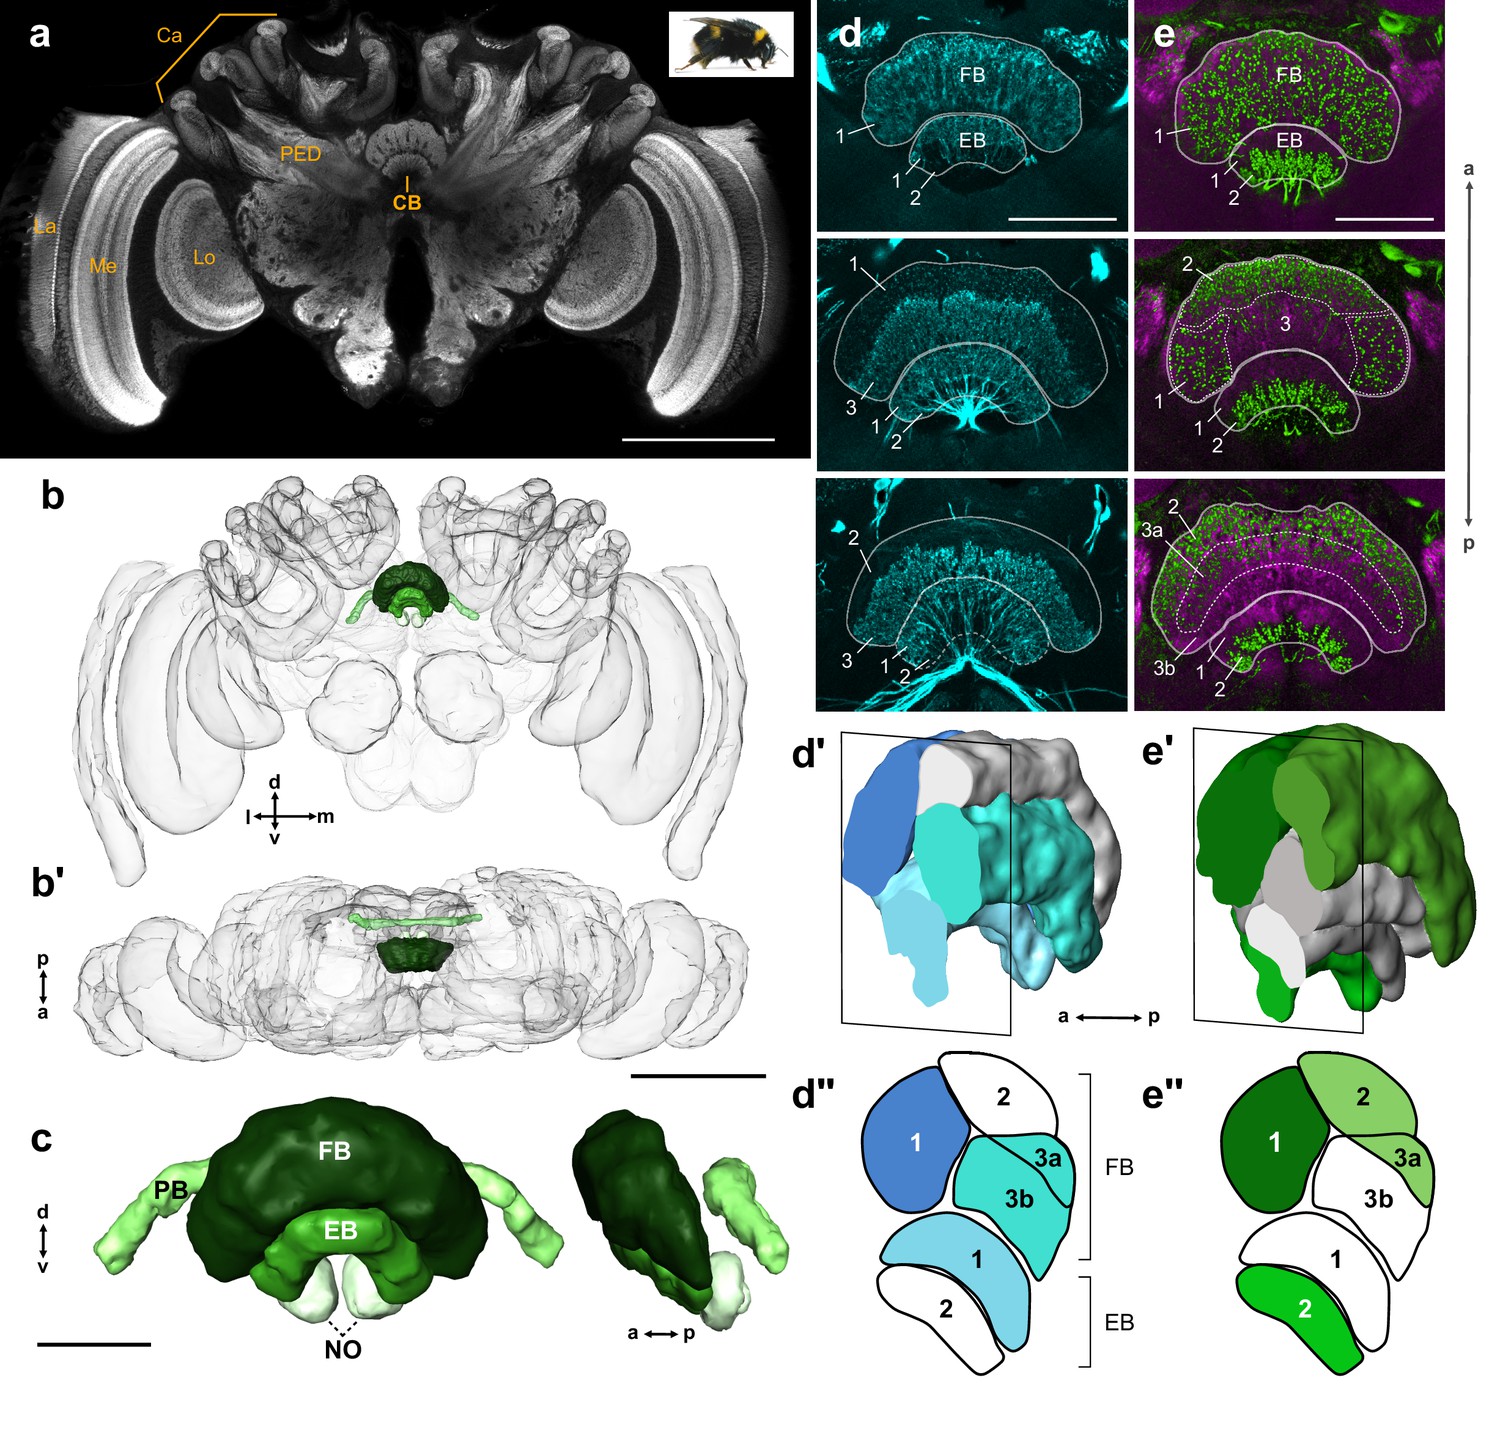
General structure of the bumblebee central complex.
(a) Synapsin immunolabeling of a bumblebee brain. (b–b’) 3D reconstruction of entire bee brain with CX in shades of green, oriented frontally (b) and horizontally (b’). (c) Frontal and lateral views of a segmented bumblebee CX. (d) Whole brain TH immunolabeling in the CB from anterior (top image) to posterior (bottom image). Numbered layers correspond to (d’’). (d’) Reconstruction of TH immunoreactive layers (blue) registered to the CX from 126 nm data set (see Materials and methods). Due to the lack of synapsin co-labeling in TH immunolabeled brains, the lower border of the EB was not identifiable and layer 1 was therefore not reconstructed. (d’’) Schematic of (d’). (e–e’’) Same as (d–d’’), but for serotonin (green) and synapsin (magenta) immunolabeling. La, lamina; Me, medulla; Lo, lobula; Ca, calyx; PED, pedunculus; CB, central body. Scale bars: (a–b’) 500 µm, (c–e) 100 µm.
Figure 2
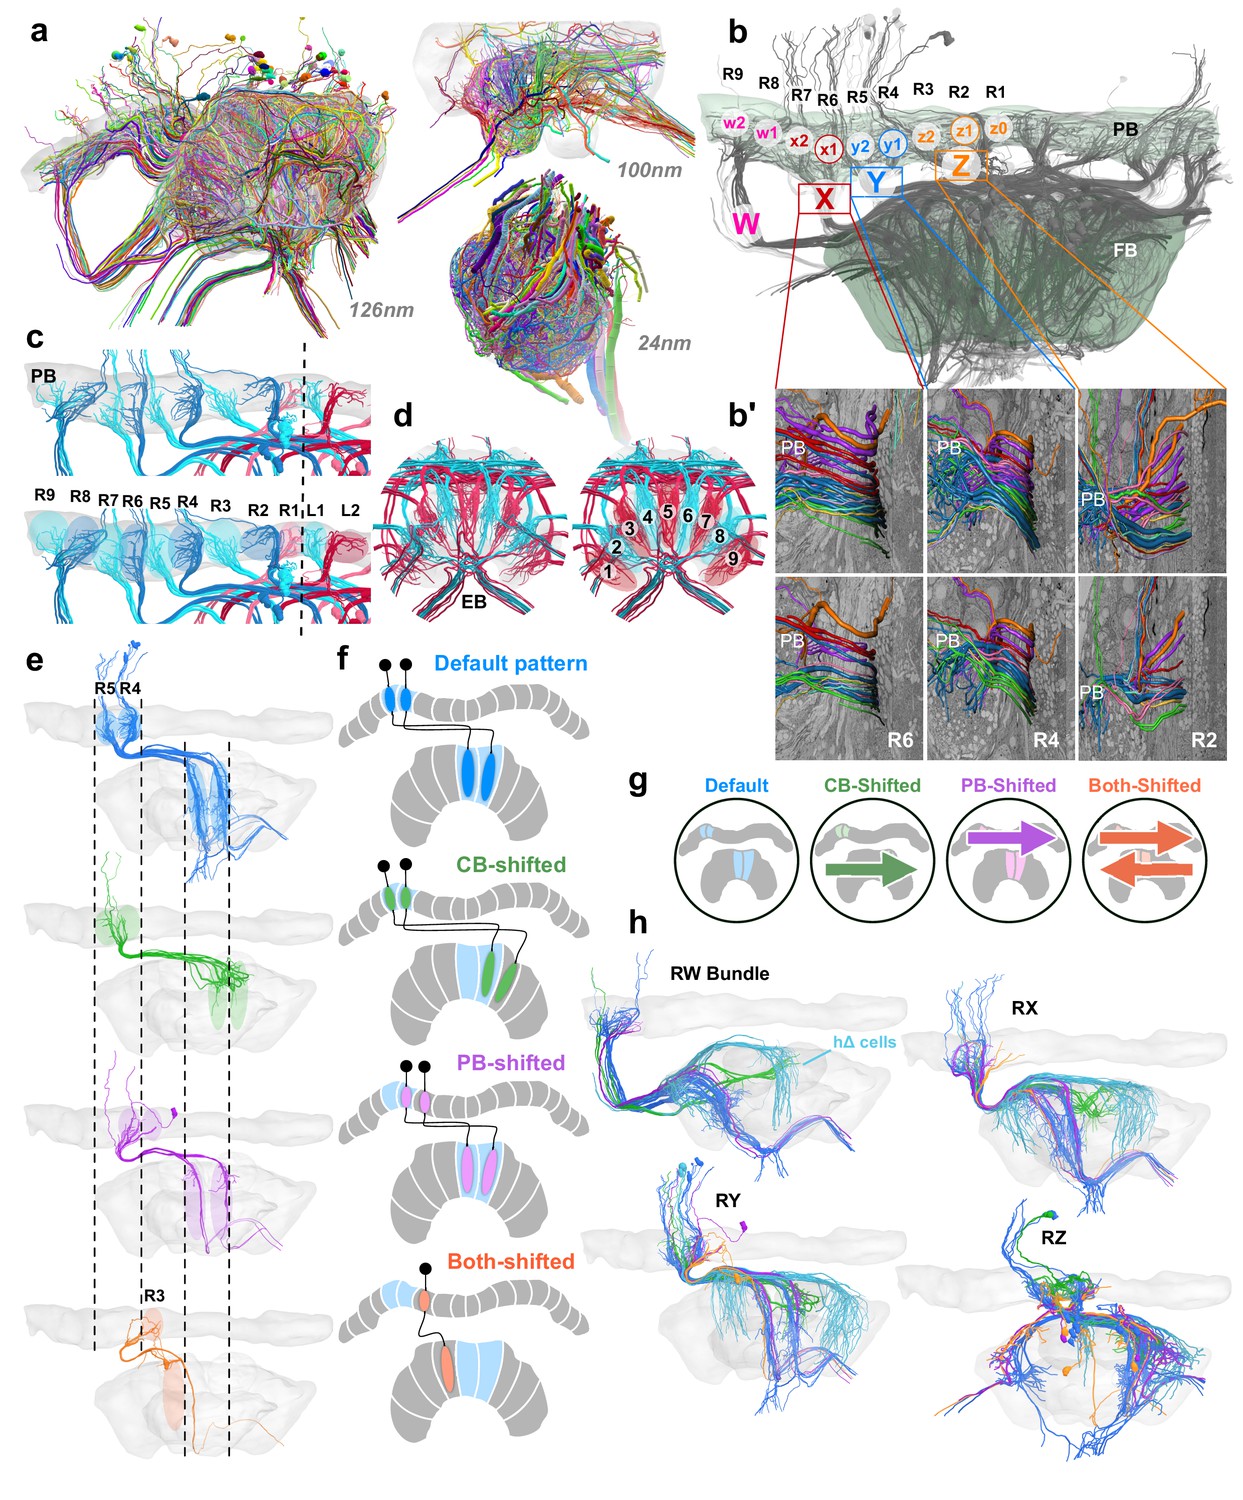
Columnar cell projection patterns in the bumblebee CX.
(a) Views of the three SBEM data sets used in this study. (b) Horizontal view of 126 nm data set showing W, X, Y, Z bundles and their associated columns in the PB. (b’) Columnar cells are ordered from dorsal to ventral by projection type within bundle. (c–d) Nine structural columns in the bee CX; snapshots of EPG/PEG arborization domains in the PB (c) and EB (d). (e) Horizontal view of the four columnar projection patterns that characterize all CX columnar neurons in the bee. (f) Schematics of the four projection patterns. Names of each projection pattern is given by the arborization of the cell relative to the bundle it projects from (see also Figure 13). (g) Icons for each of these patterns that are paired with cell types in the remaining figures to aid with identification. (h) Horizontal view of columnar and hΔ cells (light blue) projecting from each bundle in the right CX hemisphere.
Figure 3 with 1 supplement
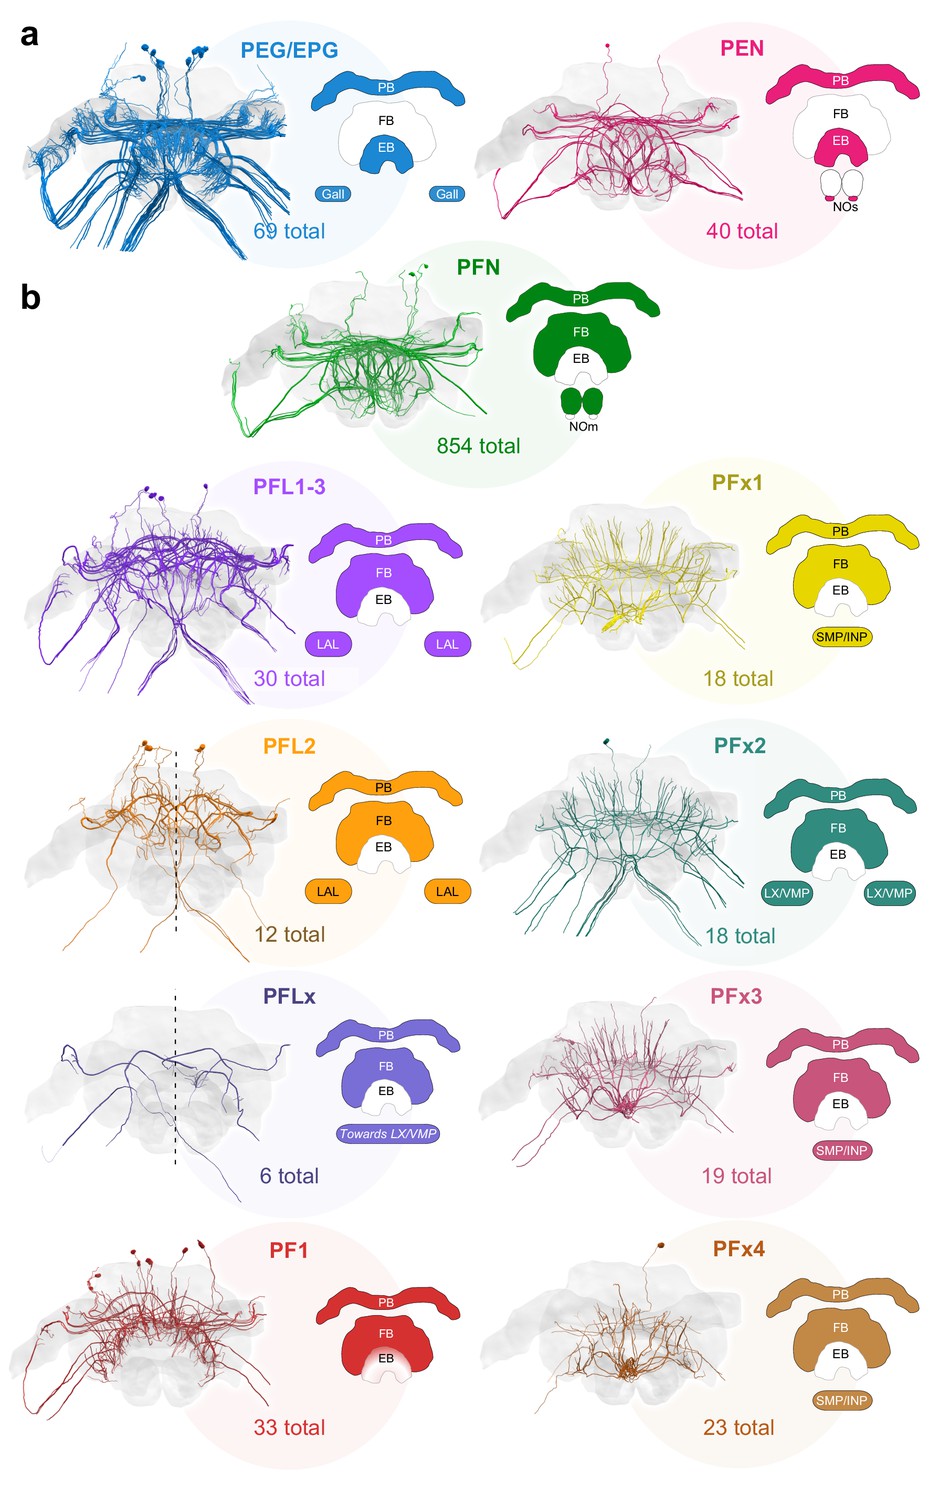
Major identified columnar cell types of the bumblebee CX.
(a–b) Frontal views of each cell type. Colored regions in CX schematics indicate neuropil arborization domains for each cell type. The number underneath each cell type represents the total number of traceable cells for each cell type. Cell number totals are based on tracing data from the 126 nm data set with the exception of PFN and PEN cells, the numbers of which were derived from the 24 nm data set (see Figure 3—figure supplement 1). (a) Columnar cells that innervate the EB. (b) Columnar cells that innervate the FB. Due to resolution and field of view limits of our data sets, the PFN total is likely an underestimate. Numbers for PFx4 neurons are likely an underestimate as well, as the main axon diameter of this cell type was close to the resolution limit of our image data. Note also that confidence for correct identification of smaller cells is lower in the W-bundle compared to the other bundles. See Table 1 for corresponding neuron names previously used in other insects. PB, protocerebral bridge; FB, fan-shaped body; EB, ellipsoid body; NO, noduli; LX, lateral complex; LAL, lateral accessory lobe; INP, inferior protocerebrum; SMP, superior medial protocerebrum; VMP, ventromedial protocerebrum.
Figure 3—figure supplement 1
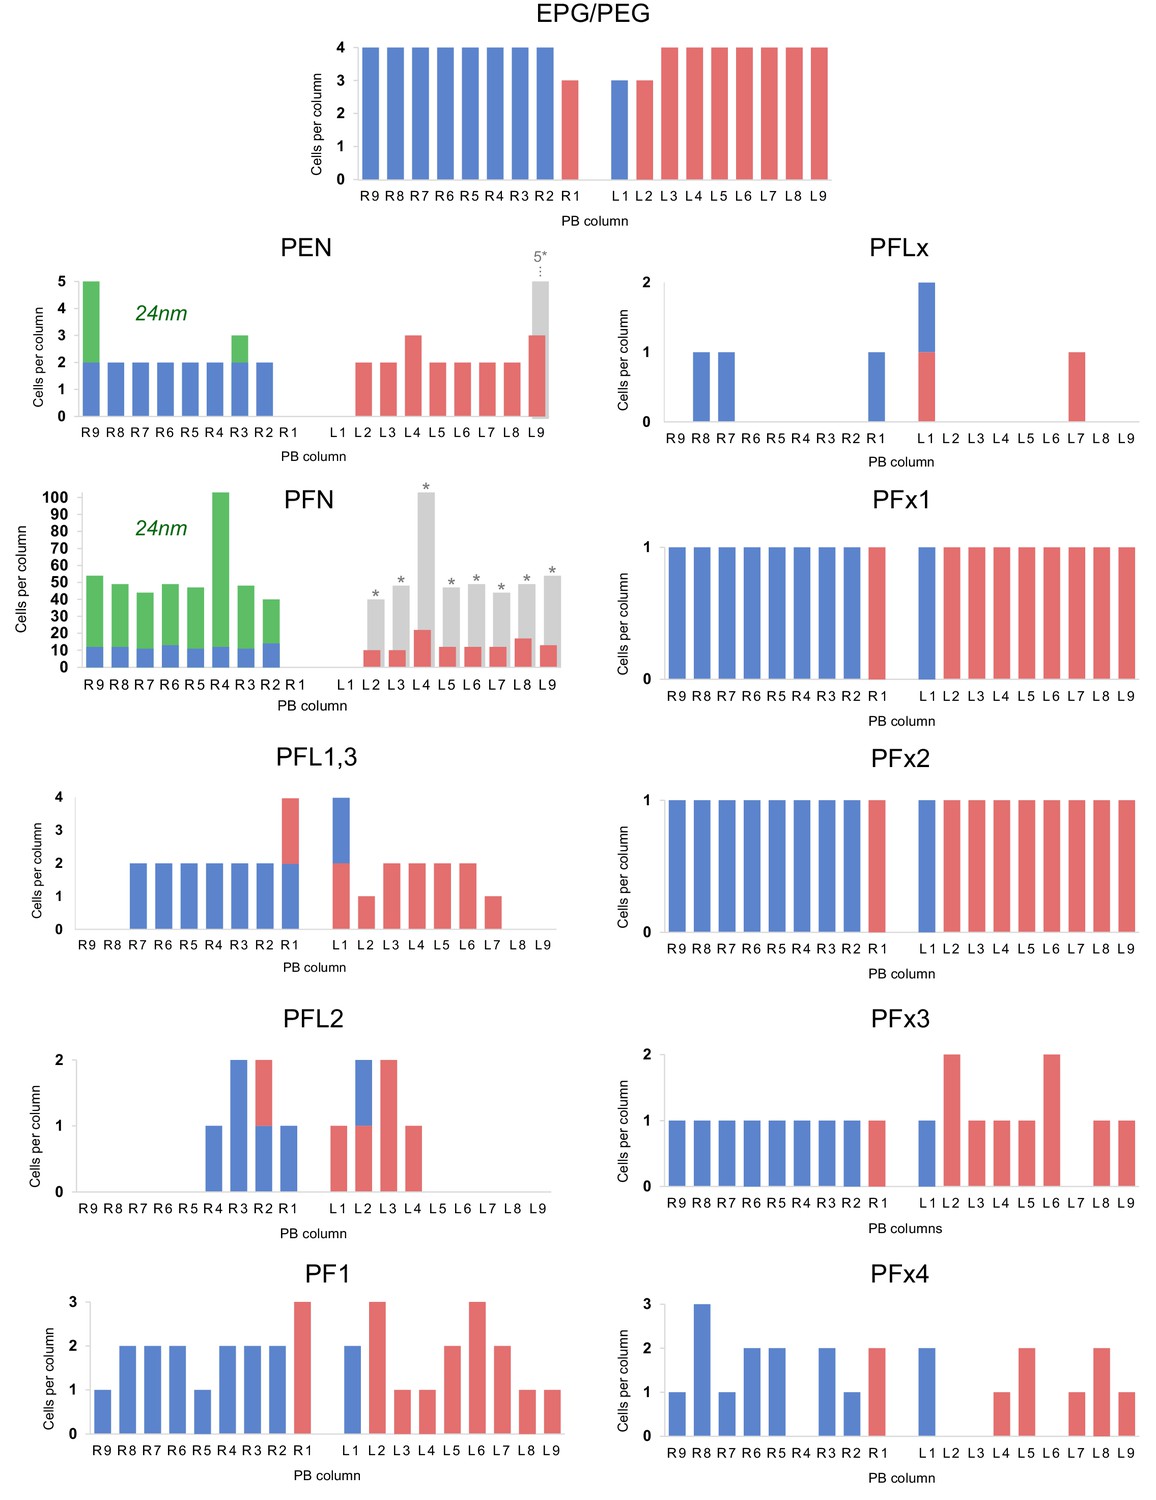
Distribution of columnar cell types per PB column.
Distribution of of columnar cell types per PB column. Quantities of each cell type in blue (right hemisphere) and red (left hemisphere) are taken from cells traced in the 126 nm data set. PFN and PEN cell charts include quantities from both the 126 nm data set and the 24 nm data set (green). Hemisphere identity for each neuron is defined by the location of its soma. Rough estimations of true cell quantities (gray bars; asterisks) are based on reconstructions from all data sets and assume hemispheric symmetry. Cells with small diameter fibers (notably PFNs) and cells that innervated the outermost PB columns were more difficult to reconstruct due to limitations with the data set (for instance, unfocused regions along image edges likely caused by lens distortion during imaging).
Figure 4 with 1 supplement
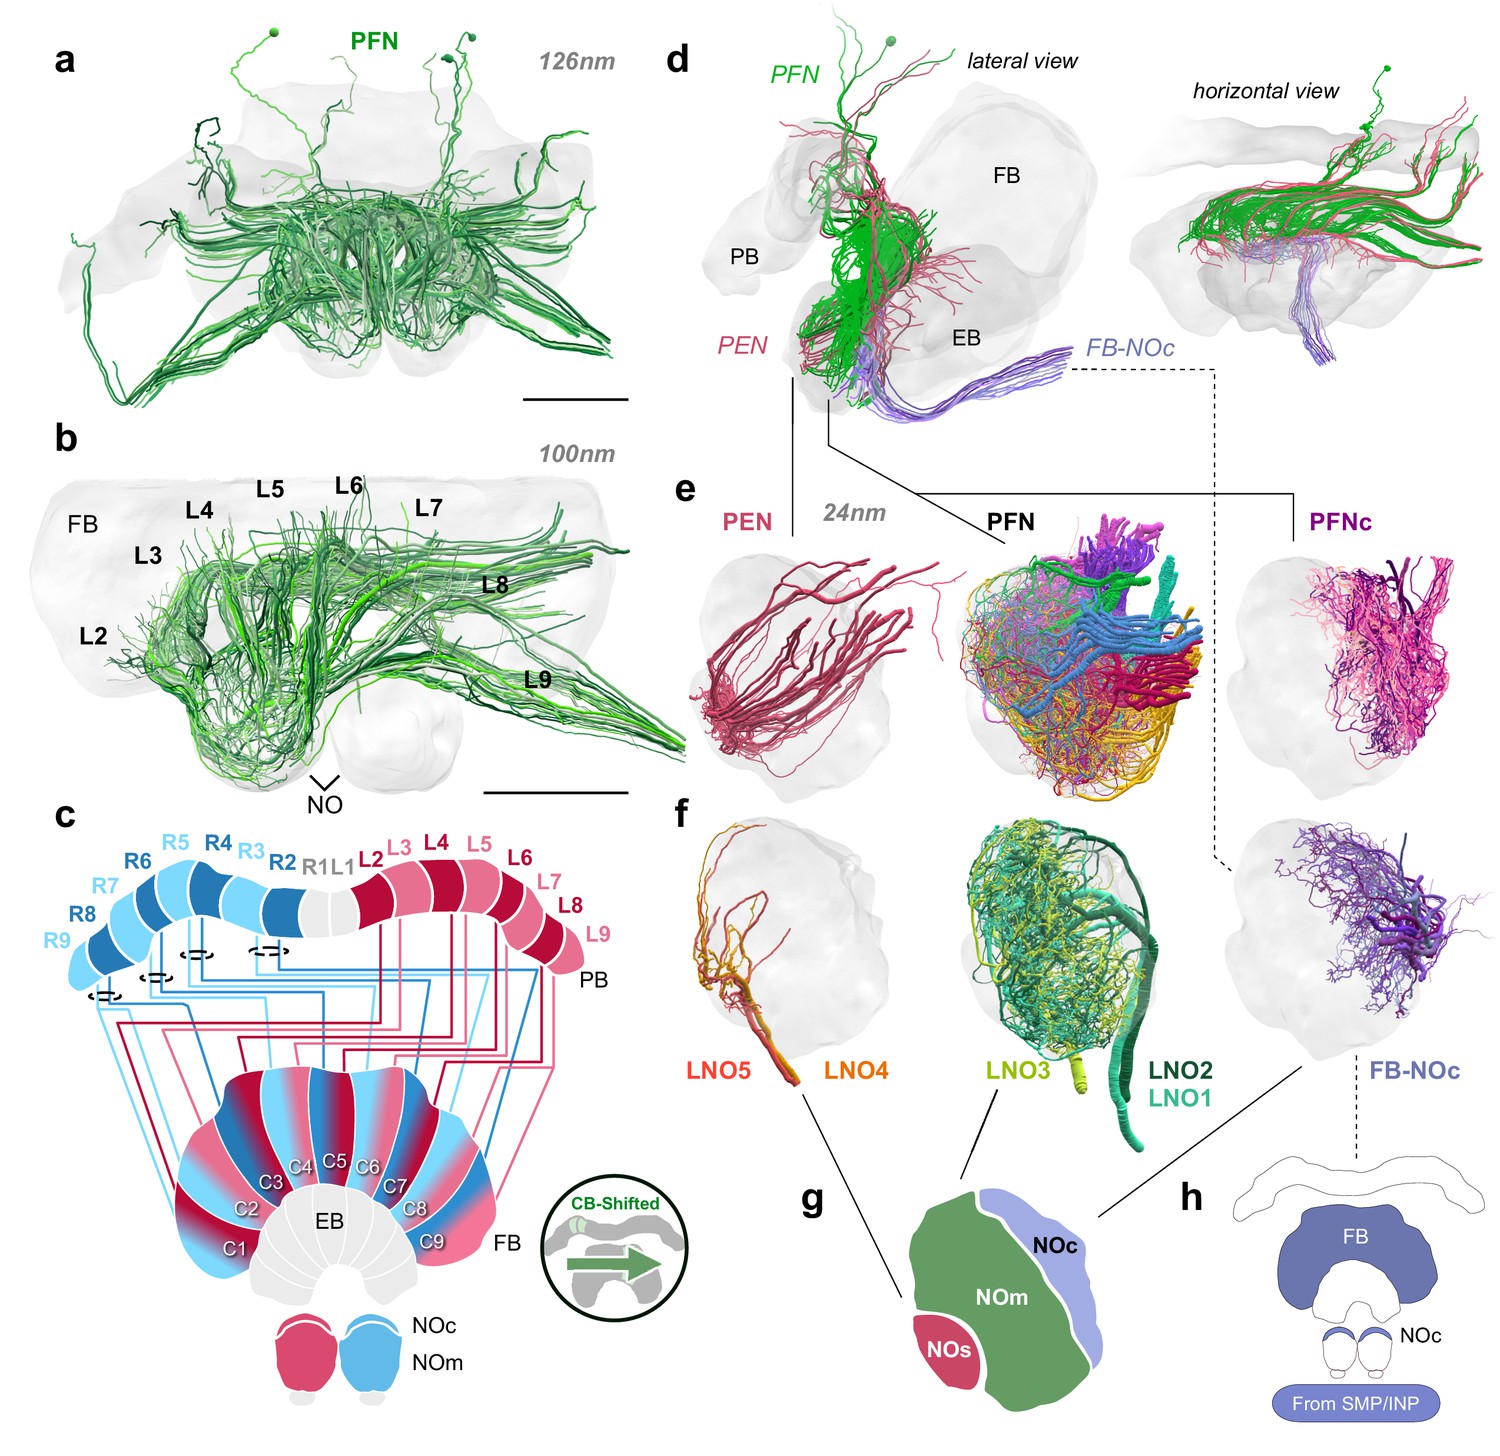
Structure and cellular composition of the NO.
(a) Frontal view of PFN cells from the 126 nm data set. (b) Frontal view of PFN cells in 100 nm data set projecting from PB columns L2-L9. (c) Schematic of PFN cell projection patterns. PFNs are shifted contralaterally by one column in the FB. (d) Lateral and horizontal views of PFN (green), PEN (pastel red), and FB-NOc (purple) cells. (e–f) Reconstructions from 24 nm data set. (e) Lateral view of PEN, PFN, and PFNc innervations in the NO, each group occupying a discrete zone. (f) NO tangential cells (LNO1-5) and FB tangential cell (FB-NOc) fibers reveal at least three structural compartments schematized in (g). To avoid confusion with the fruit fly NO zones, which are named by anatomical position (Wolff and Rubin, 2018), we have called these the small unit (NOs), main unit (NOm), and the cap (NOc). (h) Colored regions show the arborization domains of FB-NOc cells. Scale bars: (a–b) 100 µm.
Figure 4—figure supplement 1
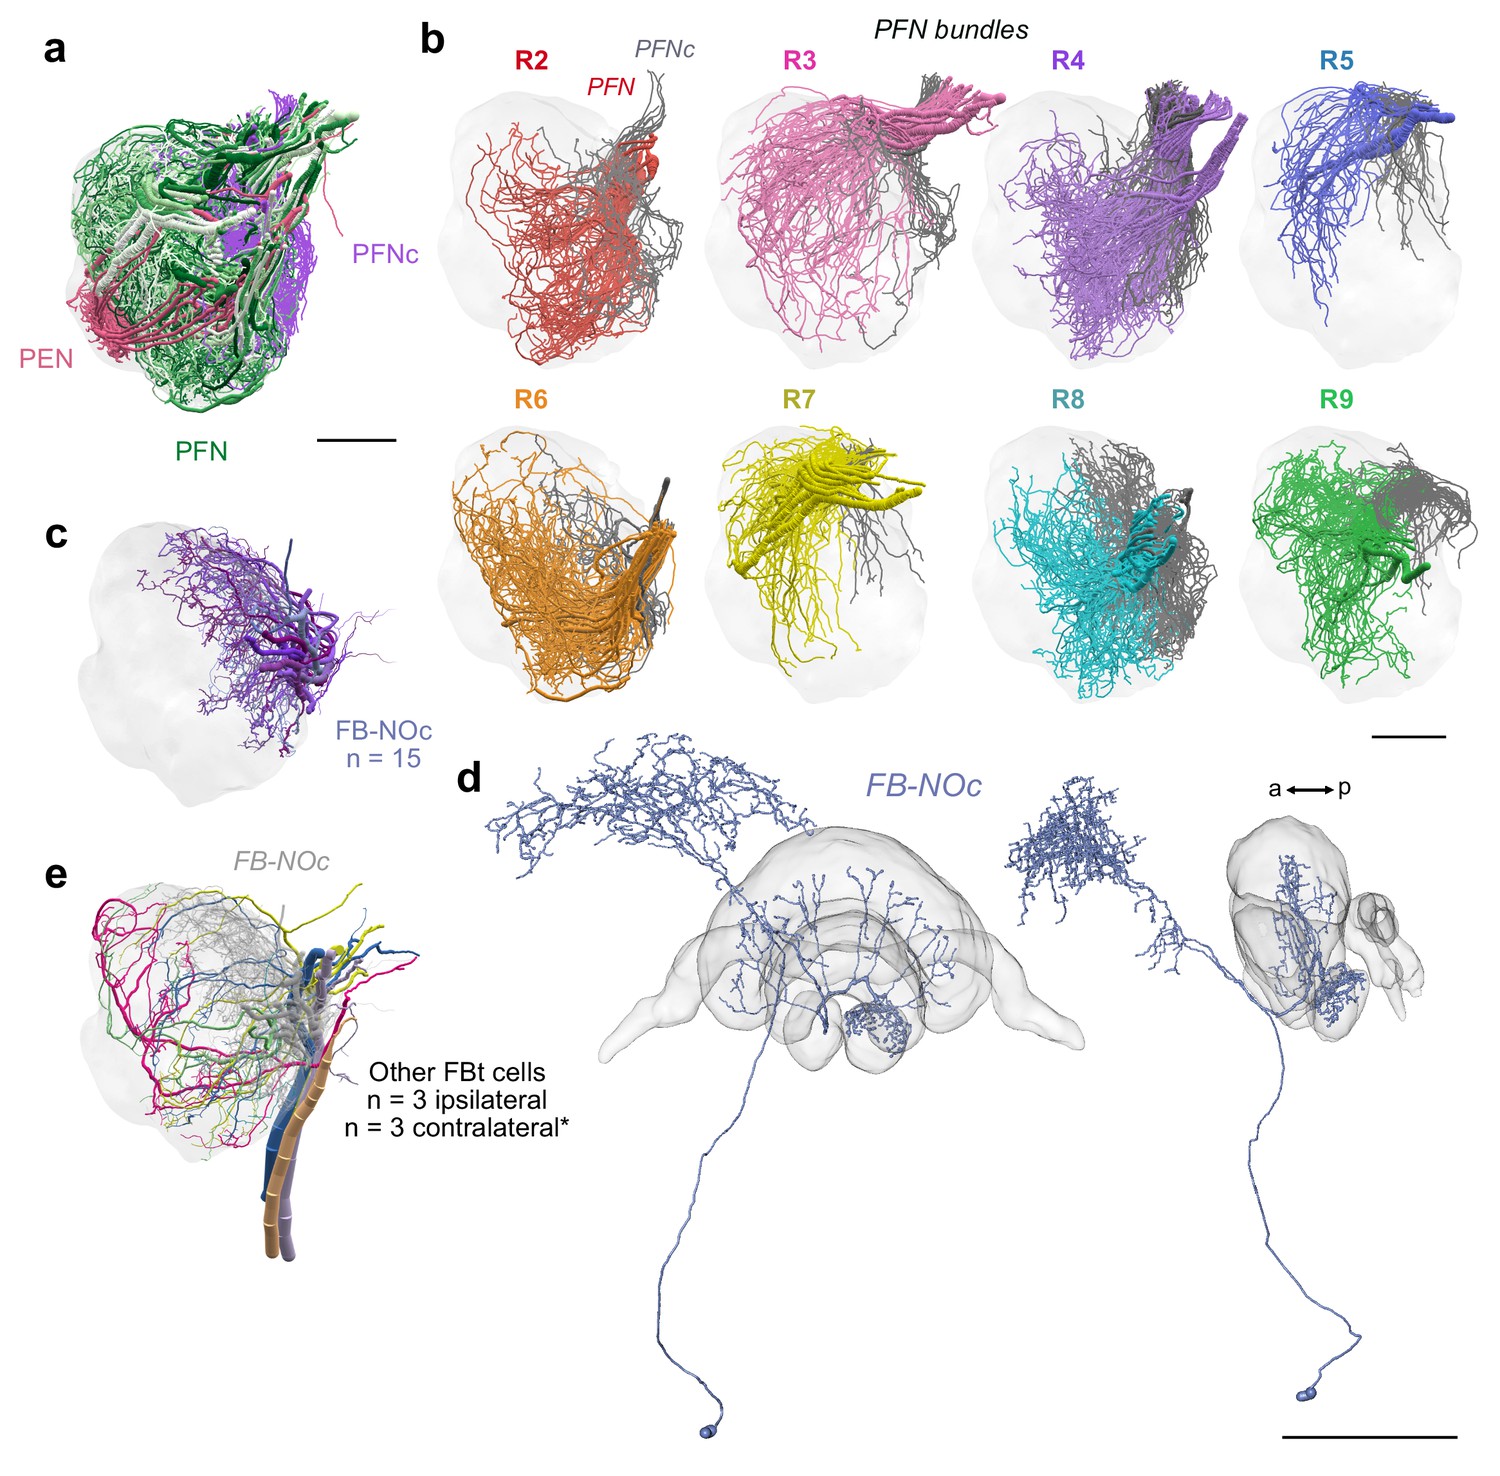
PFN bundles innervating the NO and FB-NOc cell morphology.
(a) Lateral view of PENs (pastel red), PFN (green) and PFNc (purple) branching in the NO 24 nm data set. (b) PFN bundles from PB columns R2-R9 innervating the noduli. PFNs occupying NOm (colored) and PFNc cells that occupy the NOc (grey) are shown together. Only the PFNc cells from bundle R8 were comprehensively traced. (c) Lateral view of FB-NOc cells. (d) Reconstruction of a dye injected FB-NOc neuron from the sweat bee Megalopta genalis; frontal and lateral views. Unlike fly FBt-NO cells, these FB-NOc cells only arborize in a single nodulus contralateral to their cell body and have no overlap with any LNO cell. Further, at approximately 15–20 individuals per hemisphere, this single group of cells is more numerous than all NO-innervating FB tangential cells in the fly. Given their arborizations in the NO, the FB, and the SMP/CRE and their apparent uniqueness within the bee, they might play a role in either relaying stored vectors from long term memory to the CX (see main text), or in storing path integration vector memory directly. Their wide branching pattern across the FB is reminiscent of ring neurons in the EB, which, in the fly, reorganize their outputs onto EPG head direction cells via Hebbian like plasticity and synaptic depression (Fisher et al., 2019; Kim et al., 2019). Depending on the identity of the upstream and downstream partners, synaptic weights in the fan-like array of the FB-NOc neurons could be remodeled in a columnar manner, potentially serving as substrate for storing the path integration vector as a distribution of synaptic weights across the FB columns. Given the large number of these cells, several such distributions could be stored at any moment in time. A reward reinforcement signal from dopaminergic FBt neurons (Hulse et al., 2020), for example in response to locating a food source, could trigger the transformation of a current path integration vector, for example stored in activity patterns of PFN or hΔ cells, into a synaptic weight distribution for long-term storage of the homing vector. (e) Reconstructions of other FBts. These cells differed from FB-NOc neurons and their morphology was more consistent with FB tangential neurons of the fly, as they possessed branches overlapping with LNO cells and likely send their fibers contralaterally, although this is difficult to determine with the limited field of view of our data set (asterisk). Scale bars: (a–b) 25 µm (d) 100 µm.
Figure 5
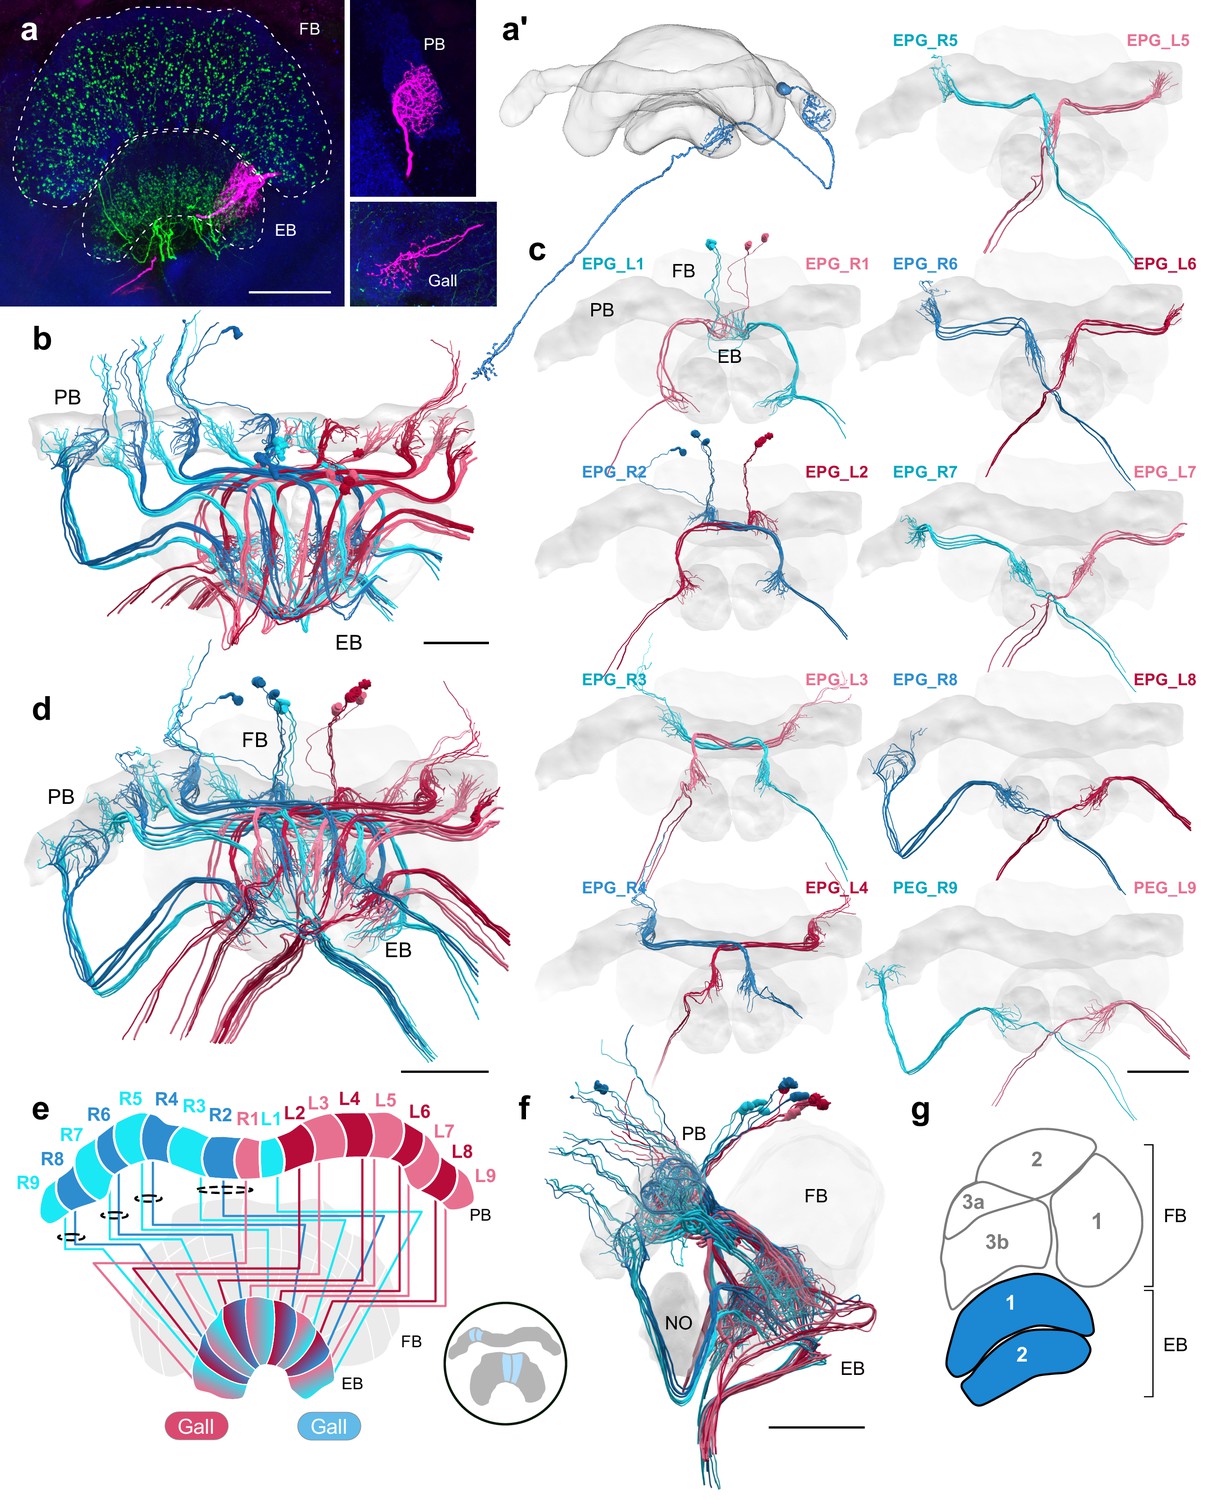
EPG/PEG cells.
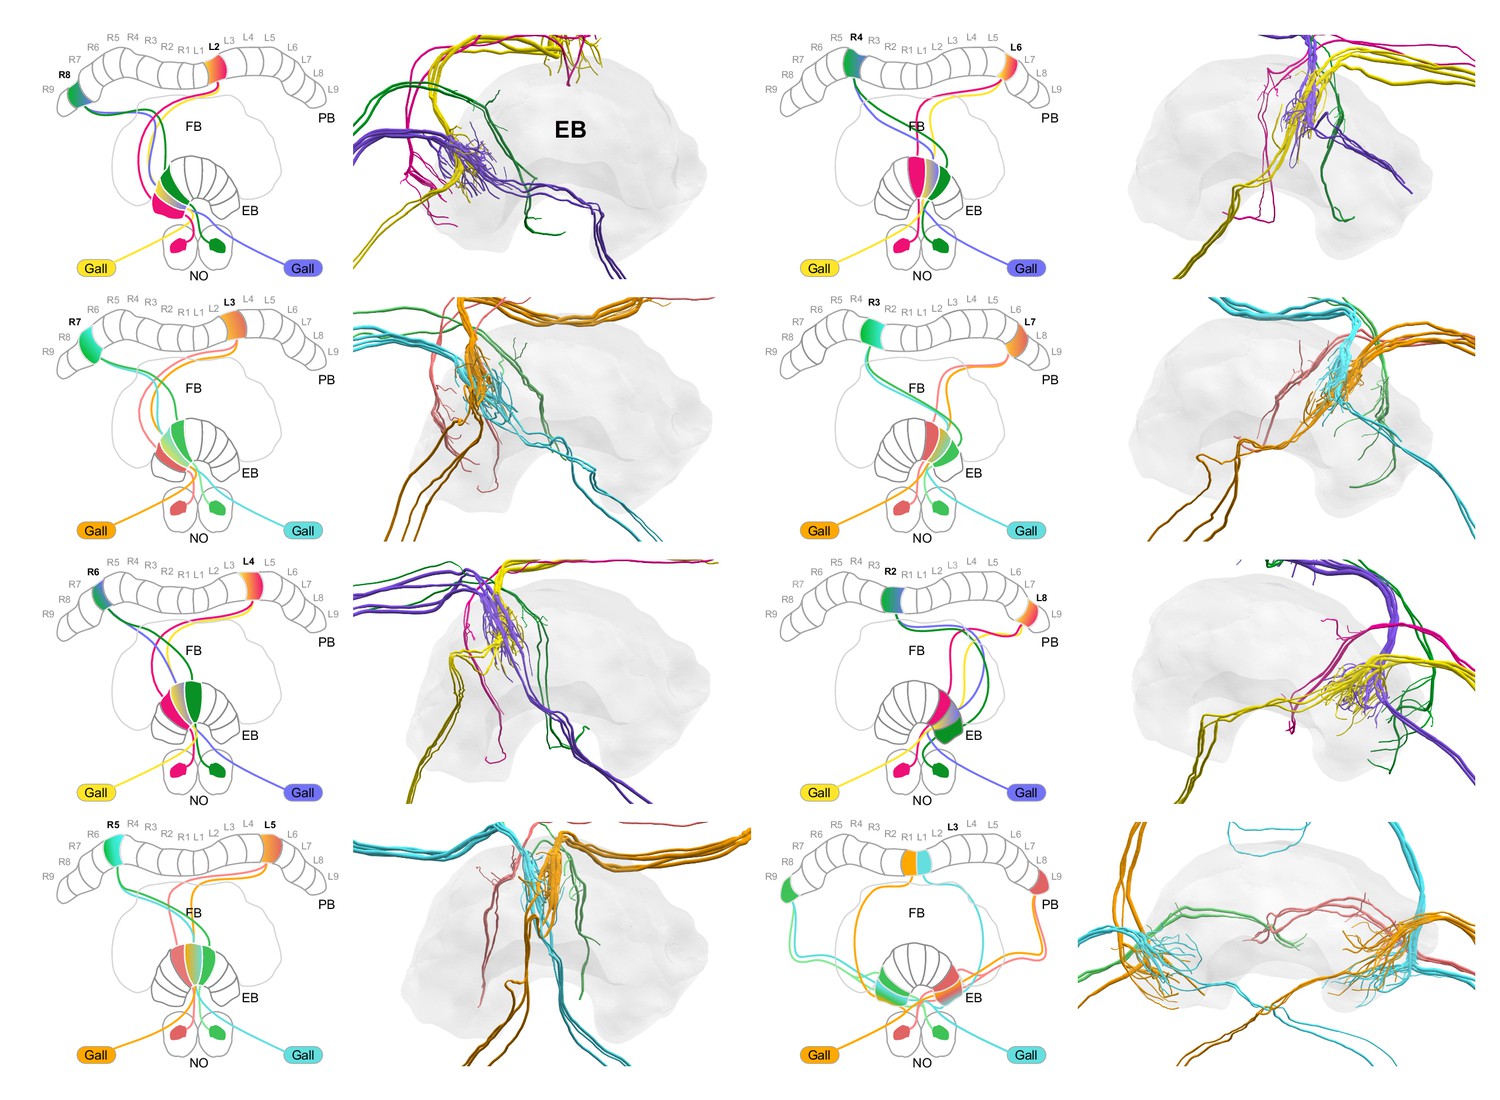
(a) Intracellular dye injection of a bumblebee EPG/PEG cell (magenta), counterstained with serotonin (green) and synapsin (blue). (a’) Reconstruction of cell in (a). (b–d,f) Neural reconstructions of EPG/PEG cells from the 126 nm data set. (b) Horizontal view of all EPG/PEG cells. (c) Frontal view of isolated EPG/PEG cells projecting from each PB column (labeled ‘EPG’ here for simplicity). ‘L-’ and ‘R-’ refer to the associated PB column for each cell. Blue neurons project from right hemisphere and red from left. (d) Frontal view of all EPG/PEG cells. (e) Schematic of EPG/PEG projection pattern. EPG/PEG cells follow the ’default’ projection pattern in the EB. (f) Lateral view of all EPG/PEG cells. (g) Lateral schematic with EPG/PEG innervating layers in blue. Scale bars: (a) 50 µm; (b–d,f) 100 µm.
Figure 6 with 1 supplement
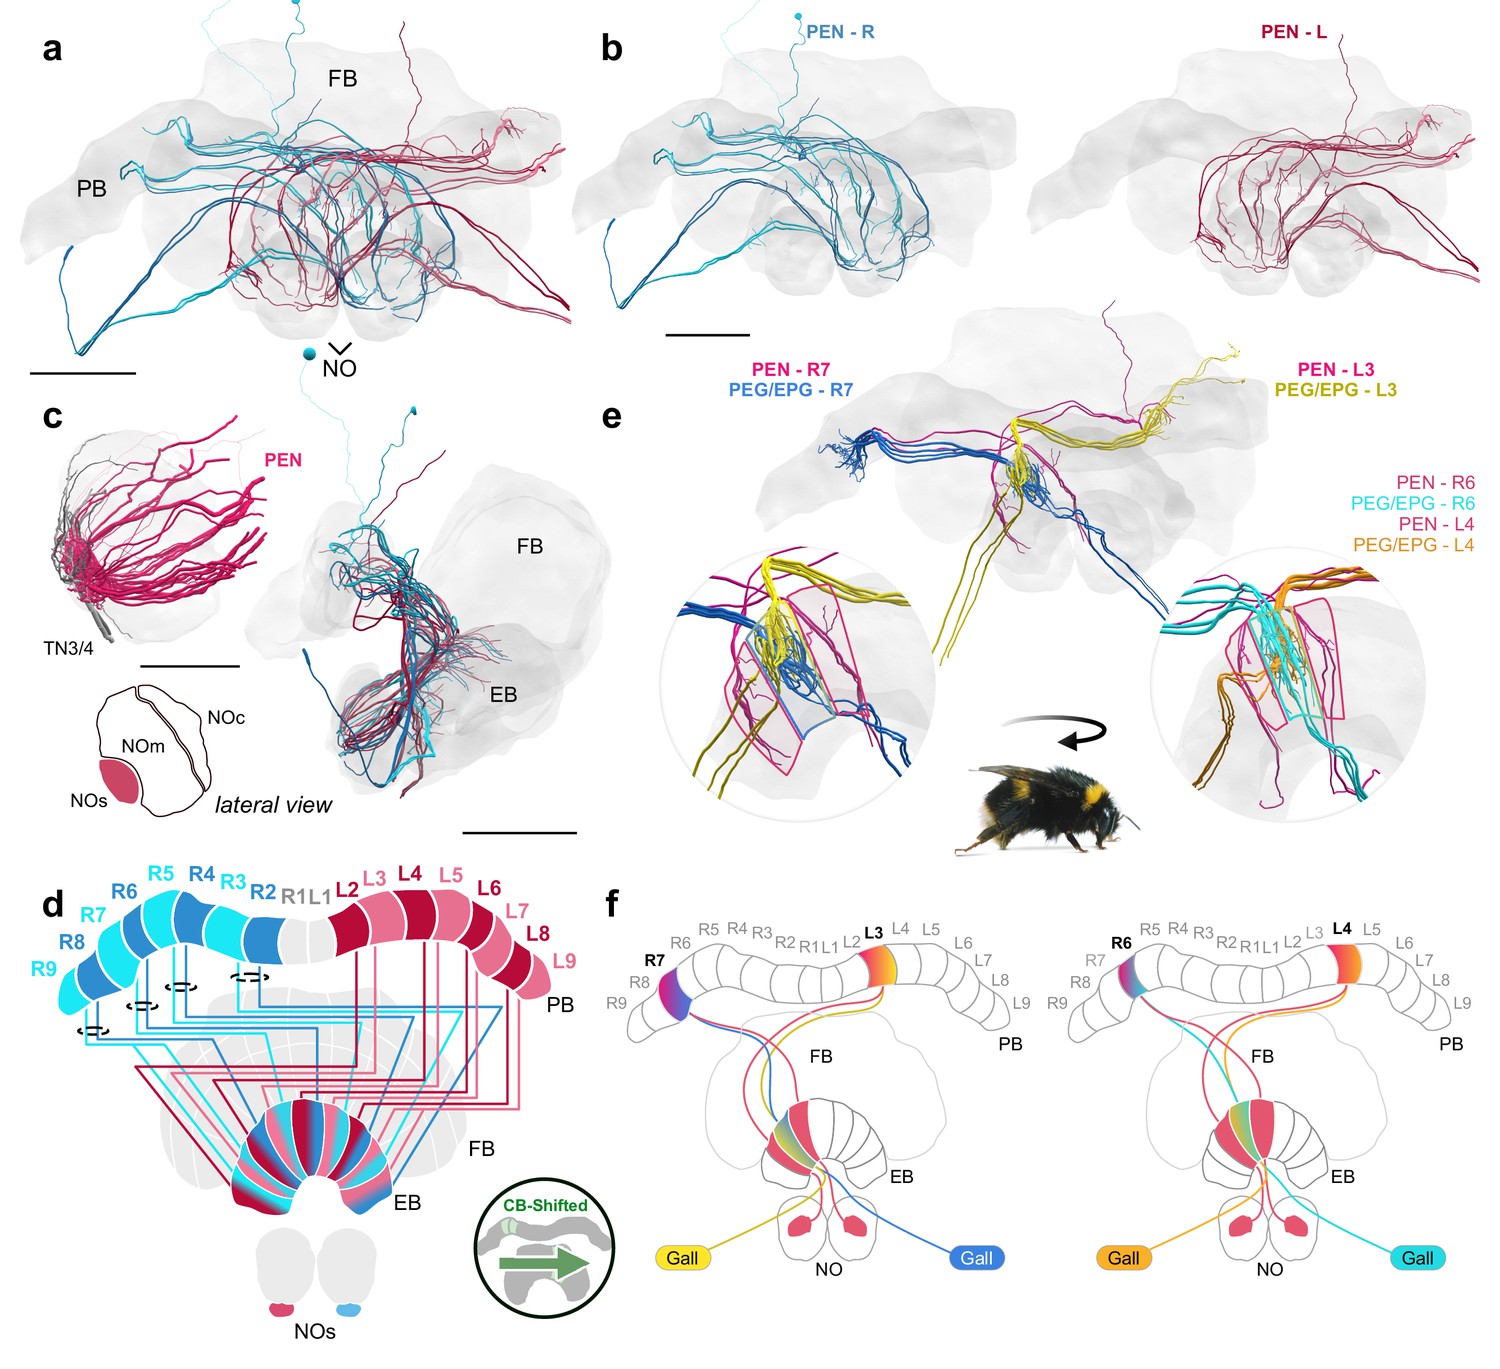
A fly-like head direction circuit in the bumblebee EB.
(a–b) Frontal views of PEN ’angular velocity’ neurons projecting from left (red) and right (blue) hemispheres. (c) Lateral view of PEN arborizations in the NOs in 24 nm and 126 nm data sets. (d) Schematic of PEN projection patterns. PEN cells are shifted contralaterally by one column in the EB. (e) An example illustrating how the anatomical projections of EPG/PEGs and PENs could support the shifting of an EPG activity bump as the bee rotates. (f) Schematic illustration of (e). Scale bars: (a–b) 100 µm (c) 25 µm 24 nm data set; 100 µm 126 nm data set.
Figure 6—figure supplement 1
EPG-PEN projectivity across EB columns.
EPG-PEN projectivity across EB columns. EPG/PEGs from right hemisphere, purple and cyan; EPG/PEGs from left hemisphere, yellow and orange; PENs from right hemisphere, green; PENs from left hemisphere, magenta/pink.
Figure 7
PFL1,3 cells.
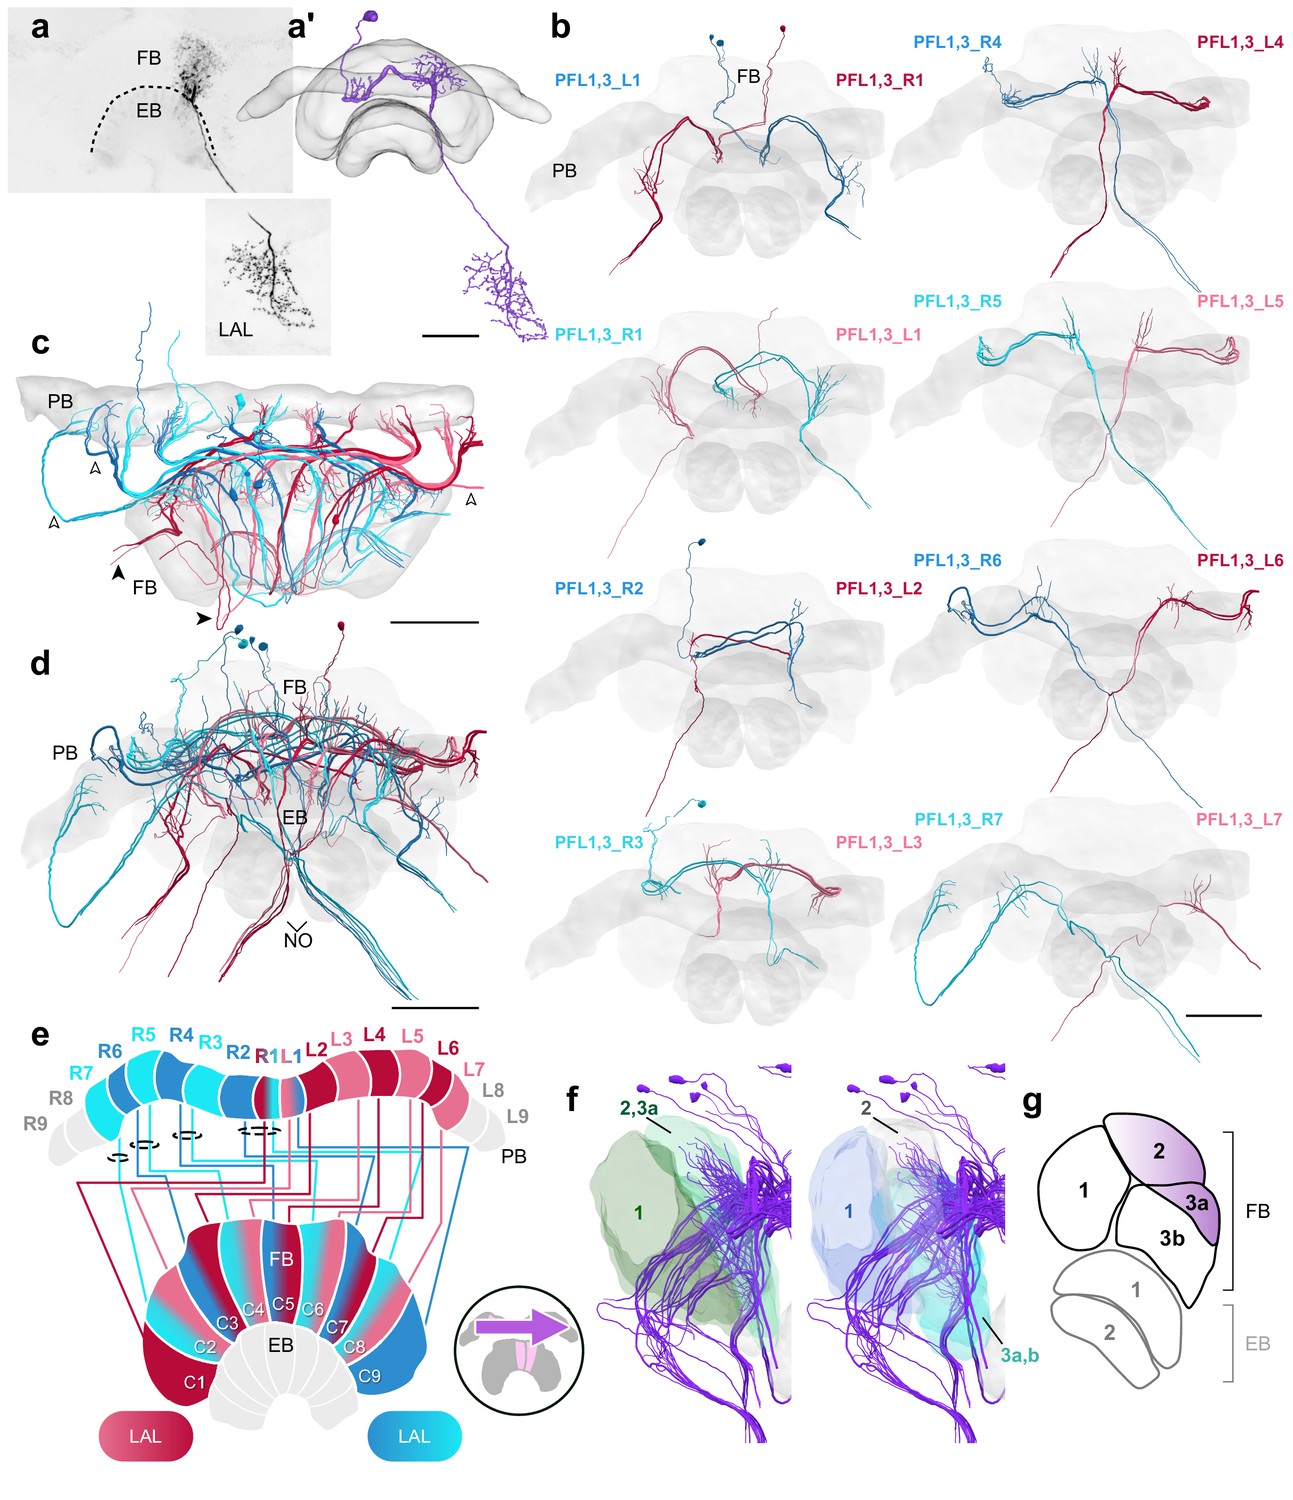
(a) Intracellular dye injection of a Megalopta genalis PFL1,3 cell. (a’) Reconstruction of cell in (a). (b–d,f) PFL1,3 cells traced from 126 nm data set. (b) Frontal view of isolated PFL1,3 cells projecting from each PB column. ‘L-’ and ‘R-’ refer to the associated PB column for each cell. Blue neurons project from right hemisphere and red from left. (c) Horizontal view of all PFL1,3 cells. PFL1,3 neurons are characterized by large diameter fibers leaving the PB (white arrowheads) which thin substantially as they exit the FB (black arrowheads). (d) Frontal view. (e) Schematic of PFL1,3 projection patterns. PFL1,3 cells follow the ’PB-shifted’ projection pattern. They are ipsilaterally offset by a single column in the FB. (f) Lateral view of PFL1,3 cells relative to layers defined by serotonin (green) and tyrosine hydroxylase (blue) immunolabeling. (g) Lateral schematic with purple gradient approximating the innervation regions of PFL1,3 cells. Scale bars: (a) 50 µm; (b–d) 100 µm.
Figure 8
PFL2 cells.
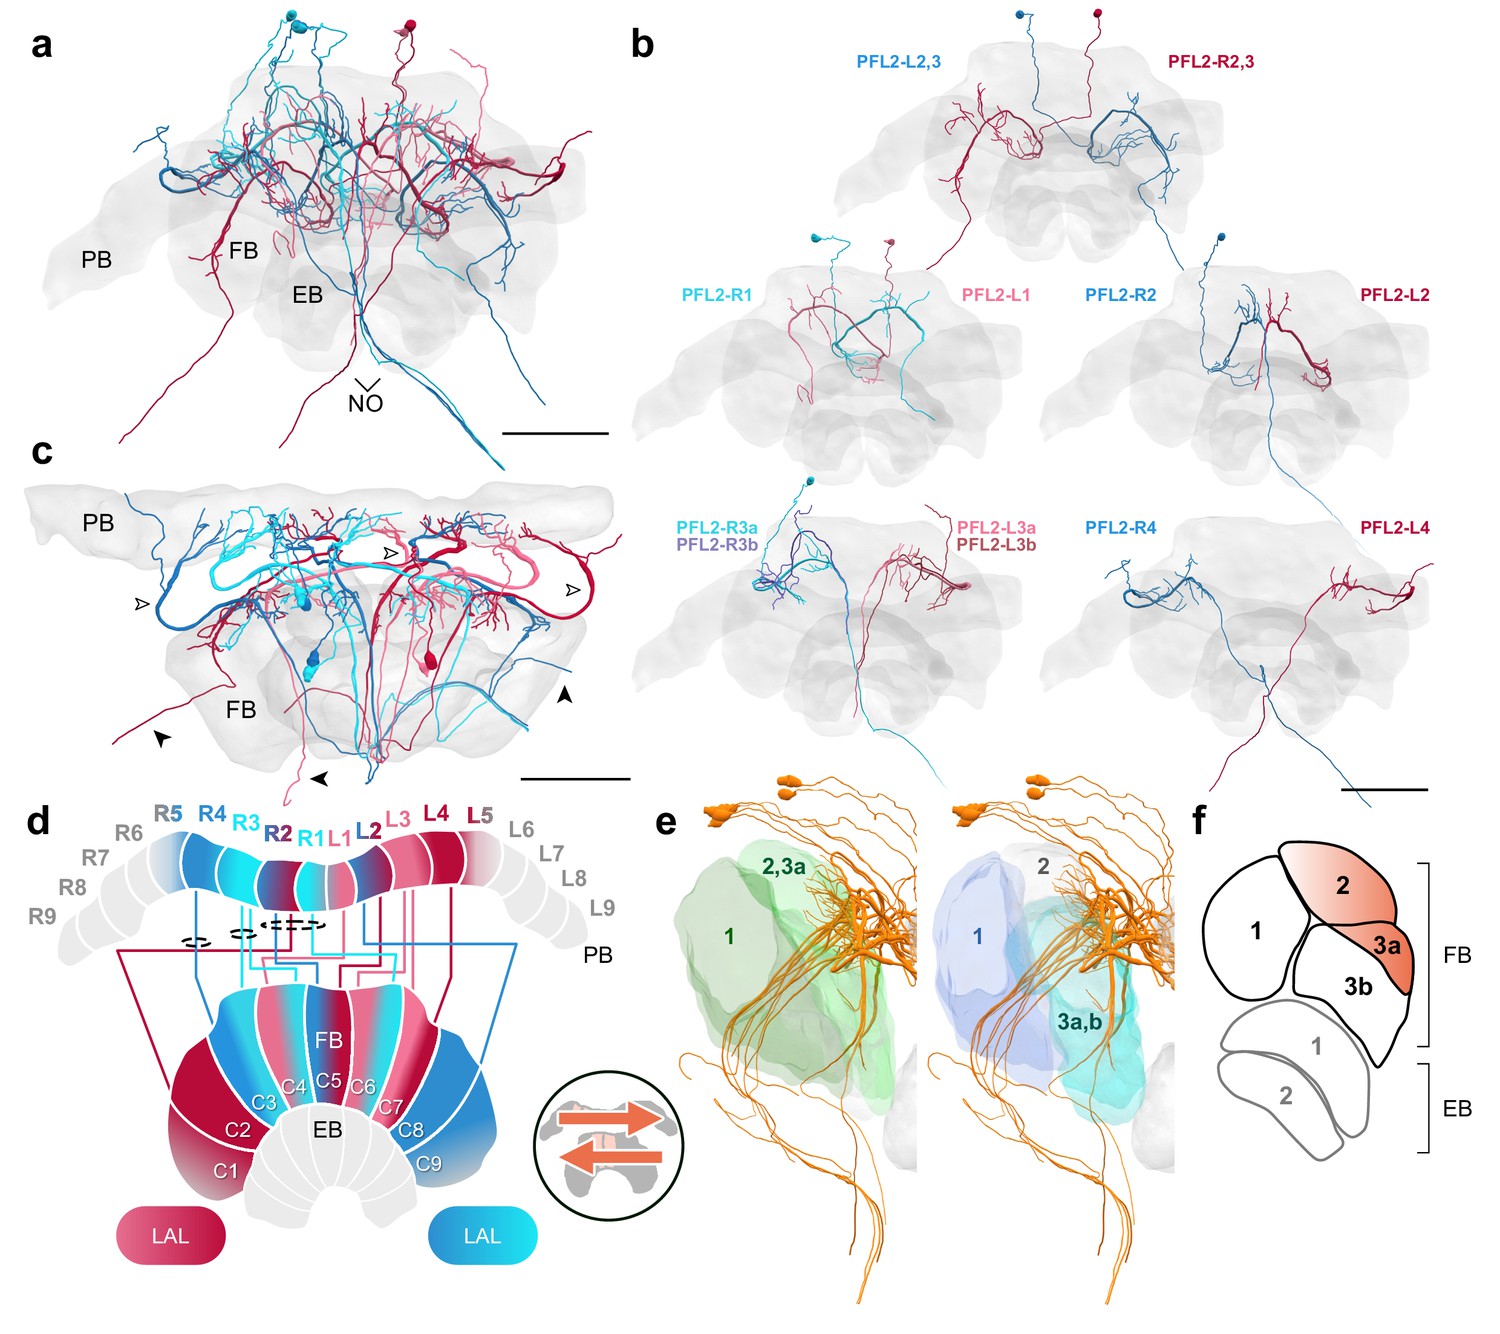
(a–c,e) PFL2 cells traced from 126 nm data set. (a) Frontal view of all PFL2 cells. (b) Frontal view of isolated PFL2 cells projecting from each PB column. ‘L-’ and ‘R-’ refer to the associated PB column for each cell. Blue neurons project from right hemisphere and red from left. (c) Horizontal view of all PFL2 cells. Like PFL1,3, PFL2 neurons are characterized by large diameter fibers leaving the PB (white arrowheads) which thin substantially as they exit the FB (black arrowheads). (d) Schematic of PFL2 projection patterns. Note from (c) that, unlike most columnar cells, PFL2s have substantially overlapping fibers in the PB. Therefore, this schematic is simplified. Columns in the PB were determined by the location of EPG fibers (Figure 5). PFL2 cells follow the ’both-shifted’ projection pattern. They are ipsilaterally offset by three columns in the FB, with the exception of a single neuron in both hemispheres (R3 and L3) that is shifted ipsilaterally by four columns (PFL2_R3b and PFL2_L3b). (e) Lateral view of PFL2 cells relative to layers defined by serotonin (green) and tyrosine hydroxylase (blue) immunolabeling. (f) Lateral schematic with orange gradient approximating the innervation regions of PFL2 cells. Scale bars: 100 µm.
Figure 9

PF1 cells.
(a–d,f) PF1 cells traced from the 126 nm data set. (a) Frontal view of all right hemisphere PF1 cells (blue) and left hemisphere PF1 cells (red). (b) Frontal view of isolated PF1 cells projecting from each PB column. ‘L-’ and ‘R-’ refer to the associated PB column for each cell. (c) Horizontal view. (d) Frontal view. Arrowheads indicate PF1 fibers that enter into the EB from the FB. (e) Schematic of PF1 projection patterns. PF1s follow the ’default’ pattern in the FB. (f) Lateral view of PF1 cells relative to layers defined by serotonin (green) and tyrosine hydroxylase (blue) immunolabeling. (g) Lateral schematic with red gradient approximating the innervation regions of PF1 cells. Note that some cells have ventral branches that extend into the EB (asterisk). Scale bars: 100 µm.
Figure 10 with 1 supplement
PFx cells.
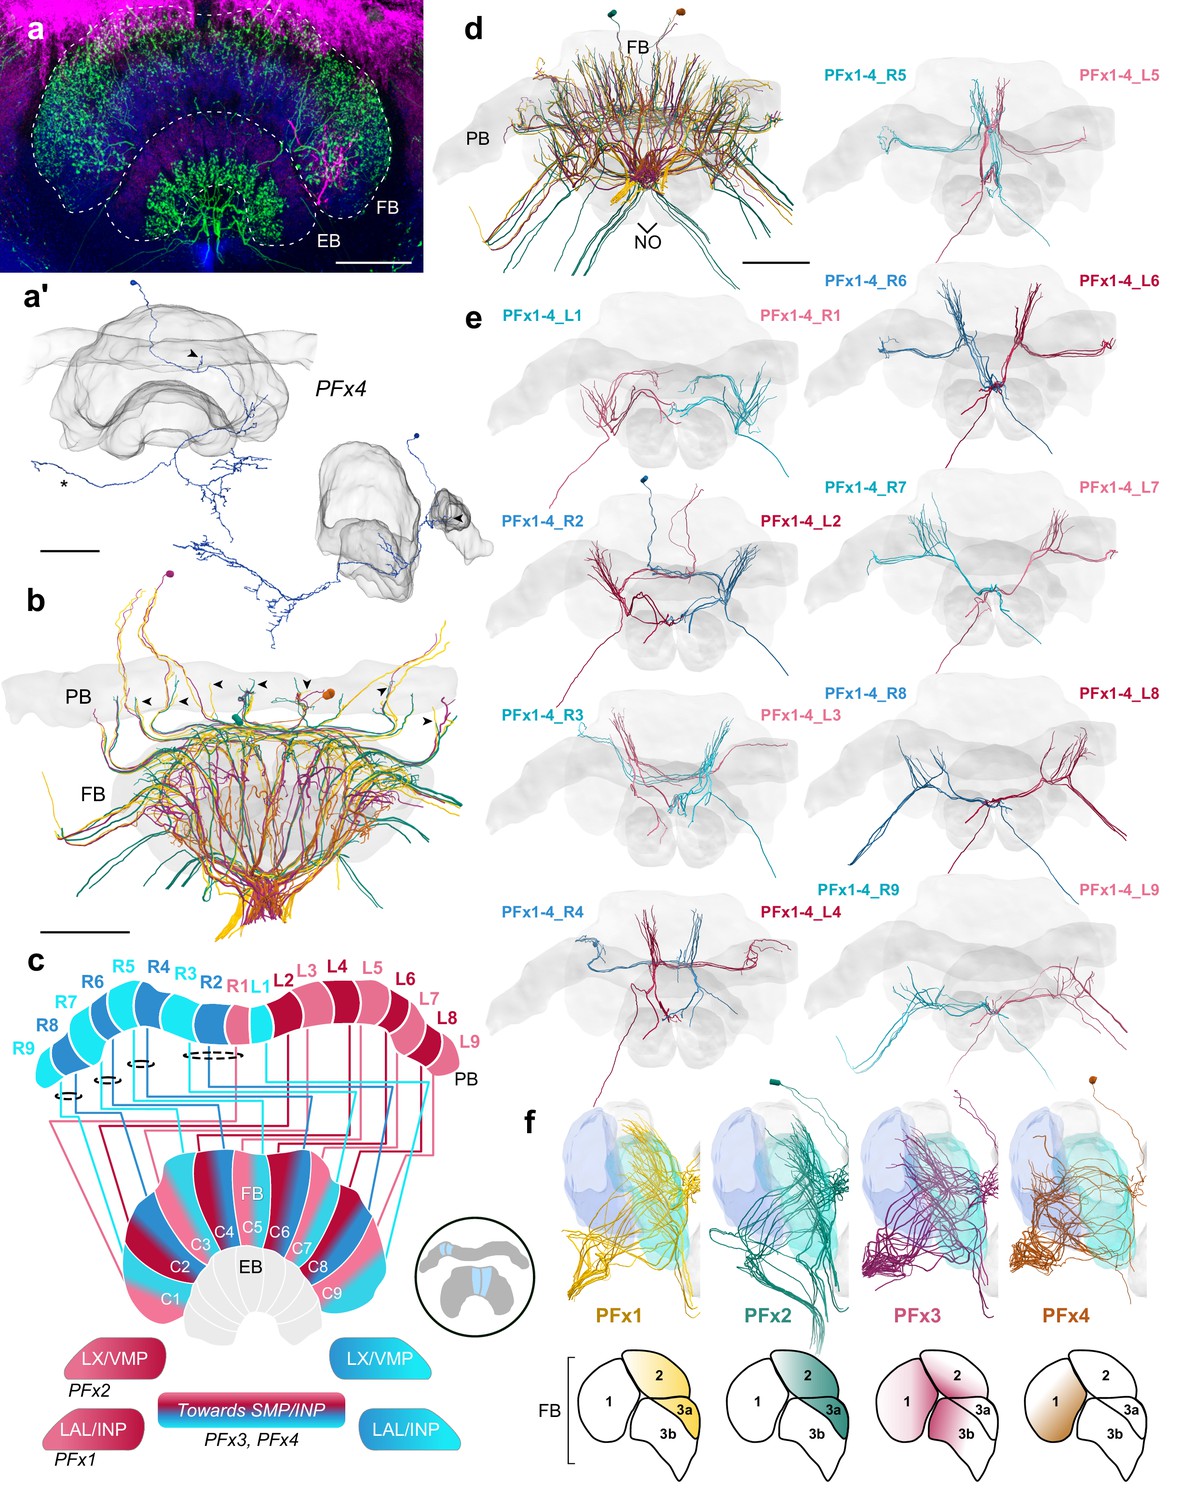
(a) Intracellular dye injection of a bumblebee PFx4 cell (magenta) co-stained with serotonin (green) and synapsin (blue). (a’) Reconstruction of cell in A. Arrowheads point to fibers entering the PB. Reconstruction is partially incomplete due to weak signal in overview confocal scan (asterisk), see Figure 10—figure supplement 1d for additional high resolution image data. (b,d–e,f) All four types of PFx cells traced from 126 nm data set. (b) Horizontal view of all PFx types, illustrating the differentially innervated FB layers. Arrowheads point to fibers entering the PB. (c) Schematic of PFx cell projection patterns. PFx1 cells send their fibers away from the CX toward regions in the INP/LAL, while PFx2 contains fibers ventrally descending toward the LX. PFx3,4 cells project toward regions in the SMP/INP. All PFx cells follow the ’default’ pattern in the FB. (d) Frontal view. (e) Frontal view of PFx1,2,3,4 cells projecting from each PB column. ‘L-’ and ‘R-’ refer to the associated PB column for each cell. Blue neurons project from right hemisphere and red from left. (f) Lateral view of PFx cells relative to layers defined by tyrosine hydroxylase (blue) immunolabeling. Lateral schematics underneath show approximate innervation regions of PFx1,2,3,4 cells within the FB. Scale bars: 100 µm.
Figure 10—figure supplement 1
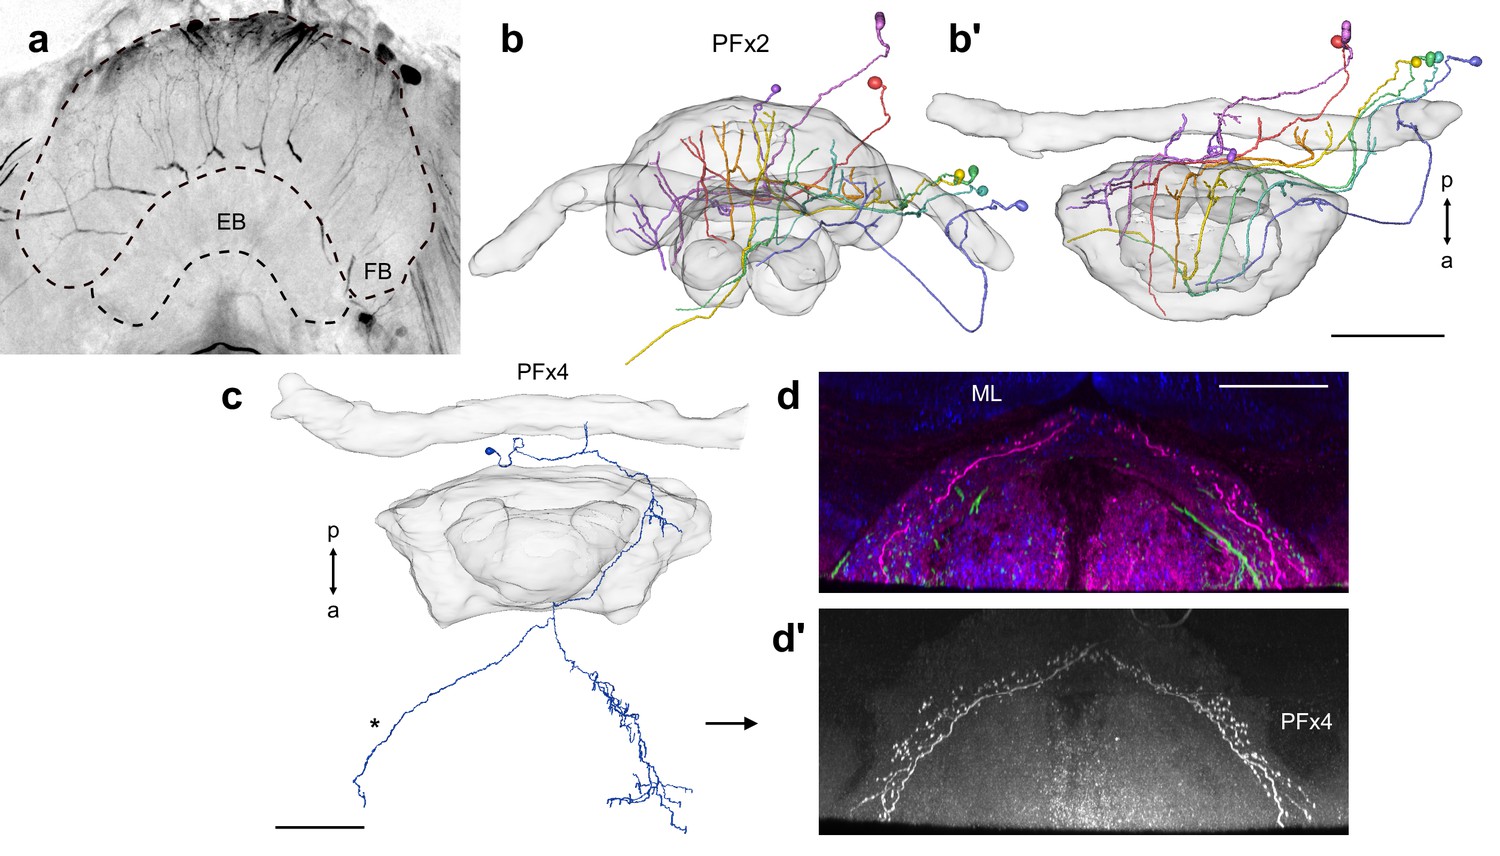
Intracellular dye injection of PFx2 and PFx4 cells.
Intracellular dye injections of PFx2 (a–b) and PFx4 (c–d’) cells. (a) Maximum intensity projection of confocal image of system of PFx2 cells injected with dye. (b) Frontal and (b’) horizontal view of reconstruction of PFx2 cells in (a). (c) Horizontal view of partially reconstructed PFx4 cell in Figure 10. (d–d’) Shows horizontal confocal image data for the same cell. (d) PFx4 (magenta), serotonin (green), and synapsin (blue). ML; medial lobe of the mushroom body. (d’) PFx4 cell isolated. Note branching fibers missing from reconstruction in (c; asterisk). Scale bars: (a) 100 µm, (c–d) 50 µm.
Figure 11 with 1 supplement
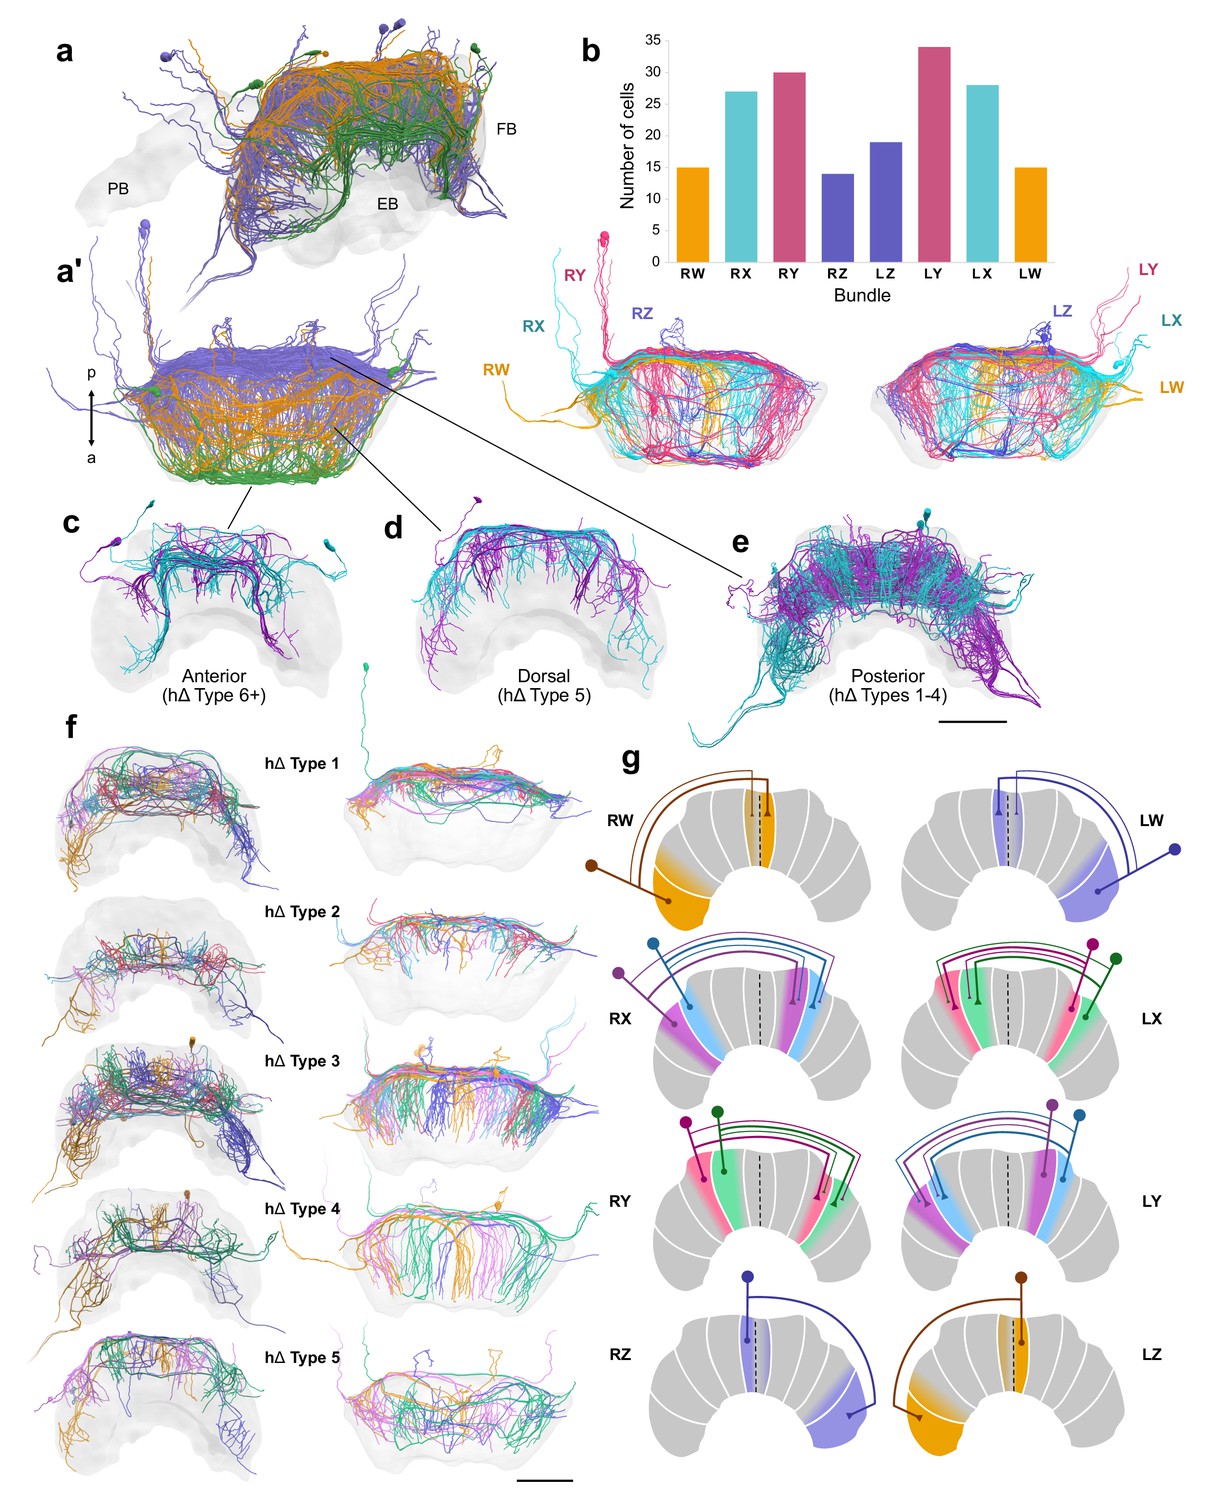
hΔ cells.
(a–f) Reconstructions of hΔ cells from 126 nm data set. (a) Oblique and (a’) horizontal views of hΔ cells entering the FB posteriorly (purple), dorsally (orange), and anteriorly (green). (b) Numbers of hΔ cells per CX bundle. Below, horizontal view of hΔ cells in each hemisphere colored according to bundle. (c–g) Cells are colored according to the FB column they arborize in. (c) Anteriorly projecting hΔ cells. These include Type 6 hΔ cells. Plus sign denotes the possibility that more subtypes of anteriorly projecting hΔ cells are likely to exist. (d) Dorsally projecting hΔ cells. (e) Posteriorly projecting hΔ cells. (f) There are at least five types of hΔ cells which clearly differ in their projection layer and morphology. More cell types may exist but would require full cell morphologies from high-resolution tracing data. Frontal views (left) and horizontal views (right). (g) Schematics of hΔ FB projection columns according to bundle. hΔ cells send putative input fibers to the column nearest their soma, and putative output fibers to FB columns shifted 3–4 columns contralateral to their inputs (see also Figure 11—figure supplement 1a). Scale bars: 100 µm.
Figure 11—figure supplement 1
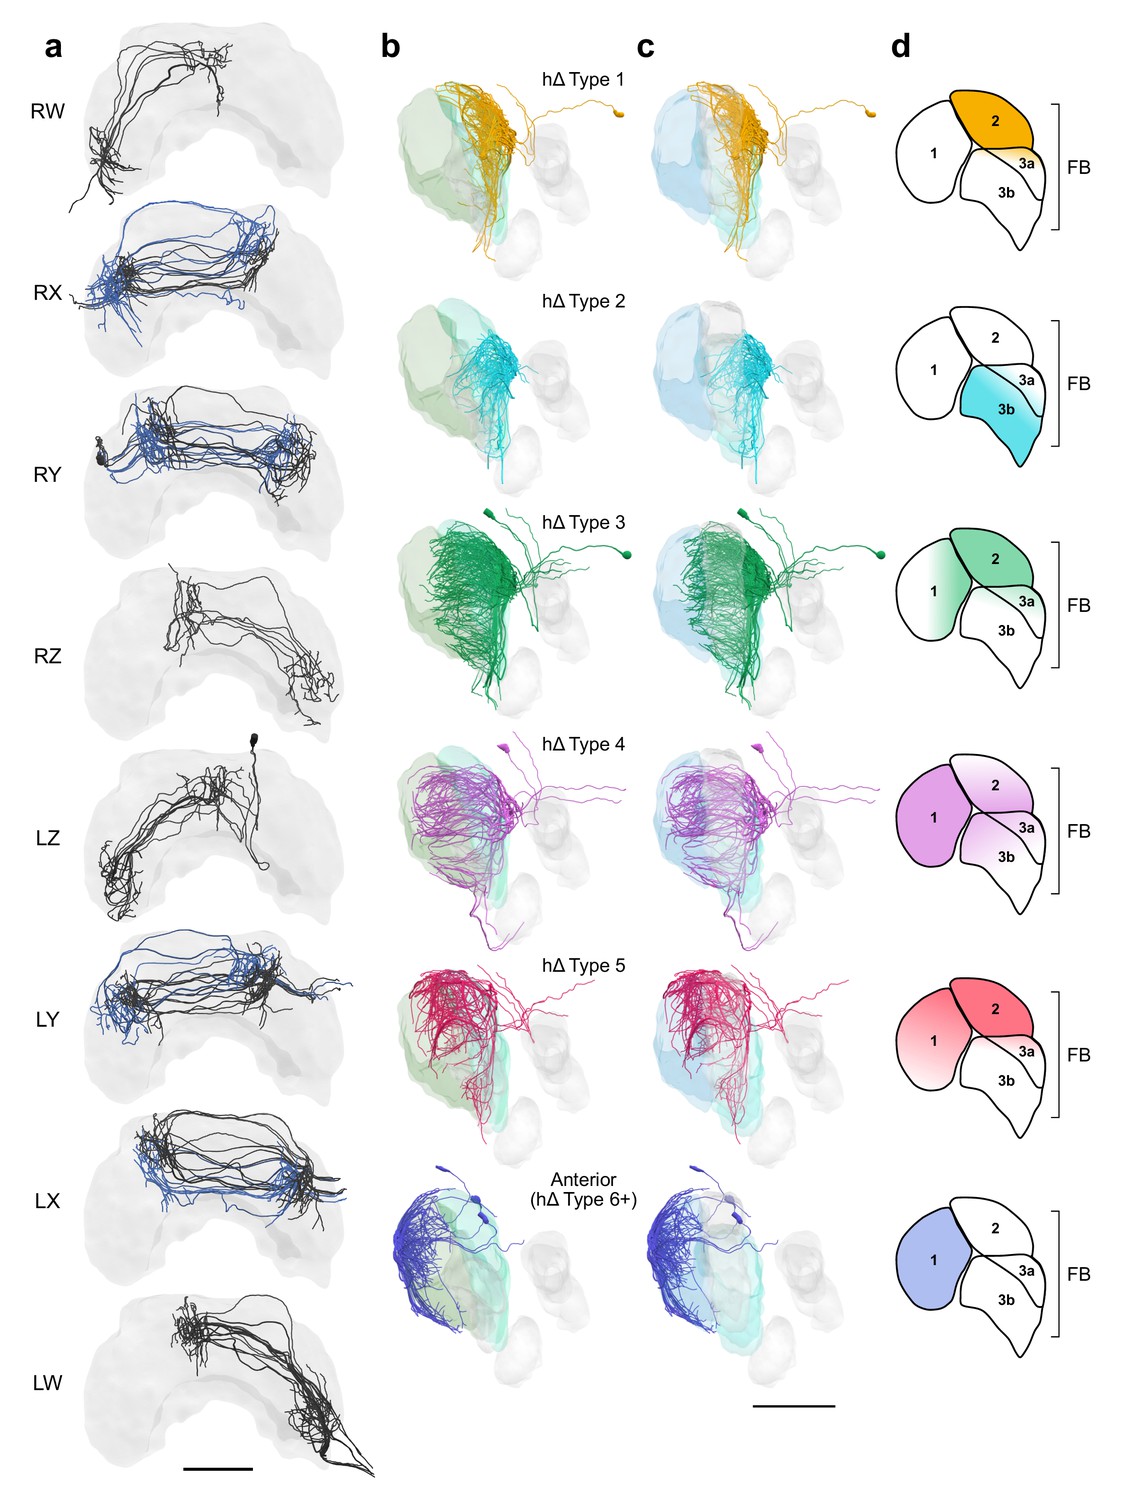
FB hΔ cells isolated by bundle and viewed laterally by type.
hΔ cells isolated by bundle and viewed laterally by type. (a) Frontal views of hΔ cells ordered by bundle from the right hemisphere to the left. hΔs projecting from bundles RX, RY, LY, and LX form two columns in the FB. Cells projecting to adjacent columns are blue to aid with visualization. (b) Lateral views of hΔ cells relative to layers defined by serotonin (green) immunolabeling. (c) Same as (b) but relative to layers defined by tyrosine hydroxylase (blue) immunolabeling. (d) Lateral schematics showing FB layers innervated by hΔ cells in (b) and (c). Cells are colored by type in (b–d). Scale bars: 100 µm.
Figure 12
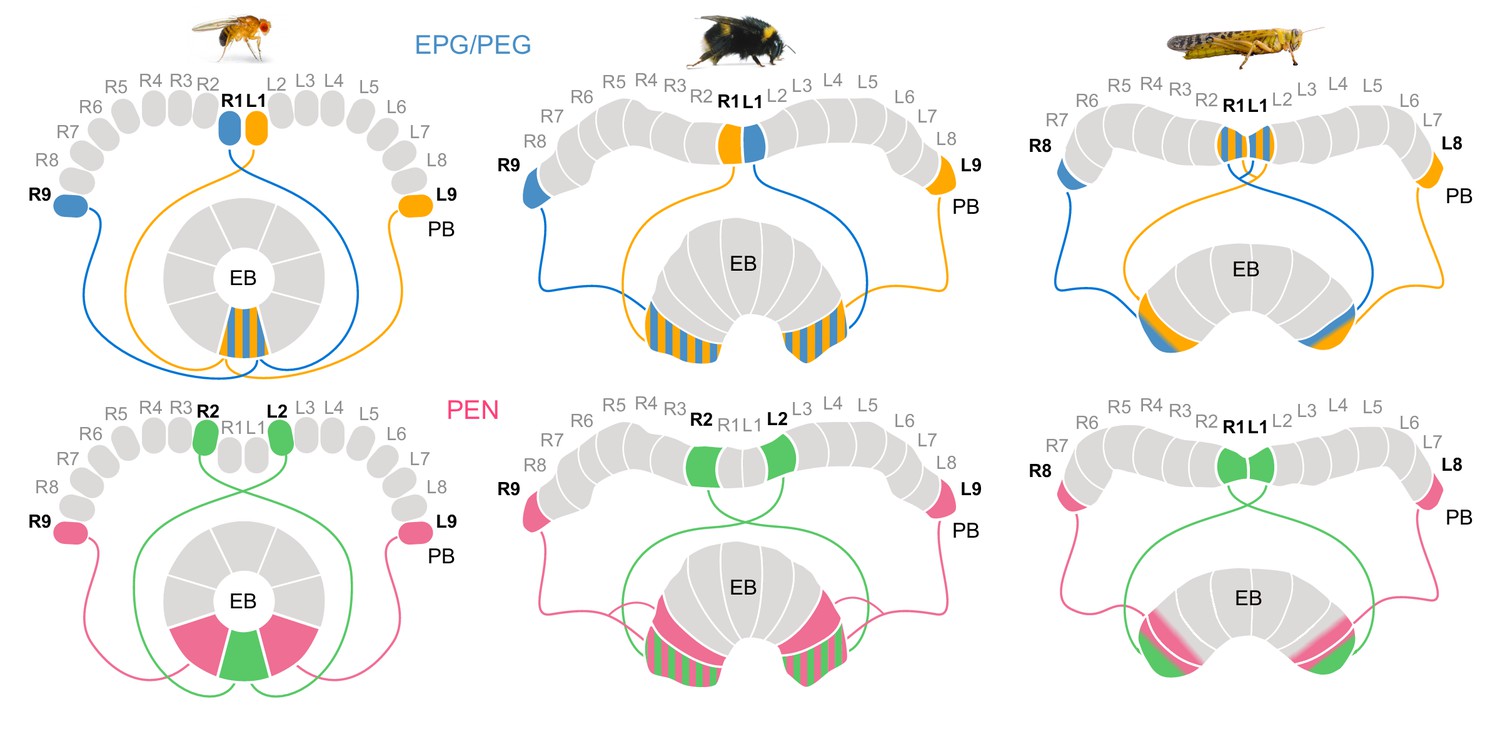
Different circuit solutions for anatomically closing the loop in three insect species.
Stripped patterns indicate overlapping neural branches. In the fruit fly, EPG cells from medialmost PB columns and EPGt cells from the lateralmost ninth columns have overlapping fibers within the EB, enabling an heading encoding activity bump to move in 360° . In the bumblebee EB, EPG/PEG cells at the innermost PB column are swapped relative to the fly. Additionally, the projections of the PEN cells in the lateralmost column of the EB cover twice the width as those PEN cells located in all other EB columns. Locusts have evolved a third and slightly different modification, likely a third mechanism for closing the loop (Pisokas et al., 2020). They use only eight EPG/PEG neurons instead of nine, but midline crossing input fibers of the innermost EPG cells are suited to functionally close the loop.
Figure 13
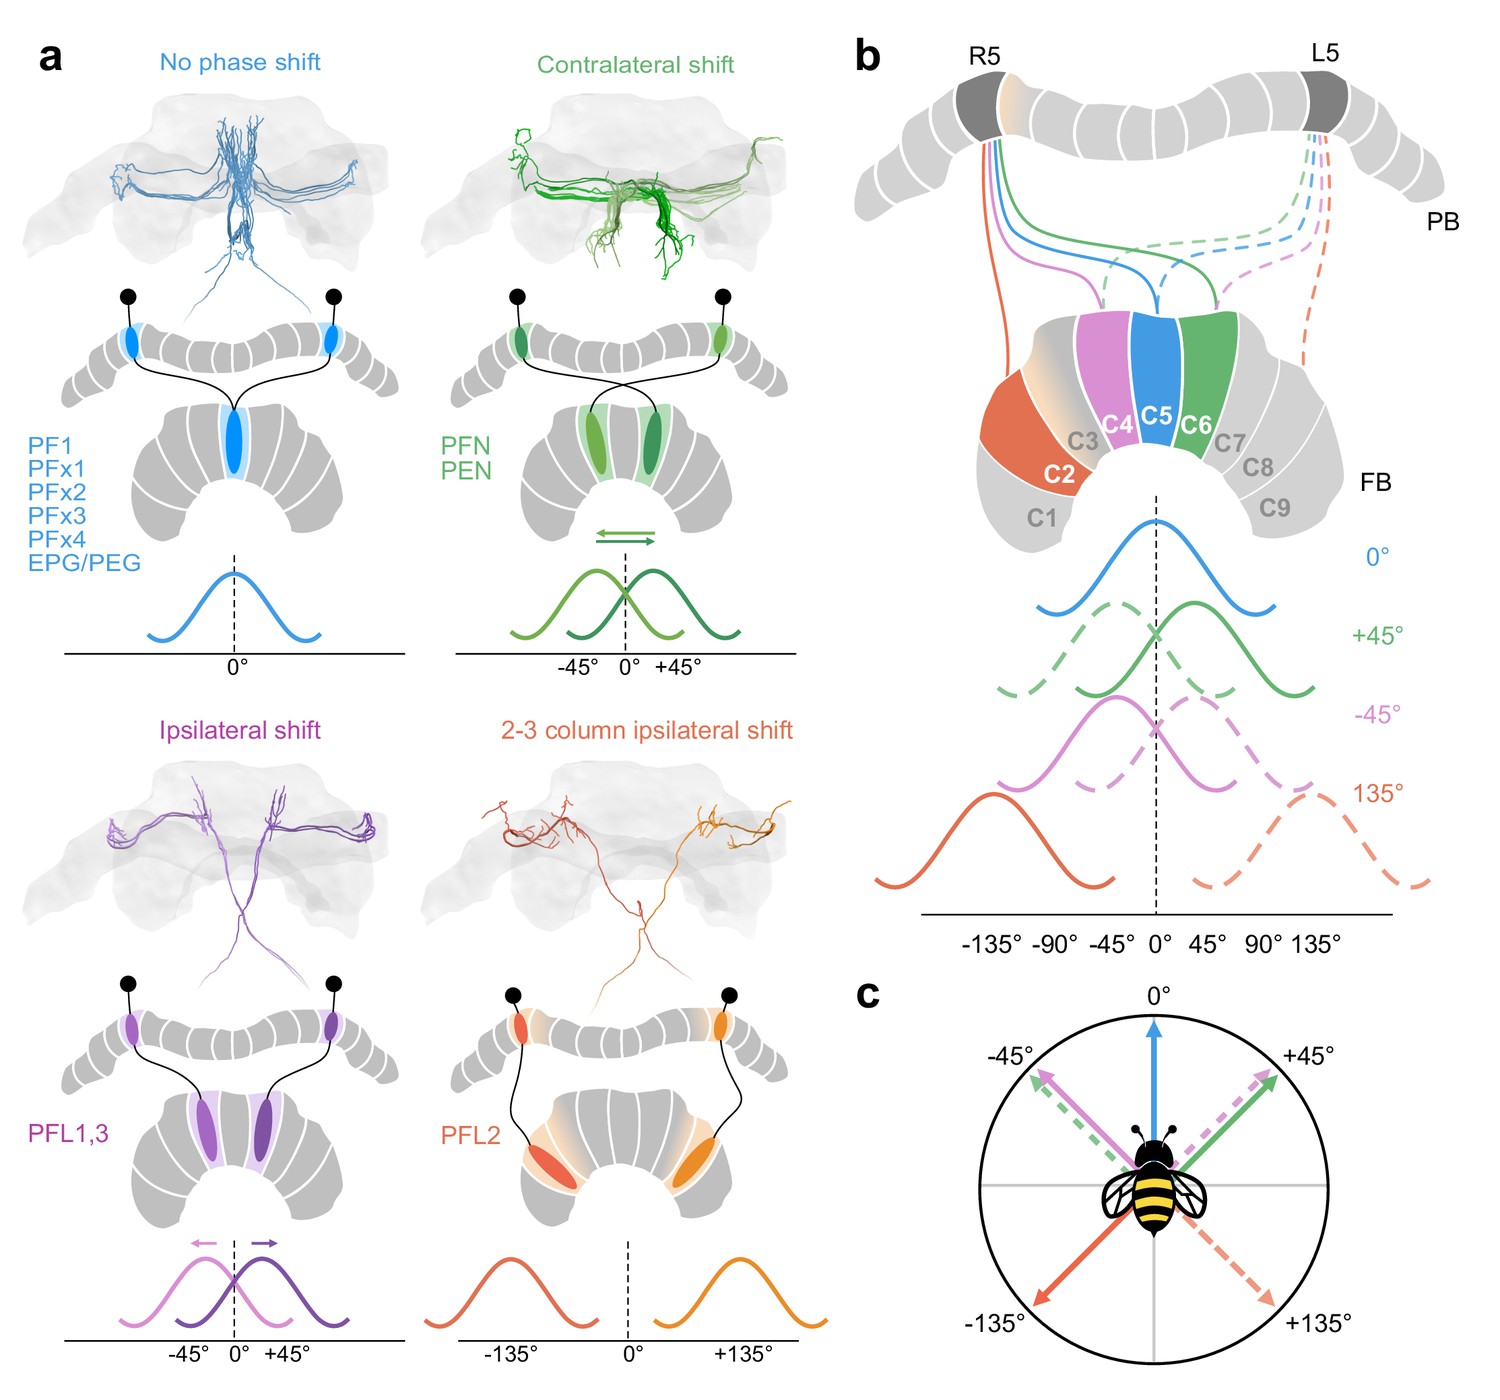
Anatomical phase shifts of CX columnar cells.
Wave forms assume sinusoidal activity profile as in Drosophila (Hulse et al., 2020). (a) Most cells follow a default projection pattern whereby there is no offset between their aborizations in the FB and the PB from which they project. PFNs and PENs are offset by one FB column contralaterally resulting in a 45° shift relative the default projection pattern. PFL1,3 cells are shifted one column ipsilaterally, also resulting in a 45° offset relative to PENs/PFNs, but in the opposite direction. Most PFL2 cells are shifted by three columns ipsilaterally (with the exception of two PFL2 cells, one innervating PB column R3, the other L3; see Figure 8b) creating a 135° offset relative to the default projection column. Note however, due to overlapping PFL2 branches in the PB a single PFL2 cell may receive input from multiple PB columns (for potential functional implication see Figure 14—figure supplement 1). PFL2 cells used as example here have side-branches in PB R5/L5, but are centered in R4/L4 (pastel orange gradient). (b) Each projection offset shown for the cells in (a) projecting from PB columns R5 (cells projecting from L5 indicated by dotted lines but not colored in FB). (c) A vector diagram based on the phase offsets for each cell type, suggesting that each of these cells would be ideal to compare heading signals in the PB with angular signals in the FB at each of the indicated directions.
Figure 14 with 1 supplement
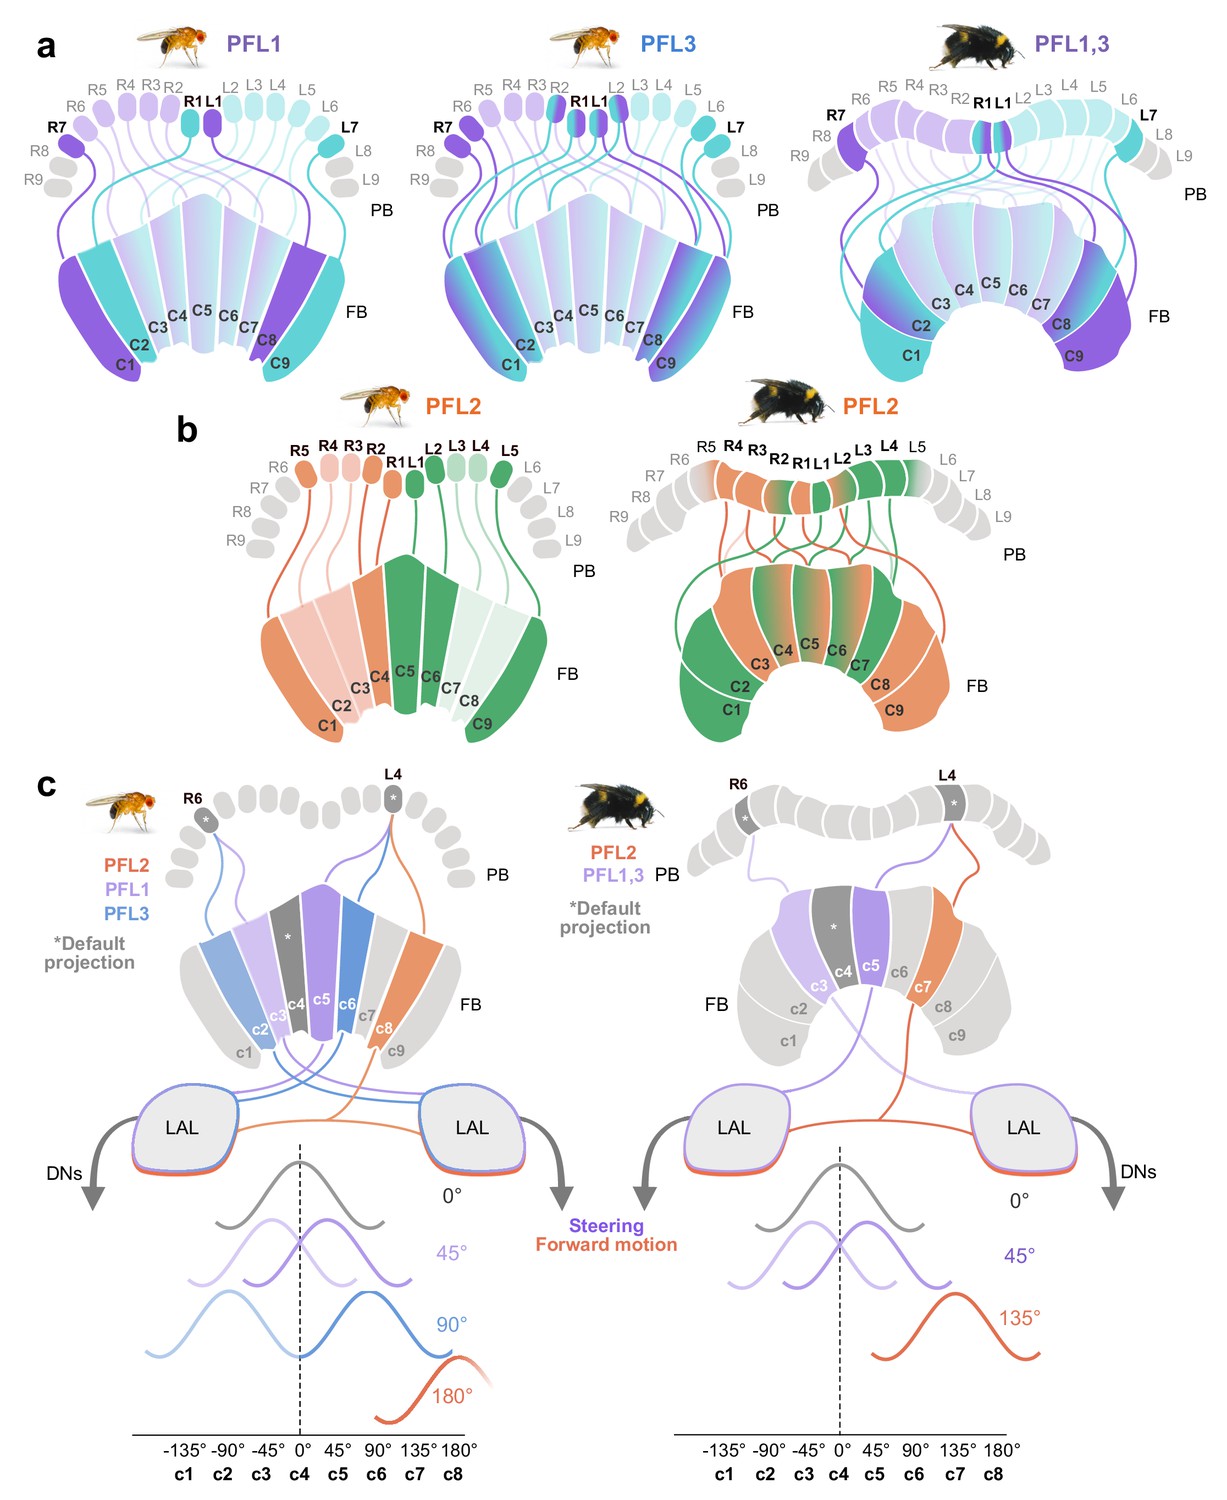
Proposed steering CX output neurons (PFL cells) differ in their projection patterns between the bee and the fly.
(a) Schematic of PFL1 and PFL3 projection patterns in the fly compared to PFL1,3 projection patterns in the bee. In the FB, fruit fly PFL1s are offset by one column ipsilaterally and PFL3s by two. All PFL1,3s in the bee are shifted ipsilaterally by a single column in the FB, with no evidence for a second PFL cell type matching the pattern of PFL3 cells. (b) Schematic of PFL2 projections in fly and bee. In contrast to the fly, many bee PFL2 cells have contralaterally projecting PFL2 cells in the FB which overlap with PFL2s projecting from the opposite hemisphere. Further, PFL2 cells in the fly are ipsilaterally shifted by four columns (180° offset), whereas in bees they are only shifted by three columns (135° offset). (c) Schematic of hypothetical activity profiles that would result from observed differences between fly and bee PFL projection patterns following model proposed by Hulse et al., 2020.
Figure 14—figure supplement 1
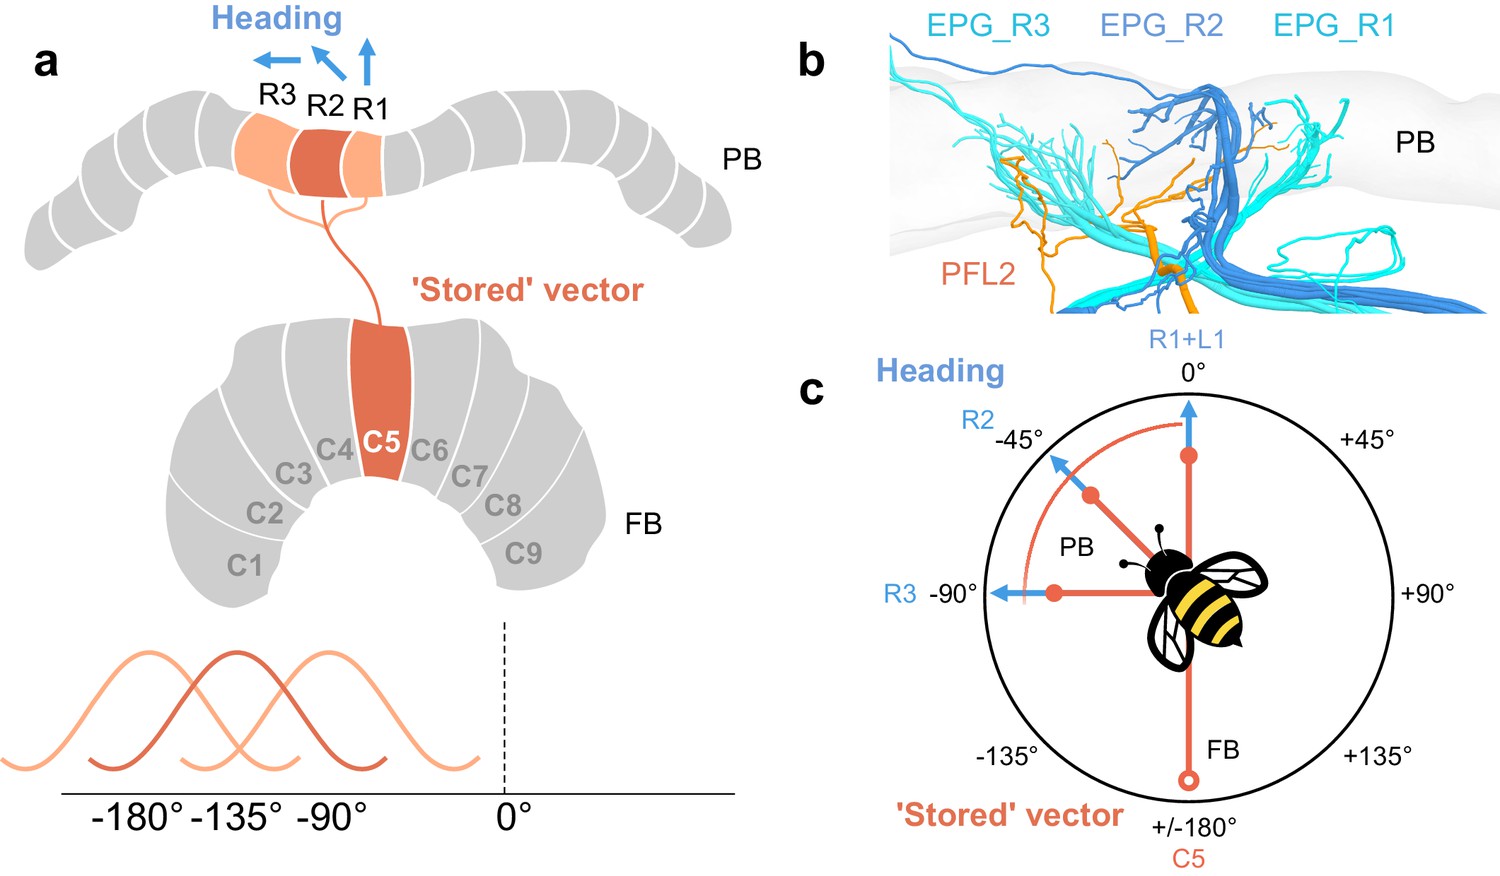
PFL2 cells may receive input across multiple PB columns.
In a model proposed by Hulse et al., 2020, PFL2 cells were suggested as candidates to drive forward movement when a fruit fly would be facing 180°away from its ’stored’ vector. This is supported by the fact that PFL2 cells have bilateral projections to descending neurons in both LALs, and, in Drosophila, they are offset from the default projection in the FB by 180°. Note that ’stored’ vector refers to an accumulated vector, akin to an outbound vector in the context of a foraging bee. In bumblebees, PFL2 cells are only offset in the FB by 135°, suggesting perhaps they would not be suitable to drive forward motion when the bee is facing 180° away from its ’stored’ vector (i.e. toward its nest or ’home vector’). However, PFL2 cells that innervate multiple columns may receive head direction input from each of those columns. If so, PFL2 cells could therefore compare as many as three offsets, one 90° away from its heading, one 135° away from its heading, and the other 180° away from its heading. (a) Schematic of arborization domains (orange) of a PFL2 cell. Blue arrows indicate example heading direction which PFL2s would receive from each adjacent column. (b) View of same PFL2 cell in (a) with branches that overlap PB columns R1, R2, and R3, as defined by the projections of EPG cells (blue). (c) Schematic a bee flying toward example heading direction (PB column R2/L8). This example PFL2 cell (PFL2_R2) could be ideal to compare input from the FB (open circle) when the bee is facing 90° away from its heading (toward the direction represented by column R3), 135° away from its heading (toward the direction represented by column R2), or while facing 180°away from its heading (PB column R1). This relies on the assumption that this particular cell receives head direction input in each of these three columns, which may not be the case.
Tables
Table 1
List of corresponding neuropil and neuron names in Drosophila melanogaster and other insects.
Names of neurons from other species are based on locust nomenclature (Heinze and Homberg, 2008), and have been used in butterflies (Heinze et al., 2013), moths (de Vries et al., 2017), beetles (El Jundi et al., 2018), and bees (Stone et al., 2017; Hensgen et al., 2021). Asterisks indicate cells identified in this study with no clear homologues in Drosophila.
| CX neuropils | Columnar neurons | FB interneurons | Tangential neurons | ||||
|---|---|---|---|---|---|---|---|
| Drosophila | Other insects | Drosophila | Other insects | Drosophila | Other insects | Drosophila | Other insects |
| PB | PB | EPG/PEG | CL1a/b | hΔ | Pontines | Δ7 | TB1 |
| FB | CBU | PEN | CL2 | vΔ | Unknown | FBx | TU |
| EB | CBL | PFL1 | CPU1 Type 1 | ER | TL | ||
| NO | NO | PFL3 | CPU1 Type 2 | LNO | TN | ||
| PFL2 | CPU2 | ||||||
| PFN | CPU4 | ||||||
| PFR | Unknown | ||||||
| PFG | Unknown | ||||||
| FX | CU | ||||||
| Unknown | PF1* | ||||||
| Unkown | PFx1,2,3,4* | ||||||
| Unknown | PFLx* | ||||||
Key resources table
| Reagent type (species) or resource | Designation | Source or reference | Identifiers | Additional information |
|---|---|---|---|---|
| Organism (Bombus terrestris) | NA | Koppert, Netherlands | NATUPOL | NA |
| Organism (Megalopta genalis) | NA | Wild caught, Barro Colorado Island, Panama | NA | NA |
| Antibody | Synapsin (SYNORF1; Mouse, monoclonal) | Developmental Studies Hybridoma Bank (DHSB) | 3C11 | NA |
| Antibody | Serotonin (5HT; Rabbit, polyclonal) | ImmunoStar | CAT#: 20080; RRID:AB_572263 | NA |
| Antibody | Tyrosine hydroxylase (TH; Mouse, monoclonal) | ImmunoStar | CAT#: 22941; RRID:AB_572268 | NA |
| Antibody | AZniPure Donkey Anti-Mouse IgG (H+L) Cy3 (polyclonal) | Jackson ImmunoResearch | CAT#: 715-165-150; RRID:AB_2340813 | NA |
| Antibody | AZniPure Donkey Anti-Rabbit IgG (H+L) Cy5 (polyclonal) | Jackson ImmunoResearch | CAT#: 711-175-152; RRID:AB_2340607 | NA |
| Other (serum) | Normal goat serum | Jackson ImmunoResearch | CAT#: 005-000-001 | NA |
| Chemical compound | Neurobiotin | Vector Laboratories | CAT#: SP-1120 | NA |
| Chemical compound | Cy3 Streptavidin | Jackson ImmunoResearch | CAT#: 016-160-084 | NA |
| Chemical compound | Permount | Fisher Scienti1 | CAT#: SP15-100 | NA |
| Other (enzyme) | Pronase | Sigma-Aldrich | CAT#: P8811 | NA |
| Chemical compound | Osmium tetroxide 4% aqueous | Proscitech | CAT#: C011 | NA |
| Chemical compound | Potassium ferricyanide | Sigma-Aldrich | CAT#: 702587 | NA |
| Chemical compound | Thiocarbohydrazide | Sigma-Aldrich | CAT#: 223220 | NA |
| Chemical compound | Lead nitrate | Sigma-Aldrich | CAT#: 228621 | NA |
| Chemical compound | L-Aspartic acid | Sigma-Aldrich | CAT#: A4534 | NA |
| Chemical compound | Uranyl acetate | Electron Microscopy Sciences | CAT#: 22400 | NA |
| Chemical compound | Durcupan ACM resin (4-part component kit) | Sigma-Aldrich | CAT#: 44610 | NA |
| Chemical compound | Conductive silver epoxy (2-part) | Ted Pella | CAT#: 16043 | NA |
| Software, algorithm | Amira 5.3 | Thermo Fisher Scienti1c | NA | NA |
| Software, algorithm | Skeletonize plugin for Amira 5.3 | Dr. J.F. Evers Schmitt et al., 2004 | NA | NA |
| Software, algorithm | CATMAID | Saalfeld et al., 2009 | NA | NA |
| Software, algorithm | FIJI (ImageJ) | Schindelin et al., 2012 | NA | NA |
| Software, algorithm | natverse | Bates et al., 2020 | NA | NA |
| Software, algorithm | Leica Application Suite X (LAS X) Navigator | Leica | NA | NA |
| Software, algorithm | ImageJ image stitching plugin | Preibisch et al., 2009 | NA | NA |
| Other | Sigma VP 300 SEM | Zeiss | NA | NA |
| Other | 3view 2 system | Gatan | NA | NA |
| Other | Leica SP8 DLS inverted confocal microscope | Leica | NA | NA |
| Other | Ampli1er (Panama): BA-03X | NPI | BA-03X | NA |
| Other | Ampli1er (Lund): SEC05-LX | NPI | SEC05-LX | NA |
| Other | Micromanipulator: SMXS-K-R | SensApex OY | SMXS-K-R | NA |
| Other | Electrode puller: P-97 | Sutter | NA | NA |
| Other | Borosilicate glass capillaries w/ filament | Sutter | BF150-75-10 | NA |
Additional files
Download links
A two-part list of links to download the article, or parts of the article, in various formats.
Downloads (link to download the article as PDF)
Open citations (links to open the citations from this article in various online reference manager services)
Cite this article (links to download the citations from this article in formats compatible with various reference manager tools)
A projectome of the bumblebee central complex
eLife 10:e68911.
https://doi.org/10.7554/eLife.68911


