RTN3 inhibits RIG-I-mediated antiviral responses by impairing TRIM25-mediated K63-linked polyubiquitination
- Institute of Human Virology, Zhongshan School of Medicine, Sun Yat-Sen University, China
- Key Laboratory of Tropical Disease Control (Sun Yat-Sen University), Ministry of Education, China
- Zhongshan School of Medicine, Sun Yat-Sen University, China
Figures
Figure 1 with 1 supplement

RTN3 is upregulated and self-aggregates upon RNA viral infection.
(A) Immunoblot analysis of HEK293T cells infected with VSV-eGFP (MOI = 1) or treated with poly(I:C) (5 μg/ml) at the indicated timepoints. (B–C) mRNA levels of RTN3 and TNF in the same samples shown in (A) were detected by real-time PCR. B. VSV-eGFP-infected group, C. poly(I:C)-treated group. (D) Immunoblot analysis of HEK293T cells treated with TNF-α (10 ng/ml) or IFN-β (20 ng/ml) at the indicated timepoints. (E) mRNA levels of RTN3 in the same samples shown in (D) were detected by RT-PCR. (F) Immunoblot analysis of PBMCs infected with VSV-eGFP (MOI = 2) at the indicated timepoints (top), and mRNA levels of RTN3 in the same samples were detected by RT-PCR (bottom). In (A, D, F), the data are representative of three independent experiments. In (B, C, E, F), the data are shown as the mean values ± SD (n = 3). *, p < 0.0332; **, p < 0.0021; ***, p < 0.0002; and ****, p < 0.0001 by Sidak’s multiple comparisons test.
-
Figure 1—source data 1
Uncropped blots with bands labeled AI file and raw unedited blots files for panels A, D, and F.
- https://cdn.elifesciences.org/articles/68958/elife-68958-fig1-data1-v2.zip
-
Figure 1—source data 2
Excel file of RT-PCR measurements and description of statistical tests for panel B.
- https://cdn.elifesciences.org/articles/68958/elife-68958-fig1-data2-v2.xlsx
-
Figure 1—source data 3
Excel file of RT-PCR measurements and description of statistical tests for panel C.
- https://cdn.elifesciences.org/articles/68958/elife-68958-fig1-data3-v2.xlsx
-
Figure 1—source data 4
Excel file of RT-PCR measurements and description of statistical tests for panel E.
- https://cdn.elifesciences.org/articles/68958/elife-68958-fig1-data4-v2.xlsx
-
Figure 1—source data 5
Excel file of RT-PCR measurements and description of statistical tests for panel F.
- https://cdn.elifesciences.org/articles/68958/elife-68958-fig1-data5-v2.xlsx
Figure 1—figure supplement 1
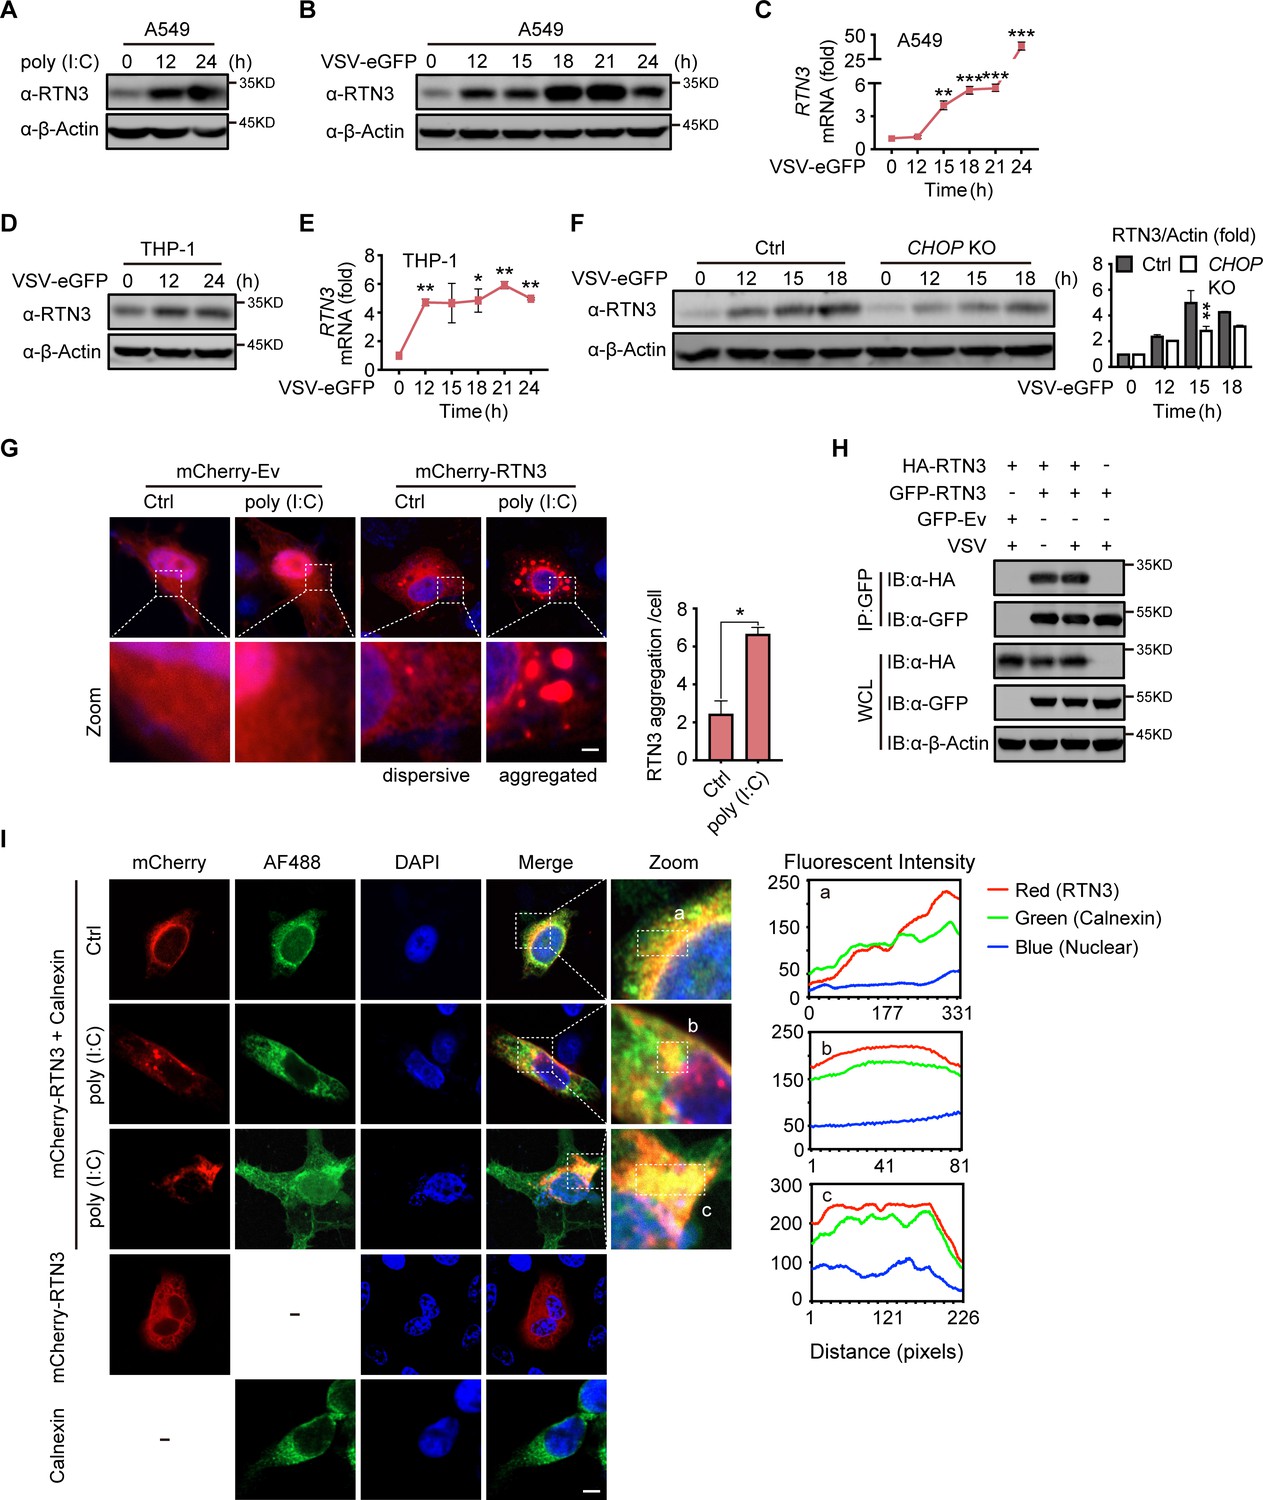
RTN3 is upregulated and self-aggregates upon RNA viral infection.
(A–B) Immunoblot analysis of A549 cells treated with poly(I:C) (5 µg/ml) (A) or infected with VSV-eGFP (MOI = 1) (B) at the indicated timepoints. (C) mRNA levels of RTN3 in the same samples shown in (B) were detected by RT-PCR. (D) Immunoblot analysis of THP-1 cells infected with VSV-eGFP (MOI = 1) at the indicated timepoints. (E) mRNA levels of RTN3 were detected in THP-1 cells infected with VSV-eGFP (MOI = 1) at the indicated timepoints. (F) Immunoblot analysis and mRNA levels of RTN3 in wild-type or CHOP knockout cells infected with VSV-eGFP (MOI = 1) at the indicated timepoints. (G) Confocal microcopy analysis of HeLa cells transfected with mCherry-Ev or mCherry-RTN3 followed by stimulation with/without poly(I:C). Quantitative comparison of RTN3 aggregation levels as analyzed by aggregation enumeration. For each treatment method, 20 cells/group and two groups in total were analyzed for each treatment. Scale bar, 10 μm. (H) CoIP and immunoblot analyses of HEK293T cells transfected with HA-Ev or HA-RTN3 with GFP tagged RTN3 (GFP-RTN3) or GFP-Ev in the indicated groups for 24 hr and followed by infection with VSV (MOI = 1) for 8 hr. (I) Confocal microcopy analysis of HeLa cells transfected with mCherry-RTN3 followed by stimulation with or without poly(I:C). Twenty-four hours posttransfection, cells were stained with the indicated antibodies. Scale bar, 10 μm. The dotted boxes (a, b, c) indicate the colocalization area for qualitative analysis of the fluorescence intensity. In (A, B, D, F, H), the data are representative of three independent experiments. In (C, E), the data are shown as the mean values ± SD (n = 3). *, p < 0.0332; **, p < 0.0021; ***, p < 0.0002; and ****, p < 0.0001 by Sidak’s multiple comparisons test. In (G), the data are shown as the mean values ± SD (n = 40); *, p < 0.05 by unpaired t test.
-
Figure 1—figure supplement 1—source data 1
Uncropped blots with bands labeled AI file and raw unedited blots files for panels A, B, D, F, and H.
- https://cdn.elifesciences.org/articles/68958/elife-68958-fig1-figsupp1-data1-v2.zip
-
Figure 1—figure supplement 1—source data 2
Excel file of RT-PCR measurements and description of statistical tests for panel C.
- https://cdn.elifesciences.org/articles/68958/elife-68958-fig1-figsupp1-data2-v2.xlsx
-
Figure 1—figure supplement 1—source data 3
Excel file of RT-PCR measurements and description of statistical tests for panel E.
- https://cdn.elifesciences.org/articles/68958/elife-68958-fig1-figsupp1-data3-v2.xlsx
-
Figure 1—figure supplement 1—source data 4
Excel file of images quantification and description of statistical tests for panel G.
- https://cdn.elifesciences.org/articles/68958/elife-68958-fig1-figsupp1-data4-v2.xlsx
Figure 2 with 1 supplement

RTN3 overexpression suppresses antiviral immune responses.
(A) Luciferase assays of HEK293T cells transfected with an ISRE luciferase reporter (ISRE-Luc), an IFNB luciferase reporter (IFNβ-Luc) or an NF-κB luciferase reporter (NF-κB-Luc) together with an HA-tagged empty vector (HA-Ev, no wedge) or increasing amounts (wedge) of plasmid encoding RTN3 (HA-RTN3) followed by transfection with a plasmid encoding the RIG-I CARD domain [RIG-I (N)] to activate the pathway. Cell lysates were collected 24 hr posttransfection, the same as that described in the following experiments, if no additional annotation was performed. (B) Luciferase activity of HEK293T cells transfected with ISRE-Luc, together with HA-Ev or increasing amounts of plasmid HA-RTN3, followed by treatment with poly(I:C) (5 μg/ml) or SeV (MOI = 0.1) for 16 or 24 hr. (C) Fluorescence and phase contrast (PH) analyses of HEK293T cells transfected with HA-Ev or HA-RTN3, followed by infection with VSV-eGFP (MOI = 0.05) at the indicated timepoints (left). Scale bar, 100 μm. mRNA levels of VSV viral RNA in the same samples were analyzed by RT-PCR (right). (D) The percentage of eGFP-positive cells in the same samples shown in (C) was analyzed by flow cytometry. (E) Immunoblot analysis of HEK293T cells transfected with HA-Ev or HA-RTN3 followed by infection with VSV-eGFP (MOI = 1) at the indicated timepoints (left). Quantitative comparison of the indicated protein levels analyzed by gray intensity scanning of blots (right). (F) RT-PCR analysis of IFNB1, IFIT2, IFIT1, TNF, IL6, and CCL20 mRNA levels in HEK293T cells transfected with HA-Ev or HA-RTN3 followed by infection with VSV-eGFP (MOI = 1) at the indicated timepoints. In (E), the data are representative of three independent experiments. In (A, B, C, F), the data are shown as the mean values ± SD (n = 3). *, p < 0.0332; **, p < 0.0021; ***, p < 0.0002; and ****, p < 0.0001 by Sidak’s multiple comparisons test.
-
Figure 2—source data 1
Uncropped blots with bands labeled AI file and raw unedited blots files for panel E.
- https://cdn.elifesciences.org/articles/68958/elife-68958-fig2-data1-v2.zip
-
Figure 2—source data 2
Excel file of luciferase reporter assay measurements and description of statistical tests for panel A.
- https://cdn.elifesciences.org/articles/68958/elife-68958-fig2-data2-v2.xlsx
-
Figure 2—source data 3
Excel file of luciferase reporter assay measurements and description of statistical tests for panel B.
- https://cdn.elifesciences.org/articles/68958/elife-68958-fig2-data3-v2.xlsx
-
Figure 2—source data 4
Excel file of RT-PCR measurements and description of statistical tests for panel C.
- https://cdn.elifesciences.org/articles/68958/elife-68958-fig2-data4-v2.xlsx
-
Figure 2—source data 5
Excel file of blots quantification and description of statistical tests for panel E.
- https://cdn.elifesciences.org/articles/68958/elife-68958-fig2-data5-v2.xlsx
-
Figure 2—source data 6
Excel file of RT-PCR measurements and description of statistical tests for panel F.
- https://cdn.elifesciences.org/articles/68958/elife-68958-fig2-data6-v2.xlsx
Figure 2—figure supplement 1
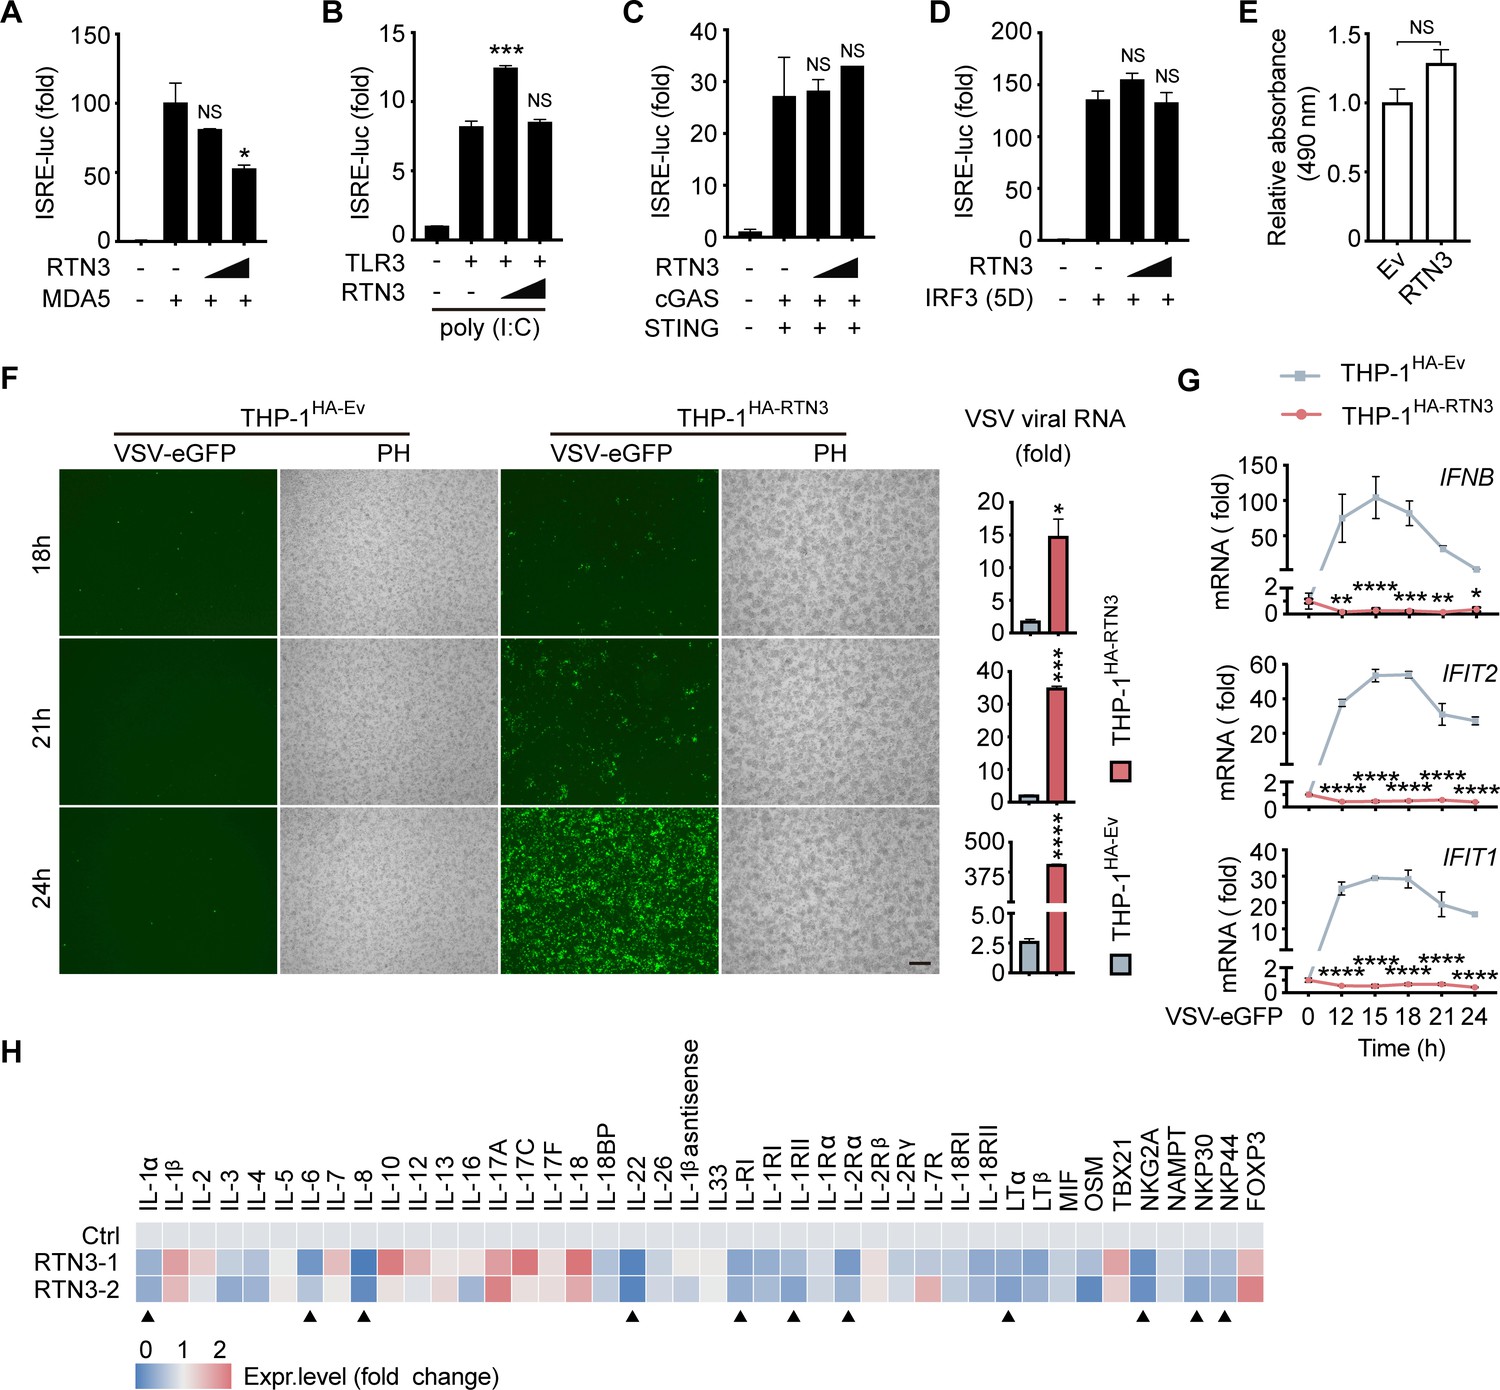
RTN3 suppresses RNA virus-induced antiviral immune and inflammatory responses.
(A) Luciferase activity of HEK293T cells transfected with ISRE-Luc together with HA-Ev or increasing amounts of HA-RTN3 (+, ++) and followed by transfection with MDA5 CARDs as an activator. (B) Luciferase activity of HEK293T cells transfected with ISRE-Luc and Flag-TLR3 together with HA-Ev or increasing amounts of HA-RTN3 and followed by treatment with poly(I:C) (5 μg/ml) for 24 hr. (C) Luciferase activity of HEK293T cells transfected with ISRE-Luc together with HA-Ev or increasing amounts of HA-RTN3 followed by transfection cGAS and STING as activators. (D) Luciferase activity of HEK293T cells transfected with ISRE-Luc together with HA-Ev or increasing amounts of HA-RTN3 followed by transfection IRF3 (5D mutant) as an activator. (E) MTS assay were performed after HEK293T cells were transfected with HA-Ev or HA-RTN3 for 36 hr. (F) Fluorescence and phase contrast (PH) analyses of THP-1 cells stably overexpressing HA-RTN3 (THP-1HA-RTN3) and control THP-1 cells (THP-1HA-Ev) followed by infection with VSV-eGFP (MOI = 0.001) at the indicated timepoints (left). Scale bar, 100 μm. mRNA levels of VSV viral RNA in the same samples were analyzed by RT-PCR (right). (G) RT-PCR detection of IFNB1, IFIT2, and IFIT1 mRNA levels in the same samples shown in (E). (H) RT-PCR detection of mRNA levels for the indicated genes in HEK293T cells transfected with HA-Ev or HA-RTN3. '▲' indicates genes that were significantly downregulated in two independent RTN3-overexpressing samples. Total RNA was extracted 36 hr post transfection. In (A, B, C, D, E, G, H), the data are shown as the mean values ± SD (n = 3). *, p < 0.0332; **, p < 0.0021; ***, p < 0.0002; and ****, p < 0.0001 by Sidak’s multiple comparisons test.
-
Figure 2—figure supplement 1—source data 1
Excel file of luciferase reporter assay measurements and description of statistical tests for panel A.
- https://cdn.elifesciences.org/articles/68958/elife-68958-fig2-figsupp1-data1-v2.xlsx
-
Figure 2—figure supplement 1—source data 2
Excel file of luciferase reporter assay measurements and description of statistical tests for panel B.
- https://cdn.elifesciences.org/articles/68958/elife-68958-fig2-figsupp1-data2-v2.xlsx
-
Figure 2—figure supplement 1—source data 3
Excel file of luciferase reporter assay measurements and description of statistical tests for panel C.
- https://cdn.elifesciences.org/articles/68958/elife-68958-fig2-figsupp1-data3-v2.xlsx
-
Figure 2—figure supplement 1—source data 4
Excel file of luciferase reporter assay measurements and description of statistical tests for panel D.
- https://cdn.elifesciences.org/articles/68958/elife-68958-fig2-figsupp1-data4-v2.xlsx
-
Figure 2—figure supplement 1—source data 5
Excel file of MTS assay measurements and description of statistical tests for panel E.
- https://cdn.elifesciences.org/articles/68958/elife-68958-fig2-figsupp1-data5-v2.xlsx
-
Figure 2—figure supplement 1—source data 6
Excel file of RT-PCR measurements and description of statistical tests for panel F.
- https://cdn.elifesciences.org/articles/68958/elife-68958-fig2-figsupp1-data6-v2.xlsx
-
Figure 2—figure supplement 1—source data 7
Excel file of RT-PCR measurements and description of statistical tests for panel G.
- https://cdn.elifesciences.org/articles/68958/elife-68958-fig2-figsupp1-data7-v2.xlsx
-
Figure 2—figure supplement 1—source data 8
Excel file of RT-PCR measurements and description of statistical tests for panel H.
- https://cdn.elifesciences.org/articles/68958/elife-68958-fig2-figsupp1-data8-v2.xlsx
-
Figure 2—figure supplement 1—source data 9
Excel file of RT-PCR primers list for panel H.
- https://cdn.elifesciences.org/articles/68958/elife-68958-fig2-figsupp1-data9-v2.xlsx
Figure 3
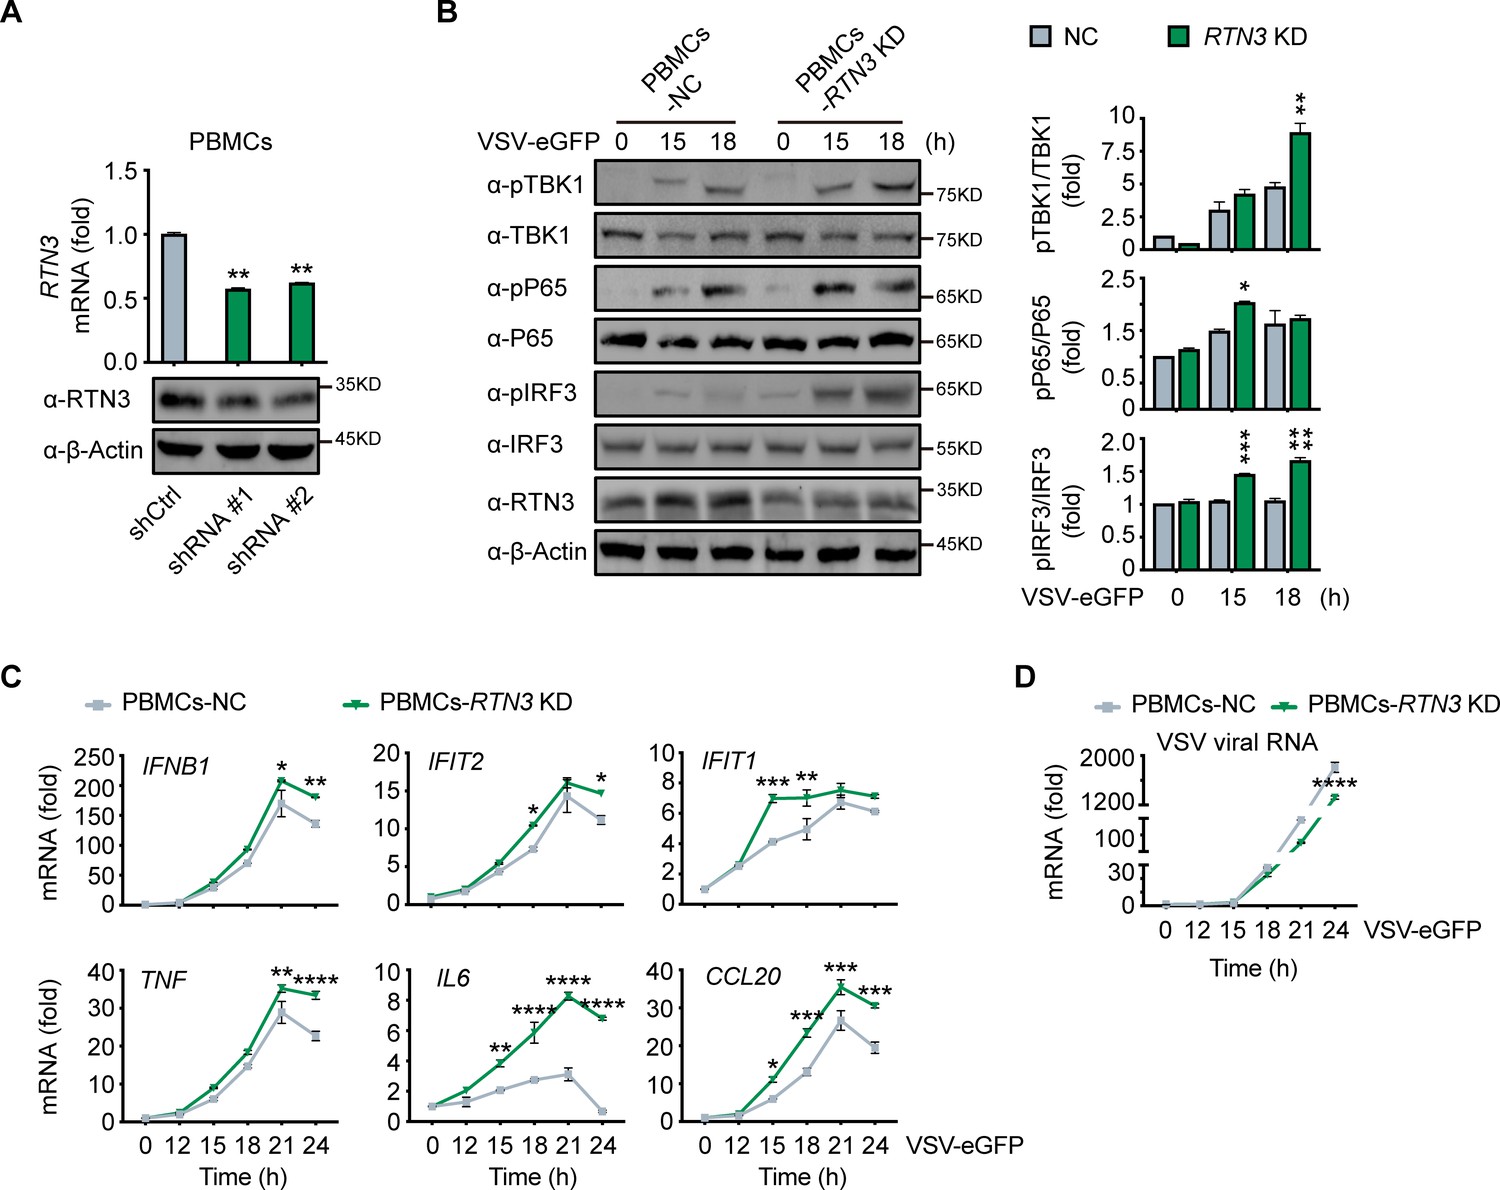
RTN3 knockdown enhances antiviral immune responses.
(A) RT-PCR analysis (top) and immunoblotting analysis (bottom) of RTN3 mRNA levels in PBMCs infected with Ctrl or RTN3 shRNA encoding lentivirus (shCtrl, shRNA #1, shRNA #2) for 12 hr and cultured for additional 24 hr (top). (B) Immunoblotting analys of PBMCs infected with Ctrl or RTN3 shRNA encoding lentivirus for 12 hr and cultured for another 24 hr, followed by infection with VSV-eGFP (MOI = 2) at the indicated timepoints (left). Quantitative comparison of the indicated protein levels was analyzed by gray intensity scanning of blots and is shown (right). (C–D) RT-PCR analysis of IFNB1, IFIT2, IFIT1, TNF, IL6, and CCL20 mRNA levels (C) and VSV viral genomic RNA mRNA levels (D) in PBMCs infected with Ctrl or RTN3 shRNA encoding lentivirus for 12 hr and cultured for another 24 hr, followed by infection with VSV-eGFP (MOI = 2) at the indicated timepoints. In (B), the data are representative of three independent experiments. In (A, C, D), the data are shown as the mean values ± SD (n = 3). *, p < 0.0332; **, p < 0.0021; ***, p < 0.0002; and ****, p < 0.0001 by Sidak’s multiple comparisons test.
-
Figure 3—source data 1
Uncropped blots with bands labeled AI file and raw unedited blots files for panels A and B.
- https://cdn.elifesciences.org/articles/68958/elife-68958-fig3-data1-v2.zip
-
Figure 3—source data 2
Excel file of RT-PCR measurements and description of statistical tests for panel A.
- https://cdn.elifesciences.org/articles/68958/elife-68958-fig3-data2-v2.xlsx
-
Figure 3—source data 3
Excel file of blots quantification and description of statistical tests for panel B.
- https://cdn.elifesciences.org/articles/68958/elife-68958-fig3-data3-v2.xlsx
-
Figure 3—source data 4
Excel file of RT-PCR measurements and description of statistical tests for panel C.
- https://cdn.elifesciences.org/articles/68958/elife-68958-fig3-data4-v2.xlsx
-
Figure 3—source data 5
Excel file of RT-PCR measurements and description of statistical tests for panel D.
- https://cdn.elifesciences.org/articles/68958/elife-68958-fig3-data5-v2.xlsx
Figure 4 with 1 supplement
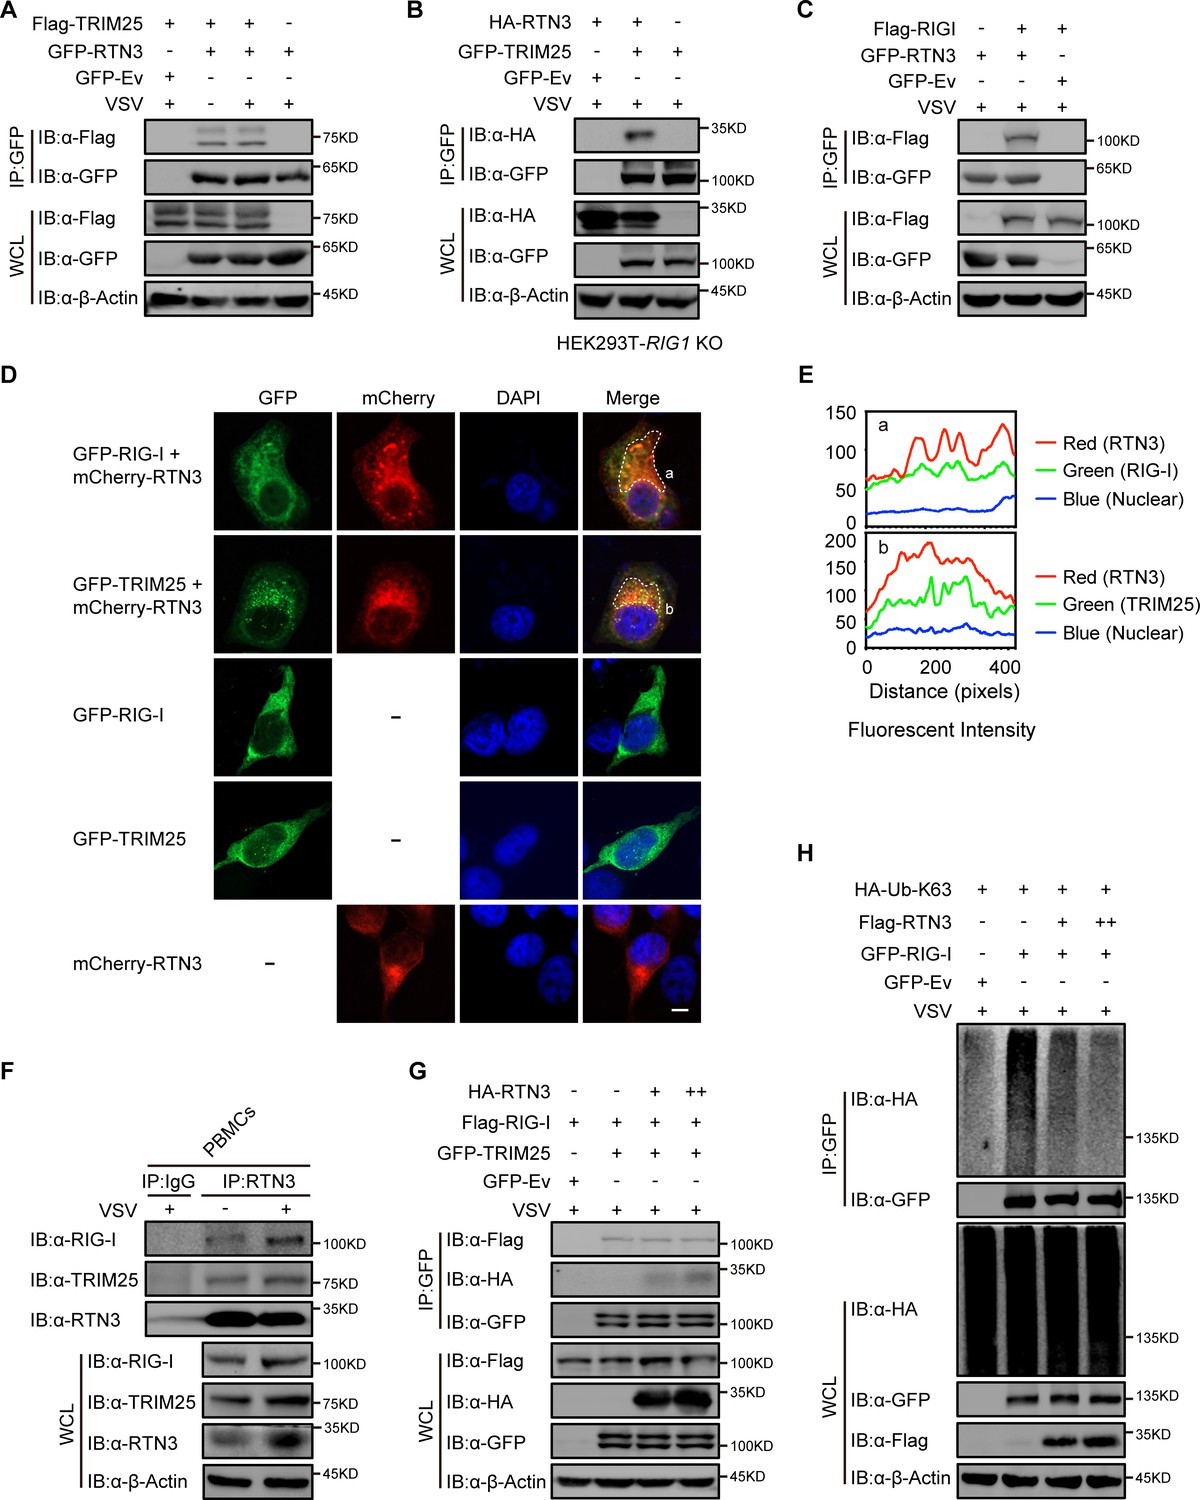
RTN3 separately interacts with TRIM25 and RIG-I and inhibits the K63-linked polyubiquitination of RIG-I.
(A) Coimmunoprecipitation (CoIP) and immunoblot analyses of HEK293T cells transfected with a plasmid encoding TRIM25 (Flag-TRIM25) or a Flag-tagged empty vector (Flag-Ev) together with GFP-tagged RTN3 (GFP-RTN3) or a GFP-tagged empty vector (GFP-Ev) in the indicated groups for 24 hr and followed by infection with VSV (MOI = 1) for 8 hr. (B) CoIP and immunoblot analyses of RIG1 KO HEK293T cells transfected with HA-Ev or HA-RTN3 together with GFP-tagged TRIM25 (GFP-TRIM25) or GFP-Ev for the indicated groups for 24 hr and followed by infection with VSV (MOI = 1) for 8 hr. (C) CoIP and immunoblot analyses of HEK293T cells transfected with a plasmid encoding RIG-I (Flag-RIG-I) or Flag-Ev together with GFP-RTN3 or GFP-Ev in the indicated groups for 24 hr and followed by infection with VSV (MOI = 1) for 8 hr. (D) Confocal microcopy analysis of HeLa cells transfected with GFP-RIG-I and mCherry-tagged RTN3 (mCherry-RTN3) or GFP-TRIM25 with mCherry-RTN3, and GFP-RIG-I, GFP-TRIM25, or mCherry-Ev, respectively. The dotted box (a, b) indicates the colocalization area. Scale bar, 5 μm. (E) Qualitative analysis of the fluorescence intensity of the selected area in (D––a, b). (F) Co-IP and immunoblot analyses of PBMCs infected with VSV-eGFP (MOI = 2) for 18 hr, cell lysates were immunoprecipitated with anti-RTN3 or IgG isotype. (G) IP and immunoblot analyses of HEK293T cells transfected with HA-Ev or increasing amounts of HA-RTN3 (+, ++) together with Flag-RIG-I and GFP-tagged TRIM25 (GFP-TRIM25) or GFP-Ev in the indicated groups for 24 hr and followed by infection with VSV (MOI = 1) for 8 hr. (H) CoIP and immunoblot analyses of HEK293T cells transfected with HA-Ub-K63 and Flag-Ev or increasing amounts of Flag-RTN3 (+, ++) together with GFP-RIG-I or GFP-Ev in the indicated groups for 24 hr and followed by infection with VSV (MOI = 1) for 8 hr. In (A–C) and (F–H), the data are representative of three independent experiments.
-
Figure 4—source data 1
Uncropped blots with bands labeled AI file and raw unedited blots files for panels A, B, C, F, G, and H.
- https://cdn.elifesciences.org/articles/68958/elife-68958-fig4-data1-v2.zip
Figure 4—figure supplement 1
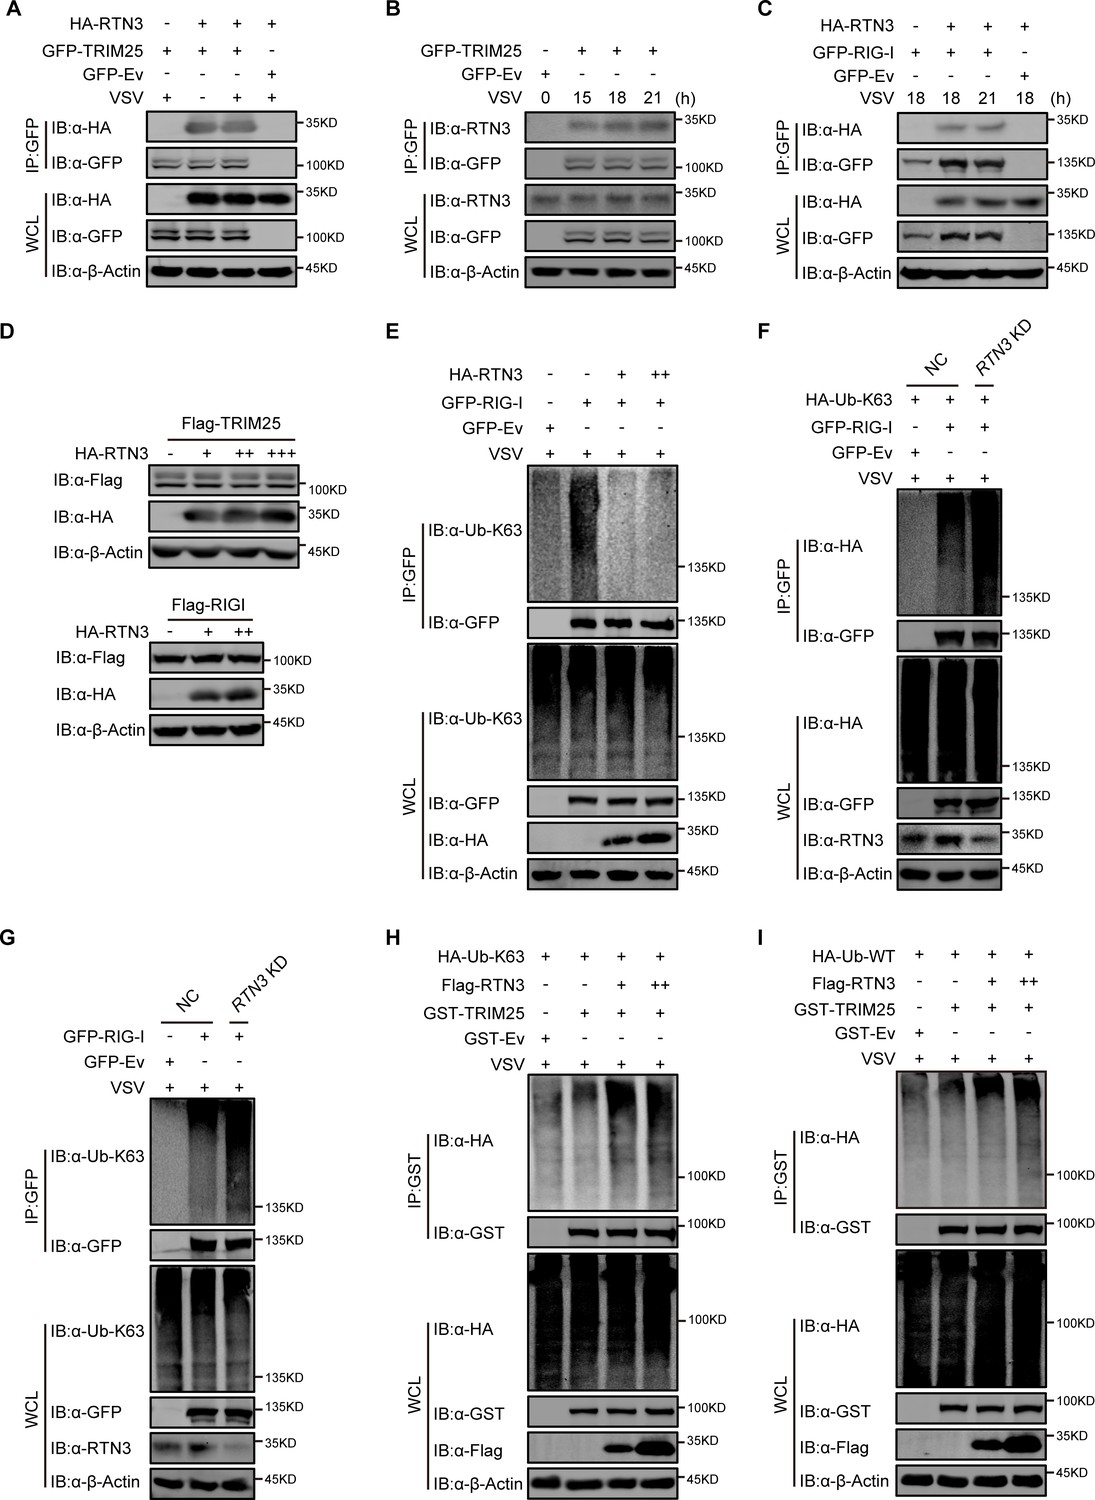
RTN3 has no influence on the protein levels of RIG-I and TRIM25 but affects their K63-polyubiquitination.
(A) CoIP and immunoblot analyses of HEK293T cells transfected with HA-Ev or HA-RTN3 together with GFP tagged TRIM25 (GFP-TRIM25) or GFP-Ev for the indicated groups for 24 hr and followed by infection with VSV (MOI = 1) for 8 hr. (B) Immunoprecipitation (IP) and immunoblot analyses of HEK293T cells transfected with GFP-TRIM25 or GFP-Ev in the indicated groups followed by infection with VSV (MOI = 1) at the indicated timepoints. (C) CoIP and immunoblot analyses of HEK293T cells transfected with HA-RTN3 or HA-Ev together with GFP tagged RIG-I (GFP-RIG-I) or GFP-Ev for the indicated groups for 24 hr and followed by infection with VSV (MOI = 1) for 8 hr. (D) Immunoblot analysis of HEK293T cells transfected with Flag-RIG-I together with HA-Ev or increasing amounts of HA-RTN3 (+, ++) and HEK293T cells transfected with Flag-TRIM25 together with HA-Ev or increasing amounts of HA-RTN3 (+, ++, +++). (E) CoIP and immunoblot analyses of HEK293T cells transfected with HA-Ev or increasing amounts of HA-RTN3 (+, ++) together with GFP-RIG-I or GFP-Ev in the indicated groups for 24 hr and followed by infection with VSV (MOI = 1) for 8 hr. (F) CoIP and immunoblot analyses of HEK293T cells infected with Ctrl or RTN3 shRNA encoding lentivirus for 12 hr and cultured for another 24 hr followed by transfection with HA-Ub-K63 and GFP-RIG-I or GFP-Ev for the indicated groups for 24 hr and followed by infection with VSV (MOI = 1) for 8 hr. (G) CoIP and immunoblot analyses of HEK293T cells infected with Ctrl or RTN3 shRNA encoding lentivirus for 12 hr and cultured for another 24 hr followed by transfection with GFP-RIG-I or GFP-Ev for the indicated groups for 24 hr and followed by infection with VSV (MOI = 1) for 8 hr. (H) CoIP and immunoblot analyses of HEK293T cells transfected with HA-Ub-K63 and Flag-Ev or increasing amounts of Flag-RTN3 (+, ++) together with GST-tagged TRIM25 (GST-TRIM25) or GST-Ev in the indicated groups for 24 hr and followed by infection with VSV (MOI = 1) for 8 hr. (I) CoIP and immunoblot analyses of HEK293T cells transfected with HA-Ub-WT and Flag-Ev or increasing amounts of Flag-RTN3 (+, ++) together with GST-TRIM25 or GST-Ev for the indicated groups for 24 hr and followed by infection with VSV (MOI = 1) for 8 hr. In (A–I), the data are representative of three independent experiments.
-
Figure 4—figure supplement 1—source data 1
Uncropped blots with bands labeled AI file and raw unedited blots files for panels A, B, C, D, E, F, G, H, and I.
- https://cdn.elifesciences.org/articles/68958/elife-68958-fig4-figsupp1-data1-v2.zip
Figure 5 with 1 supplement
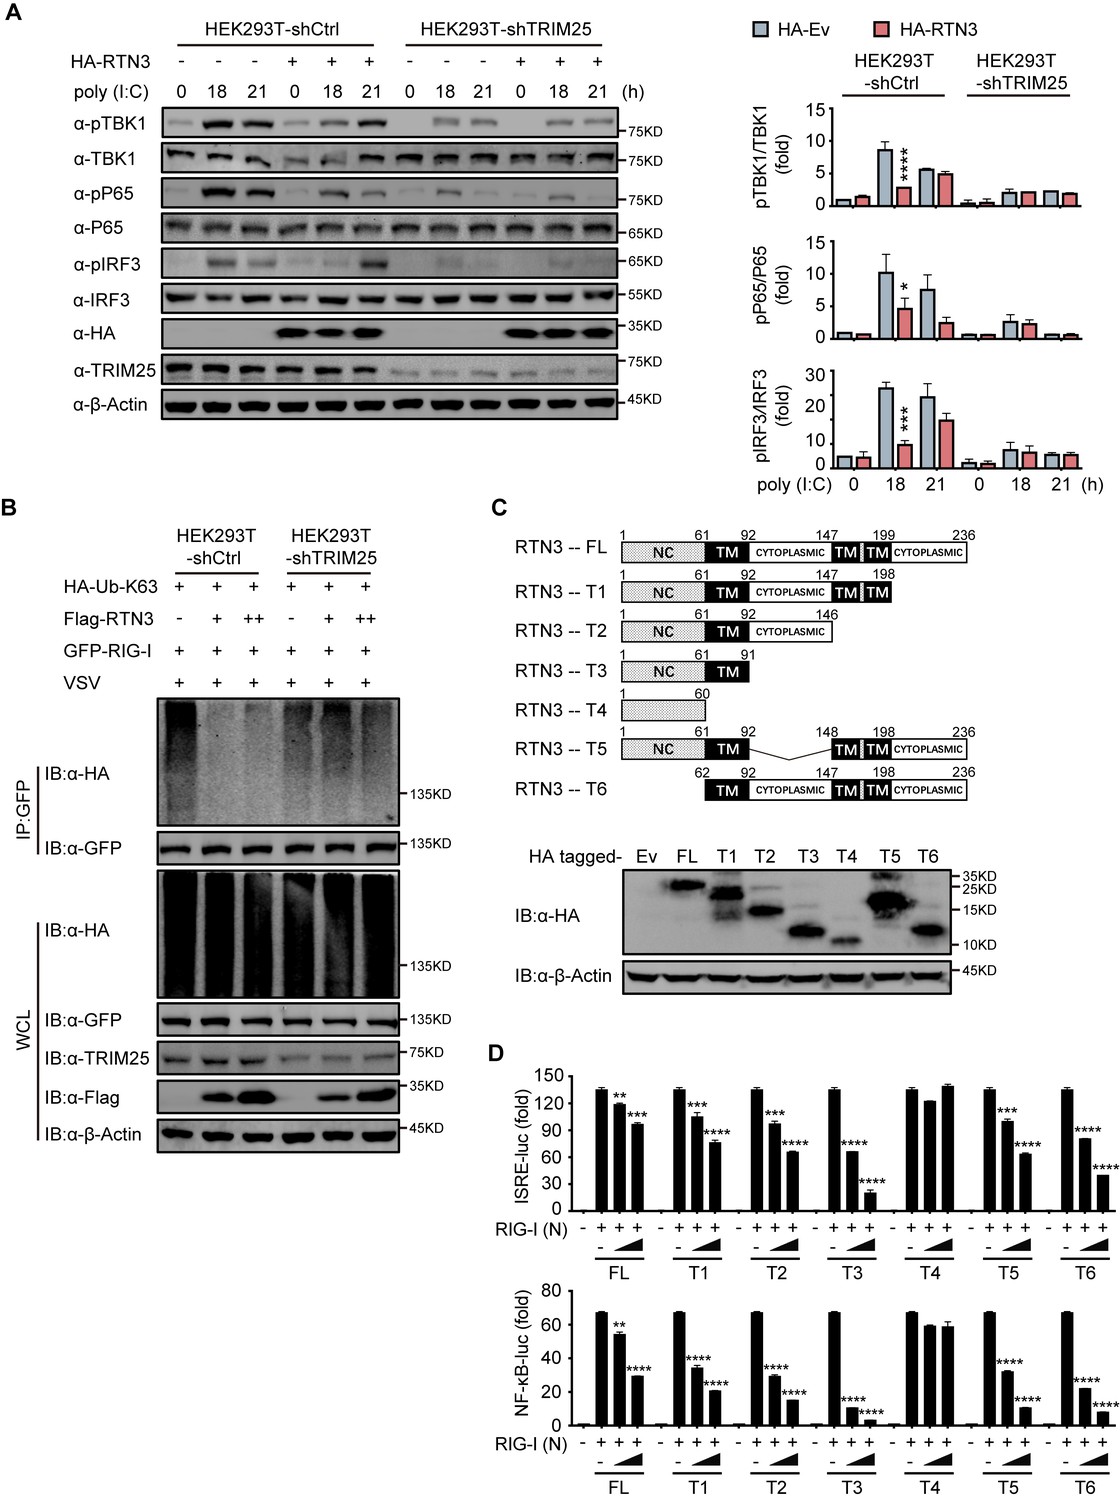
RTN3-mediated inhibition of antiviral responses is TRIM25-dependent.
(A) Immunoblot analysis of control HEK293T cells (HEK293T-shCtrl) and TRIM25 knockdown HEK293T cells (HEK293T-shTRIM25) transfected with HA-Ev or HA-RTN3 and followed by treated with poly(I:C) (5 μg/ml) at the indicated timepoints. (left). Quantitative comparison of the indicated protein levels in (A) analyzed by gray intensity scanning of blots (right). (B) CoIP and immunoblot analysis of HEK293T-shCtrl and HEK293T-shTRIM25 cells transfected with HA-Ub-K63 and increasing amounts of Flag-RTN3 (+, ++) or Flag-Ev together with GFP-RIG-I or GFP-Ev in the indicated groups for 24 hr and followed by infection with VSV (MOI = 1) for 8 hr. (C) The structure of RTN3 and its truncated mutants. Noncytoplasmic domain (NC), transmembrane domain (TM), full length (FL), truncated (T) (top). Immunoblot analysis of HEK293T cells transfected with HA-Ev or HA-tagged truncated mutants for 24 hr (bottom). (D) Luciferase activity of HEK293T cells transfected with ISRE-Luc (top) and NF-κB-Luc (bottom) together with HA-Ev or increasing amounts (wedge) of HA-RTN3 and its truncated mutants and followed by transfection of RIG-I (N) as an activation of the pathway. In (A, B), the data are representative of three independent experiments. In (D), the data are shown as the mean values ± SD (n = 3). *, p < 0.0332; **, p < 0.0021; ***, p < 0.0002; and ****, p < 0.0001 by Sidak’s multiple comparisons test.
-
Figure 5—source data 1
Uncropped blots with bands labeled AI file and raw unedited blots files for panels A, B, and C.
- https://cdn.elifesciences.org/articles/68958/elife-68958-fig5-data1-v2.zip
-
Figure 5—source data 2
Excel file of blots quantification and description of statistical tests for panel A.
- https://cdn.elifesciences.org/articles/68958/elife-68958-fig5-data2-v2.xlsx
-
Figure 5—source data 3
Excel file of luciferase reporter assay measurements and description of statistical tests for panel D.
- https://cdn.elifesciences.org/articles/68958/elife-68958-fig5-data3-v2.xlsx
Figure 5—figure supplement 1
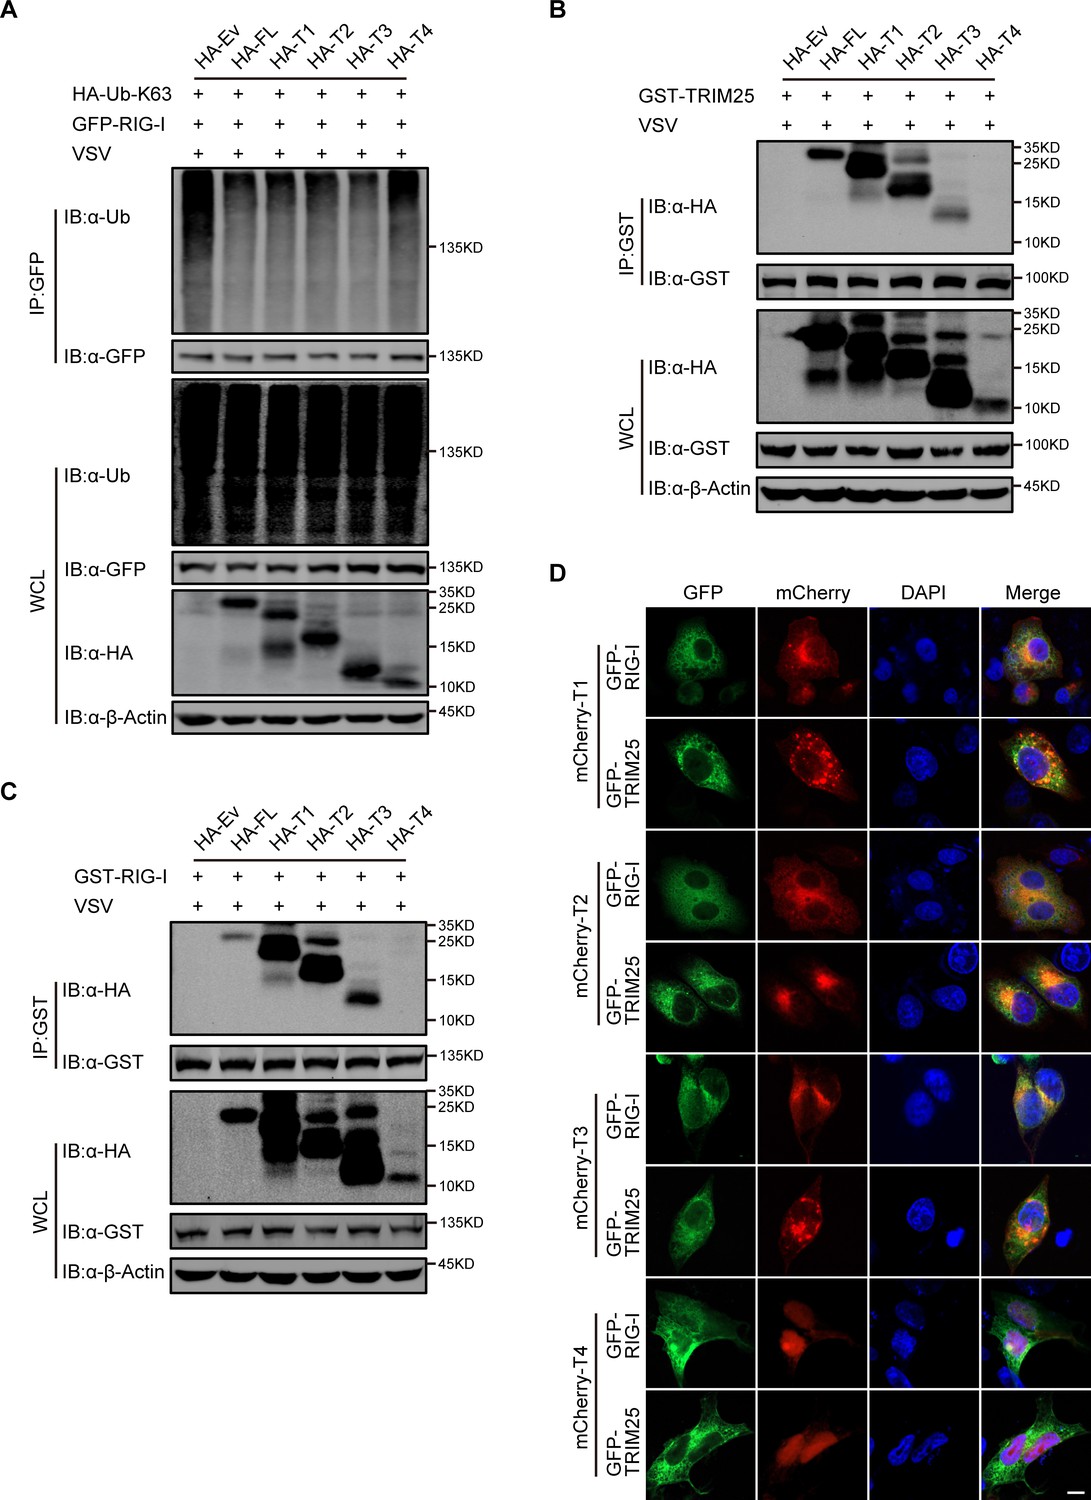
RTN3 inhibitory activity requires its transmembrane domain 1.
(A) CoIP and immunoblot analyses of HEK293T cells transfected with HA-Ub-K63, HA-RTN3 and its truncated mutants as in (A) together with GFP-RIG-I or GFP-Ev for the indicated groups for 24 hr and followed by infection with VSV (MOI = 1) for 8 hr. (B) CoIP and immunoblot analyses of HEK293T cells transfected with HA-RTN3 and its truncated mutants as in (Figure 4C) together with GST-TRIM25 or GST-Ev for the indicated groups for 24 hr and followed by infection with VSV (MOI = 1) for 8 hr. (C) CoIP and immunoblot analyses of HEK293T cells transfected with HA-RTN3 and its truncated mutants as in (Figure 4C) together with GST-RIG-I or GST-Ev for the indicated groups for 24 hr and followed by infection with VSV (MOI = 1) for 8 hr. (D) Confocal microcopy analysis of HeLa cells transfected with GFP-RIG-I and mCherry-tagged RTN3 truncated mutants (mCherry-T1, T2, T3, T4) or GFP-TRIM25 with mCherry-RTN3 truncated mutants. Scale bar, 5 μm. In (A–C), the data are representative of three independent experiments.
-
Figure 5—figure supplement 1—source data 1
Uncropped blots with bands labeled AI file and raw unedited blots files for panel A, Band C.
- https://cdn.elifesciences.org/articles/68958/elife-68958-fig5-figsupp1-data1-v2.zip
Figure 6 with 1 supplement
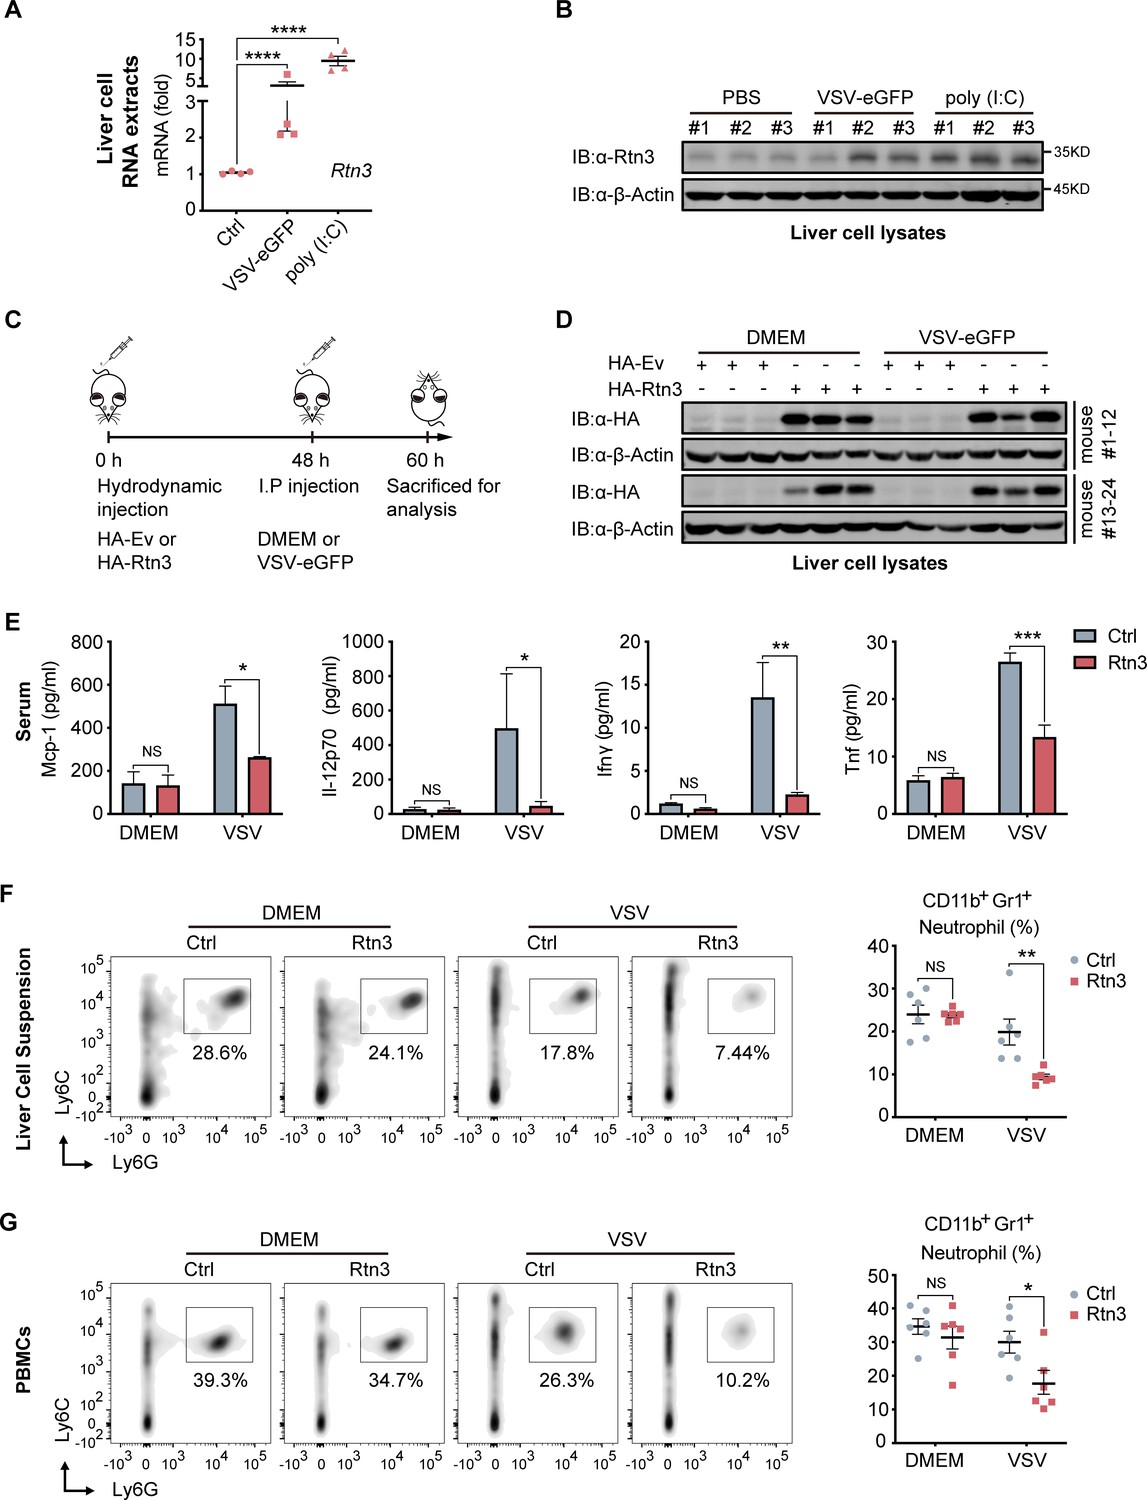
RTN3 overexpression suppresses antiviral immune responses in mice.
(A) mRNA levels of Rtn3 were detected by RT-PCR in liver cells from mice treated with PBS, poly(I:C) (400 µg/mouse) or VSV-eGFP (1×10⁷ PFU/g/mouse) for 12 hr. (B) Immunoblot analysis of liver cell lysates of the same samples shown in (A), with ‘# number’ indicating individual mice. (C) Timeline of in vivo experiments. For plasmid hydrodynamic injection, 20 µg/mouse; for viral infection (intraperitoneal injection), 1×10⁷ PFU g−1/mouse VSV (VSV-eGFP) or 600 µl DMEM /mouse. (D) Immunoblot analysis of liver cell lysates from the same samples shown in (C). (E) Protein levels of Mcp-1, IL-12p70, Ifn-γ, and Tnf-α in serum samples from the mice shown in (C) were measured by flow cytometry using a BD CBA Mouse Inflammation kit. (F) The percentage of neutrophils in liver cell suspensions from the same mice shown in (C) was detected by flow cytometry. The density graph indicates the cell population groups for each mouse (left), and the percentage comparison for all mice is shown in the scatterplot (right). (G) The percentage of neutrophils among PBMCs from the same mice as in (C) was detected by flow cytometry. The density graph indicates the cell population grouped of each mouse (left), and the percentage comparison for all mice is shown in the scatterplot (right). In (A, E, F, G), the data are shown as the mean values ± SD (n = four in A, n = six in E-G). *, p < 0.0332; **, p < 0.0021; ***, p < 0.0002; and ****, p < 0.0001 by Sidak’s multiple comparisons test.
-
Figure 6—source data 1
Uncropped blots with bands labeled AI file and raw unedited blots files for panels B and D.
- https://cdn.elifesciences.org/articles/68958/elife-68958-fig6-data1-v2.zip
-
Figure 6—source data 2
Excel file of CBA Mouse Inflammation Kit measurements and description of statistical tests for panel E.
- https://cdn.elifesciences.org/articles/68958/elife-68958-fig6-data2-v2.xlsx
Figure 6—figure supplement 1
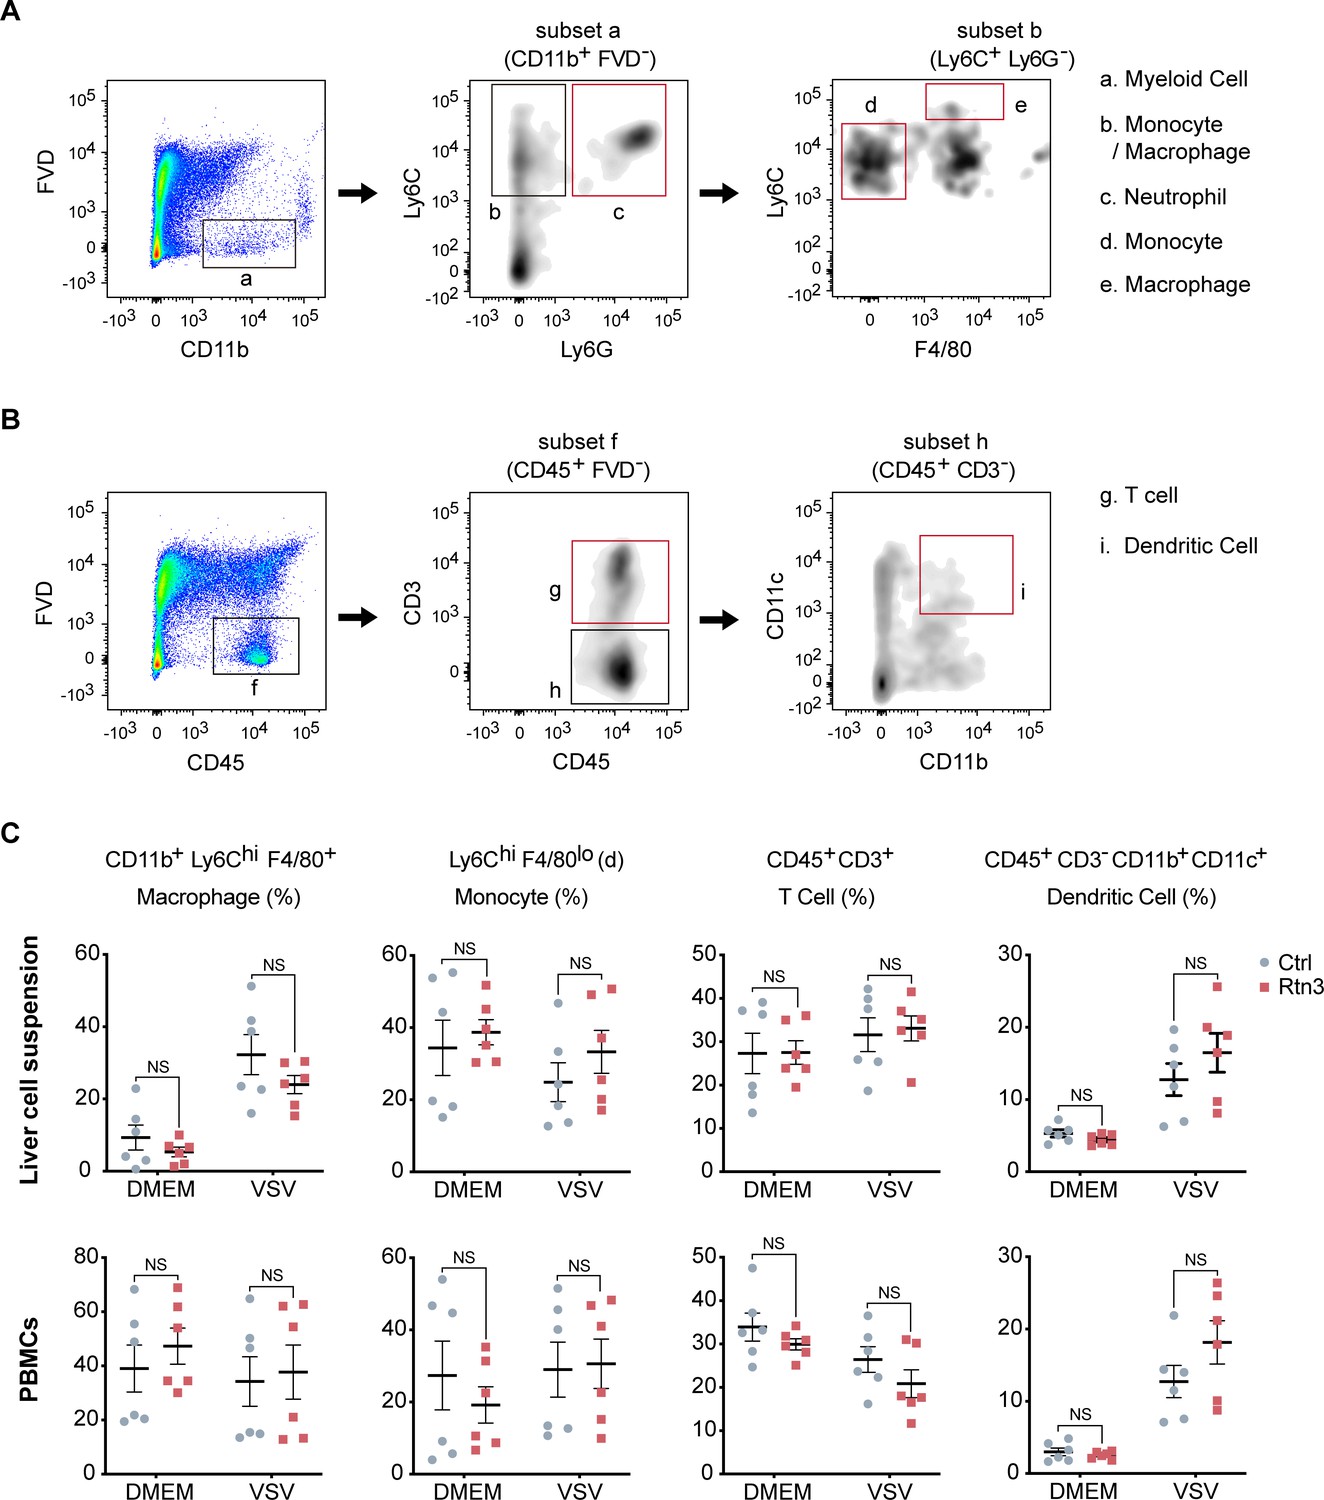
Determination of hydrodynamic injection efficiency and flow cytometry analysis of lymphocytes.
(A–B) Flow cytometry analysis for grouping of liver cell suspension and PBMCs from the same samples shown in (Figure 5F and G). Black and red boxes indicate the analyzed populations. (C) Macrophage, monocyte, T cell, and dendritic cell populations in the liver cell suspensions and PBMCs from the same samples as shown in (Figure 5F and G) were detected by flow cytometry and are presented as a scatterplot. In (C), the data are shown as the mean values ± SEM (n = 6). *, p < 0.0332; **, p < 0.0021; ***, p < 0.0002; and ****, p < 0.0001 by Sidak’s multiple comparisons test.
Figure 7 with 1 supplement
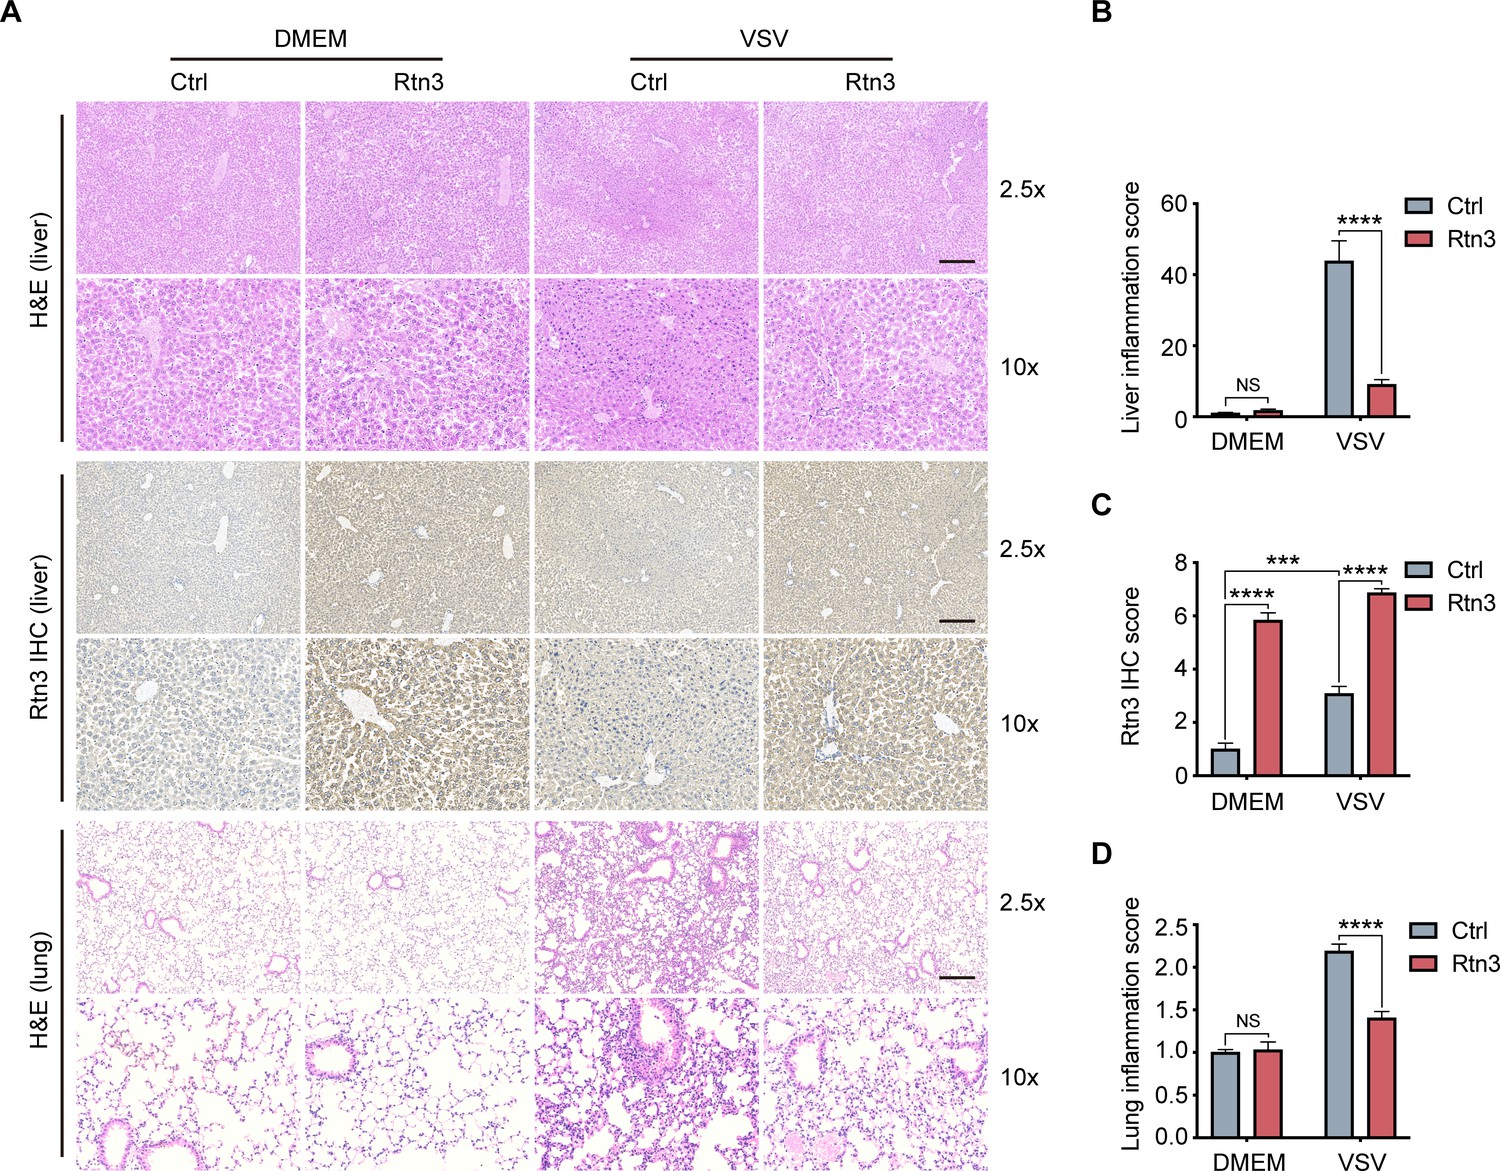
Rtn3 overexpression promotes inflammation resolution in mice.
(A) Microcopy analysis of liver and lung tissue sections from the same mice as in (Figure 5C) with hematoxylin and eosin (H and E) staining, and HA-Rtn3 exotic expression was visualized by immunohistochemical staining (IHC). (B) Inflammation scores of liver tissue sections (n=4, 4, 4, 4) from the same mice shown in (A). The data were obtained and analyzed using ImageJ and visualized with GraphPad Prism 8. (C) IHC score assessment of liver tissue sections as in (A, middle), data was obtained and calculated with Image J plugin ‘IHC Profiler’ (D) Inflammation scores of lung tissue sections (n=4, 4, 4, 4) from the same mice shown in (A). The data were obtained and analyzed using ImageJ and visualized with GraphPad Prism 8. In (B–D), data are shown as the mean values ± SD (n = 4). *, p < 0.0332; **, p < 0.0021; ***, p < 0.0002; ****, p < 0.0001; by Sidak’s multiple comparisons test.
-
Figure 7—source data 1
Excel file of inflammation scores and description of statistical tests for panel B.
- https://cdn.elifesciences.org/articles/68958/elife-68958-fig7-data1-v2.xlsx
-
Figure 7—source data 2
Excel file of IHC scores and description of statistical tests for panel C.
- https://cdn.elifesciences.org/articles/68958/elife-68958-fig7-data2-v2.xlsx
-
Figure 7—source data 3
Excel file of inflammation scores and description of statistical tests for panel D.
- https://cdn.elifesciences.org/articles/68958/elife-68958-fig7-data3-v2.xlsx
Figure 7—figure supplement 1
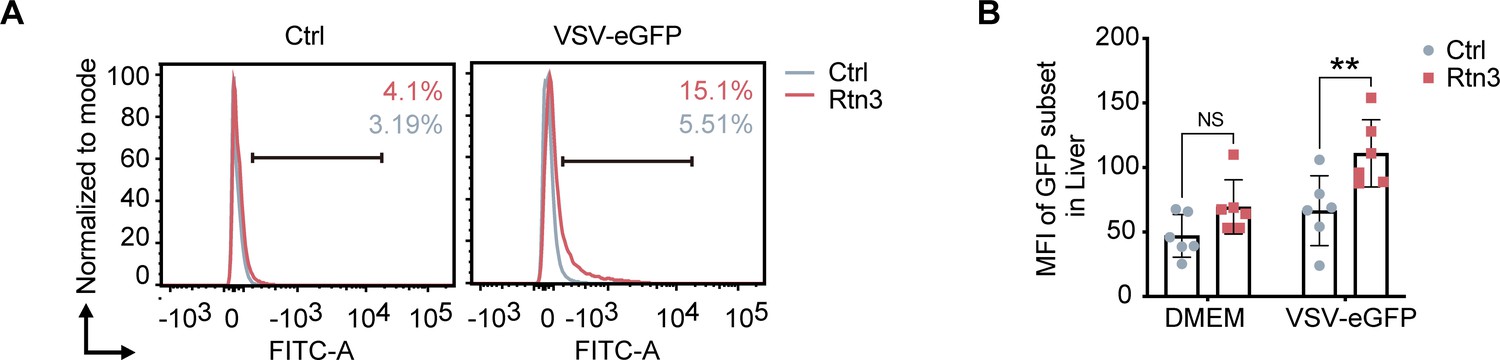
Viral infection in the liver increases upon RTN3 overexpression.
(A–B) The EGFP-positive percentage in the liver cell suspensions and the fluorescent intensity for the same samples shown in Figure 5F and G were analyzed by flow cytometry. In (B), the data are shown as the mean values ± SEM (n = 6). *, p < 0.0332; **, p < 0.0021; ***, p < 0.0002; and ****, p < 0.0001 by Sidak’s multiple comparisons test.
Figure 8

The working model of the inhibition of RIG-I mediated antiviral responses by RTN3 Upon RNA virus infection, the RIG-I signalosome is activated by TRIM25-mediated K63-linked polyubiquitination, and then triggers IRF3 and NF-κB activation and the expression of interferon, cytokines and inflammatory factors.
On the other hand, RTN3 is up-regulated by acute viral infection and interferon/inflammatory factors in an ER stress-dependent manner. RTN3 is subsequently aggregated on the endoplasmic reticulum, interacts with RIG-I and TRIM25, rapidly diminishes the K63-linked polyubiquitination of RIG-I and hence suppresses antiviral immune and inflammatory responses. The inflammatory response is consequently mitigated and the resolution of acute inflammation is initiated.
Additional files
Download links
A two-part list of links to download the article, or parts of the article, in various formats.
Downloads (link to download the article as PDF)
Open citations (links to open the citations from this article in various online reference manager services)
Cite this article (links to download the citations from this article in formats compatible with various reference manager tools)
RTN3 inhibits RIG-I-mediated antiviral responses by impairing TRIM25-mediated K63-linked polyubiquitination
eLife 10:e68958.
https://doi.org/10.7554/eLife.68958


