Spatially patterned excitatory neuron subtypes and projections of the claustrum

  1. Sarah R Erwin
  2. Brianna N Bristow
  3. Kaitlin E Sullivan
  4. Rennie M Kendrick
  5. Brian Marriott
  6. Lihua Wang
  7. Jody Clements
  8. Andrew L Lemire
  9. Jesse Jackson
  10. Mark S Cembrowski  Is a corresponding author
  1. Department of Cellular and Physiological Sciences, Life Sciences Institute, University of British Columbia, Canada
  2. Neuroscience and Mental Health Institute, University of Alberta, Canada
  3. Janelia Research Campus, Howard Hughes Medical Institute, United States
  4. Department of Physiology, University of Alberta, Canada
  5. Djavad Mowafaghian Centre for Brain Health, University of British Columbia, Canada
  6. School of Biomedical Engineering, University of British Columbia, Canada

Abstract

The claustrum is a functionally and structurally complex brain region, whose very spatial extent remains debated. Histochemical-based approaches typically treat the claustrum as a relatively narrow anatomical region that primarily projects to the neocortex, whereas circuit-based approaches can suggest a broader claustrum region containing projections to the neocortex and other regions. Here, in the mouse, we took a bottom-up and cell-type-specific approach to complement and possibly unite these seemingly disparate conclusions. Using single-cell RNA-sequencing, we found that the claustrum comprises two excitatory neuron subtypes that are differentiable from the surrounding cortex. Multicolor retrograde tracing in conjunction with 12-channel multiplexed in situ hybridization revealed a core-shell spatial arrangement of these subtypes, as well as differential downstream targets. Thus, the claustrum comprises excitatory neuron subtypes with distinct molecular and projection properties, whose spatial patterns reflect the narrower and broader claustral extents debated in previous research. This subtype-specific heterogeneity likely shapes the functional complexity of the claustrum.

Introduction

The claustrum has been implicated in a variety of functions and behaviors, including attention (Atlan et al., 2018; Goll et al., 2015; Smith et al., 2019), impulsivity (Liu et al., 2019), sleep (Narikiyo et al., 2020; Norimoto et al., 2020; Renouard et al., 2015), and the integration of information to support consciousness (Crick and Koch, 2005; Smythies et al., 2012). To determine the mechanistic contributions of the claustrum to these putative functions, it is essential to understand both the intrinsic organization of claustrum neurons, as well as how this organization relates to connectivity and function (Edelstein and Denaro, 2004). However, such an interpretation is challenged by the fact that even the precise anatomical boundaries of the claustrum are a matter of debate (Dillingham et al., 2019; Smith et al., 2019).

Here, utilizing a multimodal cell typing approach, we sought to understand the extent of heterogeneity within the excitatory claustrum neuron population and relate this to local boundaries and long-range projections. Beginning with single-cell RNA sequencing, we identified two discrete populations of excitatory claustral neurons. To map the topography of these populations, we used multiplexed single-molecule fluorescent in situ hybridization, revealing core and shell claustral neuron subtypes that were transcriptionally distinguishable relative to surrounding cortical neurons. Combining this with multicolor retrograde tracing, we revealed a spatial organization of distinct cortical-projecting claustral populations that mapped onto the identified core and shell subtypes. This work demonstrates that the claustrum consists of heterogeneous populations of excitatory neurons that are topographically organized and project to functionally dissociable cortical regions, suggesting subtype-specific functionality of excitatory claustral neurons. To facilitate future research analyzing claustral cell-type-specific structure and function, data and analysis tools from this study are available via our interactive web portal (http://scrnaseq.janelia.org/claustrum).

Results

scRNA-seq reveals discrete excitatory neuron subtypes within the claustrum

We began by using single-cell RNA sequencing (scRNA-seq) to understand the transcriptomic organization of the claustrum. From claustral microdissections from four mice, we manually harvested 1112 cells based on a combination of unbiased blind selection of cells and selection of specific labeled projections (to either the lateral entorhinal cortex [LEC] or retrosplenial cortex [RSC]; see Materials and methods). After library preparation, sequencing, and filtering, we retained a total of 1011 excitatory neurons for analysis (n = 478 cells blindly selected; n = 286 and 247 cells projecting to the LEC and RSC, respectively).

We initially examined this dataset agnostic to any projection-specific information. Combining UMAP nonlinear dimensionality reduction (McInnes et al., 2018) with Louvain graph-based clustering (Stuart et al., 2019) revealed that cells broadly conformed to three transcriptomically separated clusters (Figure 1A; also seen in t-SNE: Figure 1—figure supplement 1A). These clusters were all associated with expression of excitatory neuronal markers (Figure 1B) and were found across the anterior-posterior axis and across animals (Figure 1—figure supplement 1B,C). In seeking to assign transcriptomic phenotypes to these cells, we noted one cluster (‘Cluster 1’) was enriched for the claustrum marker gene Synpr (Binks et al., 2019; Wang et al., 2017). This cluster and a second cluster (‘Cluster 2’) exhibited enriched expression of other claustrum marker genes (e.g., Gnb4) relative to the third cluster (‘Cluster 3’) (Figure 1C), with Cluster 2 also showing uniquely expressed marker genes (e.g., Slc30a3; Figure 1D). Conversely, Cluster 3 was enriched for markers of excitatory cortical populations (e.g., the layer 6b marker Ctgf and the layer 6a marker Sla) (Tasic et al., 2016; Tasic et al., 2018), suggesting a cortical phenotype (Figure 1C). Each cluster also exhibited enriched expression of many other genes associated with neuronal function (Figure 1E), suggesting structural and functional heterogeneity between these three clusters (for full lists of differentially expressed genes, see Supplementary files 1–3).

Figure 1 with 4 supplements see all
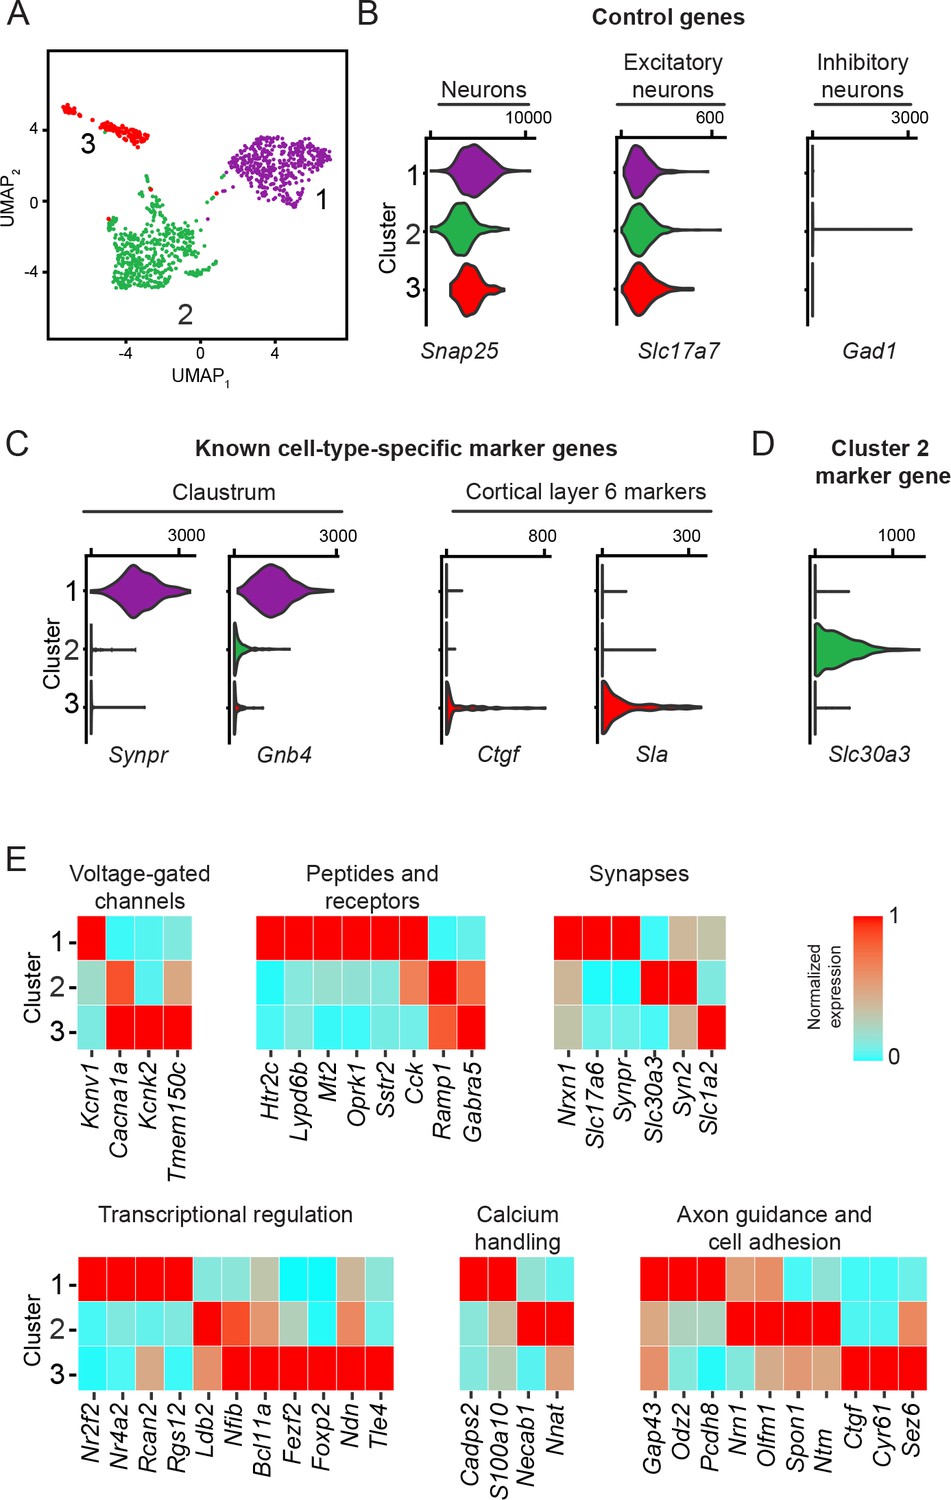
Excitatory claustrum-occupying cells are separable into discrete transcriptomic populations.

(A) UMAP dimensionality reduction of single-cell transcriptomes. Points denote individual cells, with coloring denoting cluster identity obtained by graph-based clustering. (B) Violin plots illustrating expression of control marker genes, with accompanying values denoting normalized and log-transformed count value associated with right tick mark. (C) As in (B), but for known marker genes of claustrum neurons and layer 6 cortical neurons. (D) As in (B), but for the novel Cluster 2 marker gene Slc30a3. (E) Heatmap illustrating expression of genes associated with neuronal functionality that are enriched or depleted in a cell-type-specific fashion.

Comparison to other scRNA-seq data

To understand our results in the context of other published scRNA-seq data, we next integrated our dataset with existing large-scale datasets that potentially included the claustrum (Saunders et al., 2018; Zeisel et al., 2018). Consistent with the three clusters identified within our dataset, our dataset largely conformed to three distinct locations within the broader cell-type landscape when incorporating published data (Figure 1—figure supplement 2A,B). In particular, Cluster 1 cells occupied an isolated group of Synpr-expressing cells, whereas Cluster 2 cells coarsely occupied a distinct location nearby other datasets, but were also enriched for specific marker genes like Nnat (Figure 1—figure supplement 2C). In agreement with Cluster 2 being non-cortical, these Nnat-expressing Cluster 2 cells were also depleted in Pcp4 expression (Figure 1—figure supplement 3), a gene strongly expressed in deep cortical layers (but with exception of layer 6 intratelencephalic excitatory neurons: Watakabe et al., 2012; Figure 1—figure supplement 4). In collection, this work shows that our scRNA-seq data recapitulates previously described cell types and further suggests new marker genes and specializations that may have been underresolved in previous studies.

Two types of excitatory claustral neurons exist in a core-shell arrangement

As the spatial cell-type-specific organization of the claustrum remains uncertain, we next sought to map our scRNA-seq-identified cell types in a spatial context. To do this, we used multiplexed fluorescent in situ hybridization (mFISH) (Wang et al., 2012), allowing us to map 12 RNA targets at a single-molecule and single-cell resolution (Sullivan et al., 2020). We selected genes that allowed us to grossly identify excitatory neurons (Slc17a7, Slc17a6), cortical markers (Ctgf, Pcp4), classical claustrum markers (Synpr, Lxn, Gnb4), and putative subtype-specific markers from our scRNA-seq dataset (Cdh9, Slc30a3, Gfra1, Nnat, Spon1) (overview of genes in scRNA-seq: Figure 2—figure supplement 1).

We used mFISH to spatially register expression of these 12 genes across anterior, intermediate, and posterior sections of the claustrum (Figure 2A; expansions: Figure 2—figure supplement 2; Video 1; n = 18,957 excitatory neurons from n = 5 animals analyzed). In doing so, we identified a claustrum population with a relatively central core-like location that exhibited expression of Synpr, and a surrounding shell-like population exhibiting expression of Nnat (Figure 2B–D). This organization was present across the anterior-posterior axis (Figure 2—figure supplement 3) as well as across animals (Figure 2—figure supplement 4), and recapitulated gene-expression properties predicted from scRNA-seq (Figure 2—figure supplement 5). Adjacent to these populations were other neuronal subtypes enriched for markers of cortical cells, including a cluster with spatial and transcriptional properties of deep layer 6 cells (i.e., a Ctgf-expressing cluster in the deepest cortical layer). Collectively, these results illustrated that claustrum excitatory neuron subtypes are transcriptionally distinct from neighboring cortical neurons and form a core-shell spatial organization.

Video 1
Example multiplexed fluorescent in situ hybridization image across fine and coarse spatial scales.
Figure 2 with 5 supplements see all
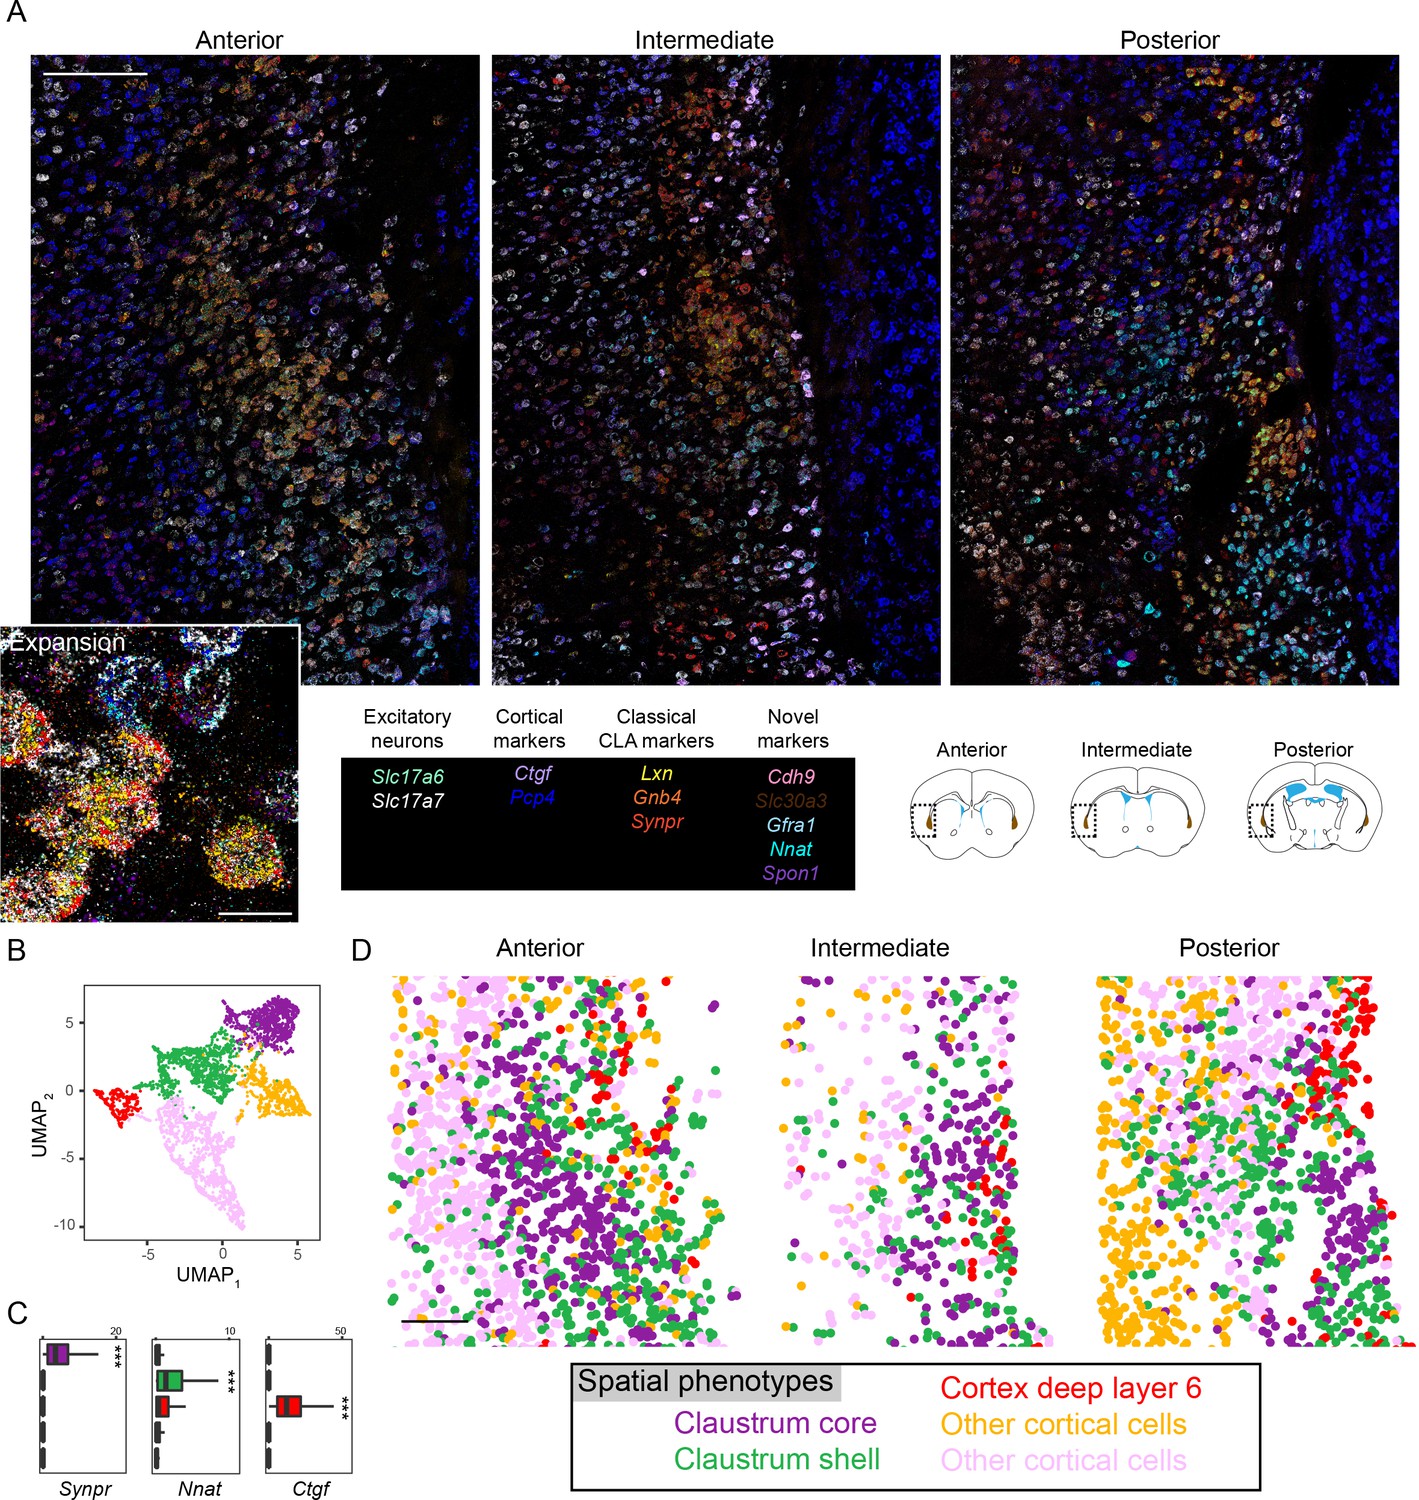
Multiplexed fluorescent in situ hybridization analysis of the claustrum.

(A) Overview of anterior (left), intermediate (middle), and posterior (right) sections of the claustrum. Inset shows expansion of anterior section. Probe list provided at bottom middle, with atlas schematics denoting coronal section locations at bottom right, as well as imaged regions and claustrum definition of atlas (brown). Scale bars: overview: 200 µm; expansion: 20 µm. Atlas schematic adapted from Franklin and Paxinos, 2013. (B) UMAP-based nonlinear dimensionality reduction for Slc17a7-expressing cells (putative excitatory neurons) segmented from (A) and colored according to Leiden cluster identity. (C) Expression of example marker genes for core claustrum (Synpr), shell claustrum (Nnat), and layer 6 neurons (Ctgf). (D) Excitatory neurons from (B) plotted in spatial coordinates. Purple and green clusters respectively occupy the claustrum core and shell. Red neurons occupy deep layer 6 cortex, whereas yellow and pink clusters occupy other cortical regions. Scale bar: 200 µm.

© 2013, Franklin and Paxinos. Atlas schematic adapted from Franklin and Paxinos, 2013. Further reproduction of this figure would need permission from the copyright holder.

Claustrum excitatory subpopulations co-vary with projection target

Does this differential marker gene expression and spatial patterning correspond to distinct claustral projections? To answer this question, we next considered projections to the RSC and LEC, two claustral projections that exhibit minimal overlap (two-color retrograde viral injections: Figure 3A; see also Marriott et al., 2020). We first examined our scRNA-seq dataset with respect to projection targets, where a subset of RSC- and LEC-projecting cells were specifically targeted by retrograde labeling and manual harvesting (Figure 3B). Strikingly, 85% (204/241) of RSC-projecting claustrum cells mapped onto the Synpr-expressing class, whereas 84% (238/282) of LEC-projecting claustrum cells mapped onto the Nnat-expressing class (Figure 3C). Similarly, applying mFISH to retrograde-labeled cells provided complementary evidence that Synpr and Nnat were respectively enriched in RSC-projecting and LEC-projecting cells (representative section: Figure 3D–H; all projection cells: Figure 3I, Figure 3—figure supplement 1), and illustrated that RSC- and LEC-projecting cells were enriched in distinct claustral subtypes (216/259 = 83% of RSC-projecting claustral cells were found in core cluster and 276/324 = 85% of LEC-projecting claustral cells were found in shell cluster, n = 4 and n = 2 animals, respectively, Figure 3J). Thus, distinct excitatory claustrum projection neurons were coherently separable by marker genes, local spatial organization, and long-range projection targets.

Figure 3 with 1 supplement see all
Claustrum transcriptomic subtypes are associated with different projections.

(A) Projections to the retrosplenial cortex (RSC; magenta) and lateral entorhinal cortex (LEC; green) emanate from different spatial locations. Atlas schematic denotes coronal section location, adapted from Franklin and Paxinos, 2013. Scale bar: 200 µm. (B) Left: UMAP visualization of scRNA-seq claustrum transcriptomes, with coloring of individual cells corresponding to their associated projection. Labels denote cluster phenotypes and example marker genes. (C) Counts of RSC-projecting and LEC-projecting cells according to scRNA-seq core and shell phenotypes. (D) Representative multiplexed fluorescent in situ hybridization (mFISH) of intermediate claustrum section, including circuit mapping of long-range projections to the RSC (magenta) and LEC (green). Scale bars: overview: 200 µm; expansion: 20 µm. (E) Cellular segmentation and cluster identification based upon gene expression detected via mFISH, for section shown in (D). (F) UMAP dimensionality reduction of mFISH-characterized cells in (D), colored according to cluster identity as in (E). Putative phenotypes of clusters, based upon marker gene expression, are provided in inset. (G) Locations of neurons projecting to the RSC (magenta), LEC (green), or both (yellow), for section shown in (D). Scale bar: 200 µm. (H) As in (G), but with projections shown in UMAP embedding. (I) mFISH-derived expression of Synpr and Nnat in cells that project to either the RSC (magenta) or LEC (green). Results depict all projection-labeled cells across all sections and animals. (J) As in (C), but for mFISH core and shell phenotypes across all sections and animals.

© 2013, Franklin and Paxinos. Atlas schematic denotes coronal section location, adapted from Franklin and Paxinos, 2013. Further reproduction of this figure would need permission from the copyright holder.

Discussion

A variety of different approaches have previously been used to establish the anatomical definitions of the claustrum. Marker-based approaches using individual genes such as Lxn, Gnb4, and Slc17a6 coarsely demarcate the boundaries of the adult mouse claustrum (Fodoulian et al., 2020; Kitanishi and Matsuo, 2017; Mathur et al., 2009; Peng et al., 2020; Wang et al., 2017; Watakabe et al., 2012), but it is unclear if these different genes all converge upon a monolithic cellular population or embody different claustrum subtypes (and potentially include phenotypically cortical cells: Bruguier et al., 2020; Molnár et al., 2020; Puelles et al., 2016). Retrograde tracing from the cortex has been useful for identifying claustrum projection neurons (Marriott et al., 2020; Minciacchi et al., 1985; Watson et al., 2017; Zingg et al., 2018), but similarly it remains unknown whether projection-labeled claustrum cells are intrinsically homogeneous.

Our approach here, integrating transcriptomic and circuit-level approaches, identified two claustrum cell subtypes that are molecularly distinguishable from surrounding cortex (Figures 1 and 2) and associated with different long-range projection patterns (Figure 3). In previous projection mapping, it has been shown that the RSC and LEC reflect the two most spatially distinct core vs. shell projections (Marriott et al., 2020), and thus it is likely that other claustral projections comprise more of a mosaicism of core and shell transcriptomic phenotypes. Ultimately, this suggests a claustral organizational scheme wherein discretely separate transcriptomic subtypes are biased – but not wholly separable – according to long-range projection targets (Cembrowski and Menon, 2018a).

As the relationship between the claustrum and the nearby deep insular cortex and dorsal endopiriform cortex is often debated (Bruguier et al., 2020; Marriott et al., 2020; Mathur, 2014; Mathur et al., 2009; Smith et al., 2019; Watakabe et al., 2012; Watson et al., 2017; Zingg et al., 2020), it is important to discuss our work in the context of these adjacent regions. Relative to the deep insular cortex, our work here shows a general lack of deep cortical markers for two distinct neuron types, as well as enrichment of genes in these types that are not typically associated with deep cortex (Figure 1C, Figure 1—figure supplements 3 and 4). In conjunction with both of these neuron types showing enrichment of some claustrum marker genes relative to cortical neurons (e.g., Gnb4: Figure 1C), we interpret these transcriptomic cell types as claustrum core and shell neuron subtypes. Relative to the dorsal endopiriform cortex, our scRNA-seq and smFISH validation focused on the atlas-defined spatial extent of the claustrum; thus, future work targeting the dorsal endopiriform cortex will be needed to examine the transcriptomic relationship between these two regions.

Collectively, our results will allow subtype-specific claustral function to be assayed in future experiments by leveraging either marker genes or projection pathways (Cembrowski, 2019). Thus, our findings here will help to guide and inform observational and interventional experiments, and bridge claustrum cell-type identity, structure, and function. To facilitate such experiments and interpretations, we have hosted our scRNA-seq data online in conjunction with analysis and visualization tools (http://scrnaseq.janelia.org/claustrum). This web portal will help to identify how specific genes, cells, and circuits mechanistically drive claustral function and behavior.

Materials and methods

Key resources table
Reagent type (species) or resourceDesignationSource or referenceIdentifiersAdditional information
Sequence-based reagentCdh9 ISH probeAdvanced Cell Diagnostics443221-T1mFISH
Sequence-based reagentCtgf ISH probeAdvanced Cell Diagnostics314541-T2mFISH
Sequence-based reagentSlc17a6 ISH probeAdvanced Cell Diagnostics319171-T3mFISH
Sequence-based reagentLxn ISH probeAdvanced Cell Diagnostics585801-T4mFISH
Sequence-based reagentSlc30a3 ISH probeAdvanced Cell Diagnostics496291-T5mFISH
Sequence-based reagentGfra1 ISH probeAdvanced Cell Diagnostics 431781-T6mFISH
Sequence-based reagentSpon1 ISH probeAdvanced Cell Diagnostics492671-T7mFISH
Sequence-based reagentGnb4 ISH probeAdvanced Cell Diagnostics460951-T8mFISH
Sequence-based reagentNnat ISH probeAdvanced Cell Diagnostics432631-T9mFISH
Sequence-based reagentSynpr ISH probeAdvanced Cell Diagnostics500961-T10mFISH
Sequence-based reagentPcp4 ISH probeAdvanced Cell Diagnostics402311-T11mFISH
Sequence-based reagentSlc17a7 ISH probeAdvanced Cell Diagnostics416631-T12mFISH
Software, algorithmRhttps://www.r-project.orgSCR_001905-
Software, algorithmSeurathttps://satijalab.org/seurat/SCR_007322-
Software, algorithmFijihttps://imagej.net/FijiRRID:SCR_002285 -
OtherrAAV2-retro-CAG-GFPJanelia Viral Core-scRNA-seq
OtherpAAV-CAG-GFPAddgeneRRID:Addgene_37825mFISH
OtherpAAV-CAG-tdTomatoAddgeneRRID:Addgene_59462mFISH

All procedures were approved by the University of British Columbia Animal Care Committee (protocol A18-0267), the University of Alberta Health Science Laboratory Animal Services Animal Care and Use Committee (protocol AUP2711), and the Janelia Institutional Animal Care and Use Committee (protocol 17-159).

Retrograde tracer injections

Request a detailed protocol

Mature C57BL/6 mice of either sex were used for injections, and randomly assigned retrograde injection locations and tracers. Mice were administered carprofen via ad libitum water 24 hr prior to surgery and for 72 hr after surgery to achieve a dose of 5 mg/kg. For surgery, mice were initially anesthetized using 4% isoflurane and maintained with 1.0–2.5% isoflurane. Mice were secured in a stereotaxic frame, with body temperature maintained through an electric heating pad set at 37°C, and lubricant was applied to eyes to prevent drying. Local anesthetic (bupivacaine) was applied locally under the scalp, and an incision along midline was made to access bregma and all injection sites. Craniotomies were marked and manually drilled using a 400 µm dental drill bit according to stereotaxic coordinates. Pulled pipettes (10–20 µm in diameter) were back filled with mineral oil and loaded with virus or tracers. All injections were made using pressure injection, with 200 nL of retrograde tracer (Tervo et al., 2016) being injected. The skin was sutured after completing all injections and sealed. After allowing for sufficient time for retrograde labeling, mice were subsequently sacrificed for either histology, RNA sequencing, or mFISH processing, as described below.

Single-cell RNA sequencing data acquisition and analysis

Request a detailed protocol

We used a manual capture approach to harvest cells from n = 4 mature male C57BL/6 mice. To facilitate microdissection of the claustrum, fluorescent tracers were used to delineate and grossly microdissect the claustrum from horizontal sections. In one animal, retrograde rAAV2-retro-CAG-GFP (Tervo et al., 2016) was injected into the anterior cingulate cortex to facilitate gross microdissection of the claustrum (Jackson et al., 2018), but not used to select for individual cells (i.e., GFP expression was used to microdissect the claustrum but cells were picked blind relative to GFP expression). In this animal, cells from separate anterior and posterior sections were obtained, allowing analysis of potential anterior vs. posterior differences in claustrum gene expression (Figure 1—figure supplement 1B). To build the projection-specific dataset, for the remaining three mice, green and red retrobeads were respectively injected into the LEC and RSC, with this labeling used for gross microdissection as well as to select a subset of projection-specific cells for RNA-seq.

In all cases, manual purification (Hempel et al., 2007) was used to capture cells in capillary needles in approximately 0.1–0.5 mL ACSF cocktail, placed into 8-well strips containing 3 µL of cell collection buffer (0.1% Triton X-100, 0.2 U/µL RNAse inhibitor; Lucigen, Middleton, WI), and generally processed according to published methodology (Cembrowski et al., 2018b; Schretter et al., 2020). Specifically, each strip of cells was flash frozen on dry ice, then stored at –80°C until cDNA synthesis. Cells were lysed by adding 1 µL lysis mix (50 mM Tris pH 8.0, 5 mM EDTA pH 8.0, 10 mM DTT, 1% Tween-20, 1% Triton X-100, 0.1 g/L Proteinase K [Roche], 2.5 mM dNTPs [Takara], and ERCC Mix 1 [Thermo Fisher] diluted to 1e-6) and 1 µL 10 µM barcoded RT primer (E3V6NEXT primer from Soumillon et al., 2014, modified to add a 1 bp spacer before the barcode, extending the barcode length from 6 bp to 8 bp, and designing the 384 barcodes to tolerate one mismatch error correction). The samples were incubated for 5 min at 50°C to lyse the cells, followed by 20 min at 80°C to inactivate the Proteinase K. Reverse transcription master mix (2 µL 5 X buffer; Thermo Fisher Scientific), 2 µL 5 M betaine (Sigma-Aldrich, St. Louis, MO), 0.2 µL 50 µM E5V6NEXT template switch oligo (Integrated DNA Technologies, Coralville, IA) (Soumillon et al., 2014), 0.1 µL 200 U/µL Maxima H- RT (Thermo Fisher Scientific), 0.1 µL 40 U/µL RNasin (Lucigen), and 0.6 µL nuclease-free water (Thermo Fisher Scientific) were added to the approximately 5.5 µL lysis reaction and incubated at 42°C for 1.5 hr, followed by 10 min at 75°C to inactivate reverse transcriptase. PCR was performed by adding 10 µL 2X HiFi PCR mix (Kapa Biosystems) and 0.5 µl 60 µM SINGV6 primer with the following conditions: 98°C for 3 min, 20 cycles of 98°C for 20 s, 64°C for 15 s, 72°C for 4 min, with a final extension step of 5 min at 72°C. Samples were pooled across the plate to yield approximately 2 mL pooled PCR reaction. From this, 500 µL was purified with 300 µL Ampure XP beads (0.6× ratio; Beckman Coulter, Brea, CA), washed twice with 75% ethanol, and eluted in 20 µL nuclease-free water. The cDNA concentration was determined using Qubit High-Sensitivity DNA kit (Thermo Fisher Scientific).

13 plates were analyzed in total, with 600 pg cDNA from each plate of cells used in a modified Nextera XT (Illumina, San Diego, CA) library preparation with 5 µM P5NEXTPT5 primer (Soumillon et al., 2014). The resulting libraries were purified according to the Nextera XT protocol (0.6× ratio) and quantified by qPCR using Kapa Library Quantification (Kapa Biosystems). Three plates were pooled on a NextSeq 550 mid-output flowcell with 26 bases in read 1, 8 bases for the i7 index, and 125 bases in read 2, and the remaining 10 plates were pooled on a NextSeq 550 high-output flowcell with 26 bases in read 1, 8 bases for the i7 index, and 50 bases for read 2. Alignment and count-based quantification of single-cell data was performed by removing adapters, tagging transcript reads to barcodes and UMIs, and aligned to the mouse genome via STAR (Dobin et al., 2013).

In total, 1112 cells were manually harvested and underwent sequencing. Of these initial 1112 cells, 27 putative non-neuronal cells were excluded due to low expression of Snap25 (CPM < 0.001) and 74 additional cells were excluded due to low Slc17a7 (CPM < 1e-10). The remaining 1011 cells exhibit 5.2 ± 1.1 thousand expressed genes/cell from 142 ± 98 thousand reads/cell, mean ± SD. The relatively high abundance of excitatory neurons sampled owed both to the targeted approach for harvesting circuit-labeled cells, as well as the fact that excitatory neurons are relatively abundant relative to interneurons in the claustrum. No blinding or randomization was used for the construction or analysis of this dataset. No a priori sample size was determined for the number of animals or cells to use; note that previous methods have indicated that several hundred cells from a single animal are sufficient to resolve heterogeneity within excitatory neuronal cell types (Cembrowski et al., 2018b; Cembrowski et al., 2018c).

Computational analysis was performed in R (RRID:SCR_001905; R Development Core Team, 2008) using a combination of Seurat v3 (RRID:SCR_007322; Satija et al., 2015; Stuart et al., 2019) and custom scripts (Cembrowski et al., 2018b). To analyze our data, a Seurat object was created via CreateSeuratObject(min.cells = 3, min.features = 200), variable features identified via FindVariableFeatures(selection.method='vst',nfeatures = 2000) and scaled via ScaleData(). Data was processed via RunPCA(), JackStraw(num.replicate = 100), RunTSNE(), FindNeighbors(), FindClusters(resolution = 0.1), and RunUMAP(reduction='pca'), with 30 dimensions used throughout the analysis. This processed Seurat object was then used for downstream analysis. Subpopulation-specific enriched genes obeying pADJ < 0.05 were obtained with Seurat via FindMarkers(), where pADJ is the adjusted p-value from Seurat based on Bonferroni correction. Functionally relevant differentially expressed genes were obtained using FindMarkers(), allowing for both cluster-specific enriched and depleted genes obeying pADJ < 0.05, and manually identified for functional relevance. Raw and processed scRNA-seq datasets have been deposited in the National Center for Biotechnology Information (NCBI) Gene Expression Omnibus under GEO: GSE149495.

To integrate and compare our scRNA-seq data to previously published data, we downloaded data from two previous studies that broadly sampled cortical cells in the mouse brain (Saunders et al., 2018; Zeisel et al., 2018). From Saunders et al., 2018, we downloaded frontal cortex data from F_GRCm38.81.P60Cortex_noRep5_FRONTALonly.raw.dge.txt.gz (from http://dropviz.org) and used a threshold of 16,000 transcripts/cell to extract 2877 total cells. After screening against cells that lacked Snap25 and/or Slc17a7 expression, 2842 putative excitatory neurons were retained for analysis (genes expressed/cell: 4.8 ± 0.6 thousand, mean ± SD; transcripts/cell: 16.5 ± 5.0 thousand, mean ± SD). We used a similar number of cells from Zeisel et al., 2018, obtained from l6_r4_telencephalon_projecting_excitatory_neurons.loom (from http://mousebrain.org/loomfiles_level_L6.html): 3151 cells were obtained using a threshold for 7500 transcripts/cell, with 3141 cells retained after requiring Snap25 and Slc17a7 expression (genes expressed/cell: 3.7 ± 0.4 thousand, mean ± SD; transcripts/cell: 9.6 ± 2.0 thousand, mean ± SD). Integration of these published datasets with our dataset was done in Seurat v3 (Stuart et al., 2019) by creating a Seurat object incorporating all datasets, and then using SplitObject() to split according to original dataset, allowing each dataset to independently undergo normalization and variable feature selection (handled identically to our data). Integration anchors were subsequently identified (via FindIntegrationAnchors()) and used for integration (via IntegrateData()), using 30 dimensions. From here, integrated data underwent scaling, dimensionality reduction, and clustering identically to the method used for our data, with clustering resolution = 2.5 to facilitate comparison between fine clusters associated with the claustrum shell. Statistical significance for adjusted p-values is denoted as follows: ns: p0.05; *p<0.05, **p<0.01, ***p<0.001.

mFISH data acquisition and analysis

Request a detailed protocol

Custom probes for mFISH were purchased from Advanced Cell Diagnostics and were as follows: Cdh9 (443221-T1), Ctgf (314541-T2), Slc17a6 (319171-T3), Lxn (585801-T4), Slc30a3 (496291-T5), Gfra1 (431781-T6), Spon1 (492671-T7), Gnb4 (460951-T8), Nnat (432631-T9), Synpr (500961-T10), Pcp4 (402311-T11), and Slc17a7 (416631-T12). mFISH was generally performed as previously implemented (Sullivan et al., 2020). Briefly, mature male mice were randomly selected for mFISH and were deeply anesthetized with isoflurane and perfused with phosphate buffered saline (PBS) followed by 4% paraformaldehyde (PFA) in PBS. Brains were dissected and post-fixed in 4% PFA for 2–4 hr. Brain sections (20 µm) were made using a cryostat tissue slicer and mounted on glass slides. Slides were subsequently stored at –80°C until use. For use, the tissue underwent pretreatment and antigen retrieval per the User Manual for Fixed Frozen Tissue (Advanced Cell Diagnostics). All 12 probes with unique tails (T1–T12) were hybridized to the tissue, amplified, and the tissue counterstained with DAPI. Using cleavable fluorophores with unique tails (T1–T12), probes were visualized four at a time via an iterative process of imaging, decoverslipping, fluorophore cleaving, and adding the next four targeted fluorophores. mFISH performed on tissue with viral tracing was first counterstained with DAPI, coverslipped with ProLongGold antifade mounting medium, then imaged. The tissue was decoverslipped by soaking in 4× SSC. Following this, standard mFISH protocol was followed, with the antigen retrieval step quenching all endogenous viral fluorescent protein signal and DAPI signal.

mFISH images were acquired with a 63× objective on a SP8 Leica white light laser confocal microscope (Leica Microsystems, Concord, Ontario, Canada). Z-stacks were acquired with a step size of 0.45 µm for each imaging round. Final composite images are pseudocolored maximum intensity projections, including brightness adjustments applied to individual channels uniformly across the entire image, with channels opaquely overlaying one another ordered from highest to lowest expression.

Processing of mFISH images generally followed our previously published analysis pipeline (Sullivan et al., 2020) using Fiji (RRID:SCR_002285; Schindelin et al., 2012). Briefly, the DAPI signal from each round was used to rigidly register probe signals across rounds, followed by nonlinear elastic registration via bUnwarpJ (Arganda-Carreras et al., 2010) to accommodate any nonlinear tissue warping due to decoverslipping. The individual nuclei were then segmented and dilated by a factor of 5 µm to include the surrounding cytosol. The signal from each probe was then binarized by thresholding at the last 0.2–1% of the histogram tail, and then the number of pixels within regions of interest (ROIs) selected from segmentation was summed and normalized to the pixel area of the cell and multiplied by 100. This in effect corresponded to percent area covered (PAC) of the optical space of a cell.

A total of five mature male C57BL/6 mice, each with a relatively anterior, intermediate, and posterior section, were used for mFISH. Four mice had 200 nL retrograde viral injections into the RSC, two of which had additional retrograde viral injections into the LEC. For these injections, retrograde pAAV-CAG-GFP was a gift from Edward Boyden (Addgene viral prep # 37825-AAVrg; http://n2t.net/addgene:37825; RRID:Addgene_37825) and retrograde pAAV-CAG-tdTomato (codon diversified) was a gift from Edward Boyden (Addgene viral prep # 59462-AAVrg; http://n2t.net/addgene:59462; RRID:Addgene_59462). The last remaining mouse had no viral injections. Across these five animals, 33,155 cells in total were imaged. To facilitate analysis of excitatory neurons specifically, a threshold of one PAC of Slc17a7 was required for each cell to be included in analysis, resulting in 18,957 total putative excitatory neurons being used for subsequent analysis. Slc17a7 expression levels were used only for cellular phenotyping, and thus excluded from further analysis.

For analysis, UMAP dimensionality reduction (McInnes et al., 2018) was performed on within-cell normalized PAC values using the umap package (15 nearest neighbors, all other parameters default), and cells were clustered on a per-animal level using a Leiden community detection algorithm (Levine et al., 2015; Traag et al., 2019) via the Monocle package (Cao et al., 2019; Qiu et al., 2017; Trapnell et al., 2014). In general, setting the resolution parameter to a value that produced five clusters yielded strong agreement between UMAP dimensionality reduction and cluster assignments. Marker gene expression was used to assign phenotypes to cells comprising each cluster. For correlating projection targets with mFISH results, cells labeled with fluorescent retrograde tracers were manually identified (n = 739 total across n = 4 animals), done in a blinded fashion relative to mFISH analysis. A small minority of cells that projected to both the LEC and RSC (1.9%: n = 14/739, consistent with Marriott et al., 2020) were excluded when comparing properties of LEC- vs. RSC-projecting neurons. In general, box plots show distribution of gene expression contingent on cluster identity or projection target (hinges denote first and third quartiles, whiskers denote remaining data points up to at most 1.5 * interquartile range, outlier values beyond whiskers are not shown). Mann–Whitney U tests with a Bonferroni correction were used to identify differentially expressed genes, for either a given cluster relative to all other clusters, or in pairwise comparisons, as shown. Statistical significance for adjusted p-values is denoted as follows: ns: p0.05; *p<0.05, **p<0.01, ***p<0.001.

Data availability

Raw and processed scRNA-seq datasets have been deposited in the National Center for Biotechnology Information (NCBI) Gene Expression Omnibus under GEO: GSE149495.

The following data sets were generated
    1. Cembrowski MS
    (2020) NCBI Gene Expression Omnibus
    ID GSE149495. Core-shell organization in the mouse claustrum.

References

    1. Crick FC
    2. Koch C
    (2005) What is the function of the claustrum?
    Philosophical Transactions of the Royal Society of London. Series B, Biological Sciences 360:1271–1279.
    https://doi.org/10.1098/rstb.2005.1661
    1. Edelstein LR
    2. Denaro FJ
    (2004)
    The claustrum: A historical review of its anatomy, physiology, cytochemistry and functional significance
    Cellular and Molecular Biology 50:675–702.
  1. Book
    1. Franklin KBJ
    2. Paxinos G
    (2013)
    Paxinos and Franklin’s The Mouse Brain in Stereotaxic Coordinates (Fourth edition)
    Amsterdam: Academic Press.

Decision letter

  1. Tianyi Mao
    Reviewing Editor; Oregon Health and Science University, United States
  2. Gary L Westbrook
    Senior Editor; Oregon Health and Science University, United States
  3. Li I Zhang
    Reviewer; University of Southern California, United States

In the interests of transparency, eLife publishes the most substantive revision requests and the accompanying author responses.

Acceptance summary:

The authors used single-cell RNA sequencing to examine the molecular properties and axonal-projection targets of cell populations in the claustrum. The observed clusters of single cell RNA profiles reflect excitatory neuronal subtypes and their core-shell arrangements within the claustrum.

Decision letter after peer review:

[Editors’ note: the authors submitted for reconsideration following the decision after peer review. What follows is the decision letter after the first round of review.]

Thank you for submitting your work entitled "Spatially patterned excitatory neuron subtypes and circuits within the claustrum" for consideration by eLife. Your article has been reviewed by 3 peer reviewers, and the evaluation has been overseen by a Reviewing Editor and a Senior Editor. The following individual involved in review of your submission has agreed to reveal their identity: Arpiar Saunders (Reviewer #1).

Our decision has been reached after consultation between the reviewers. Based on these discussions and the individual reviews below, we regret to inform you that your work will not be considered further for publication in eLife.

Summary

The discussion among reviewers and the editors reached a clear consensus regarding the necessary experiments/analyses to strength the main claims regarding the relationship of the potential new cell types and the anatomical features relevant to claustrum function. We view the current interpretation of the results as limited by technical issues and the depth of the analysis. Closing that gap would require softening the claims of cell type discovery along with a more much thorough informatic analyses and likely follow up experiments (based on those re-analyses). eLife policy is not to consider a revision decision if we think that substantial additional experiments or analysis would be necessary to judge the acceptability of the manuscript and/or would require more than several months to complete.

Reviewer #1:

Erwin et al. address the relationship between molecular identity and projection anatomy of neurons in the mouse claustrum using single-cell RNAseq, in situ hybridizations and retrograde labeling. Such "mappings" are of interest to circuit neuroscience for both practical and theoretical reasons. In what ways does a neuron's molecular makeup determine its adult connectivity?

1. The molecular identity(ies) of the "Unknown" yellow cluster (Figures 1 and 3) still remain unknown. The Erwin manuscript implies that these cells make up a distinct cell type of claustrum shell, but the data presented supporting this conclusion are currently weak. The authors state that the "unknown" population is molecularly distinct from both (1) canonical claustrum neurons (Synpr+) and (2) other cortical neuron populations.

Due to the small number of cells sampled and the restriction of that sampling to the area of the claustrum, the first claim requires only that the canonical claustral neuron type be molecularly distinct to be supported. That there is a specialized claustrum neuron type (at the level of the entire cortical mantle or most likely the whole brain) is already quite clear: previous scRNAseq studies (Zeisel et al; Tasic et al; Saunders et al.) have demonstrated such a specialized RNA expression signature, which includes highly selective gene markers that are localized to the claustrum anatomically. The Erwin et al. data also support the claustrum-specific neuronal profile (as judged by heavy overlap of the selective markers from these other studies).

Using in situs, Erwin et al. refine the location of the Synpr+ cell type to claustrum "core". This is the major result of the paper.

The second claim – that the "unknown" cluster represents a 2nd distinct claustrum neuron type specific to the shell – is not well supported given the data at hand. The authors claim that because only 9.1% of Slc30a3+ cells are Pcp4+, the "unknown" cluster is not related to other excitatory cortical neuron types. However, Pcp4+ is not ubiquitously expressed in all Slc17a7+ neuron types (http://dropviz.org/?_state_id_=80467b8fc3286f0b). Moreover, quantitative variation in Pcp4 expression level could also lead to somewhat arbitrary thresholds for counting cells as positive, even with highly sensitive ACD RNA probes. By my eye, the expanded image in Figure 2D looks as if more than 10% of Slc30a3+ cells are Pcp4+ (if counting those cells with low Pcp4 expression; the authors should describe how the in situ data were quantified in the methods and if the representative images are Z-stack projections or single image planes).

More concerning is that when one considers the expression patterns of marker genes from the "unknown" cluster (Idb2, Mef2c, Necab1, Nnat, Nrn1, Olfm1, Spon1, Ramp1, Slc30a3, Syn2) across all of cortical cell types, those markers show very little cell-type-specific enrichment (http://dropviz.org/?_state_id_=4bb18bcc4f50d3cb). These data suggest to me that the "unknown" cluster could be a somewhat heterogenous collection that molecularly resemble other cortical excitatory neuron types. That their RNA profiles clustered together could be a property of their simply being dissimilar to the other more distinct cell types included in the analysis.

The authors can test their claim that "…the core-shell arrangement identified here was consistent with distinct subtypes claustral neurons, rather than reflecting spatial displacement of a cortical cell type" by jointly analyzing their own single cell libraries with much larger datasets describing molecular diversity of glutamatergic neurons across the cortical mantle (Zeisel et al; Tasic et al; Saunders et al). This type of analysis is not computationally prohibitive and could be performed on a decent laptop computer.

For example, if the Erwin and Saunders/Tasic/Zeisel data are co-clustered, and the authors find the cells from the "unknown" split into distinct excitatory clusters, that might suggest the "unknown" cluster is molecularly heterogenous and offer clues as to which cortical cell types functionally form the claustrum shell. Alternatively, the "unknown" cells might cluster together. This would allow an opportunity for cortex-wide differential expression testing to reveal selective markers for the "shell" subtype. (Importantly, the authors should pursue analytical methods (such as LIGER (Welch et al) or CCA (Butler et al.)) that allow their data to be integrated into other datasets without being burdened by platform/experiment specific clustering artifacts).

Non-clustering methods could also be used to attain similar insight.

To be clear, it would be an important observation and not diminish the study if the claustrum "shell" – a region defined anatomically by retrograde labeling – consists of a displaced cortical cell type or types.

More experiments are needed to address the issue of the molecular identity of the "shell" glutamatergic neurons; as it stands now, the claims in the paper are not strongly supported by the data presented.

2. Standard methods for single-cell 3' mRNA counting (e.g. Drop-seq, 10x, InDrop) routinely allow tens or hundreds of thousands of single cell RNA profiles to be sampled. It's unclear why the authors choose to pursue a more low-throughput method of whole-RNA sequencing but then not take advantage of mRNA isoform variation which their data uniquely enable? Single-cell RNAseq datasets describing the canonical claustrum neuron type (Synpr+/Nr4a2+) have been published with similar numbers of cells and transcripts/cell (Saunders et al. and Tasic et al; Tasic et al. also perform whole-RNA sequencing). Thus the Erwin et al. datasets is unlikely to reveal previously unappreciated heterogeneity with the canonical claustrum class.

3. Why were no interneurons sampled in the 274 cell dataset presented in Figure 1? If the authors were selecting particular dissociated cells by eye, they should describe by which criterion they choose individual cells. Could a claustrum excitatory neuron type with a small, irregular or interneuron like somato-dendritic morphology remain unsampled because of selection bias?

4. The authors should report more details for their molecular and sequencing methods. To identify how the single-cell RNA was processed, I had to track back through two publications (Cembrowski et al. 2018 -> Cembrowski et al. 2016) to find only "Total RNA was isolated from each sample, ERCC spike-in controls were added, and cDNA libraries were amplified from this material." Please provide detailed methods of library preparation.

5. The number of mice contributing to the presented experiments are sometimes very low, with some experiments n=2. The exact number of animals should be reported in the text of the results and bolstered where necessary.

The instance where I find this most concerning regards the data describing the relationship between molecular identities and LEC/RSC projection mapping; perhaps the most critical part of the manuscript.

I appreciate that the sequencing-based read out of projection anatomy is laborious and expensive. Why not simply combine two color retrograde labeling from LEC/RSC with in situs for shell/core markers? That would allow Erwin et al. to address variance in molecular identity/projection mapping across many mice. For experiments in which understanding biological variance is critical, the authors should also present their current (and any future) data, grouped by individual mouse (at least in the Supplement).

It's still very early days for circuit neuroscience to engender an understanding of how molecular and axonal anatomy of particular cell types "map". Critical in making strides in this effort are datasets that allow the across-animal variance of such mappings be accurately described so as to facilitate more nuanced conversations about such mappings. Erwin et all have an opportunity to make an important contribution if animal numbers are increased.

6. In Figure 3, do the ~15% of cells in each molecular cluster which do not obey the projection pattern of the majority other co-clustered cells exhibit a unique transcriptional signature? Again, this should be evaluated both within each mouse as well as across the projection-based cell populations as a whole

Reviewer #2:

My impression is that they may have a real finding regarding "shell" and "core" gene expression, but they don't do a convincing job showing it, especially with the FISH data. The study is kind of narrow in its scope for ELife, and should be further extended.

1. The core vs shell arrangement of gene expression is not so obvious in the FISH data provided in Figure 2D, yet this is a major claim made in the paper. In the given example, Slc30a3 appears medial to, and somewhat intermingled with Synpr, rather than forming a clear ring-like pattern as seen with the retrograde labeling example from LEC/RSC in Figure 3A. In fact, the experiment shown in Figure 3E provides another opportunity to convincingly present the core vs shell arrangement of Slc30a3 and Synpr as they relate to the projection-defined RSC population, however the provided images are cropped too closely to get a sense of the pattern. Perhaps provide an example cropped to the dimensions shown in Figure 3A.

2. The FISH signal for the CLA shell genes (Slc30a3 and Nnat) appears much weaker than that of Synpr and Pcp4 and some of the other examples provided. This hinders appreciation of the spatial arrangement of these genes around the CLA core and calls into question how reliable co-localization with other FISH probes could be identified. Perhaps potentially more robust probes or genes could be explored to strengthen the presentation of this data? For example, perhaps Spon1 (identified as a Cluster 2 gene in Figure 1F) or other unexplored genes, such as Sdk2 or Crym, that show striking shell-like patterns around the CLA might perform better in the FISH experiments? How well do they spatially colocalize with Slc30a3, which shows biased expression along the medial edge of CLA, but not as much around the lateral edge as seen with Nnat, Spon1, Sdk2, and Crym expression in Allen Institute's Mouse Brain ISH database (http://mouse.brain-map.org/)?

3. Pcp4 is used as a marker for L5/L6a/L6b cortical excitatory neurons and is claimed to be expressed ubiquitously among this population. However, it has been shown that in L6a, Pcp4 specifically labels corticothalamic-projecting neurons, but not L6 IT excitatory neurons, which are marked by a non-overlapping VGluT1+/CcK+ population (see Figure 8 in Watakabe et al., 2012; doi: 10.1002/cne.23160). Pcp4 is still a very good choice in these experiments for distinguishing between L6a CT and L6b cortical neurons and claustrum-related cells in the shell and core regions, perhaps just include the citation and modify the language in the text.

4. In Figure 3E, FISH is used to examine the colocalization of Synpr or Slc30a3 with retrogradely labeled RSC-projecting neurons in the CLA, however the same experiment is not performed with LEC-projecting cells and should be presented here. Injections of retrograde tracer in LEC indeed label cell bodies largely below and around the margins of the CLA "core," as shown in Figure 3A, however they may also label cortical neurons in the overlying insula, so it is unclear where the proposed boundaries of the CLA shell might be when looking at the LEC retrolabeling in Figure 3A. Demonstrating this retrograde labeling in conjunction with Slc30a3 and Pcp4 expression will help clear this up. Lastly, while difficult to address here, it will be important in the future to determine what fraction of the LEC retrolabeling shown below the CLA "core" in Figure 3A might actually comprise neurons belonging to the dorsal endopiriform nucleus (see Figure 8 of Watson et al., 2017; doi: 10.1002/cne.23981), which appears to also express genes for CLA "core" (Synpr), "shell" (Slc30a3, Nnat), and L6b (Ctgf) in ways that may complement or complicate the story unfolding for the CLA here. How the genes identified in this study potentially relate to the endopiriform complex (and even the dorsal aspect of CLA, thought to interact with motor cortex) may be worth mentioning in the discussion.

Reviewer #3:

The authors present a transcriptomic survey of cell type diversity in the mouse claustrum. They reveal that markers currently used to visualize cells in the core region of the claustrum may not target a second, potentially novel cell type in the claustrum shell. The authors additionally show that these two molecularly divergent cell types have distinct axonal projection targets in the cortex. While this is a potentially interesting finding, the data presented in the manuscript may not be sufficient to adequately describe the transcriptomic organization of the claustrum.

1) A large body of work, including the accompanying manuscript by the same authors, have described the claustrum as a topologically heterogeneous structure. The description of claustral cell types presented in the manuscript would be strengthened substantially if it addressed if and how gene expression and cell types vary spatially across the claustrum, as the authors have done in previous work with the subiculum, for example, and as the authors did anatomically in the related manuscript of Marriott et al. At a minimum, more detailed anatomical coordinates should be presented throughout for in situ/anatomical/sequencing data. It is unclear which parts of the claustrum are sampled and presented in the manuscript, making it difficult to discern if the results presented herein generalize across this structure or represent a snapshot of a single subregion, whose location is not specified

2) A major conclusion of the manuscript is that the claustrum contains two transcriptomically distinct cell types. However, the claustrum clearly contains other cell types that appear to be missing from scRNA-seq data. For example, 1) PV neurons are visible in the accompanying Marriott et al. and 2) PCP4+/CTGF- cells are present throughout (Figure 2, supplement 1). Presumably glia were also excluded, although there did not appear to be any mention of this. It is unclear why these types do not appear in scRNA-seq data, raising concerns about sampling biases and coverage.

3) This major finding of this study and that of Marriott et al., appear to overlap considerably – namely that the claustrum includes a 'shell' of cells with properties distinct from those in the 'core'. At the same time, the study appears to conflict in some ways with results in the accompanying Marriott et al. study. In particular, Marriott et al. show that only 'shell' neurons in the caudal aspect of the claustrum project to the EC, while this study implies that EC projections are a general feature of shell neurons, again raising questions about topology. This discrepancy makes one wonder if the rostral claustrum contains the same cell types transcriptomically.

4) A recent study (Wang, Xie, Gong, et al., bioRxiv) has described a large amount of heterogeneity in the projection patterns of Gnb4+ cells that presumably correspond to the authors' SYNPR population using single-neuron axonal reconstruction. These neurons appear to include projections to both the LEC and RSP. In addition, that study argued that the same transcriptomic population included cells both within and outside of the claustrum, further complicating the argument that a transcriptomic approach is the 'correct' method for defining its spatial borders. Those results should at least be discussed in the context of the present study.

[Editors’ note: further revisions were suggested prior to acceptance, as described below.]

Thank you for submitting your article "Spatially patterned excitatory neuron subtypes and circuits within the claustrum" for consideration by eLife. Your article has been reviewed by 3 peer reviewers, and the evaluation has been overseen by a Reviewing Editor and Gary Westbrook as the Senior Editor. The following individual involved in review of your submission has agreed to reveal their identity: Li I Zhang (Reviewer #3). The reviewers have discussed their reviews with one another, and the Reviewing Editor has drafted this to help you prepare a revised submission.

Essential revisions:

Please address the points raised by the reviewers, focusing on these issues:

1) Accurate articulation of the comparison between Erwin dataset and Saunders/Zeisel datasets, as requested by Reviewer #1.

2) Explain the apparent differences of Slc30a3 expression data across RNA-seq and different mFISH plots including Figure 2—figure supplement 2 and Figure 2—figure supplement 5.

3) Writing and presentation: Reviewers #1 and #2 have a number of suggestions for improving the readability, accuracy, figure labeling, and figure color scheme of the documentation. The reviewers and editors agree that addressing these concerns will improve the manuscript. In particular, Figure 2 is an important figure. The authors should include a better explanation of the data, including clusters displayed and the relationship with anatomical information. The delineation of 'core 'and 'shell' is the foundation of the work and Reviewer #2's concern concerning core/shell needs to be addressed. This critique also applies to Figure 3—figure supplement 2.

Reviewer #1:

Erwin et al's resubmission is improved by clarifying the methods and details of the experiments; inclusion of new, mFISH analyses with automated transcript quantification (including cells identified from retrograde labeling); and integration of their scRNA-seq datasets with those from larger, published studies. Their data make clear that there is a biased relationship between molecular identity and major axonal projection patterns for neurons in and around the claustrum which the authors describe as a "core" and "shell".

There are number of issues that could be addressed to strengthen the experiments, analyses and presentation of the manuscript.

1. The RNA profiles which make up the "unknown" cluster – which the authors name then analyze as the "shell" – have been sampled and described in other studies and appear, transcriptionally, to be more of a quantitative specialization within a larger neuron population rather than a qualitatively distinct cell type. I draw this inference from their integrated analysis (Figure 1—figure supplement 2). Contrast this to the cells from clusters 1 (canonical claustrum) and clusters 3 (Cortex L6) which appear to be distinct and discrete populations. Yet the way the manuscript is written suggests that the "shell" neurons are a categorically new and different population. I would suggest the authors change their description to better match the results presented in their integrated analysis.

2. The analysis in Figure 1—supplement 3 suffers from technical limitations and appears to be somewhat forcing the case that "shell" neurons they describe are distinct from those RNA profiles sampled in Saunders/Zeisel. Such comparisons of highly-granularized clusters can tend to identify expression "noise" rather than robust biological differences in RNA expression. Moreover, because each of the three studies used different chemistries and sequencing strategies to make scRNAseq libraries – and such chemistries have different DNA sequence-based biases in amplification and, moreover, were sequenced on different Illumina instruments – it seems in appropriate to compare expression levels of normalized RNAs across datasets in this manner. (I.e. that Nnat has higher expression in the Erwin dataset may simply reflect that Nnat cDNA was more likely to be present on the after Erwin-style library vs Dropseq or 10x V2 preparations).

3. Of the markers presented for Cluster 2, Slc30a3 appears to have the most selective expression. Yet the data in Figure 2—figure supplement 2 suggest no signal. Somewhat puzzlingly, the mFISH data for the same gene in Figure 2—figure supplement 5 suggest near equivalent levels of mRNA counts in "core" vs "shell" clusters. For many "shell" marker genes, the mFISH data does not appear to vary in "core" neurons to the degree that the scRNA-seq data suggest.

4. As a more general statement from 3 above, the violin plots used throughout the paper to show expression differences are hard to interpret, especially when severely flattened. The authors should perhaps consider a different plot type (maybe boxplots?) and to give the spacing to each plot so the differences they allude to can be evaluated. Are the violin plots on a log scale?

5. I find the mFISH analysis presented in Figure 2 confusing. Shouldn't panel C (the clustering results based on the mRNA counts of the 12 genes) be presented before panel B (the locations of cells in the cluster-categories). And critically, what are we to make of the yellow and pink cells in C? Their cell bodies appear to be located within the claustrum yet do they lack a homolog in the scRNAseq data?

6. The writing of the manuscript could be tightened to more carefully reflect what the authors intend. For example, the use of "circuit" – which I find somewhat ambiguous – might be better replaced by the words "cellular anatomy" or "axonal projection."

7. "Claustrum" is misspelled as "clautrum" in two instances.

Reviewer #2:

The revised manuscript of Erwin et al. has been improved though the addition of new experimental data and, as a result, my major comments have largely been addressed. While the results presented are better supported, the revised manuscript could be improved considerably by refinement in the way the data are presented and discussed, as detailed below.

Reviewer #3:

The manuscript is largely improved with additional data, especially the mFISH data. All my previous comments are addressed. I support its publication with eLife.

https://doi.org/10.7554/eLife.68967.sa1

Author response

[Editors’ note: the authors resubmitted a revised version of the paper for consideration. What follows is the authors’ response to the first round of review.]

Reviewer #1:

Erwin et al. address the relationship between molecular identity and projection anatomy of neurons in the mouse claustrum using single-cell RNAseq, in situ hybridizations and retrograde labeling. Such "mappings" are of interest to circuit neuroscience for both practical and theoretical reasons. In what ways does a neuron's molecular makeup determine its adult connectivity?

1. The molecular identity(ies) of the "Unknown" yellow cluster (Figures 1 and 3) still remain unknown. The Erwin manuscript implies that these cells make up a distinct cell type of claustrum shell, but the data presented supporting this conclusion are currently weak. The authors state that the "unknown" population is molecularly distinct from both (1) canonical claustrum neurons (Synpr+) and (2) other cortical neuron populations.

We thank the reviewer for this feedback. Since this review, we have performed additional experiments and analysis to resolve this “Unknown” cluster in both cellular phenotype and spatial location. As described in detail below, this work has reinforced our original conclusion of this cluster being a claustral shell population. Of particular note, our revised manuscript now includes two wholly new figures (Figure 2, 3) devoted to this justification.

Due to the small number of cells sampled and the restriction of that sampling to the area of the claustrum, the first claim requires only that the canonical claustral neuron type be molecularly distinct to be supported. That there is a specialized claustrum neuron type (at the level of the entire cortical mantle or most likely the whole brain) is already quite clear: previous scRNAseq studies (Zeisel et al; Tasic et al; Saunders et al.) have demonstrated such a specialized RNA expression signature, which includes highly selective gene markers that are localized to the claustrum anatomically. The Erwin et al. data also support the claustrum-specific neuronal profile (as judged by heavy overlap of the selective markers from these other studies).

We agree that one of our clusters from our scRNA-seq dataset recapitulates a known claustral cell type, and in our revised manuscript, explicitly demonstrate this by integrating our scRNAseq dataset with previously published datasets (new Figure 1—figure supplements 2,3).

Using in situs, Erwin et al. refine the location of the Synpr+ cell type to claustrum "core". This is the major result of the paper.

In our revised manuscript, we now have greatly expanded our in situ hybridization experiments and analysis. In particular, using a multiplexed approach to register up to 14 channels from the same tissue section, we now simultaneously map the spatial organization of the claustrum core, shell, cortical cells, and their respective circuits (new Figures 2,3).

The second claim – that the "unknown" cluster represents a 2nd distinct claustrum neuron type specific to the shell – is not well supported given the data at hand. The authors claim that because only 9.1% of Slc30a3+ cells are Pcp4+, the "unknown" cluster is not related to other excitatory cortical neuron types. However, Pcp4+ is not ubiquitously expressed in all Slc17a7+ neuron types (http://dropviz.org/?_state_id_=80467b8fc3286f0b). Moreover, quantitative variation in Pcp4 expression level could also lead to somewhat arbitrary thresholds for counting cells as positive, even with highly sensitive ACD RNA probes. By my eye, the expanded image in Figure 2D looks as if more than 10% of Slc30a3+ cells are Pcp4+ (if counting those cells with low Pcp4 expression; the authors should describe how the in situ data were quantified in the methods and if the representative images are Z-stack projections or single image planes).

To avoid any potential biases associated with cell counting, as well as facilitate interpretation of our expanded 12- and 14-channel multiplexed in situ data, in our revised manuscript all quantification is now performed computationally (rather than manually in our previous manuscript). Our methods section is updated to describe this new computational analysis.

More concerning is that when one considers the expression patterns of marker genes from the "unknown" cluster (Idb2, Mef2c, Necab1, Nnat, Nrn1, Olfm1, Spon1, Ramp1, Slc30a3, Syn2) across all of cortical cell types, those markers show very little cell-type-specific enrichment (http://dropviz.org/?_state_id_=4bb18bcc4f50d3cb). These data suggest to me that the "unknown" cluster could be a somewhat heterogenous collection that molecularly resemble other cortical excitatory neuron types. That their RNA profiles clustered together could be a property of their simply being dissimilar to the other more distinct cell types included in the analysis.

In our original manuscript, the unknown cluster exhibited relatively small within-cluster variability, suggestive of a relatively homogeneous population. In our revised manuscript, we explicitly demonstrate this by integrating our single-cell RNA-seq dataset with previously published datasets, illustrating that this unknown population still tightly clusters within a much broader cell-type landscape (new Figure 1—figure supplement 2).

The authors can test their claim that "…the core-shell arrangement identified here was consistent with distinct subtypes claustral neurons, rather than reflecting spatial displacement of a cortical cell type" by jointly analyzing their own single cell libraries with much larger datasets describing molecular diversity of glutamatergic neurons across the cortical mantle (Zeisel et al; Tasic et al; Saunders et al). This type of analysis is not computationally prohibitive and could be performed on a decent laptop computer.

We thank the reviewer for this suggestion, and we now have implemented this integration in our revised manuscript (new Figure 1—figure supplement 2). Importantly, such analysis indicates that the “unknown” cluster is indeed a specific and relatively homogeneous cell type, and also has molecular features that distinguish it from published cortical cell types (new Figure 1 —figure supplement 3).

For example, if the Erwin and Saunders/Tasic/Zeisel data are co-clustered, and the authors find the cells from the "unknown" split into distinct excitatory clusters, that might suggest the "unknown" cluster is molecularly heterogenous and offer clues as to which cortical cell types functionally form the claustrum shell. Alternatively, the "unknown" cells might cluster together. This would allow an opportunity for cortex-wide differential expression testing to reveal selective markers for the "shell" subtype. (Importantly, the authors should pursue analytical methods (such as LIGER (Welch et al) or CCA (Butler et al.)) that allow their data to be integrated into other datasets without being burdened by platform/experiment specific clustering artifacts).

As requested, we use Seurat v3 data integration approaches to combine our scRNA-seq data with previous published datasets. This approach leverages an anchoring analytical method that circumvents platform/experiment-specific clustering artifacts, and we describe this new computational pipeline within our revised manuscript. With this approach, we find that our “Unknown” cluster encompasses a largely monolithic subtype (new Figure 1—figure supplement 2). This organization allowed us to identify selective markers for the shell type, as requested (new Figure 1—figure supplement 3).

Non-clustering methods could also be used to attain similar insight.

We now include UMAP embedding (new Figure 1—figure supplement 2) that allows visualization and comparison of datasets without clustering.

To be clear, it would be an important observation and not diminish the study if the claustrum "shell" – a region defined anatomically by retrograde labeling – consists of a displaced cortical cell type or types.

We agree, and appreciate the requests from the reviewer to further phenotype and understand our “Unknown” cluster.

More experiments are needed to address the issue of the molecular identity of the "shell" glutamatergic neurons; as it stands now, the claims in the paper are not strongly supported by the data presented.

We hope that, with our expanded analysis of scRNA-seq data (revised Figure 1) and complementary new experiments involved multiplexed FISH (new main Figures 2, 3 and associated 9 new supplemental figures), we have now illustrated the existence of shell claustral neurons.

2. Standard methods for single-cell 3' mRNA counting (e.g. Drop-seq, 10x, InDrop) routinely allow tens or hundreds of thousands of single cell RNA profiles to be sampled. It's unclear why the authors choose to pursue a more low-throughput method of whole-RNA sequencing but then not take advantage of mRNA isoform variation which their data uniquely enable? Single-cell RNAseq datasets describing the canonical claustrum neuron type (Synpr+/Nr4a2+) have been published with similar numbers of cells and transcripts/cell (Saunders et al. and Tasic et al; Tasic et al. also perform whole-RNA sequencing). Thus the Erwin et al. datasets is unlikely to reveal previously unappreciated heterogeneity with the canonical claustrum class.

We agree that mRNA isoform variation is an interesting are of research in general, but in the context of our study here, mRNA isoform variation is challenging in both scRNA-seq statistical inference as well as mFISH validation of scRNA-seq predictions. As our manuscript focuses on identifying subtypes of claustral neurons, which in principle and practice can be done at the relatively well-powered gene level, we elected to not perform any isoform-level analysis. We hope the reviewer finds this gene-level scope sufficient, especially as we believe our revised manuscript provides evidence of previously unappreciated heterogeneity within the claustrum.

3. Why were no interneurons sampled in the 274 cell dataset presented in Figure 1? If the authors were selecting particular dissociated cells by eye, they should describe by which criterion they choose individual cells. Could a claustrum excitatory neuron type with a small, irregular or interneuron like somato-dendritic morphology remain unsampled because of selection bias?

The cells harvested in our 274 cell dataset were chosen without selection criteria, and as such, morphology-based selection bias does not account for our relative enrichment of excitatory neurons. Rather, the relative enrichment of excitatory neurons in this dataset likely reflects the abundance of excitatory neurons relative to interneurons in the claustrum. We now include these details in our methods section.

We note that all of our scRNA-seq analysis in our revised manuscript now pools this dataset with our projection-level datasets (i.e., all analysis includes pooled data from n = 4 mice).

4. The authors should report more details for their molecular and sequencing methods. To identify how the single-cell RNA was processed, I had to track back through two publications (Cembrowski et al. 2018 → Cembrowski et al. 2016) to find only "Total RNA was isolated from each sample, ERCC spike-in controls were added, and cDNA libraries were amplified from this material." Please provide detailed methods of library preparation.

We now provide much greater detail throughout our methods, including library preparation.

5. The number of mice contributing to the presented experiments are sometimes very low, with some experiments n=2. The exact number of animals should be reported in the text of the results and bolstered where necessary.

We now include the exact number of animals in the text, and moreover, also provide demonstration of minimal animal-to-animal variability in our revised manuscript (scRNA-seq: new Figure 1—figure supplement 1C; mFISH: new Figure 2—figure supplement 4).

The instance where I find this most concerning regards the data describing the relationship between molecular identities and LEC/RSC projection mapping; perhaps the most critical part of the manuscript.

I appreciate that the sequencing-based read out of projection anatomy is laborious and expensive. Why not simply combine two color retrograde labeling from LEC/RSC with in situs for shell/core markers? That would allow Erwin et al. to address variance in molecular identity/projection mapping across many mice.

We thank the reviewer for this suggestion, and in our revised manuscript, have expanded the number of animals, gene targets, and projection targets for relating molecular phenotype with circuit wiring. This has allowed for comprehensive phenotyping of LEC/RSC projections, and recapitulates and extends the results of our original manuscript (new Figure 3).

For experiments in which understanding biological variance is critical, the authors should also present their current (and any future) data, grouped by individual mouse (at least in the Supplement).

We now include our analysis on a per-replicate basis, both for scRNA-seq (Figure 1—figure supplement 1C) and mFISH (Figure 2—figure supplement 4).

It's still very early days for circuit neuroscience to engender an understanding of how molecular and axonal anatomy of particular cell types "map". Critical in making strides in this effort are datasets that allow the across-animal variance of such mappings be accurately described so as to facilitate more nuanced conversations about such mappings. Erwin et all have an opportunity to make an important contribution if animal numbers are increased.

Our revised manuscript is now expanded in the number of animals used for in situ hybridization experiments (n = 5 animals, cf. ≤2 animals/condition in our original manuscript). This expansion has enabled a dramatic increase in the number of cells examined (n = 18,957 putative excitatory neurons analyzed, cf. <1,000 in our original manuscript), as well as the genes/cell (12 genes/cell, cf. ≤3 in our original manuscript). We hope that this new data, along with our strengthened analysis and conclusions, will allow the reviewer to deem our work as an important contribution.

6. In Figure 3, do the ~15% of cells in each molecular cluster which do not obey the projection pattern of the majority other co-clustered cells exhibit a unique transcriptional signature? Again, this should be evaluated both within each mouse as well as across the projection-based cell populations as a whole

In general, we do not see dramatically different transcriptional signatures for cells that do not obey the typical projection pattern (e.g., new Figure 3F); however, we also note that due to the few number of cells in this category, our analysis is underpowered. Thus, if it pleases the reviewer, we would prefer to avoid speculating on potential transcriptional differences (or lack thereof) in cells that vary from the typical projection patterns.

Reviewer #2:

My impression is that they may have a real finding regarding "shell" and "core" gene expression, but they don't do a convincing job showing it, especially with the FISH data. The study is kind of narrow in its scope for ELife, and should be further extended.

We thank the reviewer for the feedback. Since our initial submission, as we describe below, we have worked hard to extend the scope of our manuscript, including new 14-channel imaging results combining circuit mapping and multiplexed FISH.

1. The core vs shell arrangement of gene expression is not so obvious in the FISH data provided in Figure 2D, yet this is a major claim made in the paper. In the given example, Slc30a3 appears medial to, and somewhat intermingled with Synpr, rather than forming a clear ring-like pattern as seen with the retrograde labeling example from LEC/RSC in Figure 3A. In fact, the experiment shown in Figure 3E provides another opportunity to convincingly present the core vs shell arrangement of Slc30a3 and Synpr as they relate to the projection-defined RSC population, however the provided images are cropped too closely to get a sense of the pattern. Perhaps provide an example cropped to the dimensions shown in Figure 3A.

In our revised manuscript, using a much more powerful multiplexed FISH approach, we now provide much more expansive images that are also richer in gene expression information (new Figures 2, 3).

2. The FISH signal for the CLA shell genes (Slc30a3 and Nnat) appears much weaker than that of Synpr and Pcp4 and some of the other examples provided. This hinders appreciation of the spatial arrangement of these genes around the CLA core and calls into question how reliable co-localization with other FISH probes could be identified. Perhaps potentially more robust probes or genes could be explored to strengthen the presentation of this data?

As requested, in our revised manuscript we used a much larger number of genes (n = 12 genes per section in revised manuscript; cf. ≤ 3 in our original manuscript). Our findings using this expanded number of genes recapitulate the conclusions of our original manuscript.

For example, perhaps Spon1 (identified as a Cluster 2 gene in Figure 1F) or other unexplored genes, such as Sdk2 or Crym, that show striking shell-like patterns around the CLA might perform better in the FISH experiments? How well do they spatially colocalize with Slc30a3, which shows biased expression along the medial edge of CLA, but not as much around the lateral edge as seen with Nnat, Spon1, Sdk2, and Crym expression in Allen Institute's Mouse Brain ISH database (http://mouse.brain-map.org/)?

In our revised manuscript, from our scRNA-seq we identified 12 genes that in aggregate label a combination of core and shell claustrum cells, as well as other cell types (Figure 2—figure supplement 1). Given the combinatorial power of this gene set, we were able to use clustering analyses on mFISH data to identify core-shell organizations that did not rely on any individual gene per se.

3. Pcp4 is used as a marker for L5/L6a/L6b cortical excitatory neurons and is claimed to be expressed ubiquitously among this population. However, it has been shown that in L6a, Pcp4 specifically labels corticothalamic-projecting neurons, but not L6 IT excitatory neurons, which are marked by a non-overlapping VGluT1+/CcK+ population (see Figure 8 in Watakabe et al., 2012; doi: 10.1002/cne.23160). Pcp4 is still a very good choice in these experiments for distinguishing between L6a CT and L6b cortical neurons and claustrum-related cells in the shell and core regions, perhaps just include the citation and modify the language in the text.

We now include this citation and have modified the language in the text to illustrate this exception for Layer 6 intratelencephalic excitatory neurons.

4. In Figure 3E, FISH is used to examine the colocalization of Synpr or Slc30a3 with retrogradely labeled RSC-projecting neurons in the CLA, however the same experiment is not performed with LEC-projecting cells and should be presented here. Injections of retrograde tracer in LEC indeed label cell bodies largely below and around the margins of the CLA "core," as shown in Figure 3A, however they may also label cortical neurons in the overlying insula, so it is unclear where the proposed boundaries of the CLA shell might be when looking at the LEC retrolabeling in Figure 3A. Demonstrating this retrograde labeling in conjunction with Slc30a3 and Pcp4 expression will help clear this up.

We have now performed this experiment involving LEC-projecting cells (new Figure 3), and have found that our results from multiplexed FISH recapitulate the predicted results from our scRNA-seq data.

Lastly, while difficult to address here, it will be important in the future to determine what fraction of the LEC retrolabeling shown below the CLA "core" in Figure 3A might actually comprise neurons belonging to the dorsal endopiriform nucleus (see Figure 8 of Watson et al., 2017; doi: 10.1002/cne.23981), which appears to also express genes for CLA "core" (Synpr), "shell" (Slc30a3, Nnat), and L6b (Ctgf) in ways that may complement or complicate the story unfolding for the CLA here. How the genes identified in this study potentially relate to the endopiriform complex (and even the dorsal aspect of CLA, thought to interact with motor cortex) may be worth mentioning in the discussion.

We agree this is an important line of discussion. Given our expanded results, our revised manuscript is now at the character limit allowable for an eLife Short Report. If our revised manuscript is deemed potentially worthy of publication in eLife, we will request additional discussion space to address this point.

Reviewer #3:

The authors present a transcriptomic survey of cell type diversity in the mouse claustrum. They reveal that markers currently used to visualize cells in the core region of the claustrum may not target a second, potentially novel cell type in the claustrum shell. The authors additionally show that these two molecularly divergent cell types have distinct axonal projection targets in the cortex. While this is a potentially interesting finding, the data presented in the manuscript may not be sufficient to adequately describe the transcriptomic organization of the claustrum.

We are glad that the reviewer found the findings of our previous manuscript potentially interesting. As described below, over the last 7 months we have dramatically expanded upon these original experiments and analysis. We hope our revised manuscript now sufficiently describes the transcriptomic organization of the claustrum.

1) A large body of work, including the accompanying manuscript by the same authors, have described the claustrum as a topologically heterogeneous structure. The description of claustral cell types presented in the manuscript would be strengthened substantially if it addressed if and how gene expression and cell types vary spatially across the claustrum, as the authors have done in previous work with the subiculum, for example, and as the authors did anatomically in the related manuscript of Marriott et al. At a minimum, more detailed anatomical coordinates should be presented throughout for in situ/anatomical/sequencing data. It is unclear which parts of the claustrum are sampled and presented in the manuscript, making it difficult to discern if the results presented herein generalize across this structure or represent a snapshot of a single subregion, whose location is not specified.

In our revised manuscript, we now include substantially more data and insight on location and variation in the anterior-posterior axis (e.g., scRNA-seq: new Figure 1—figure supplement 1; mFISH: new Figure 2, Figure 2—figure supplement 4, new Figure 3). This includes illustrating specific anatomical coordinates, as requested.

2) A major conclusion of the manuscript is that the claustrum contains two transcriptomically distinct cell types. However, the claustrum clearly contains other cell types that appear to be missing from scRNA-seq data. For example, 1) PV neurons are visible in the accompanying Marriott et al. and 2) PCP4+/CTGF- cells are present throughout (Figure 2, supplement 1). Presumably glia were also excluded, although there did not appear to be any mention of this. It is unclear why these types do not appear in scRNA-seq data, raising concerns about sampling biases and coverage.

We agree that our preparation methods – which select primarily for excitatory neurons due to overall abundance and further purification via circuit labeling – were poorly explained in our original submission. In our revised manuscript, we provide extended methods that explain the relative abundance of excitatory neurons observed in our dataset.

3) This major finding of this study and that of Marriott et al., appear to overlap considerably – namely that the claustrum includes a 'shell' of cells with properties distinct from those in the 'core'. At the same time, the study appears to conflict in some ways with results in the accompanying Marriott et al. study. In particular, Marriott et al. show that only 'shell' neurons in the caudal aspect of the claustrum project to the EC, while this study implies that EC projections are a general feature of shell neurons, again raising questions about topology. This discrepancy makes one wonder if the rostral claustrum contains the same cell types transcriptomically.

This point is well-taken, and in our revised manuscript, we now have now examined whether transcriptomic identity of claustrum neurons varies across the anterior-posterior (i.e., rostralcaudal) axis. Importantly, we do not find evidence of identity changes along this axis from either scRNA-seq data (new Figure 1—figure supplement 1C) or mFISH data (new Figure 2, new Figure 2—figure supplement 4).

4) A recent study (Wang, Xie, Gong, et al., bioRxiv) has described a large amount of heterogeneity in the projection patterns of Gnb4+ cells that presumably correspond to the authors' SYNPR population using single-neuron axonal reconstruction. These neurons appear to include projections to both the LEC and RSP.

We note that Gnb4 is expressed in both core and shell subtypes in our study (e.g., Figure 1C), and thus, it is not unexpected that previous work showed projections to both LEC and RSC.

In addition, that study argued that the same transcriptomic population included cells both within and outside of the claustrum, further complicating the argument that a transcriptomic approach is the 'correct' method for defining its spatial borders. Those results should at least be discussed in the context of the present study.

We now cite this manuscript (Wang et al., bioRxiv 2017) along with the most recent version of this preprint (Peng et al., bioRxiv 2020) within our manuscript, and we furthermore agree that comparing our work to these preprints warrants further discussion. Given our expanded results, our revised manuscript is now at the character limit allowable for an eLife Short Report. If our revised manuscript is deemed potentially worthy of publication in eLife, we will request additional discussion space to address this point.

[Editors’ note: what follows is the authors’ response to the second round of review.]

Essential revisions:

Please address the points raised by the reviewers, focusing on these issues:

1) Accurate articulation of the comparison between Erwin dataset and Saunders/Zeisel datasets, as requested by Reviewer #1.

We have now performed a more in-depth comparison of our (Erwin) dataset to previous Saunders and Zeisel datasets, including new analysis and visualizations. This has resulted in a revised supplemental figure (Figure 1—figure supplement 4) and a new review figure (Author response image 1) . Our at-length response can be found after Comment 2 from Reviewer 1.

Author response image 1
Similar expression of Pcp4 in the cortical cell cluster across datasets.

Using cortical cells from our dataset (Erwin et al.), we identified the corresponding cluster from the integrated analysis including other published datasets (Saunders t al., Zeisel et al.). Pcp4 expression is illustrated (via dimensionless units, corresponding to integrated scaled data), both for individual cells from each dataset (black dots), as well as associated violin plots on a per-dataset basis (coloured contours).

2) Explain the apparent differences of Slc30a3 expression data across RNA-seq and different mFISH plots including Figure 2—figure supplement 2 and Figure 2—figure supplement 5.

We have now updated our visualization of the data for both of these supplemental figures, and included additional statistical testing, both of which better capture the similarities between RNAseq and mFISH data. Our at-length response can be found after Comments 3 and 4 from Reviewer 1.

3) Writing and presentation: Reviewers #1 and #2 have a number of suggestions for improving the readability, accuracy, figure labeling, and figure color scheme of the documentation. The reviewers and editors agree that addressing these concerns will improve the manuscript. In particular, Figure 2 is an important figure. The authors should include a better explanation of the data, including clusters displayed and the relationship with anatomical information. The delineation of 'core 'and 'shell' is the foundation of the work and Reviewer #2's concern concerning core/shell needs to be addressed. This critique also applies to Figure 3—figure supplement 2.

We note that “Figure 3—figure supplement 2” is not a supplemental figure in our manuscript; given the context here we believe this comment refers to Figure 3—figure supplement 1.

As requested, in our revised manuscript we have now clarified our writing, as well as our presentation of associated figures. We have addressed all requested figure changes, which span the following revised main figures:

Figure 1

Figure 2 (see response to Comment 5 from Reviewer 1)

Figure 3 (see the following revised figure supplements):

Figure 1—figure supplement 1

Figure 1—figure supplement

Figure 1—figure supplement

Figure 1—figure supplement 4 (see response to Comment 2 from Reviewer 1)

Figure 2—figure supplement 1

Figure 2—figure supplement 2 (see response to Comments 3,4 from Reviewer 1)

Figure 2—figure supplement 5 (see response to Comments 3,4 from Reviewer 1)

Figure 3—figure supplement

Reviewer #1:

Erwin et al.'s resubmission is improved by clarifying the methods and details of the experiments; inclusion of new, multiplexed FISH analyses with automated transcript quantification (including cells identified from retrograde labeling); and integration of their scRNA-seq datasets with those from larger, published studies. Their data make clear that there is a biased relationship between molecular identity and major axonal projection patterns for neurons in and around the claustrum which the authors describe as a "core" and "shell".

There are number of issues that could be addressed to strengthen the experiments, analyses and presentation of the manuscript.

1. The RNA profiles which make up the "unknown" cluster – which the authors name then analyze as the "shell" – have been sampled and described in other studies and appear, transcriptionally, to be more of a quantitative specialization within a larger neuron population rather than a qualitatively distinct cell type. I draw this inference from their integrated analysis (Figure 1—figure supplement 2). Contrast this to the cells from clusters 1 (canonical claustrum) and clusters 3 (Cortex L6) which appear to be distinct and discrete populations. Yet the way the manuscript is written suggests that the "shell" neurons are a categorically new and different population. I would suggest the authors change their description to better match the results presented in their integrated analysis.

We have now changed our description, emphasizing that our findings of the shell neurons are “specialized” and “distinguishable” relative to cortical neurons (revised Introduction, Discussion, and the following Results sections: “Comparison to previously published work” and “Two types of excitatory claustral neurons exist in a core-shell arrangement”).

2. The analysis in Figure 1—figure supplement 3 suffers from technical limitations and appears to be somewhat forcing the case that "shell" neurons they describe are distinct from those RNA profiles sampled in Saunders/Zeisel. Such comparisons of highly-granularized clusters can tend to identify expression "noise" rather than robust biological differences in RNA expression. Moreover, because each of the three studies used different chemistries and sequencing strategies to make scRNAseq libraries – and such chemistries have different DNA sequence-based biases in amplification and, moreover, were sequenced on different Illumina instruments – it seems in appropriate to compare expression levels of normalized RNAs across datasets in this manner. (I.e. that Nnat has higher expression in the Erwin dataset may simply reflect that Nnat cDNA was more likely to be present on the after Erwin-style library vs Dropseq or 10x V2 preparations).

We agree with the above general points raised by the reviewer, wherein different library preparation and sequencing strategies can introduce biases across scRNA-seq datasets. Nonetheless, we believe these concerns do not specifically apply to our integrated analysis examining either Nnat and Pcp4, and provide justification for this reasoning below.

For Nnat: Even though Nnat-expressing shell neurons are more abundant within our dataset, they are also found within both the Saunders and Zeisel datasets (see Figure 1—figure supplement 3B inset). Importantly, both Saunders and Zeisel datasets also contain shell neurons with higher Nnat expression than any cells within our dataset (see Figure 1—figure supplement 3D). Such results directly argue that reduction of Nnat in shell neurons reflects biological cell-type-specific differences, rather than technical differences across datasets.

For Pcp4: Shell neurons from our dataset exhibit reduced Pcp4 expression relative to similar cells in Saunders and Zeisel datasets (Figure 1—figure supplement 3F), and notably our dataset was also largely absent of nearby Pcp4-expressing cells found in these previously published datasets (Figure 1—figure supplement 3B inset). Such results may be suggestive of technical differences leading to reduced Pcp4 expression in our dataset, but also may reflect bona fide biological differences. To disambiguate between these two competing explanations, we leveraged the fact that Pcp4 is a strong cortical marker, and thus examined Pcp4 expression in our cortical cell type relative to Saunders and Zeisel datasets (cluster 3: Figure 1—figure supplement 2A). Here, we found that Pcp4 was indeed similarly expressed across all datasets (Author response image 1). This result illustrates that decreased Pcp4 expression is not broadly decreased across our dataset due to technical differences, but rather is decreased in a cell-type-specific fashion within our shell population.

Finally, in our revised manuscript we also now provide complementary ISH analysis that highlights why Pcp4 is enriched in previous broad datasets, whereas Nnat is enriched in our targeted claustrum dataset (revised Figure 1—figure supplement 4). Specifically, Pcp4 is broadly expressed across cortical layers but largely absent within the spatial extent of the claustrum, whereas Nnat is expressed around the claustrum but generally absent in other cortical regions. In combination with our expanded scRNA-seq analysis above, this work shows that our differential Nnat and Pcp4 expression in our dataset emerges from our targeted approach to the claustrum, rather than reflecting technical differences across datasets.

3. Of the markers presented for Cluster 2, Slc30a3 appears to have the most selective expression.

We thank the reviewer for the below Slc30a3-related observations, and we note that there are several misperceptions here that we have now clarified in our revised manuscript.

Yet the data in Figure 2—figure supplement 2 suggest no signal.

We note that Figure 2—figure supplement 2 does indeed show Slc30a3 signal. This was apparent in our original manuscript when looking at the expanded Slc30a3 panel in (B), but may have been visually hard to discern due to our choice of dark brown for this gene. To address this, in our revised manuscript, we have converted gene-expression images within this supplemental figure to greyscale. This allows better comparisons across individual genes, and especially aids in visually identifying Slc30a3 expression in particular (revised Figure 2—figure supplement 2).

Somewhat puzzlingly, the mFISH data for the same gene in Figure 2—figure supplement 5 suggest near equivalent levels of mRNA counts in "core" vs "shell" clusters.

We note that the supposed near-equivalent level of Slc30a3 between core and shell clusters was not the case in our original manuscript, but this may have been visually hard to discern due to the use of violin plots to illustrate expression. To address this, in our revised manuscript, we have replaced violin plots with boxplots (as suggested by this reviewer, see comment 4 below). We furthermore now also include Mann-Whitney U tests, corrected for multiple comparisons, to statistically analyze differential expression between core and shell subtypes. With these revisions, it should now be more apparent that shell expression of Slc30a3 clearly exceeds core expression in effect size and significance (revised Figure 2—figure supplement 5).

For many "shell" marker genes, the mFISH data does not appear to vary in "core" neurons to the degree that the scRNA-seq data suggest.

As discussed above, our revised manuscript incorporating boxplots and statistical tests more clearly illustrates that shell marker genes from mFISH recapitulate the relationships seen in scRNA-seq (see middle row in revised Figure 2—figure supplement 5).

4. As a more general statement from 3 above, the violin plots used throughout the paper to show expression differences are hard to interpret, especially when severely flattened. The authors should perhaps consider a different plot type (maybe boxplots?) and to give the spacing to each plot so the differences they allude to can be evaluated. Are the violin plots on a log scale?

For mFISH analysis, as well as when comparing mFISH to scRNA-seq, we now include boxplots on a linear scale as suggested. We note that when scRNA-seq data is presented in isolation in main figures (i.e., Figure 1), we have retained violin plots per standard scRNA-seq convention, plotted on a linear scale to facilitate comparisons with later analyses.

5. I find the mFISH analysis presented in Figure 2 confusing. Shouldn't panel C (the clustering results based on the mRNA counts of the 12 genes) be presented before panel B (the locations of cells in the cluster-categories).

The reviewer’s point is well-taken, and we have modified this figure accordingly.

And critically, what are we to make of the yellow and pink cells in C? Their cell bodies appear to be located within the claustrum yet do they lack a homolog in the scRNAseq data?

We thank the reviewer for bring this point to our attention. Motivated by this suggestion, we have revised our approach to clustering since our previous manuscript. In particular, we noted that our previous hierarchical clustering approach led to some discordancy with low-dimensional organization suggested by UMAP embedding, and thus sought to identify whether a different clustering approach could yield better agreement with dimensionality reduction.

In doing so, we identified Leiden clustering produces significantly better agreement with lowdimensional embedding (revised Figure 2, 3 and associated supplemental figures). These new cluster identities furthermore better capture the core-shell organization when viewed in a spatial context, and illustrate that cells contained within the atlas-defined claustrum predominantly derive from core, shell, and layer 6 neuronal identities.

6. The writing of the manuscript could be tightened to more carefully reflect what the authors intend. For example, the use of "circuit" – which I find somewhat ambiguous – might be better replaced by the words "cellular anatomy" or "axonal projection."

Broadly, we now use “projection” to refer to this organization in our revised manuscript, including changes in the title and abstract. We now only include “circuit” sparingly and only when the context is clear.

7. "Claustrum" is misspelled as "clautrum" in two instances.

Fixed.

https://doi.org/10.7554/eLife.68967.sa2

Article and author information

Author details

  1. Sarah R Erwin

    Department of Cellular and Physiological Sciences, Life Sciences Institute, University of British Columbia, Vancouver, Canada
    Contribution
    Formal analysis, Investigation, Methodology, Validation, Writing - original draft, Software
    Contributed equally with
    Brianna N Bristow
    Competing interests
    none
    ORCID icon "This ORCID iD identifies the author of this article:" 0000-0001-8710-1848
  2. Brianna N Bristow

    Department of Cellular and Physiological Sciences, Life Sciences Institute, University of British Columbia, Vancouver, Canada
    Contribution
    Investigation, Methodology, Software
    Contributed equally with
    Sarah R Erwin
    Competing interests
    None
    ORCID icon "This ORCID iD identifies the author of this article:" 0000-0002-0411-916X
  3. Kaitlin E Sullivan

    Department of Cellular and Physiological Sciences, Life Sciences Institute, University of British Columbia, Vancouver, Canada
    Contribution
    Methodology, Supervision, Resources
    Competing interests
    none
    ORCID icon "This ORCID iD identifies the author of this article:" 0000-0001-8043-7111
  4. Rennie M Kendrick

    Department of Cellular and Physiological Sciences, Life Sciences Institute, University of British Columbia, Vancouver, Canada
    Contribution
    Formal analysis
    Competing interests
    none
  5. Brian Marriott

    Neuroscience and Mental Health Institute, University of Alberta, Edmonton, Canada
    Contribution
    Methodology
    Competing interests
    none
  6. Lihua Wang

    Janelia Research Campus, Howard Hughes Medical Institute, Ashburn, United States
    Contribution
    Investigation, Methodology
    Competing interests
    none
  7. Jody Clements

    Janelia Research Campus, Howard Hughes Medical Institute, Ashburn, United States
    Contribution
    Visualization, Supervision, Conceptualization
    Competing interests
    none
  8. Andrew L Lemire

    Janelia Research Campus, Howard Hughes Medical Institute, Ashburn, United States
    Contribution
    Investigation, Methodology, Resources
    Competing interests
    none
    ORCID icon "This ORCID iD identifies the author of this article:" 0000-0002-0624-3789
  9. Jesse Jackson

    1. Neuroscience and Mental Health Institute, University of Alberta, Edmonton, Canada
    2. Department of Physiology, University of Alberta, Edmonton, Canada
    Contribution
    Funding acquisition, Formal analysis, Methodology, Visualization, Resources, Writing - original draft, Software
    Competing interests
    none
  10. Mark S Cembrowski

    1. Department of Cellular and Physiological Sciences, Life Sciences Institute, University of British Columbia, Vancouver, Canada
    2. Janelia Research Campus, Howard Hughes Medical Institute, Ashburn, United States
    3. Djavad Mowafaghian Centre for Brain Health, University of British Columbia, Vancouver, Canada
    4. School of Biomedical Engineering, University of British Columbia, Vancouver, Canada
    Contribution
    Funding acquisition, Formal analysis, Writing – review and editing, Investigation, Methodology, Visualization, Resources, Writing - original draft, Software
    For correspondence
    mark.cembrowski@ubc.ca
    Competing interests
    none
    ORCID icon "This ORCID iD identifies the author of this article:" 0000-0001-8275-7362

Funding

Natural Sciences and Engineering Research Council of Canada (RGPIN-2019-04507)

  • Mark S Cembrowski

Canadian Institutes of Health Research (PJT-419798)

  • Mark S Cembrowski

Canada Foundation for Innovation (John R. Evans Leaders Fund 38369)

  • Mark S Cembrowski

Natural Sciences and Engineering Research Council of Canada (RGPIN-2018-05212)

  • Jesse Jackson

Brain and Behavior Research Foundation

  • Jesse Jackson

Canadian Institute for Military and Veteran Health Research

  • Kaitlin E Sullivan

Natural Sciences and Engineering Research Council of Canada

  • Kaitlin E Sullivan

Howard Hughes Medical Institute (Visiting Scientist Program)

  • Mark S Cembrowski

Fulbright Association (US Student Program)

  • Rennie M Kendrick

The funders had no role in study design, data collection and interpretation, or the decision to submit the work for publication.

Acknowledgements

MSC is supported by the University of British Columbia (Department of Cellular and Physiological Sciences, Djavad Mowafaghian Centre for Brain Health, and the Faculty of Medicine Research Office), the Natural Sciences and Engineering Research Council of Canada (RGPIN-2019-04507), the Canadian Institutes of Health Research (PJT-419798), and the Canadian Foundation for Innovation (John R Evans Leaders Fund 38369). KES is supported by a Royal Canadian Legion Masters Scholarship in Veteran Health Research from the Canadian Institute for Military and Veteran Health Research. RMK is supported by a Fulbright U.S. Student Program Award. BM is supported by a studentship from the Neuroscience and Mental Health Institute. JJ is supported by the University of Alberta (Faculty of Medicine & Dentistry, and Department of Physiology), the Natural Sciences and Engineering Research Council of Canada (RGPIN-2018-05212), the Brain and Behavioral Research Foundation Young Investigator Grant, and Canadian Foundation for Innovation (John R Evans Leaders Fund). This work was supported by resources made available through the NeuroImaging and NeuroComputation Centre at the Djavad Mowafaghian Centre for Brain Health (RRID:SCR_019086). Collaboration between MSC and LW, JC and ALL was supported by the Janelia Visiting Scientist Program. We thank members of the Cembrowski lab for helpful discussions, and Jeffrey LeDue for insight and guidance in image acquisition.

Ethics

All procedures were approved by the University of British Columbia Animal Care Committee (protocol A18-0267), the University of Alberta Health Science Laboratory Animal Services Animal Care and Use Committee (protocol AUP2711), and the Janelia Institutional Animal Care and Use Committee (protocol 17-159).

Senior Editor

  1. Gary L Westbrook, Oregon Health and Science University, United States

Reviewing Editor

  1. Tianyi Mao, Oregon Health and Science University, United States

Reviewer

  1. Li I Zhang, University of Southern California, United States

Version history

  1. Received: March 31, 2021
  2. Preprint posted: April 21, 2021 (view preprint)
  3. Accepted: July 28, 2021
  4. Version of Record published: August 16, 2021 (version 1)

Copyright

© 2021, Erwin et al.

This article is distributed under the terms of the Creative Commons Attribution License, which permits unrestricted use and redistribution provided that the original author and source are credited.

Metrics

  • 4,216
    Page views
  • 407
    Downloads
  • 10
    Citations

Article citation count generated by polling the highest count across the following sources: Crossref, PubMed Central, Scopus.

Download links

A two-part list of links to download the article, or parts of the article, in various formats.

Downloads (link to download the article as PDF)

Open citations (links to open the citations from this article in various online reference manager services)

Cite this article (links to download the citations from this article in formats compatible with various reference manager tools)

  1. Sarah R Erwin
  2. Brianna N Bristow
  3. Kaitlin E Sullivan
  4. Rennie M Kendrick
  5. Brian Marriott
  6. Lihua Wang
  7. Jody Clements
  8. Andrew L Lemire
  9. Jesse Jackson
  10. Mark S Cembrowski
(2021)
Spatially patterned excitatory neuron subtypes and projections of the claustrum
eLife 10:e68967.
https://doi.org/10.7554/eLife.68967

Further reading

    1. Neuroscience
    2. Structural Biology and Molecular Biophysics
    Megan M Cullinan, Robert C Klipp ... John R Bankston
    Research Article

    Acid-sensing ion channels (ASICs) are trimeric proton-gated sodium channels. Recent work has shown that these channels play a role in necroptosis following prolonged acidic exposure like occurs in stroke. The C-terminus of ASIC1a is thought to mediate necroptotic cell death through interaction with receptor interacting serine threonine kinase 1 (RIPK1). This interaction is hypothesized to be inhibited at rest via an interaction between the C- and N-termini which blocks the RIPK1 binding site. Here, we use two transition metal ion FRET methods to investigate the conformational dynamics of the termini at neutral and acidic pH. We do not find evidence that the termini are close enough to be bound while the channel is at rest and find that the termini may modestly move closer together during acidification. At rest, the N-terminus adopts a conformation parallel to the membrane about 10 Å away. The distal end of the C-terminus may also spend time close to the membrane at rest. After acidification, the proximal portion of the N-terminus moves marginally closer to the membrane whereas the distal portion of the C-terminus swings away from the membrane. Together these data suggest that a new hypothesis for RIPK1 binding during stroke is needed.

    1. Neuroscience
    Anke Braun, Tobias H Donner
    Research Article

    Decisions under uncertainty are often biased by the history of preceding sensory input, behavioral choices, or received outcomes. Behavioral studies of perceptual decisions suggest that such history-dependent biases affect the accumulation of evidence and can be adapted to the correlation structure of the sensory environment. Here, we systematically varied this correlation structure while human participants performed a canonical perceptual choice task. We tracked the trial-by-trial variations of history biases via behavioral modeling and of a neural signature of decision formation via magnetoencephalography (MEG). The history bias was flexibly adapted to the environment and exerted a selective effect on the build-up (not baseline level) of action-selective motor cortical activity during decision formation. This effect added to the impact of the current stimulus. We conclude that the build-up of action plans in human motor cortical circuits is shaped by dynamic prior expectations that result from an adaptive interaction with the environment.