A transient postnatal quiescent period precedes emergence of mature cortical dynamics
- Institute for Genomic Medicine, Columbia University Medical Center, United States
- Department of Biomedical Engineering, Columbia University, United States
- Department of Electrical Engineering, Columbia University, United States
- The Stanley Center at the Broad, United States
- Max Planck Institute of Neurobiology, Germany
- Neuroscience Institute and Department of Neurology New York University Langone Medical Center, United States
- Center for Neural Science, New York University, United States
- Department of Neurobiology, Harvard Medical School, United States
- Department of Neurology, Columbia University Medical Center, United States
Figures
Figure 1 with 5 supplements
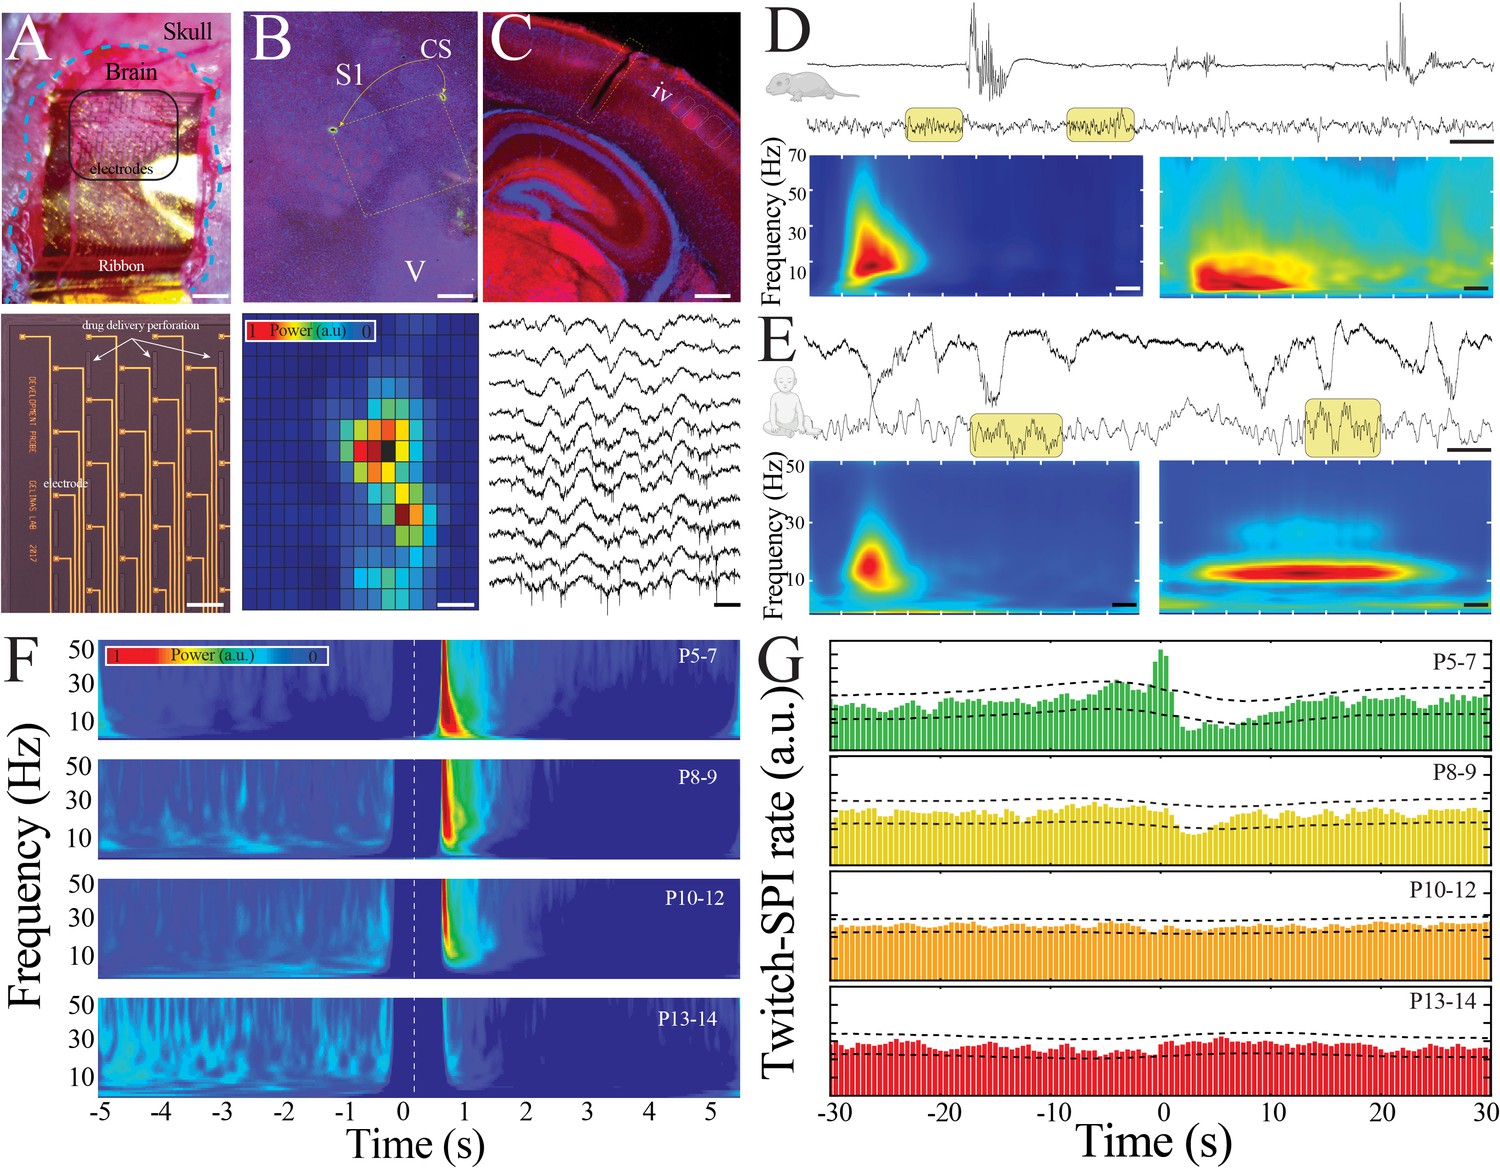
Large-scale, high spatiotemporal resolution recording of neural activity across development in rodents demonstrates conserved features with human electroencephalography (EEG).
(A) Optical micrograph of NeuroGrid conforming to the surface of a P7 mouse pup (upper; scale bar 200 µm). Optical micrograph revealing arrangement of electrodes and perforations in section of NeuroGrid (lower; scale bar 50 µm). (B) Fluorescence microscopy of flattened brain slice from P14 mouse pup demonstrating location of NeuroGrid during recording (yellow dashed lines). vGlut2 immunohistochemistry enables identification of visual and somatosensory cortices. S1: primary somatosensory; V: visual; CS: chitosan marking corners of NeuroGrid (upper; scale bar 200 µm). Spatial distribution of spindle band power across a NeuroGrid array in a P7 mouse pup. Warmer colors signify higher power (lower; scale bar 500 µm). (C) Fluorescence microscopy of coronal brain slice from P7 mouse pup demonstrating location of implantable silicon probe (yellow dashed lines). vGlut2 immunohistochemistry enables identification of barrels in granular layer of cortex (IV) (upper; scale bar 200 µm). Raw traces across a sample of silicon probe electrodes demonstrating localized neural spiking activity in a P13 mouse pup (lower; scale bar 200 ms). (D) Sample raw traces from P5 (upper) and P14 (lower) mouse pups showing shift from discontinuous to continuous activity. Yellow boxes highlight sleep spindles; scale bar 1 s. Spectrograms trigger-averaged on spindle band oscillations (SPIs) in P5 (left) and P14 (right) mouse pups (n = 50 oscillations from each sample session; scale bar 200 ms). (E) Sample raw traces from 37-week post-gestational age (upper) and 58-week post-gestational age (lower) human subjects showing shift from discontinuous to continuous activity. Yellow boxes highlight sleep spindles; scale bar 1 s. Spectrograms trigger-averaged on SPIs in 37-week post-gestational age (left) and 58-week post-gestational age (right) subjects (n = 50 oscillations from each sample session; scale bar 200 ms). (F) Twitch-triggered spectrograms (twitch center at time = 0, white dashed line) show a progressive decrease in movement-evoked oscillatory activity across development (n = 6716 twitches from n = 52 pups). Note power temporally coincident with twitch is set to zero to avoid any potential artifactual contamination. (G) Cross-correlation of twitch and detected SPIs decreases across development. Dashed lines are 95% confidence intervals; time 0 = twitch (n = 6716 twitches from n = 52 pups).
Figure 1—figure supplement 1
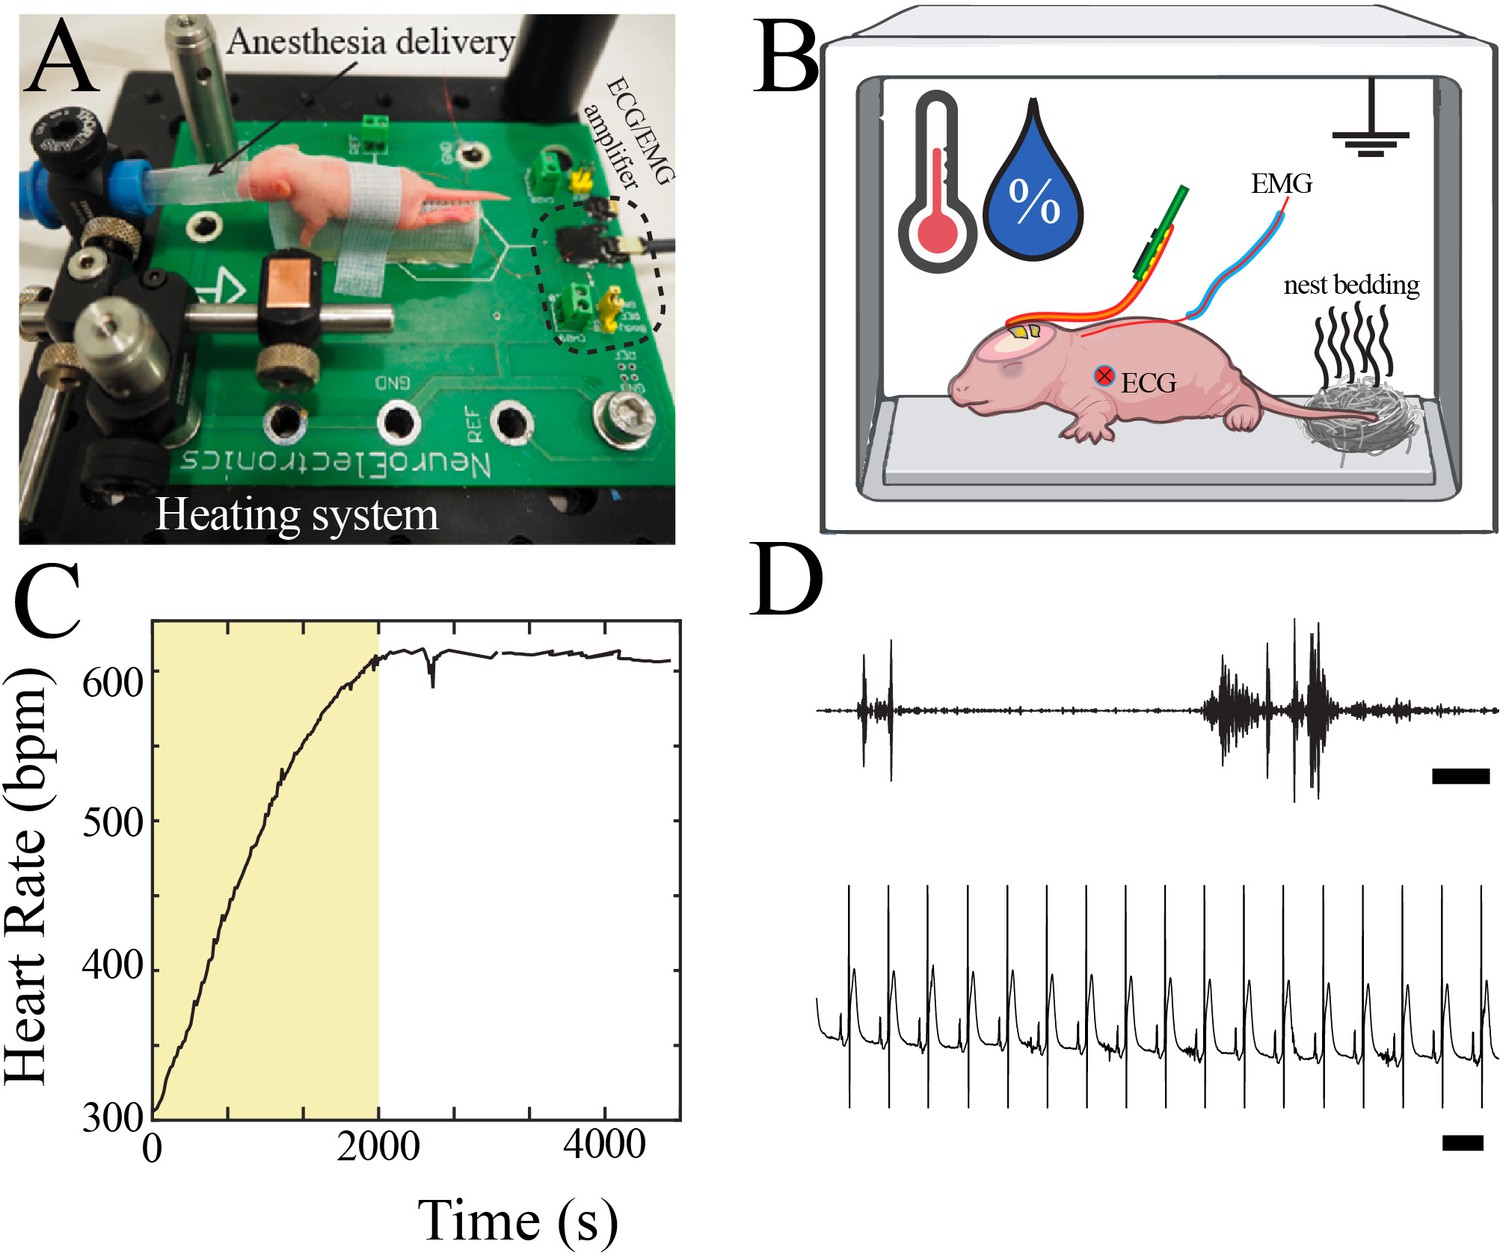
Neurophysiological recording in mouse pups.
(A) Customized surgical set-up with P7 pup for scale. (B) Schematic of neurophysiological recording set-up with continuous recording of electromyography (EMG) and electrocardiography (ECG), control of temperature and humidity, and placement of familiar olfactory cues. (C) Heart rate increased to a plateau approximately 30 min after completion of surgical procedure. Data from epoch denoted by yellow box was not used for neurophysiological analysis. (D) Sample high-pass filtered trace from EMG electrode demonstrated interspersed bursts of EMG activity (upper, scale bar 1 s). Sample raw trace from ECG electrode demonstrated regular heart rate (lower, scale bar 100 ms).
Figure 1—figure supplement 2
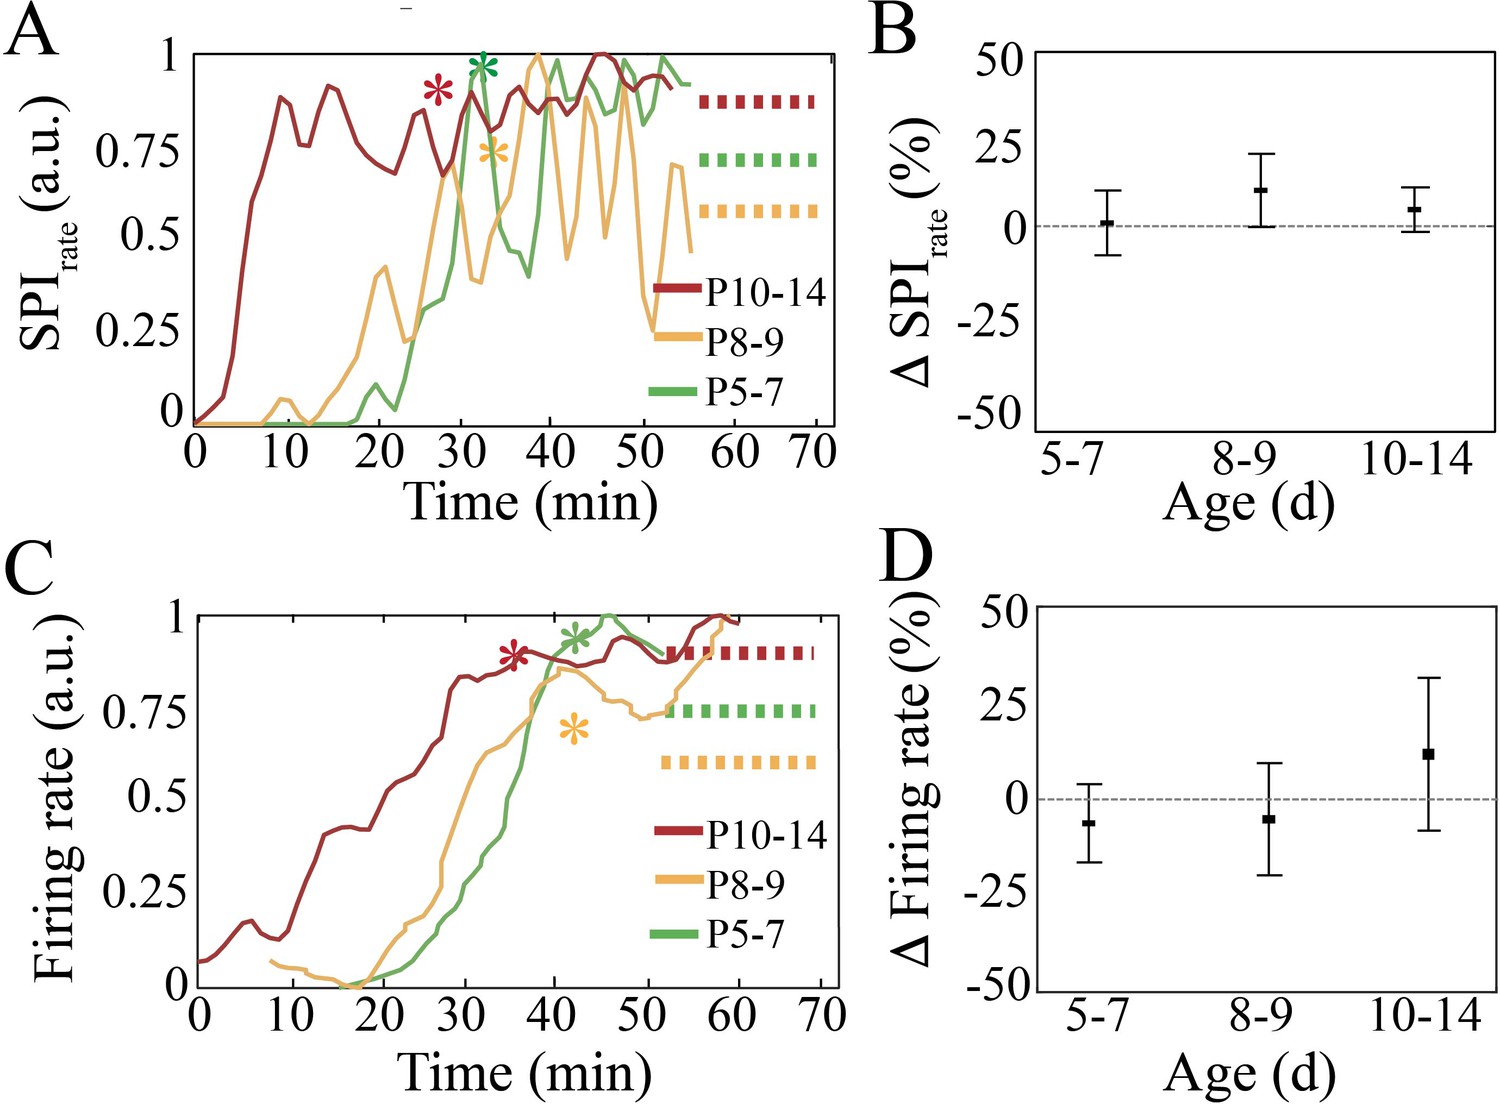
Recovery of spindle band oscillation occurrence rate and neural spiking after anesthesia for neural interface device placement.
(A) Normalized spindle band oscillation occurrence rate increases after anesthesia and stabilizes. Asterisks represent timepoint after which data was used for neural analysis. (B) Spindle band occurrence rate does not significantly change when comparing the last 20 min of the recording with respect to the first 20 min used for analysis (n = 38, p=0.84). (C) Normalized spike firing rate increases after anesthesia and stabilizes. Asterisks represent time point after which data was used for neural analysis. (D) Neural spiking rate does not significantly change when comparing the last 20 min of the recording with respect to the first 20 min used for analysis (n = 38 pups, p=0.22).
Figure 1—figure supplement 3
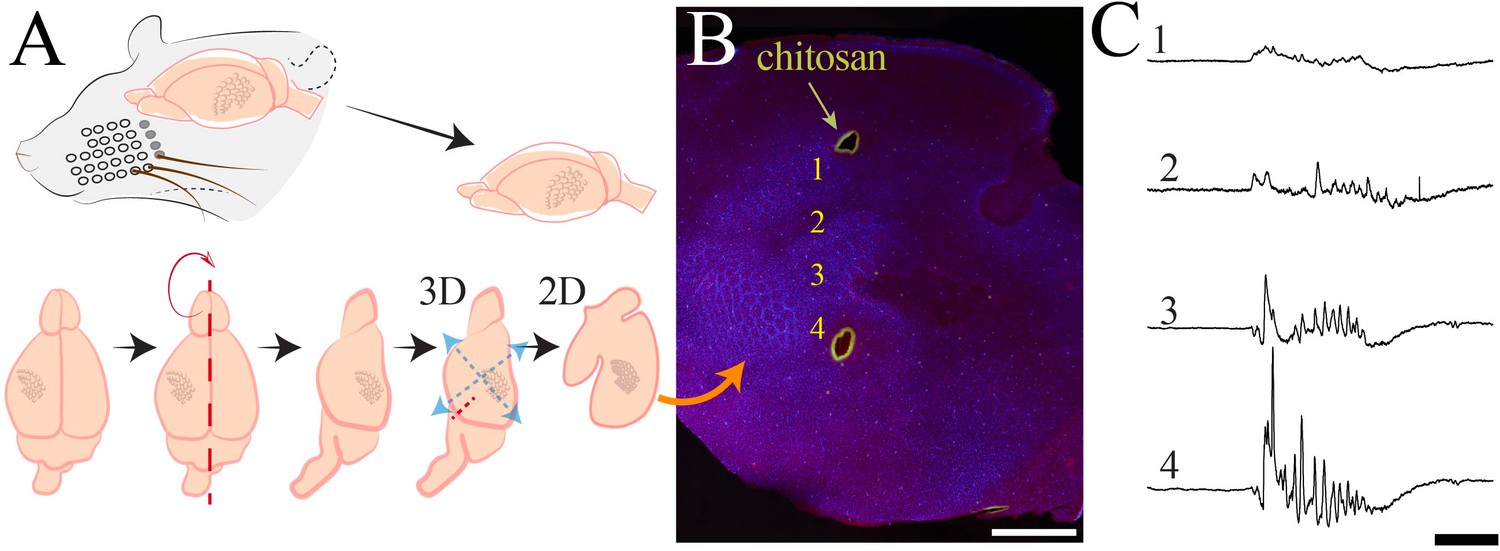
Histological processing and anatomical localization of NeuroGrid electrodes.
(A) Schematic demonstrating flattening of cortical mantle for immunohistochemical processing. (B) Reconstruction of NeuroGrid location using chitosan marking (green) relative to somatosensory and visual cortices (visualized with vGlut2 + DAPI immunohistochemistry). Traces from numbered locations are represented in (C). Scale bar 1.5 mm. (C) Sample raw traces of a spindle burst oscillation from NeuroGrid electrodes at numbered locations in (B). Scale bar 500 ms.
Figure 1—figure supplement 4
Localized neural spiking across cortical layers.
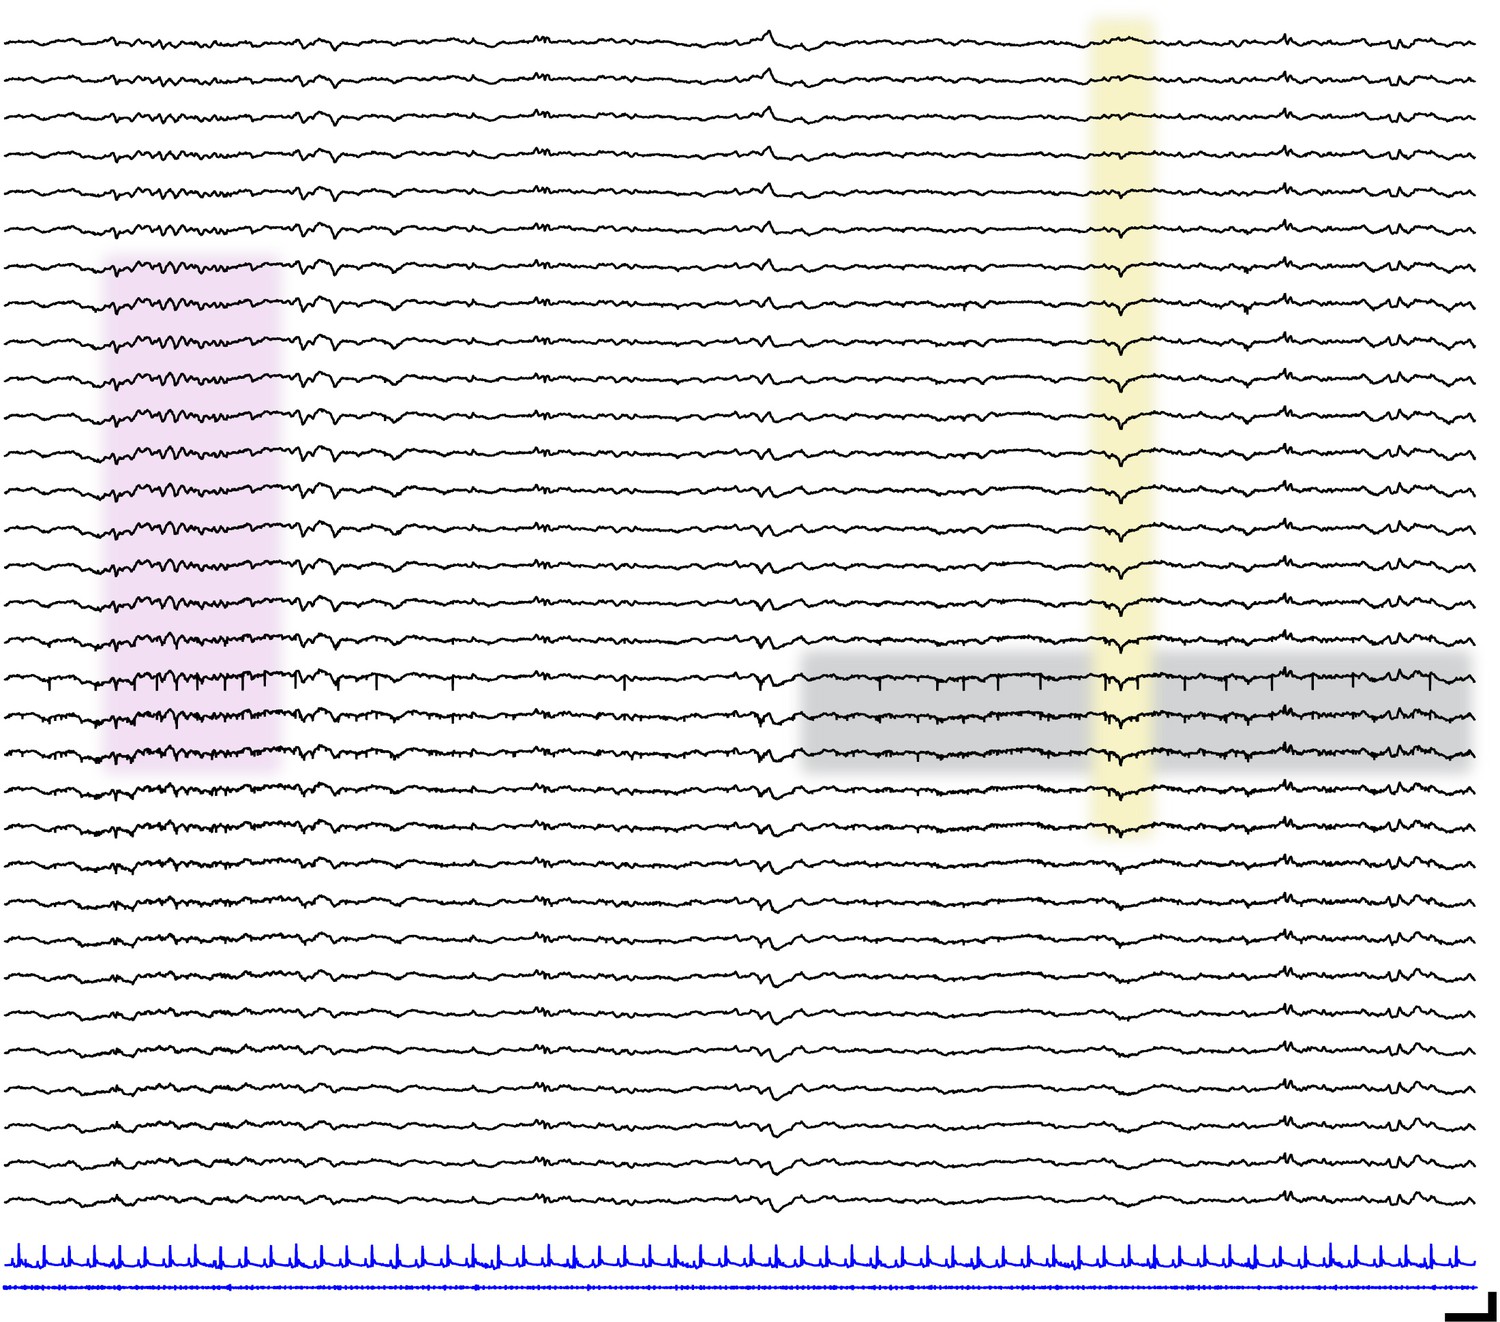
Sample raw traces spanning cortical layers (black; upper = most superficial, lower = deepest) in a P13 mouse pup. Corresponding electrocardiography (blue, upper) and electromyography traces (blue, lower). Pink shaded box shows spindle band oscillation. Yellow shaded box highlights transcortical reversal of local field potential waveform. Gray shaded box shows localized spiking activity. Scale bar 250 ms, 200 µV.
Figure 1—figure supplement 5
Isolation of putative quiet/non-rapid eye movement (NREM) epochs in mouse pups.
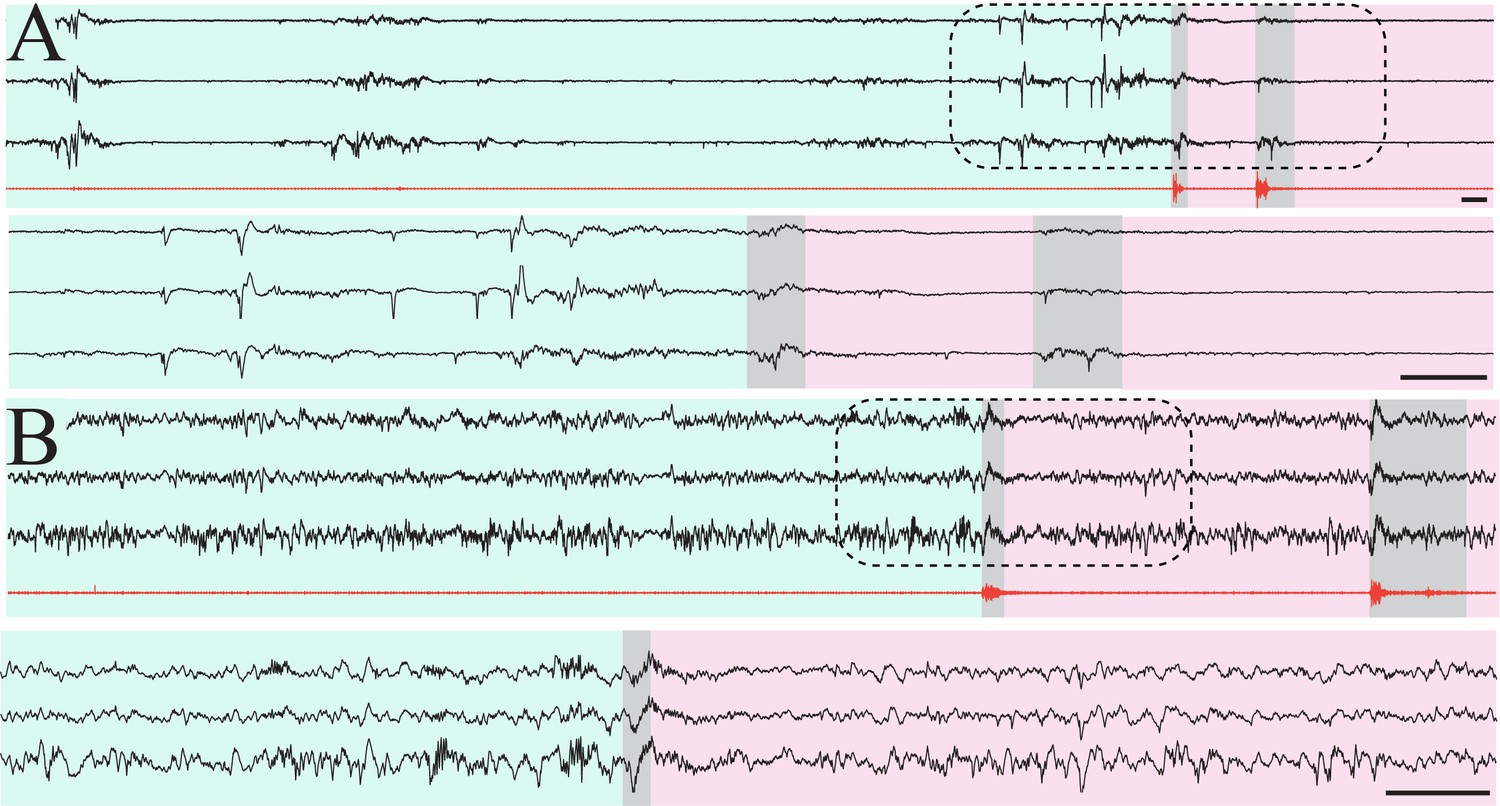
(A) Three sample raw traces from P7 mouse pup (black) and high-pass filtered electromyography (EMG) trace (red). Green shaded area indicates epoch of muscle atonia lasting > 10 s, consistent with putative quiet sleep. Scale bar 1 s. Gray shaded areas highlight myoclonic twitches. Pink shaded area indicates epoch with recurrent myoclonic twitches, consistent with putative active sleep. Lower three traces are zoomed-in area denoted by dashed line box. Scale bar 1 s. (B) Three sample raw traces from P14 mouse pup (black) and high-pass filtered EMG trace (red). Green shaded area indicates epoch of muscle atonia lasting > 10 s, consistent with putative NREM sleep. Scale bar 1 s. Gray shaded areas highlight myoclonic twitches. Pink shaded area indicates epoch with recurrent myoclonic twitches, consistent with putative REM sleep. Lower three traces are zoomed-in area denoted by dashed line box. Scale bar 1 s.
Figure 2 with 4 supplements
Duration and power of cortical oscillatory activity transiently decreases at the beginning of the second postnatal week.
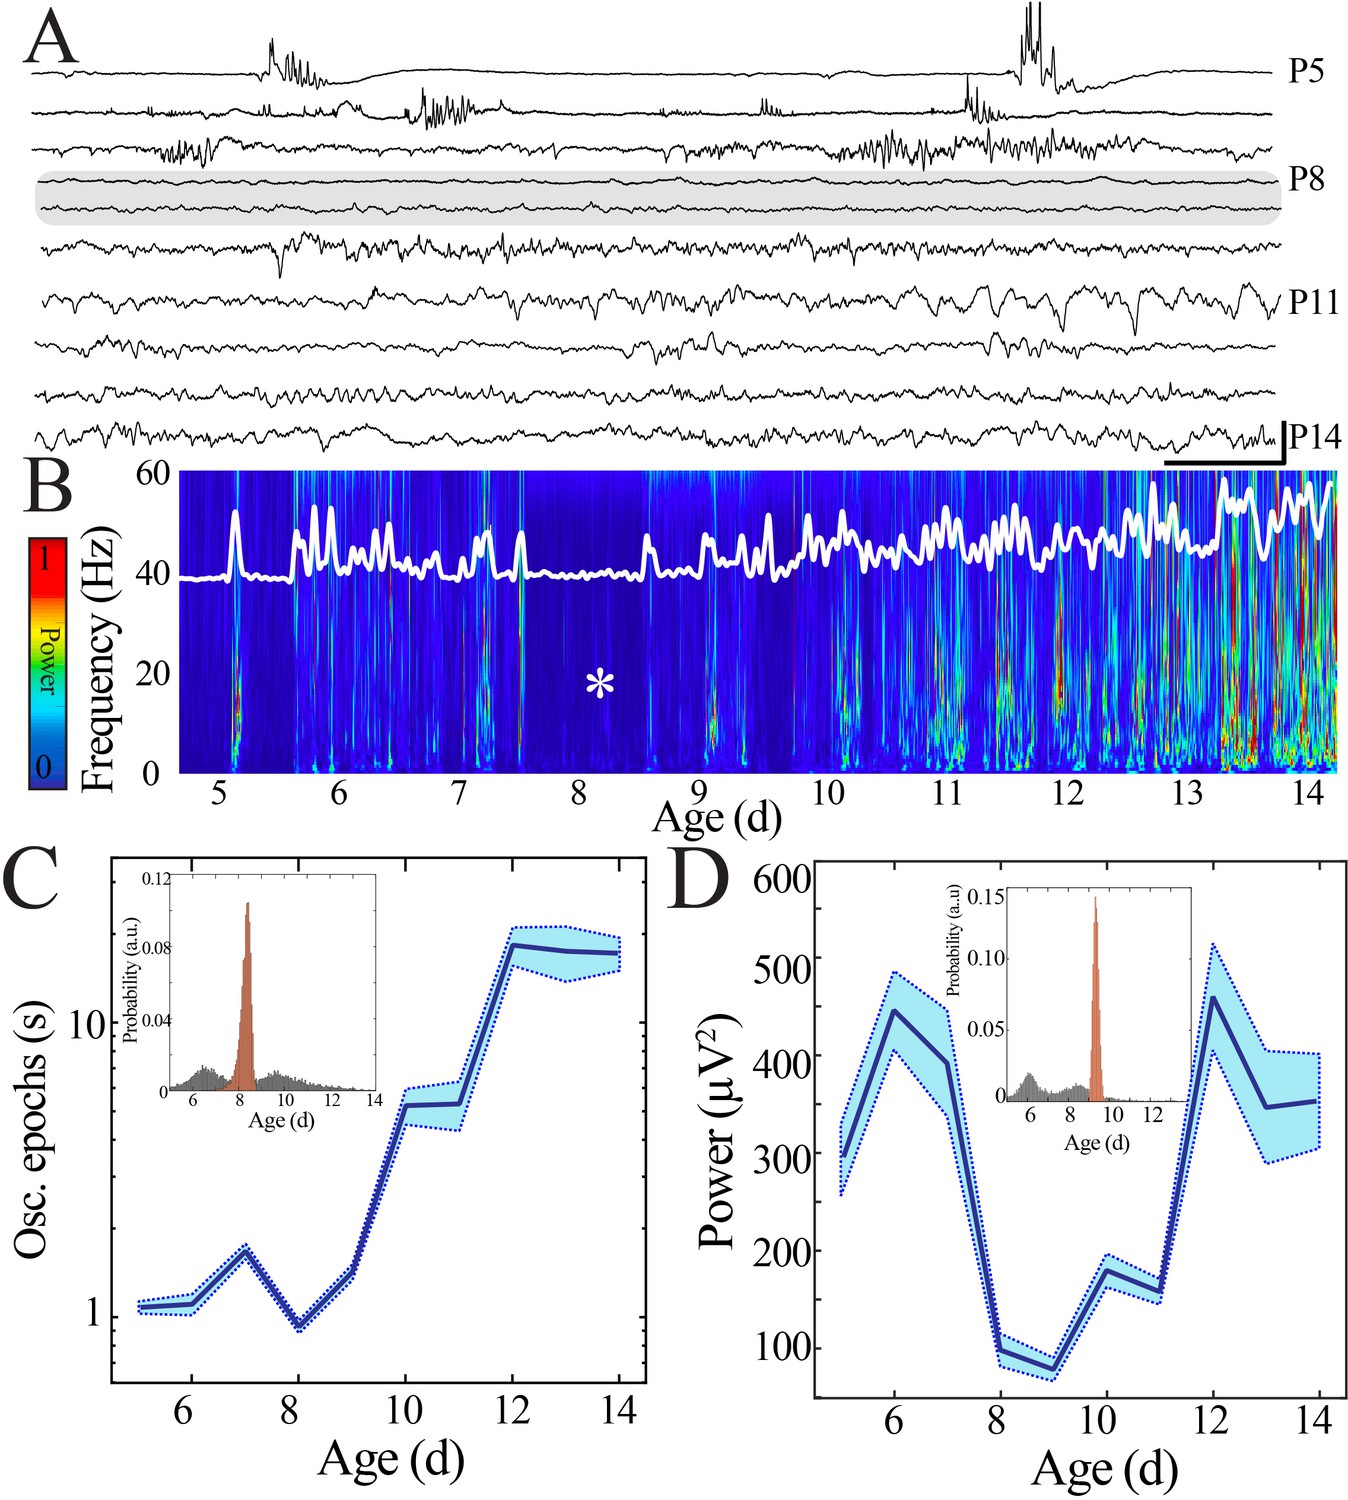
(A) Sample raw NeuroGrid traces from P5–14 mouse pups demonstrating changing characteristics of oscillatory patterns across development with relative paucity of activity at P8 and P9 (shaded gray box). Scale bar 1 s, 250 µV. (B) Compilation of individual spectrograms (60 s duration) from a sample session per day of age demonstrates a transient reduction in local field potential power at the beginning of the second postnatal week. The white superimposed trace represents the overall instantaneous power of neural activity. (C) Duration of oscillatory epochs increases nonlinearly across development (blue line = mean; shaded blue areas ± SE) with a local minimum at the beginning of the second postnatal week (n = 70 pups). Inset shows probability of a local minimum located at each age for datapoints resampled with replacement across days (gray) compared to datapoints resampled with replacement within days (orange), confirming existence of local minimum between P8 and 9. (D) Wideband (WB) power changes nonlinearly across development (blue line = mean; shaded blue areas ± SE), with a local minimum at the beginning of the second postnatal week (n = 70 pups). Inset shows probability of a local minimum located at each age for datapoints resampled with replacement across days (gray) compared to datapoints resampled with replacement within days (orange), confirming existence of local minimum between P8 and 9.
Figure 2—figure supplement 1
Average power spectra across development.
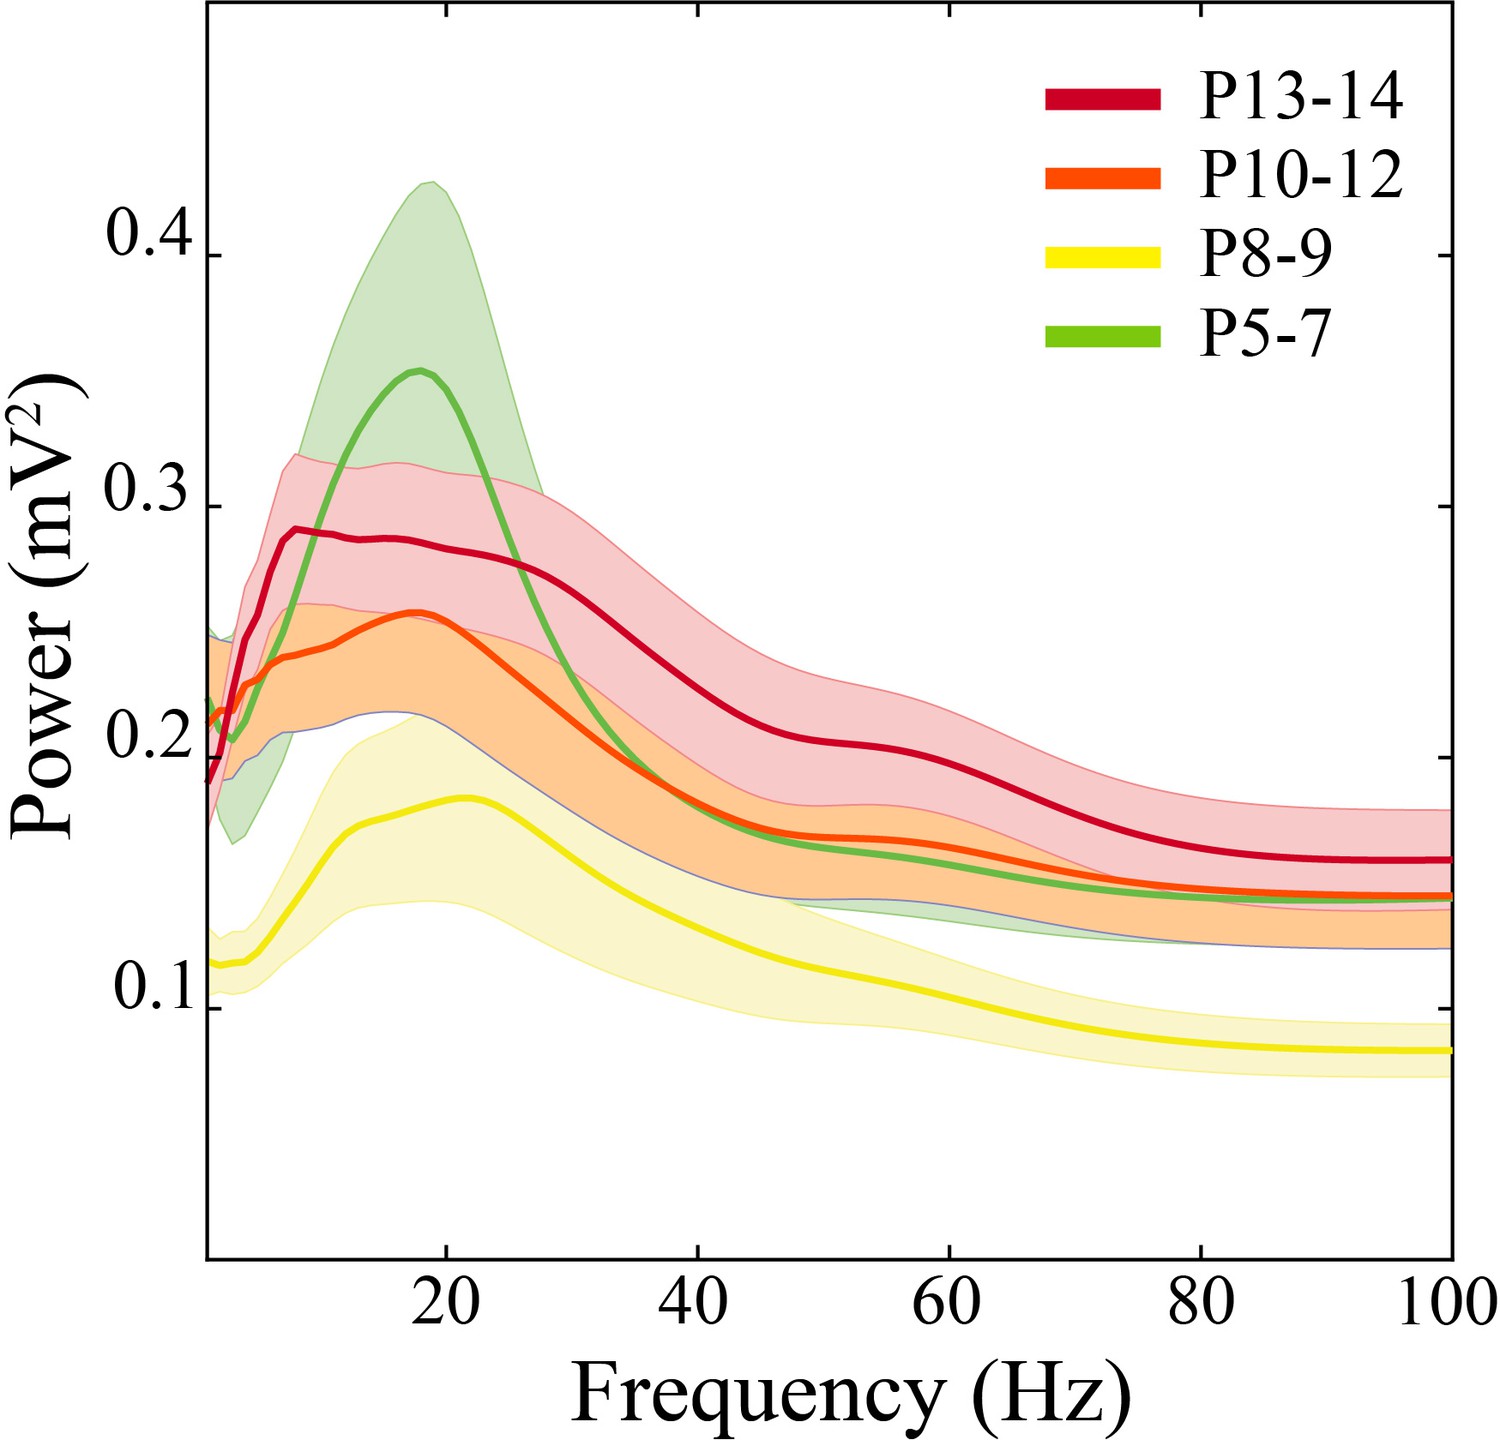
Spectral power in P8–9 pups is low power with a paucity of well-defined peaks (n = 51 pups, solid line = mean, shaded error bars = ±SE).
Figure 2—figure supplement 2
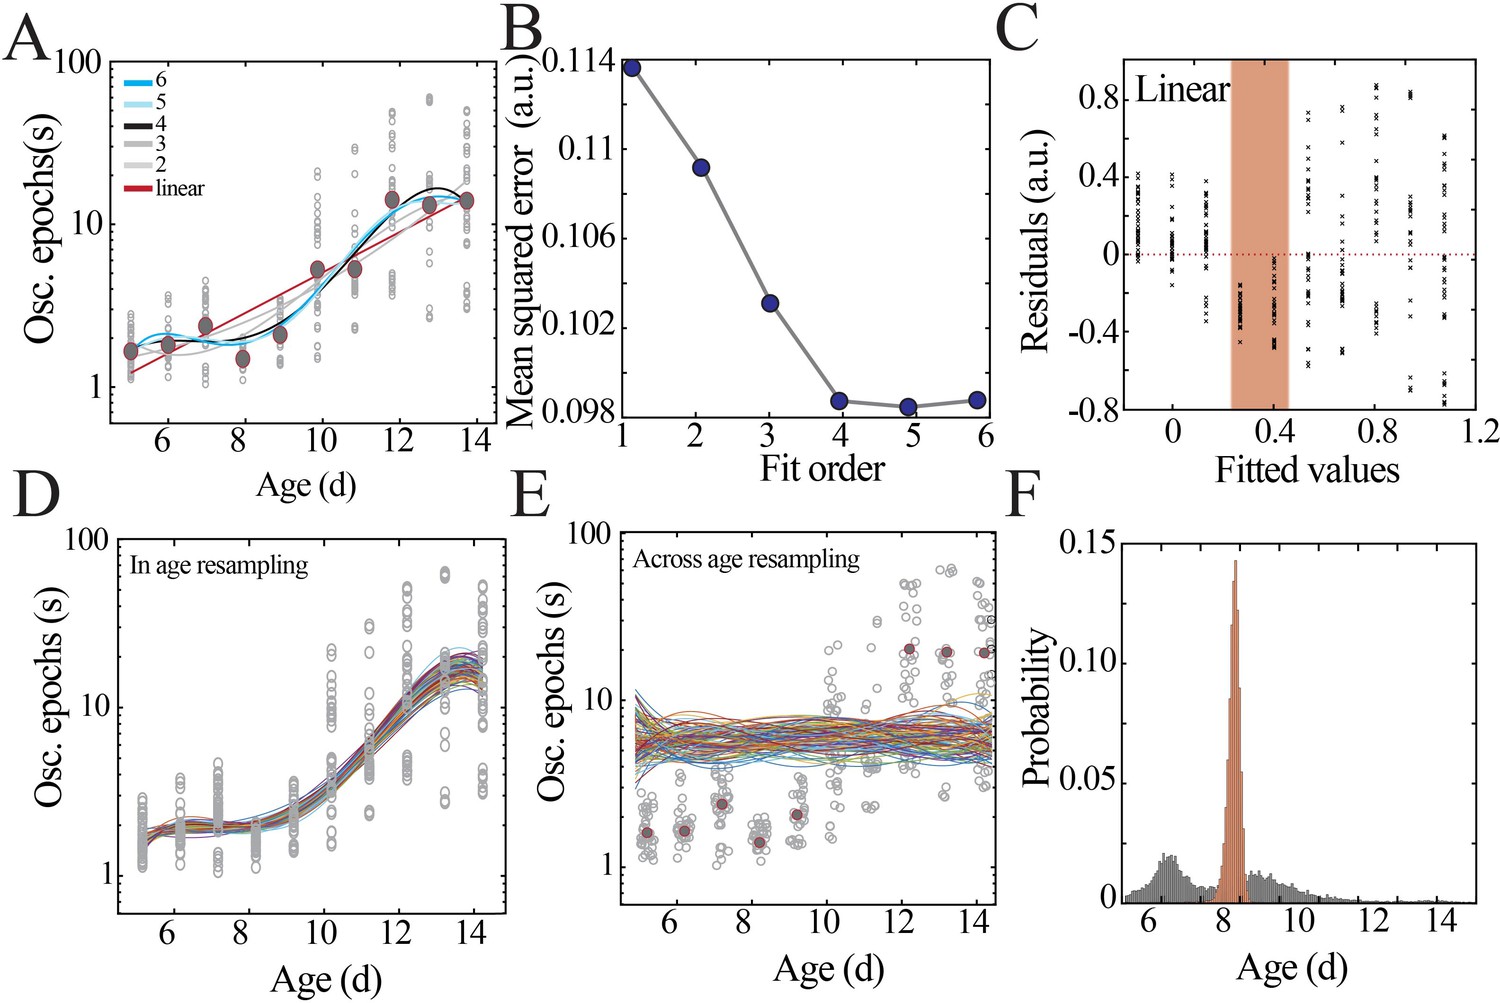
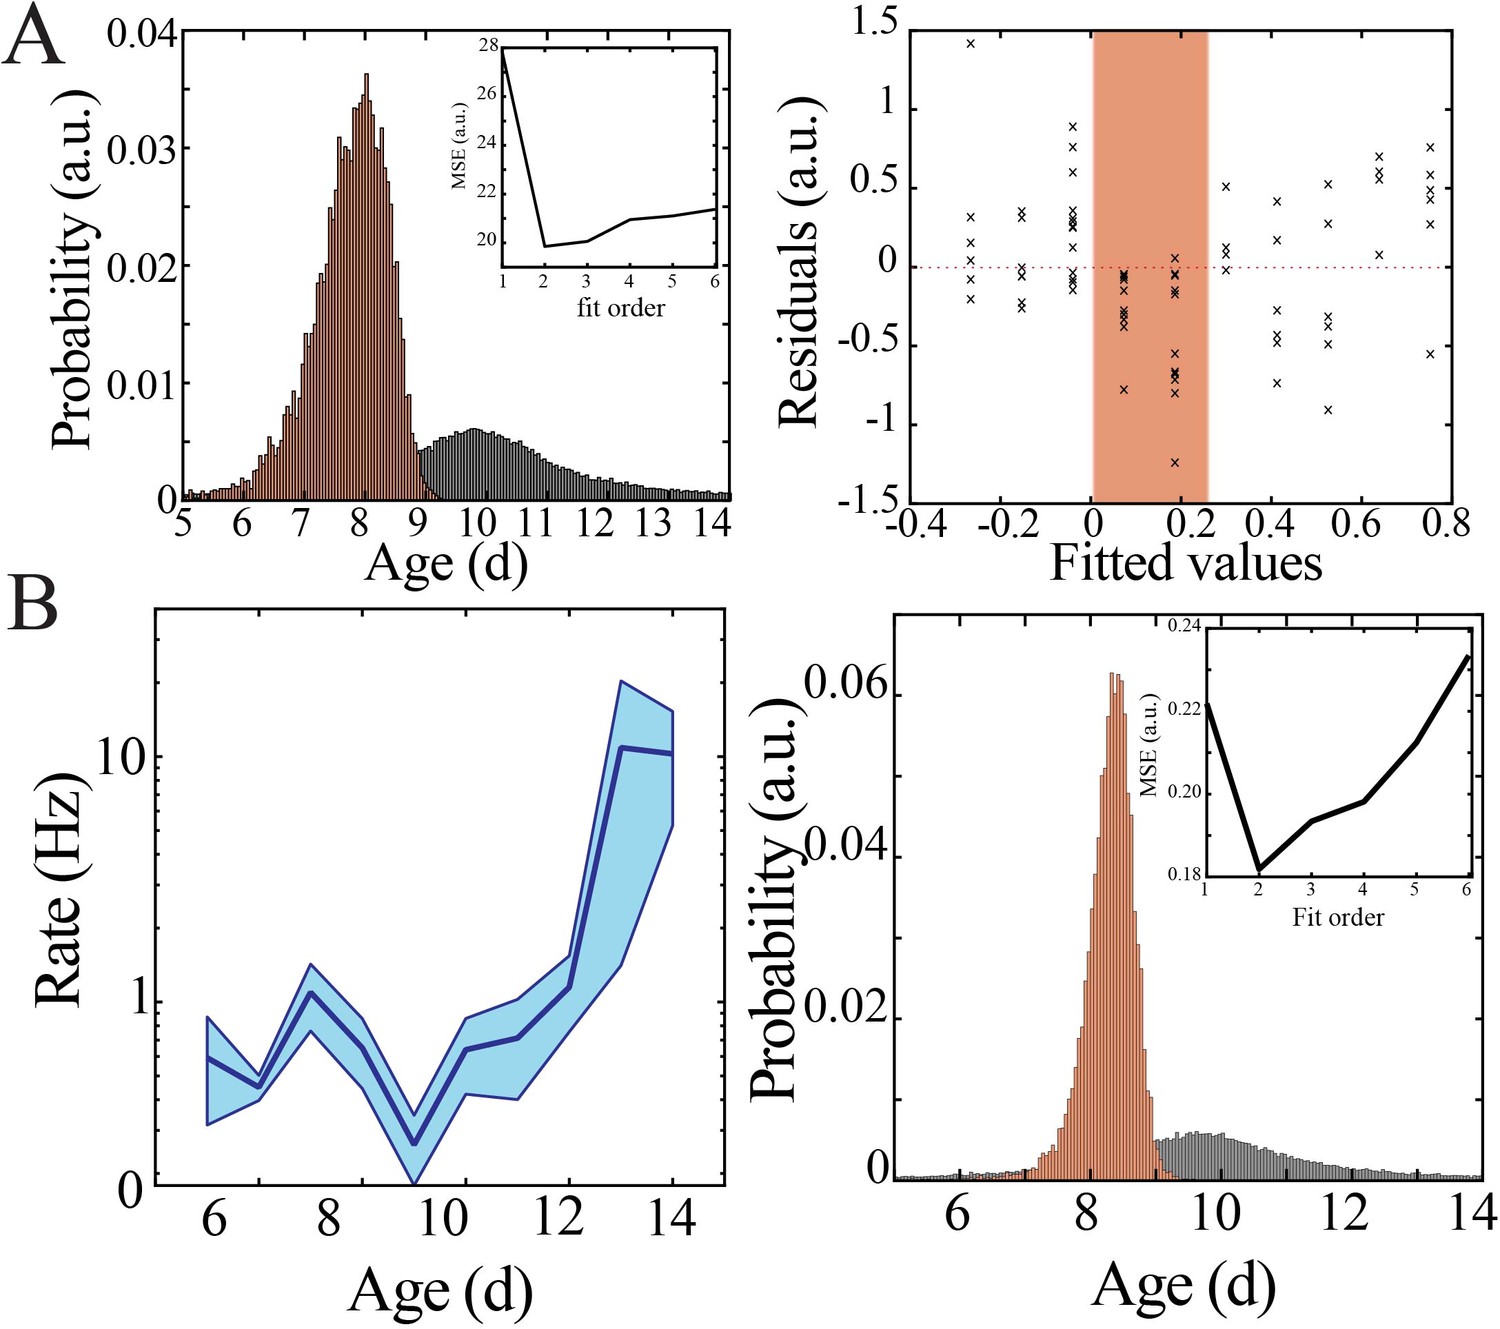
Model fitting and selection with bootstrapping to identify local minima.
(A) Datapoints from Figure 2C (gray circles) with superimposed regression models (linear, second- to sixth-order polynomials). (B) Leave-one-out cross-validation to evaluate fit of each model without overfitting, quantified by mean squared error. (C) Plot of residuals obtained from linear regression fitting; note systematic deviation from zero, especially at the beginning of the second postnatal week (orange shaded box). (D) Distributions obtained by within-age resampling with replacement (10,000 iterations). For visualization purposes, only 100 randomly selected fits are displayed. (E) Distributions obtained by across-age resampling with replacement (10,000 iterations). For visualization purposes, only 100 randomly selected fits are displayed. (F) Comparison of nadir localization from distributions in (D) and (E) revealing significantly increased probability of local minimum between P8 and 9.
Figure 2—figure supplement 3
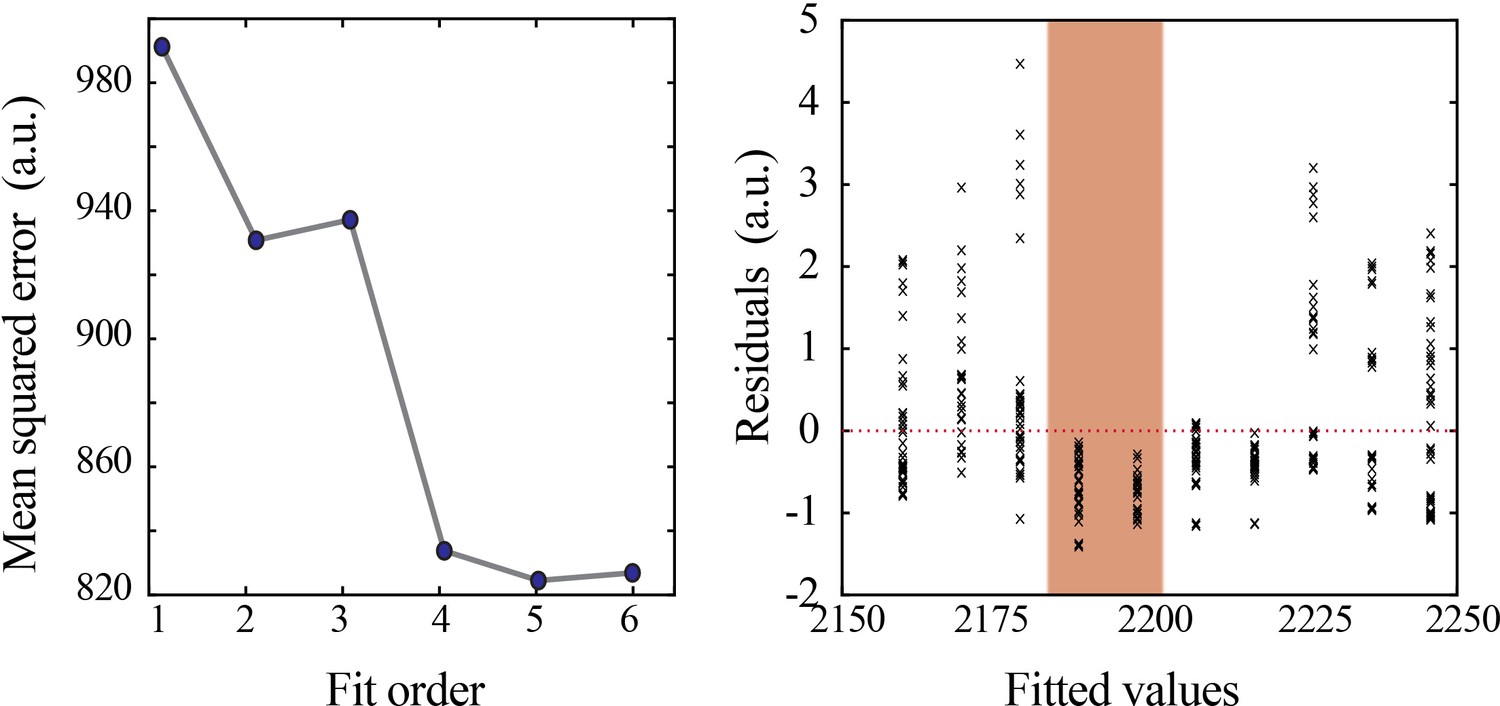
Model selection and verification of nonlinear developmental trajectory for wideband power in mice.
Leave-one-out cross-validation to evaluate fit of each model for wideband power, quantified by mean squared error (left). Plot of residuals obtained from linear regression fitting (right); note systematic deviation from zero, especially at the beginning of the second postnatal week (orange shaded box).
Figure 2—figure supplement 4
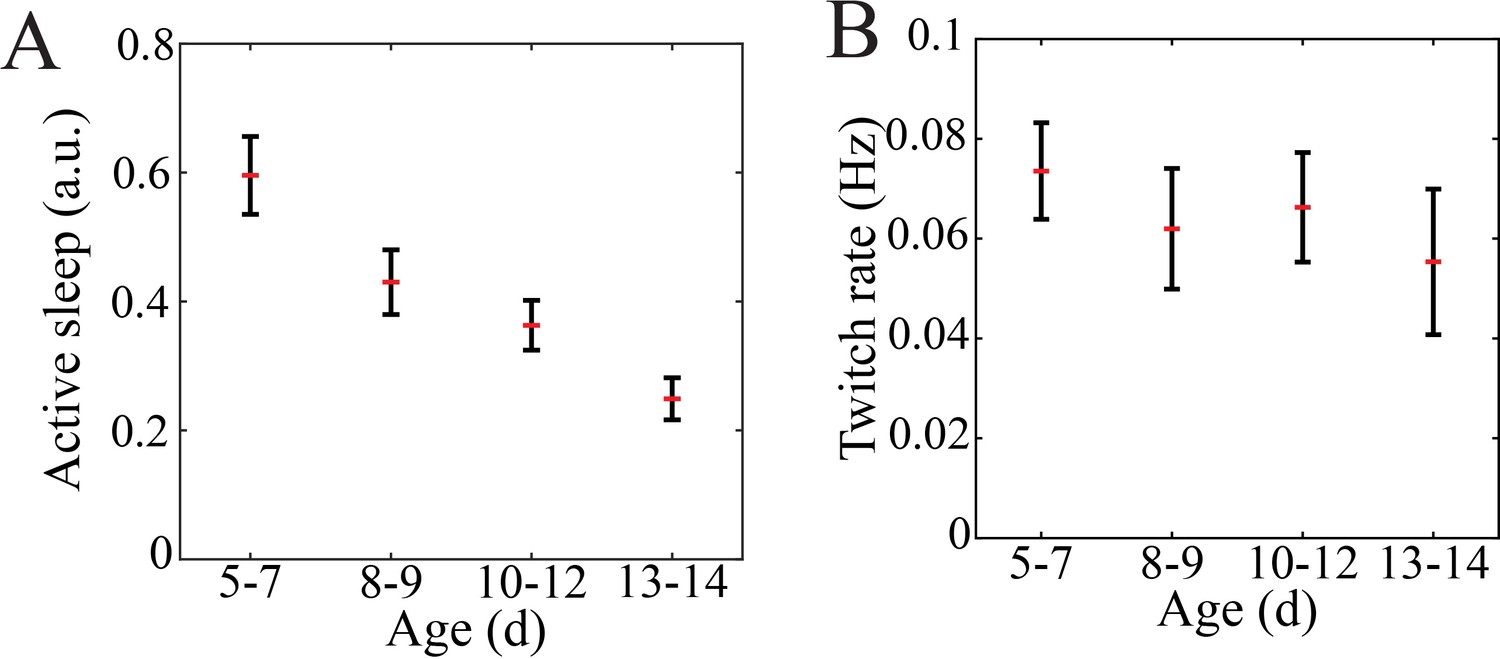
Quantification of sleep proportion and twitch rate in mouse pups.
(A) The proportion of putative active relative to quiet sleep decreased gradually with maturation (n = 47 pups, p=0.0002; post-hoc testing reveals significant difference between P5–7 and P10–12 (0.0038) as well as P5–7 and P13–14 (p=0.0002); there was no significant difference between P8–9 and any other group). (B) Self-generated sleep movements (twitch) rate does not significantly change with maturation (n = 47 pups, p=0.086).
Figure 3 with 2 supplements
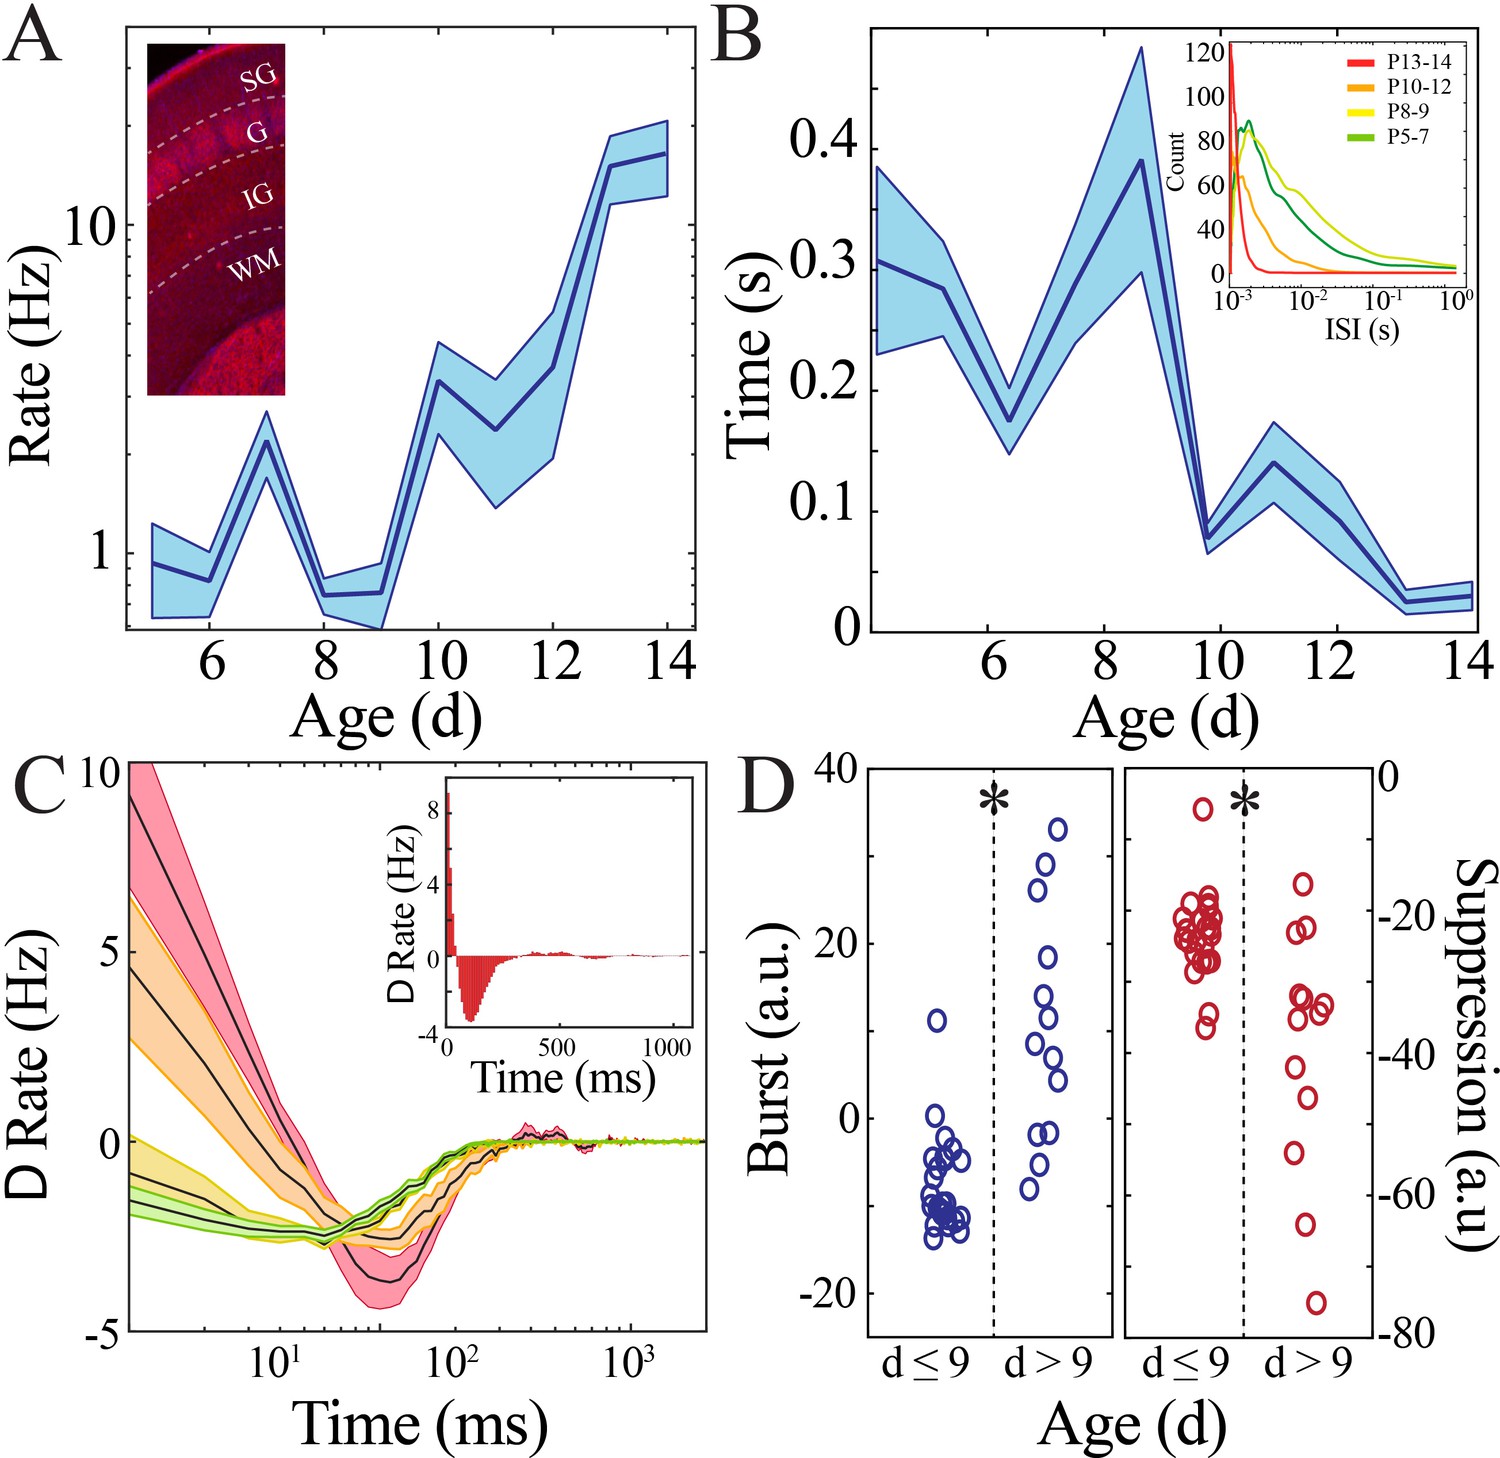
Rate and temporal precision of neural spiking increase after the beginning of the second postnatal week.
(A) Neural spiking rate (layers IV–VI) increases nonlinearly across development (blue line = mean; shaded blue areas ± SE) with a local minimum at the beginning of the second postnatal week (n = 38 pups). Inset shows that vGlut2 immunohistochemistry facilitates identification of layers in barrel cortex (left; SG: supragranular; G: granular; IG: infragranular; WM: white matter). (B) Inter-spike interval of spiking activity decreases nonlinearly across development (blue line = mean; shaded blue areas ± SE) with a local maximum at the beginning of the second postnatal week (n = 38 pups). Inset shows histogram distribution of 10,000 inter-spike intervals randomly selected per age group (red = P13–14, orange = P10–12, yellow = P8–9, green = P5–7). (C) Average amount of significantly positively correlated (>95% upper confidence interval, corresponding to a rate change > 0) or negatively correlated (<95% lower confidence interval, corresponding to a rate change < 0) neural spiking as computed using spike autocorrelation (traces are mean ± SE). Sample autocorrelation of population neural spiking used for deriving the significant correlations in a P14 pup (inset). Significantly correlated neural spiking at fine-time scales (<50 ms) emerged starting at P10 (n = 38 pups; P5–7 = green, P8–9 = yellow; P10–12 = orange; P13–14 = red). (D) Average amount of significant positive and negative correlation (outside of 95% confidence intervals) that occurs within 50 ms (burst window; n = 38 pups, z = −4.2, p=2.5e−5) and 50–500 ms (suppression window; n = 38 pups, z = 3.0, p=0.002) as computed using spike autocorrelation for immature and mature pups.
Figure 3—figure supplement 1
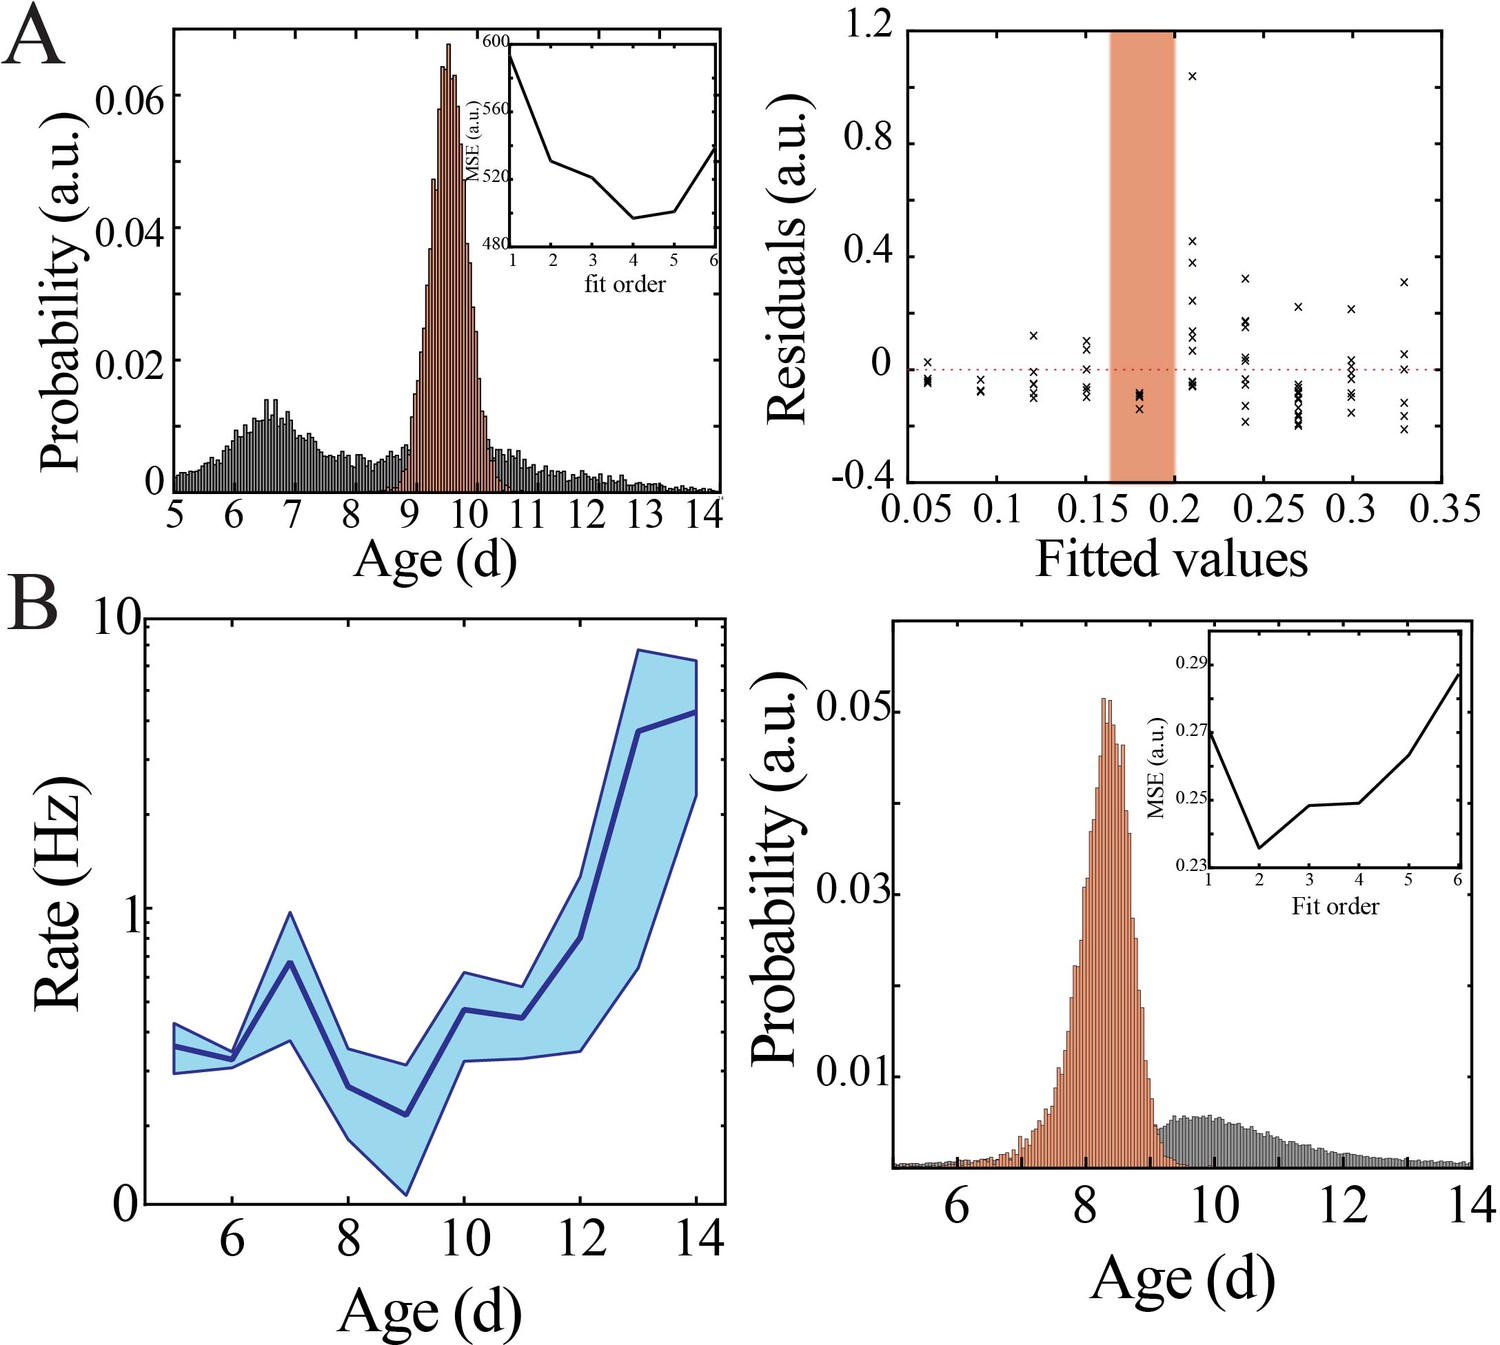
Bootstrapping, model selection and verification of nonlinear developmental trajectory for spiking recruitment to neural spiking rate in mice.
(A) Comparison of nadir localization from distributions obtained by bootstrapping across ages (gray) and within ages (orange) revealing significantly increased probability of local minimum at the beginning of the second postnatal week (left) for neural spiking rate. Leave-one-out cross-validation to evaluate fit of each model, quantified by mean squared error (MSE). Plot of residuals obtained from linear regression fitting (right); note systematic deviation from zero, especially at the beginning of the second postnatal week (orange shaded box). (B) Neural spiking rate increases nonlinearly across development in superficial cortical layers (left; blue line = mean; shaded blue areas ± SE) with a local minimum at the beginning of the second postnatal week (n = 38 pups). Comparison of nadir localization from distributions obtained by bootstrapping across ages (gray) and within ages (orange) revealing significantly increased probability of local minimum at the beginning of the second postnatal week (right) for neural spiking rate. Leave-one-out cross-validation to evaluate fit of each model, quantified by MSE (inset).
Figure 3—figure supplement 2
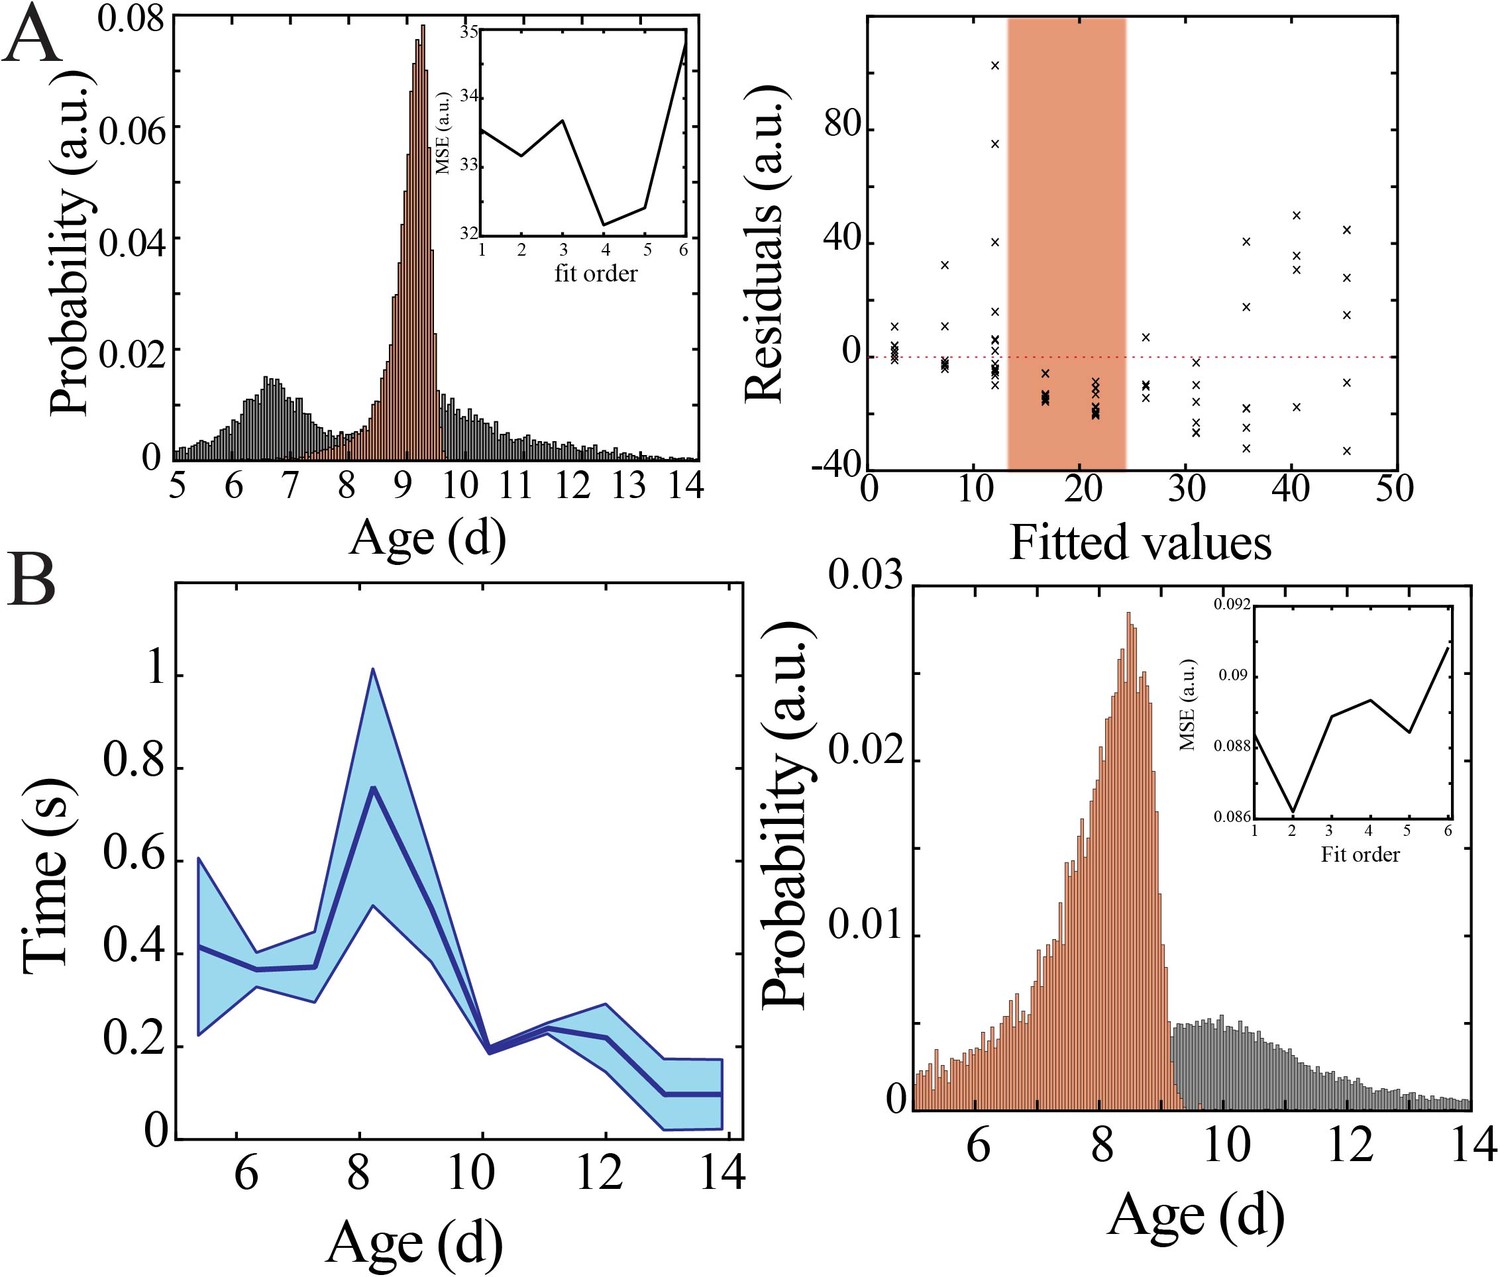
Bootstrapping, model selection and verification of nonlinear developmental trajectory for spiking recruitment to inter-spike interval in mice.
(A) Comparison of nadir localization from distributions obtained by bootstrapping across ages (gray) and within ages (orange) revealing significantly increased probability of local maximum at the beginning of the second postnatal week (left) for inter-spike interval. Leave-one-out cross-validation to evaluate fit of each model, quantified by mean squared error (MSE). Plot of residuals obtained from linear regression fitting (right); note systematic deviation from zero, especially at the beginning of the second postnatal week (orange shaded box). (B) Inter-spike interval of spiking activity decreases nonlinearly across development in superficial cortical layers (left; blue line = mean; shaded blue areas ± SE) with a local maximum at the beginning of the second postnatal week (n = 38 pups). Comparison of nadir localization from distributions obtained by bootstrapping across ages (gray) and within ages (orange) revealing significantly increased probability of local maximum at the beginning of the second postnatal week (right) for inter-spike interval. Leave-one-out cross-validation to evaluate fit of each model, quantified by MSE (inset).
Figure 4 with 1 supplement
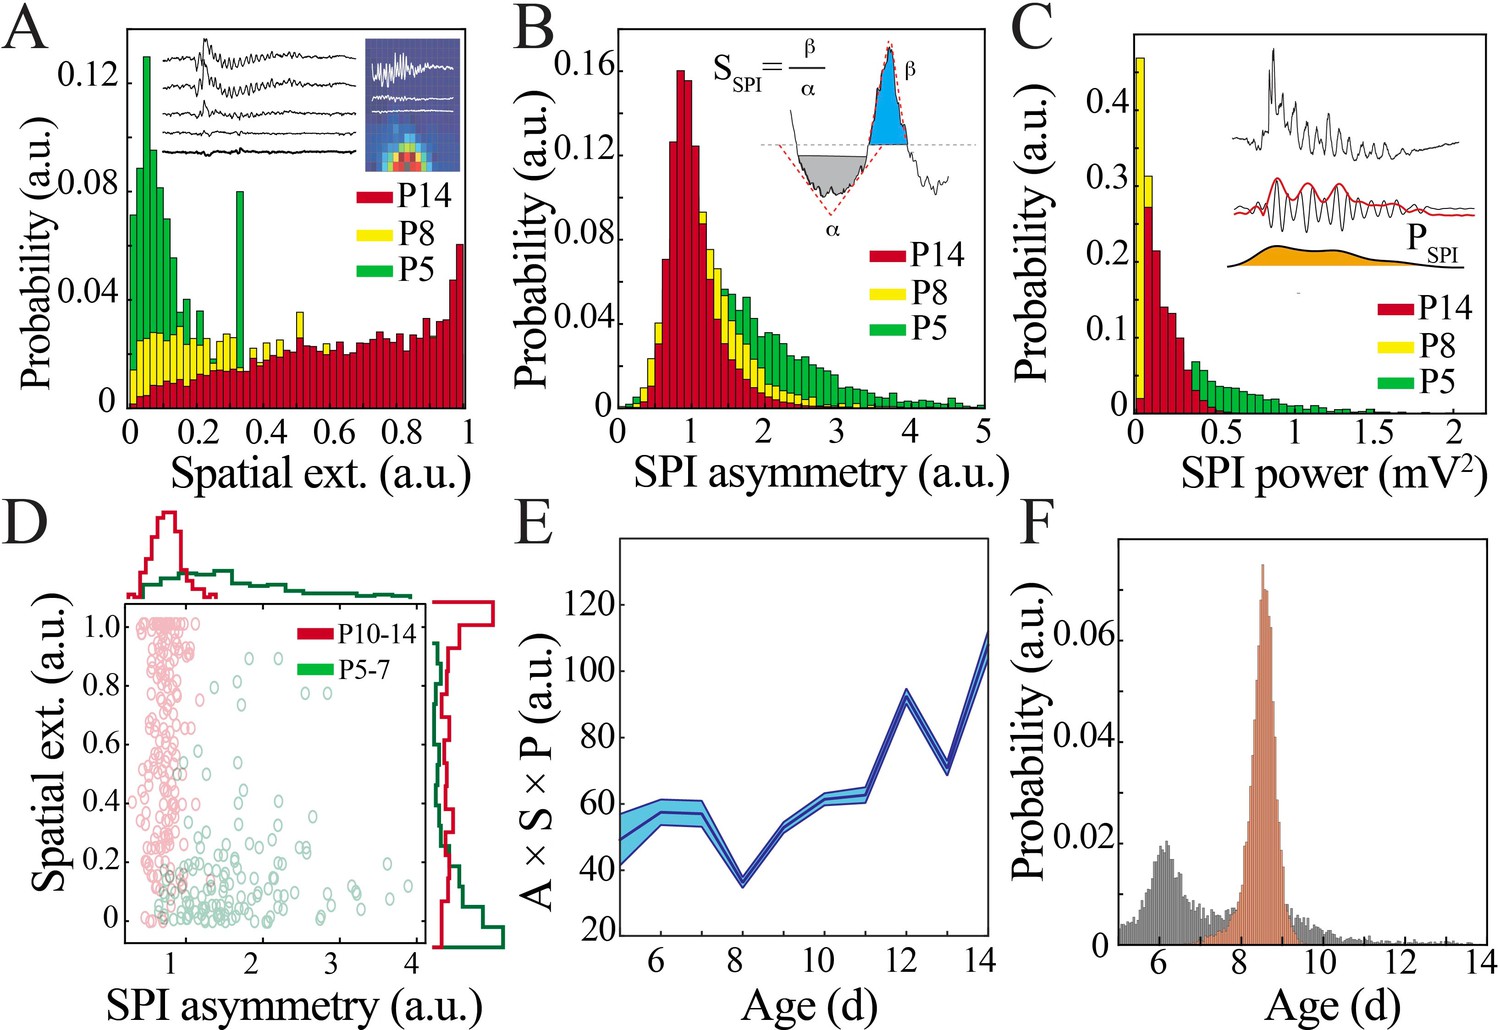
Key functional oscillatory properties transition at the beginning of the second postnatal week.
(A) Magnitude and variability of spindle band oscillation spatial extent varies across pup development (n = 44 pups, 42,335 spindle band oscillations; Kolmogorov–Smirnov [KS] statistic P5 vs. P8 = 0.47, p<0.001; P5 vs. P14 = 0.71, p<0.001; P8 vs. P14 = 0.26, p<0.001; all p-values adjusted for multiple comparisons using Bonferroni correction). Inset shows sample raw traces from spatially distributed NeuroGrid electrodes (left) and average spindle band power across NeuroGrid array (each square represents one NeuroGrid electrode; warmer traces indicate higher power) from a P5 pup. (B) Waveform asymmetry of spindle band oscillations decreases across pup development (n = as in Figure 3A; KS statistic P5 vs. P8 = 0.37, p<0.001; P5 vs. P14 = 0.52, p<0.001; P8 vs. P14 = 0.20, p<0.001; all p-values adjusted for multiple comparisons using Bonferroni correction). Inset shows the process of extracting the angles associated with peak and trough as well as formula for asymmetry index. (C) Power of spindle band oscillations decreases across pup development (n = as in Figure 3A; KS statistic P5 vs. P8 = 0.69, p<0.001; statistic P5 vs. P14 = 0.42, p<0.001; P8 vs. P14 = 0.54, p<0.001; all p-values adjusted for multiple comparisons using Bonferroni correction). Inset demonstrates process of extracting spindle band power, from raw trace to filtered trace and extraction of Hilbert power envelope for sample spindle band oscillation from P5 pup. (D) Classification of spindle band events based on their spatial extent and waveform asymmetry for immature (P5–7, green) and mature (P10–14, red) pups. Superimposed line plots demonstrate the marginal probability for each event type (n = 315 events, waveform asymmetry and spatial extent of the marginal probability distributions of immature and mature animals are significantly different; p<0.001). (E) Combinatorial metric of spindle band waveform properties (A: asymmetry; S: spatial extent; P: power) increases nonlinearly across development (black line = mean; shaded blue areas ± SE) with a local minimum at the beginning of the second postnatal week (n = 44 pups). (F) Probability of a local minimum located at each age for datapoints resampled with replacement across days (gray) compared to datapoints resampled with replacement within days (orange), confirming existence of local minimum between P8 and 9.
Figure 4—figure supplement 1
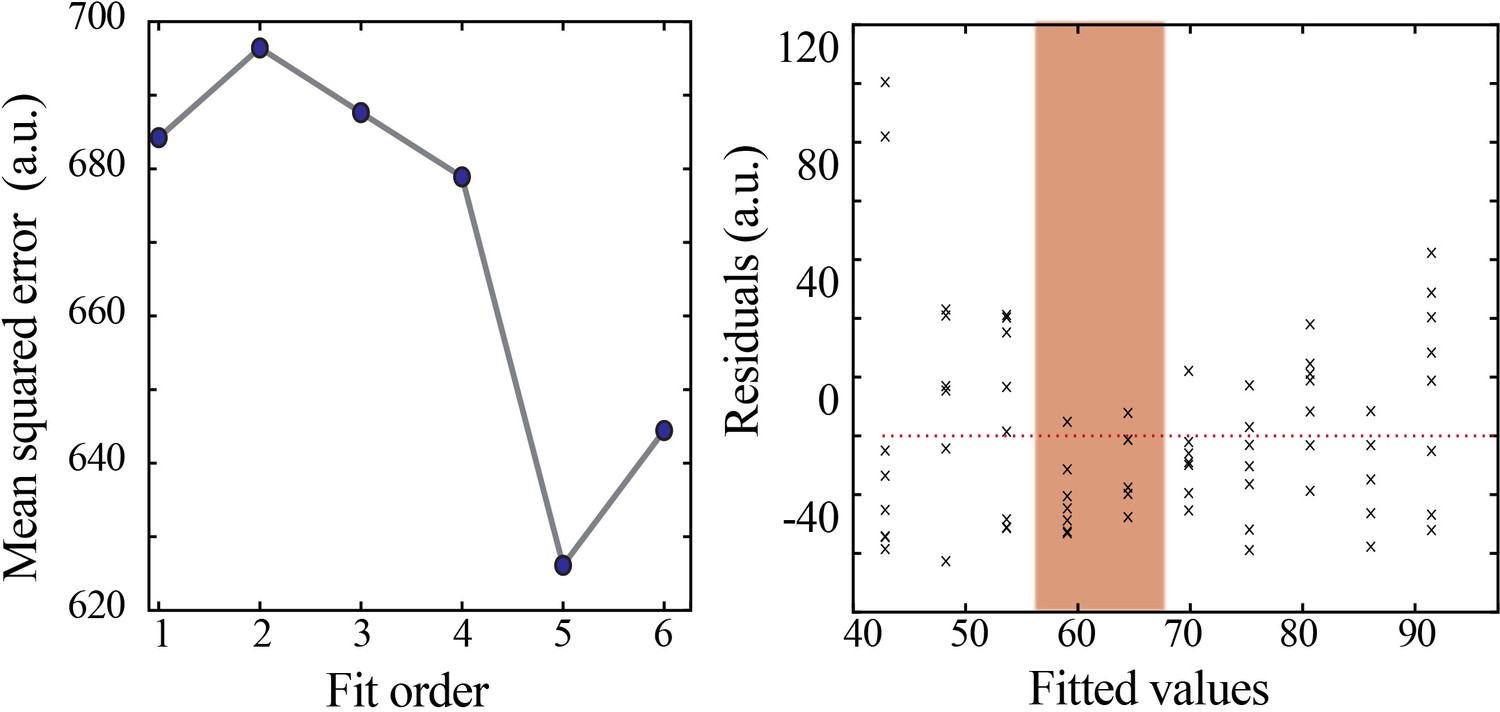
Model selection and verification of nonlinear developmental trajectory for spindle band oscillation properties in mice.
Leave-one-out cross-validation to evaluate fit of each model for spindle band oscillation properties, quantified by mean squared error (left). Plot of residuals obtained from linear regression fitting (right); note systematic deviation from zero, especially at the beginning of the second postnatal week (orange shaded box).
Figure 5 with 1 supplement
Increasing regularity and temporal precision of synaptic activity facilitates recruitment and entrainment of neural spiking across development.
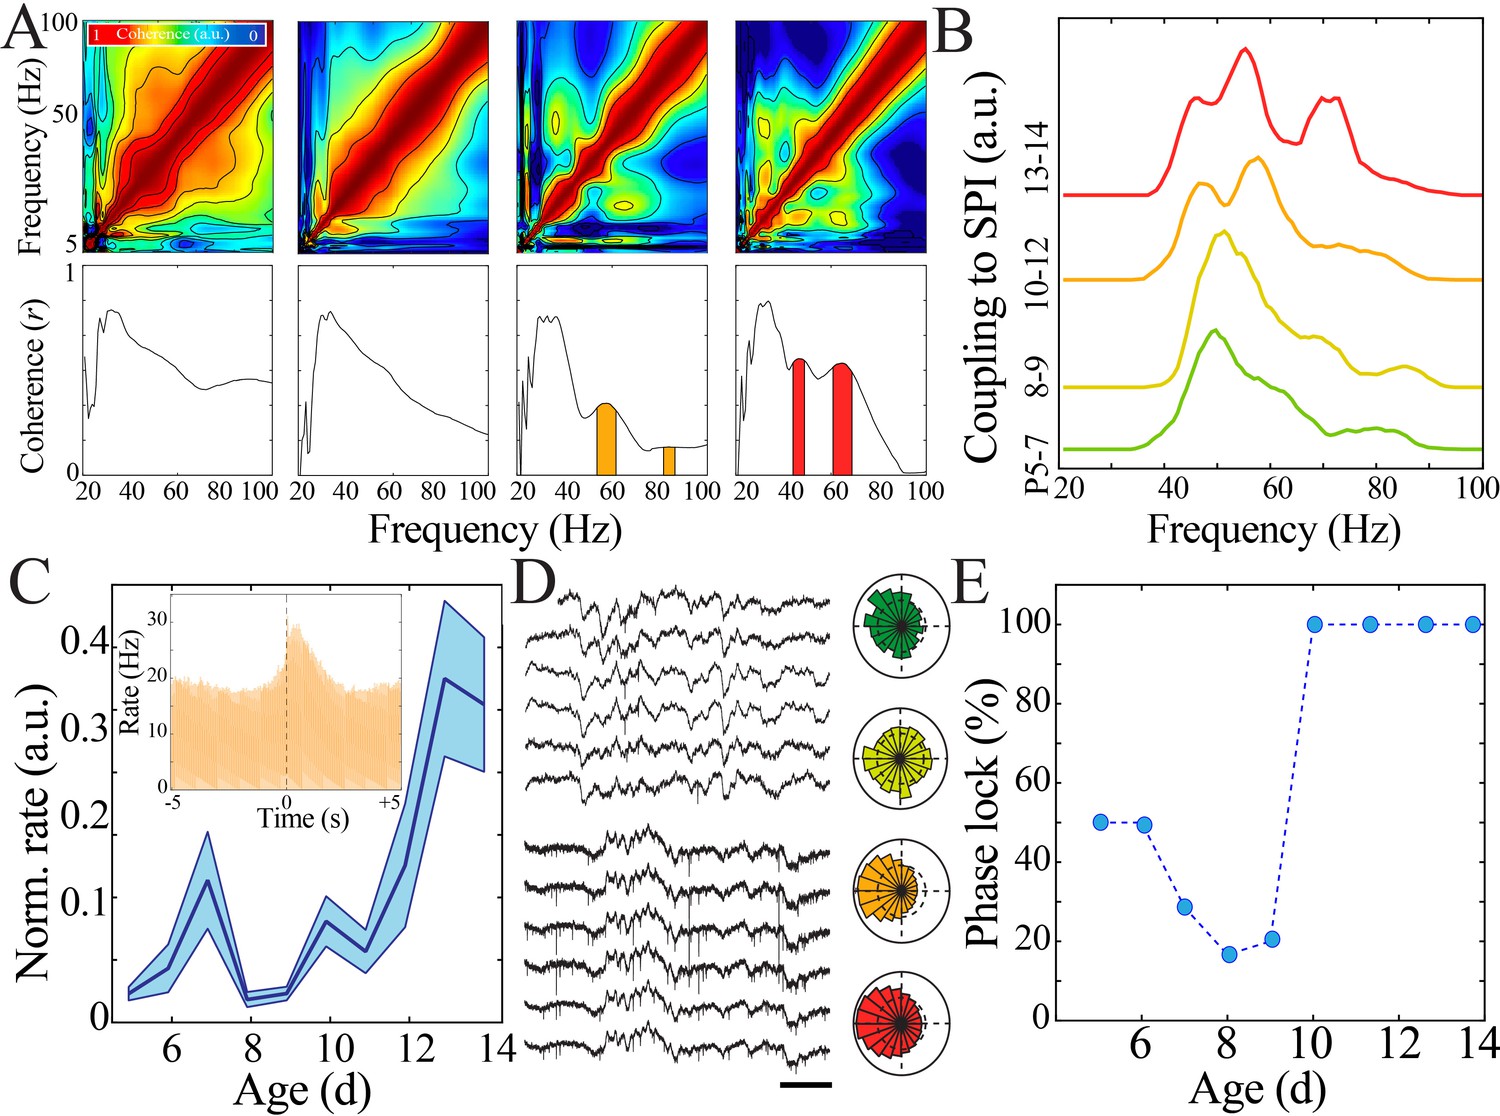
(A) Frequency comodulation at the time of spindle band oscillations emerges across development. Comodulograms (upper) and quantification of significant peaks in frequency coherence to spindle band (lower). (B) Significant, discrete peaks of cross-frequency coupling with spindle band oscillations emerge starting at P10 (n = 51 pups). (C) Rate of neural spiking during spindle band oscillation normalized to baseline neural spiking rate increases nonlinearly across development (blue line = mean; shaded blue areas ± SE) with a local minimum at the beginning of the second postnatal week (n = 38 pups). Inset shows sample peristimulus time histogram of neural spiking during spindle band oscillation used for subsequent quantification (starting at t = 0) for a P14 pup. (D) Sample raw time traces of spindle band oscillation and neural spiking from P8 (top) and P13 (bottom) pups. Prominent phase-locking of spikes to trough of spindle band oscillation occurs in P13 pup only. Scale bar 500 ms. Sample polar plots show significant (kappa > 0.1 and Rayleigh p<0.05) phase-locking of neural firing to spindle band oscillations in P5 (green), P11 (orange), and P14 (red) pups, but not at P8 (yellow). (E) Percentage of pups expressing significant (kappa > 0.1 and Rayleigh p<0.05) phase-locking of neural spiking to spindle band oscillations across development (n = 38 pups).
Figure 5—figure supplement 1
Bootstrapping, model selection and verification of nonlinear developmental trajectory for spiking recruitment to spindle band oscillations in mice.
(A) Comparison of nadir localization from distributions obtained by bootstrapping across ages (gray) and within ages (orange) revealing significantly increased probability of local minimum at the beginning of the second postnatal week (left) for spiking recruitment to spindle band oscillations. Inset shows leave-one-out cross-validation to evaluate fit of each model, quantified by mean squared error (MSE). Plot of residuals obtained from linear regression fitting (right); note systematic deviation from zero, especially at the beginning of the second postnatal week (orange shaded box). (B) Spiking recruitment into spindle band oscillations increases nonlinearly across development in superficial cortical layers (left; blue line = mean; shaded blue areas ± SE) with a local minimum at the beginning of the second postnatal week (n = 38 pups). Comparison of nadir localization from distributions obtained by bootstrapping across ages (gray) and within ages (orange) revealing significantly increased probability of local minimum at the beginning of the second postnatal week (right) for neural spiking rate. Leave-one-out cross-validation to evaluate fit of each model, quantified by MSE ( inset).
Figure 6 with 3 supplements
A transient quiescent state shifts network dynamics in humans.
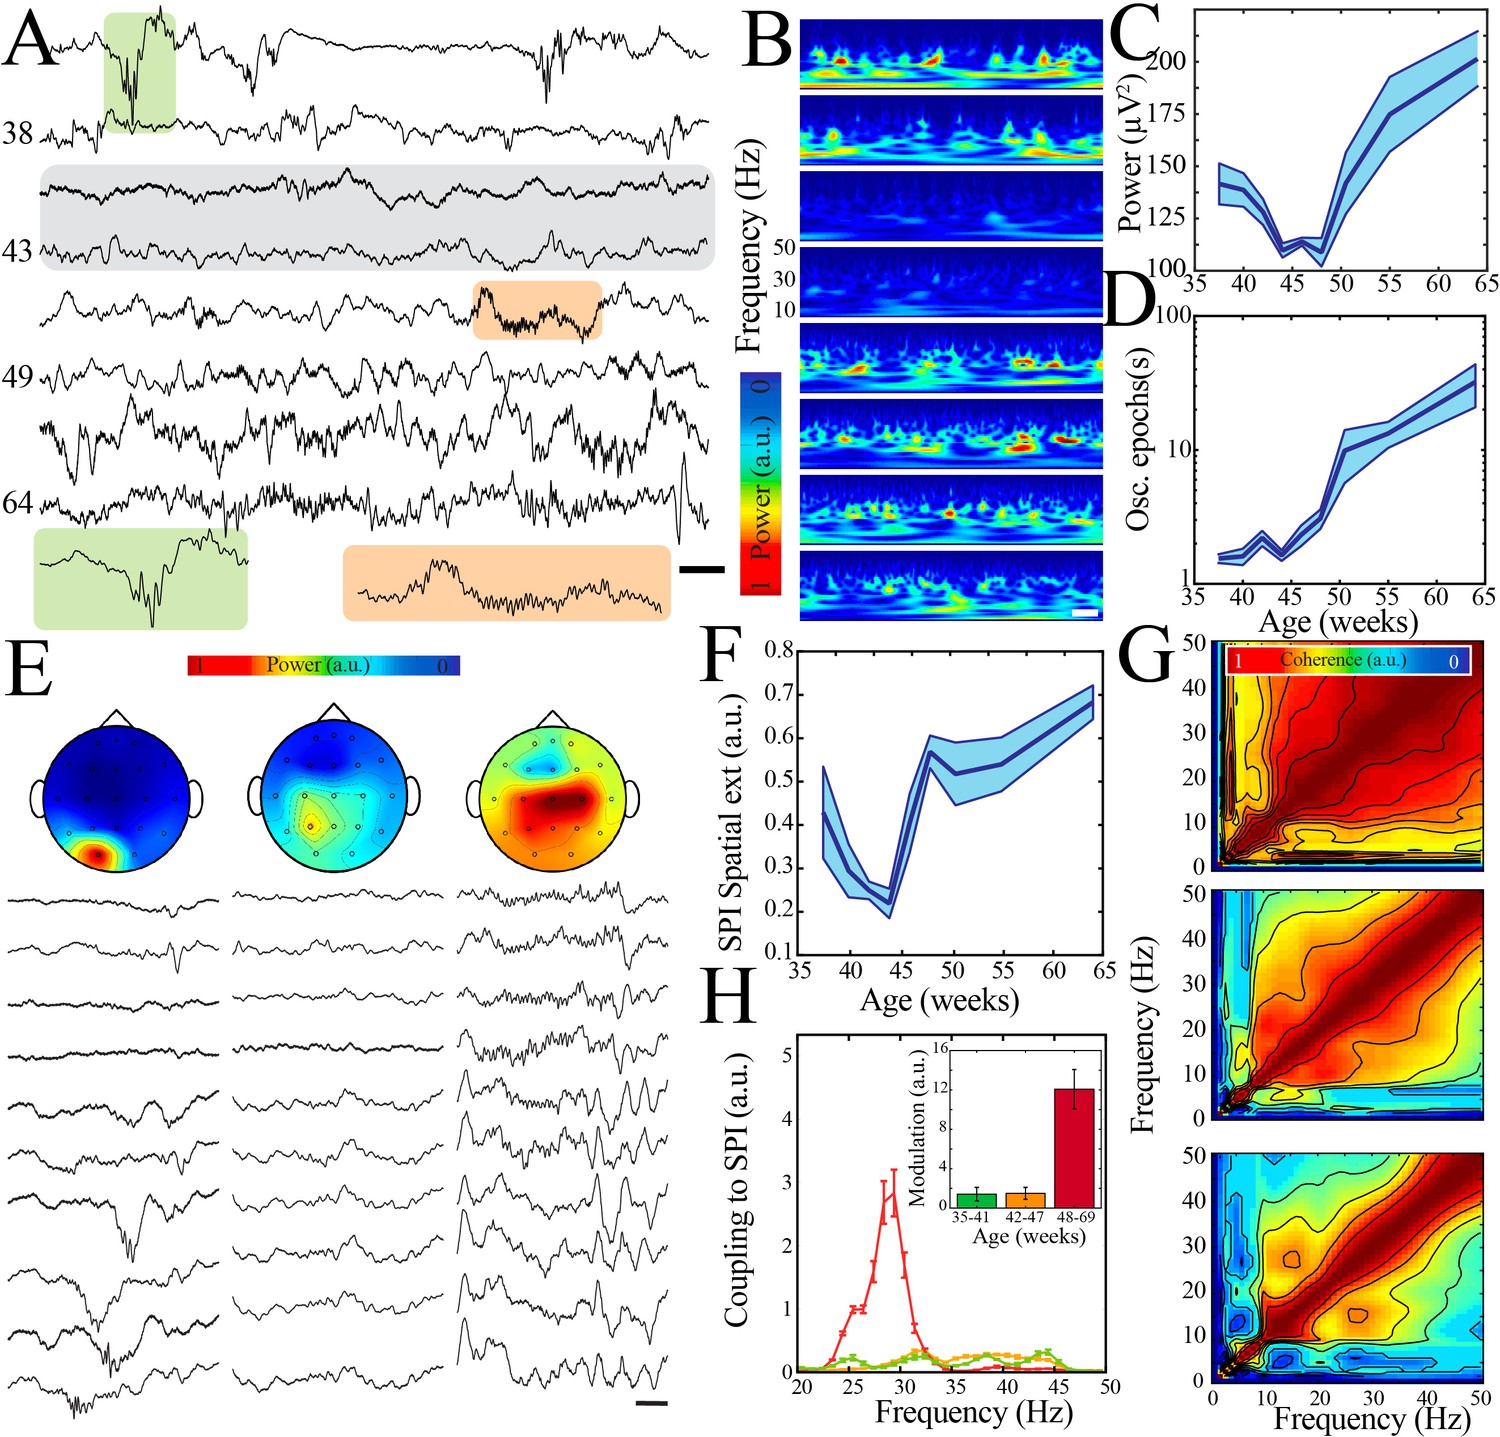
(A) Sample raw traces from human subjects revealing a relative paucity of activity between 42 and 47 weeks during quiet/non-rapid eye movement (NREM) sleep (gray shaded box). Orange shaded box is expanded to reveal characteristic appearance of infantile sleep spindles. Scale bar 1 s. (B) Sample spectrograms from human subjects revealing a relative paucity of activity between 42 and 47 weeks during quiet/NREM sleep. Power scale was normalized across sessions. Scale bar 1 s; ages correspond to traces in (A). (C) Wideband (WB) power changes nonlinearly across development (blue line = mean; shaded blue areas ± SE), with a local minimum between 42 and 47 weeks post-gestational age (n = 54 babies). Inset shows probability of a local minimum located at each age for datapoints resampled with replacement across days (gray) compared to datapoints resampled with replacement within days (orange), confirming existence of local minimum between 42 and 47 weeks. (D) Duration of oscillatory epochs increases nonlinearly across development (blue line = mean; shaded blue areas ± SE) with a local minimum between 42 and 47 weeks post-gestational age (n = 54 babies). Inset shows probability of a local minimum located at each age for datapoints resampled with replacement across days (gray) compared to datapoints resampled with replacement within days (orange), confirming existence of local minimum between 42 and 47 weeks. (E) Sample raw traces of detected spindle band oscillations across subset of electroencephalography (EEG) electrodes from babies aged 37 weeks (left), 43 weeks (middle), and 58 weeks (right) post-gestational age. Scale bar 1 s. Head models show corresponding localization of spindle band power across EEG electrodes in conventional 10–20 placement. Power was normalized across sessions. (F) Spindle band oscillation spatial extent changes nonlinearly across development (blue line = mean; shaded blue areas ± SE), with a local minimum between 42 and 47 weeks post-gestational age (n = 54 babies). Inset shows probability of a local minimum located at each age for datapoints resampled with replacement across days (gray) compared to datapoints resampled with replacement within days (orange), confirming existence of local minimum between 42 and 47 weeks. (G) Frequency comodulation at the time of spindle band oscillations from 36-, 42-, and 56-week post-gestational age subjects. (H) A significant, discrete peak of cross-frequency coupling with spindle band oscillations emerges after 47 weeks (n = 702 spindle band oscillations from 13 subjects). Inset shows quantification of area under the curve for coupling to spindle band oscillations between 25 and 35 Hz.
Figure 6—figure supplement 1
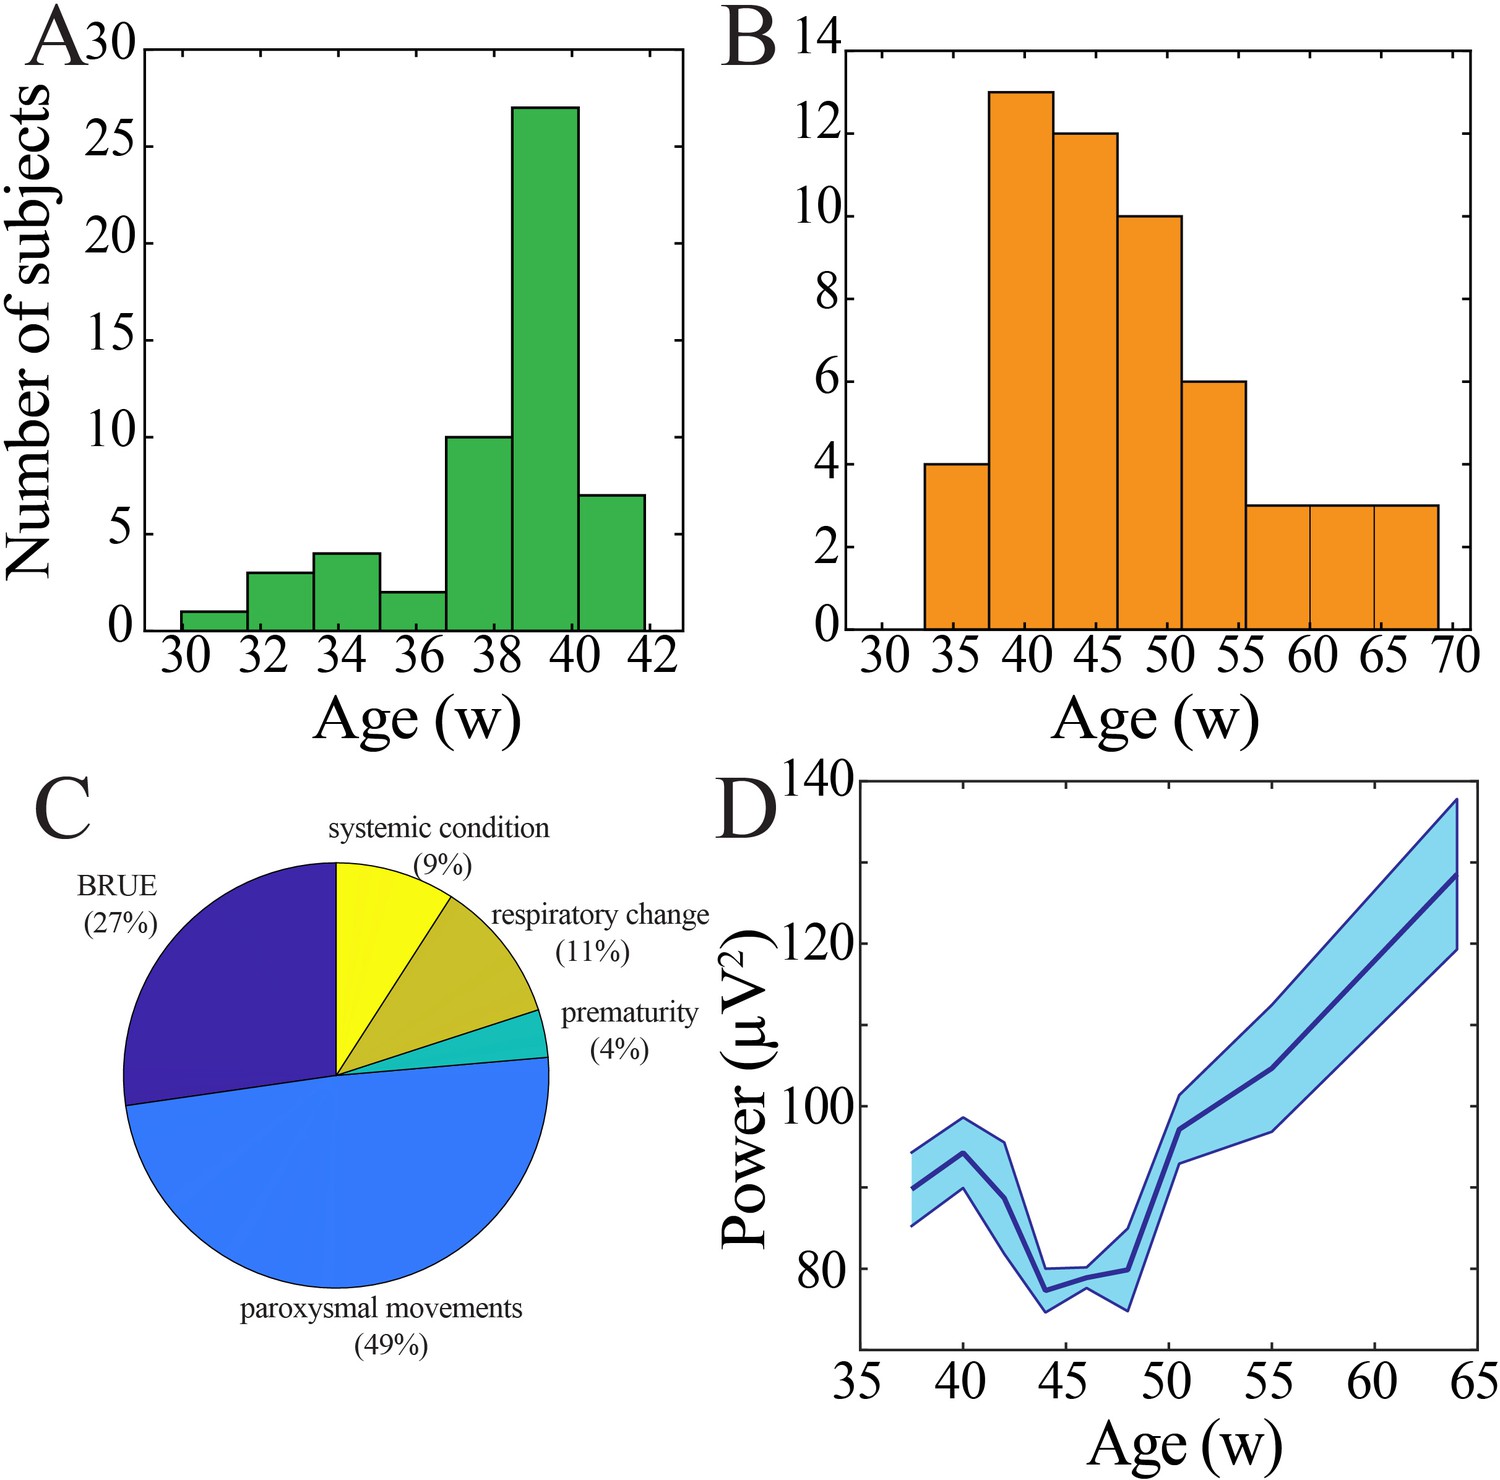
Demographic characteristics of human subjects.
(A) Histogram of age at birth. (B) Histogram of age at time of continuous electroencephalography (EEG) monitoring. (C) Clinical indication for continuous EEG monitoring (BRUE: brief resolved unexplained event). (D) Wideband (WB) power derived from central electrodes changes nonlinearly across development (blue line = mean; shaded blue areas ± SE), with a local minimum between 42 and 47 weeks post-gestational age (n = 54 subjects). .
Figure 6—figure supplement 2
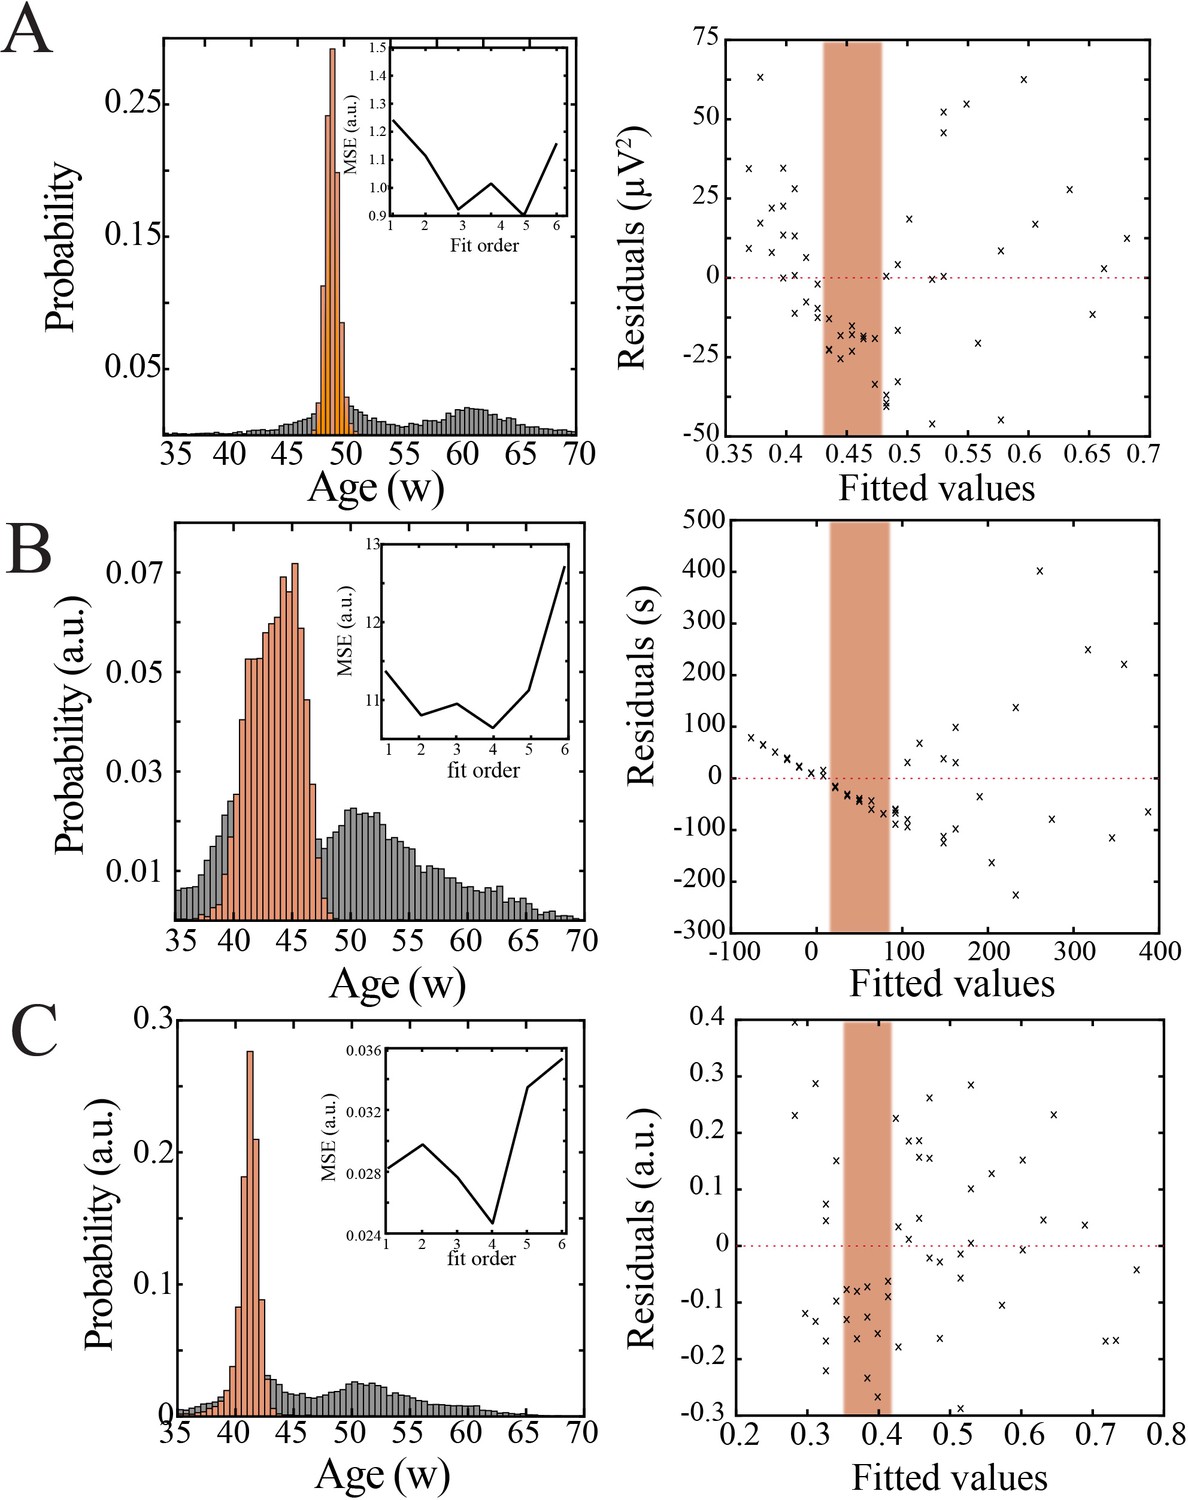
Bootstrapping, model selection and verification of nonlinear developmental trajectory for continuity, wideband power, and spatial extent of spindle band oscillations in human subjects.
(A) Comparison of nadir localization from distributions obtained by bootstrapping across ages (gray) and within ages (orange) revealing significantly increased probability of local minimum between 42 and 47 weeks post-gestation (left) for wideband power. Inset shows leave-one-out cross-validation to evaluate fit of each model, quantified by mean squared error. Plot of residuals obtained from linear regression fitting (right); note systematic deviation from zero, especially between 42 and 47 weeks post-gestation (orange shaded box). (B) Comparison of nadir localization from distributions obtained by bootstrapping across ages (gray) and within ages (orange) revealing significantly increased probability of local minimum between 42 and 47 weeks post-gestation (left) for continuity. Inset shows leave-one-out cross-validation to evaluate fit of each model, quantified by mean squared error. Plot of residuals obtained from linear regression fitting (right); note systematic deviation from zero, especially between 42 and 47 weeks post-gestation (orange shaded box). (C) Comparison of nadir localization from distributions obtained by bootstrapping across ages (gray) and within ages (orange) revealing significantly increased probability of local minimum between 42 and 47 weeks post-gestation (left) for spatial extent of spindle band oscillations. Inset shows leave-one-out cross-validation to evaluate fit of each model, quantified by mean squared error. Plot of residuals obtained from linear regression fitting (right); note systematic deviation from zero, especially between 42 and 47 weeks post-gestation (orange shaded box).
Figure 6—figure supplement 3
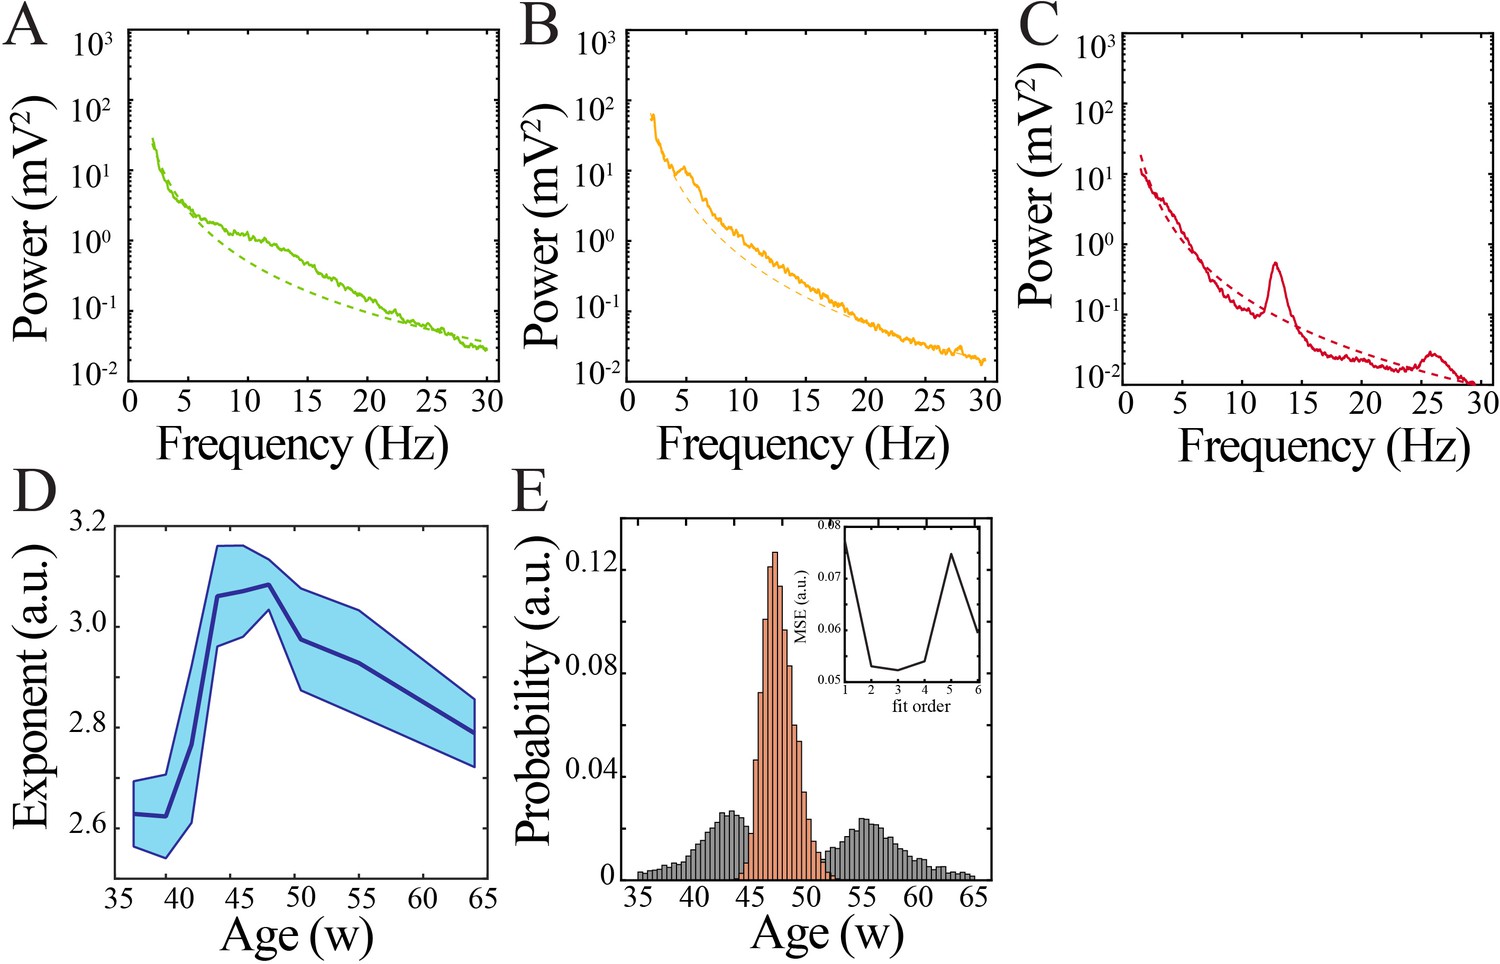
Spectral features and power law characteristics in human subjects.
(A) Sample power spectrum from 36-week post-gestation subject. Dashed line models the aperiodic component of the power spectrum. (B) Sample power spectrum from 43-week post-gestation subject. Dashed line models the aperiodic component of the power spectrum. (C) Sample power spectrum from 64-week post-gestation subject. Dashed line models the aperiodic component of the power spectrum. (D) Exponent of modeled aperiodic component of power spectrum changes nonlinearly over development. (E) Comparison of nadir localization from distributions obtained by bootstrapping across ages (gray) and within ages (orange) revealing significantly increased probability of localized maximum for the modeled aperiodic exponent. Inset shows leave-one-out cross-validation to evaluate fit of each model, quantified by mean squared error.
Tables
Key resources table
| Reagent type (species) or resource | Designation | Source or reference | Identifiers | Additional information |
|---|---|---|---|---|
| Strain, strain background (Mus musculus) | SW (Crl:CFW) | Charles River | IMSR Cat# CRL:024, RRID:IMSR_CRL:024 | Mouse |
| Antibody | Anti-VGLUT2 (polyclonal; target: mouse, rat; host: guinea pig) | Synaptic Systems | Cat# 135 404, RRID:AB_887884 | Primary antibody, dilution 1:1000 |
| Antibody | 594 Donkey Anti-Guinea Pig IgG (H+L) (polyclonal; target: guinea pig; host: donkey) | Jackson ImmunoResearch Labs | Cat# 706-585-148, RRID:AB_2340474 | Secondary antibody, dilution 1:500 |
| Software, algorithm | MATLAB | MathWorks | RRID:SCR_001622 | |
| Software, algorithm | Chronux | Chronux.org | RRID:SCR_005547 |
Additional files
Download links
A two-part list of links to download the article, or parts of the article, in various formats.
Downloads (link to download the article as PDF)
Open citations (links to open the citations from this article in various online reference manager services)
Cite this article (links to download the citations from this article in formats compatible with various reference manager tools)
A transient postnatal quiescent period precedes emergence of mature cortical dynamics
eLife 10:e69011.
https://doi.org/10.7554/eLife.69011


