mTOR-dependent translation drives tumor infiltrating CD8+ effector and CD4+ Treg cells expansion
- Institute for Research in Biomedicine, Università della Svizzera Italiana (USI), Switzerland
- Graduate School of Cellular and Molecular Sciences, University of Bern, Switzerland
- Istituto Nazionale Genetica Molecolare "Romeo ed Enrica Invernizzi", Italy
- Department of Medical Biotechnology and Translational Medicine, Universita` degli Studi di Milano, Italy
- Department of Clinical Sciences and Community Health, Università degli Studi di Milano, Italy
- Bioscience Department, Università degli Studi di Milano, Italy
Figures
Figure 1
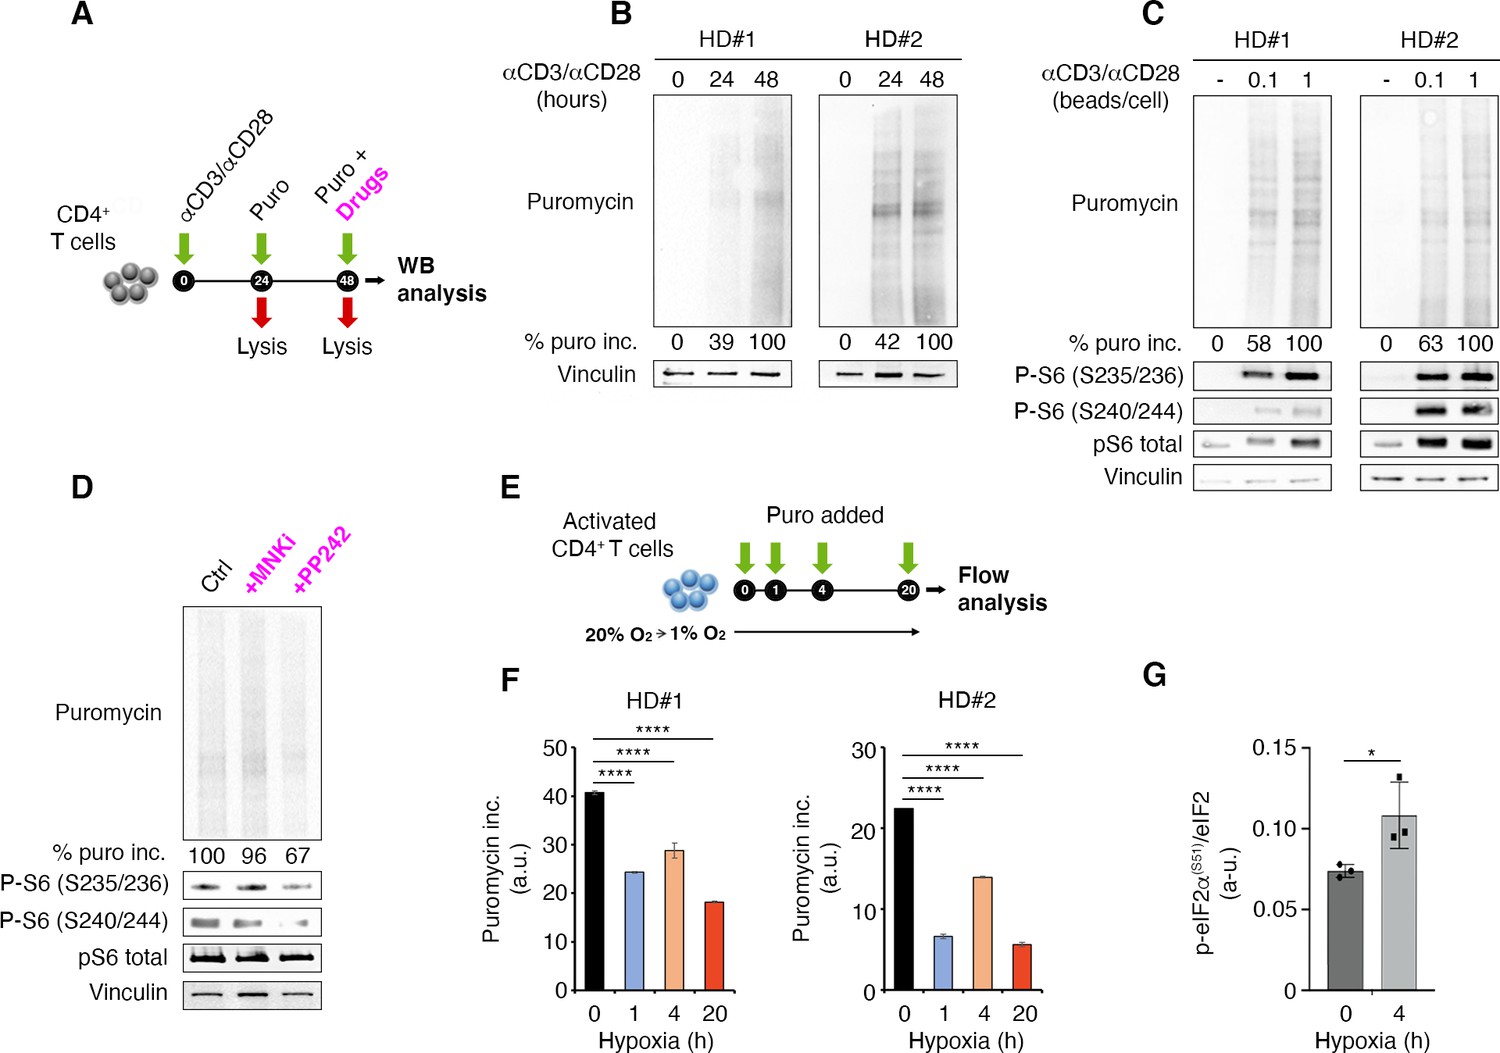
T cell receptor stimulation through mTORC1 is a strong stimulator of translation counterbalanced by hypoxia in primary lymphocytes.
(A) Schematic diagram for the experiment. (B) Immunoblot of puromycin incorporation in CD4+ T cells following stimulation by anti-CD3/CD28 at the indicated time points shows that T cell receptor stimulation leads to a progressive increase of puromycin in cultured lymphocytes. The immunoblot shows two replicates with cells isolated from one healthy donor per experiment. Densitometry normalized to vinculin. (C) The strength of T cell receptor stimulation correlates with puromycin incorporation. The immunoblot shows two replicates with cells isolated from one healthy donor per experiment. (D) mTOR inhibition reduces rpS6 phosphorylation and translation. Stimulated CD4+ T cells were treated for 30 min with either 2 μM PP242 or 3 μM MNK inhibitor before collecting extracts. Puromycin incorporation and phosphorylation of rpS6 were measured by Western blotting. The immunoblot is representative of the pool of two replicates with cells isolated from one healthy donor per experiment. (E and F) Hypoxic environment sharply reduces translation. Stimulated CD4+ T cells were transferred from 20% O2 to 1% O2 for the indicated times (E), and translation was measured by flow cytometry (F). Data are mean ± s.d. p Values are determined by ANOVA with Dunnett’s post hoc test. ****p < 0.0001. (G) Hypoxia induces phosphorylation of eIF2α. Stimulated CD4+ T cells were incubated for 4 hr under normoxia or hypoxia and the phosphorylation of eIF2α was determined by ELISA assay as described in Materials and methods using an anti-phospho-eIF2α-specific antibody. The data represents the pool of three independent experiments. Data are mean ± s.d. p Values are determined by two-tailed Student’s t-tests. ****p < 0.001.
-
Figure 1—source data 1
Source data for Figure 1B, C, D, F, and G.
- https://cdn.elifesciences.org/articles/69015/elife-69015-fig1-data1-v2.zip
-
Figure 1—source data 2
Source data for Figure 1B, C, D, F, and G.
- https://cdn.elifesciences.org/articles/69015/elife-69015-fig1-data2-v2.zip
-
Figure 1—source data 3
Source data for Figure 1B, C, D, F, and G.
- https://cdn.elifesciences.org/articles/69015/elife-69015-fig1-data3-v2.csv
-
Figure 1—source data 4
Source data for Figure 1B, C, D, F and G.
- https://cdn.elifesciences.org/articles/69015/elife-69015-fig1-data4-v2.xlsx
Figure 2 with 2 supplements

The tumor microenvironment stimulates translation in a limited number of tumor-infiltrating lymphocytes (TILs) with activated mTORC1 pathway.
(A) Experimental outline. Tumor cells were injected in recipient mice. Puromycin was injected intraperitoneally, and T cells were collected 1 hr later for the analysis. (B and C) The amount of incorporated puromycin was determined by FACS analysis in CD4+ (B) or CD8+ lymphocytes (C). Representative plots and statistical analysis (mean ± SEM) show that the number of Puro+ TILs is always higher in tumors versus spleen and that only parts of TILs are translationally active. Percentages of positive cells in each gate are shown. Data from three experiments pooled together (n = 5–8 mice per experiment) *p < 0.05; ***p < 0.001; ****p < 0.0001. (D) Immunohistochemical analysis of puromycin in CD4+ TILs. Puro+ cells (pink) are concentrated in some tumor areas, where clusters of highly translating CD4+ cells (brown) are found. Scale bars, 10 μm. (E) Representative plots (left) and statistical analysis (mean ± SEM) for pS6(S235/236) within Puro+ and Puro- CD4+ and CD8+ TILs shows that, in vivo, most translating TILs have the mTORC1-S6K pathway active. Percentages of positive cells in each gate are shown. Data from two experiments pooled together (n = 5 mice per experiment) ****p < 0.0001. (G) Experimental outline. Tumor cells were injected in recipient mice that were given intraperitoneal injections of 5 mg/kg everolimus for 2 consecutive days. Puromycin was injected 1 hr before sacrificing mice and collecting TILs cells for subsequent flow cytometry analysis. (H) Representative flow cytometry plots and statistical analysis (mean ± SEM) for puromycin within CD4+ and CD8+ TILs showing that the mTOR inhibitor everolimus reduces translation. Percentages of positive cells in each gate are shown. Data from two experiments pooled together (n = 10 mice per experiment) **p < 0.01; ***p < 0.001.
-
Figure 2—source data 1
Source data for Figure 2B, C, E, F and H.
- https://cdn.elifesciences.org/articles/69015/elife-69015-fig2-data1-v2.xlsx
Figure 2—figure supplement 1
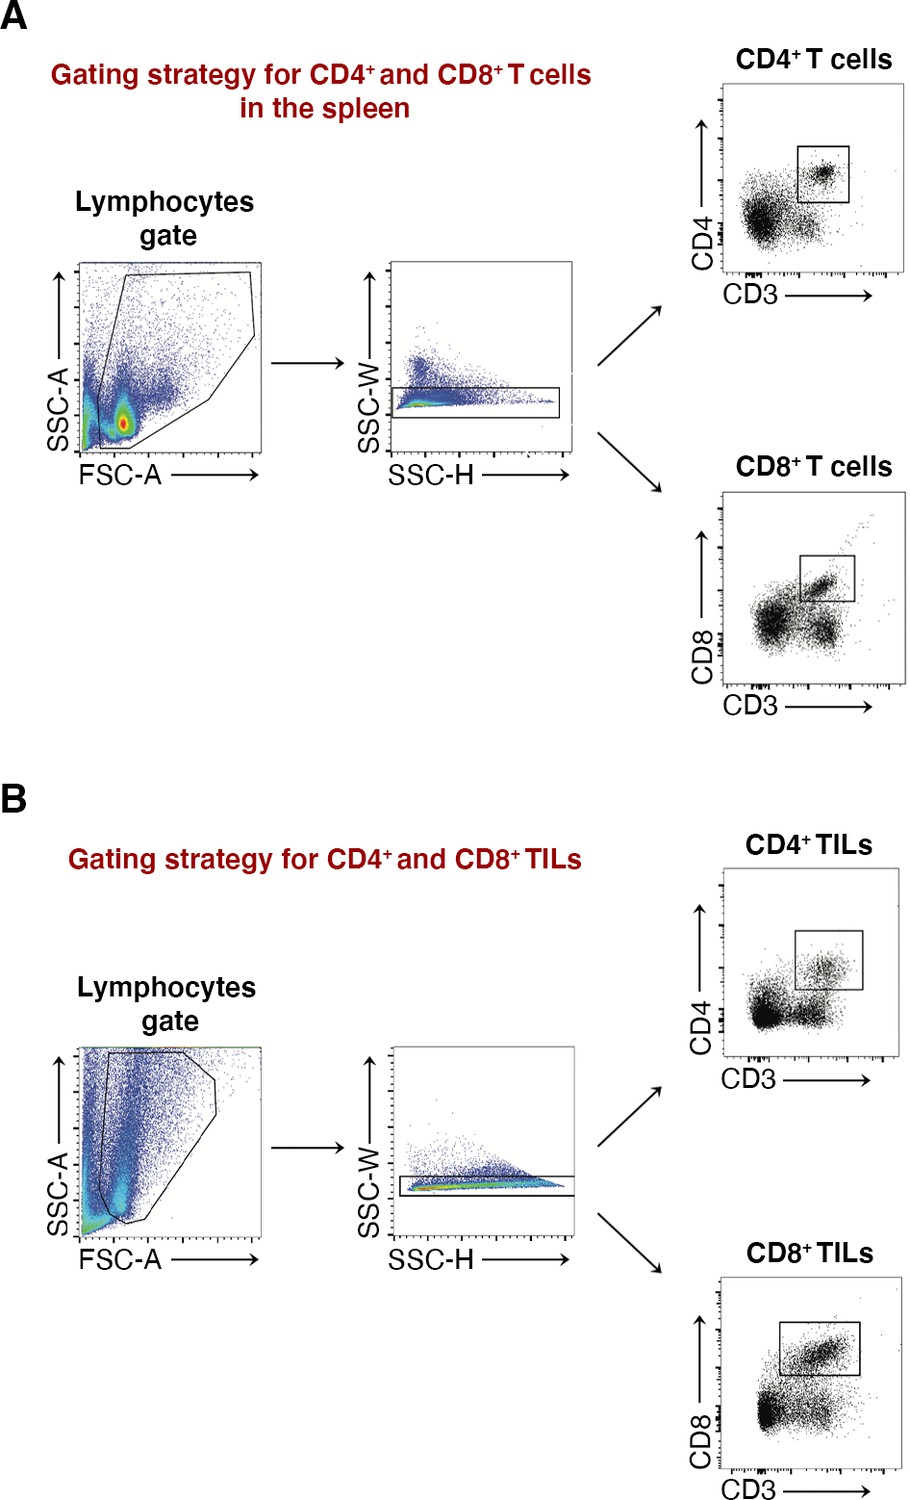
Flow cytometry gating strategy analysis of puromycin incorporation in CD4+ and CD8+ T cells, either in the spleen or in tumor.
Figure 2—figure supplement 2
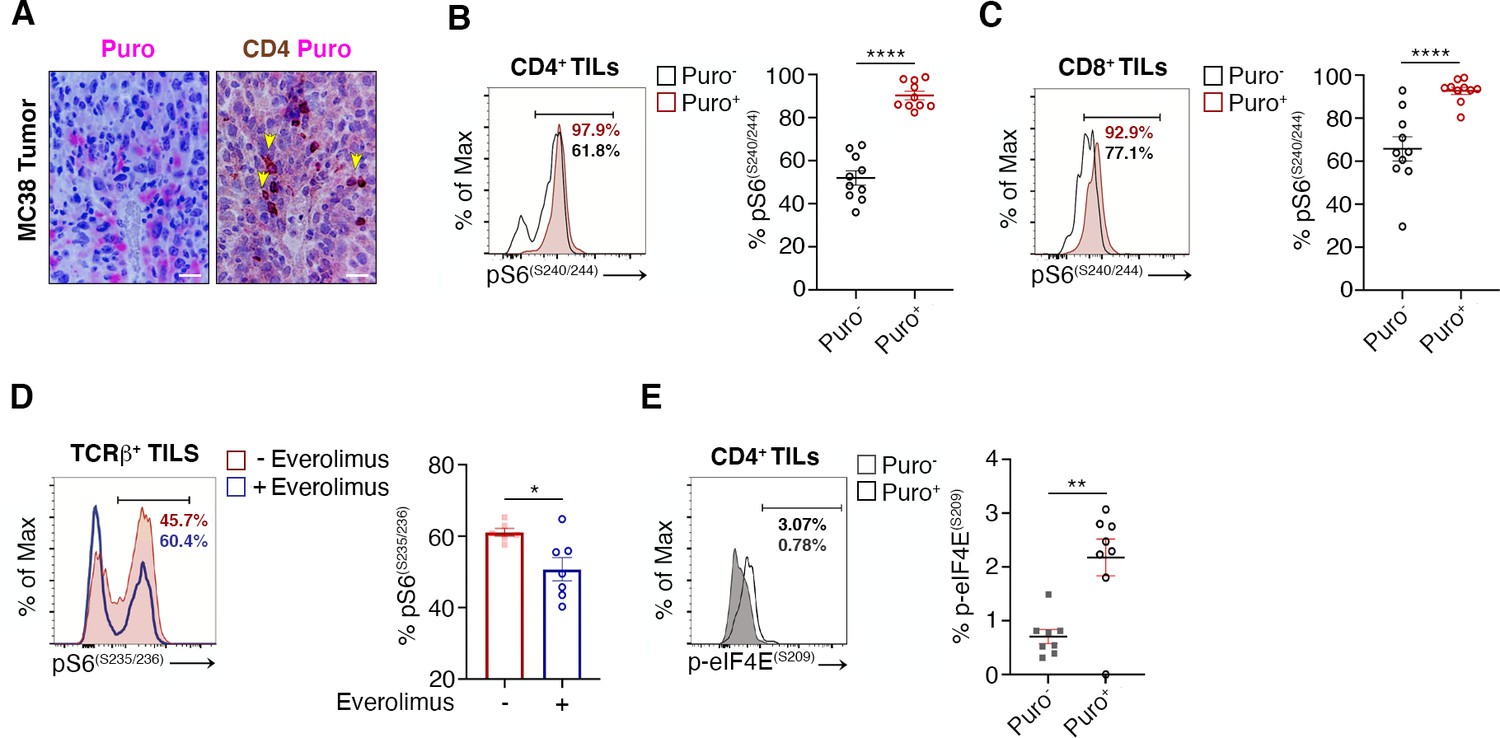
The tumor microenvironment stimulates translation in a limited number of tumor infiltrating lymphocytes (TILs) with activated mTORC1 pathway.
(A) Immunohistochemical analysis of puromycin in CD4+ tumor-infiltrating lymphocytes (TILs) in MC38 tumor microenvironment (TME) shows that only a fraction of lymphocytes is translationally active.Scale bars, 20 μm. (B and C) Representative plots (left) and statistical analysis (mean ± SEM) for pS6(S240/244) within Puro- and Puro+ CD4+ (B) and CD8+ (C) TILs proving that, in vivo, the mTORC1-S6K pathway is active in most of translating TILs. Percentages of positive cells in each gate are shown. Data from two experiments pooled together (n = 10) ****p < 0.0001. (D) Representative plots (left) and statistical analysis (mean ± SEM) for p-eIF4E(S09) within Puro- and Puro+ CD4+ TILs showing that a small pool of translating TILs is positive for p-eIF4E. Percentages of positive cells in each gate are shown. Data from two experiments pooled together (n = 7) **p < 0.01. (E) Representative plots (left) and statistical analysis (mean ± SEM) for pS6(S235/236) within TCRβ+ TILs in untreated and everolimus-treated B16 mice proving that mTOR inhibition reduces rpS6 phosphorylation. Percentages of positive cells in each gate are shown. Data from two experiments pooled together (n = 7) *p < 0.05.
-
Figure 2—figure supplement 2—source data 1
Source data for Figure 2—figure supplement 2B-E.
- https://cdn.elifesciences.org/articles/69015/elife-69015-fig2-figsupp2-data1-v2.xlsx
Figure 3 with 1 supplement
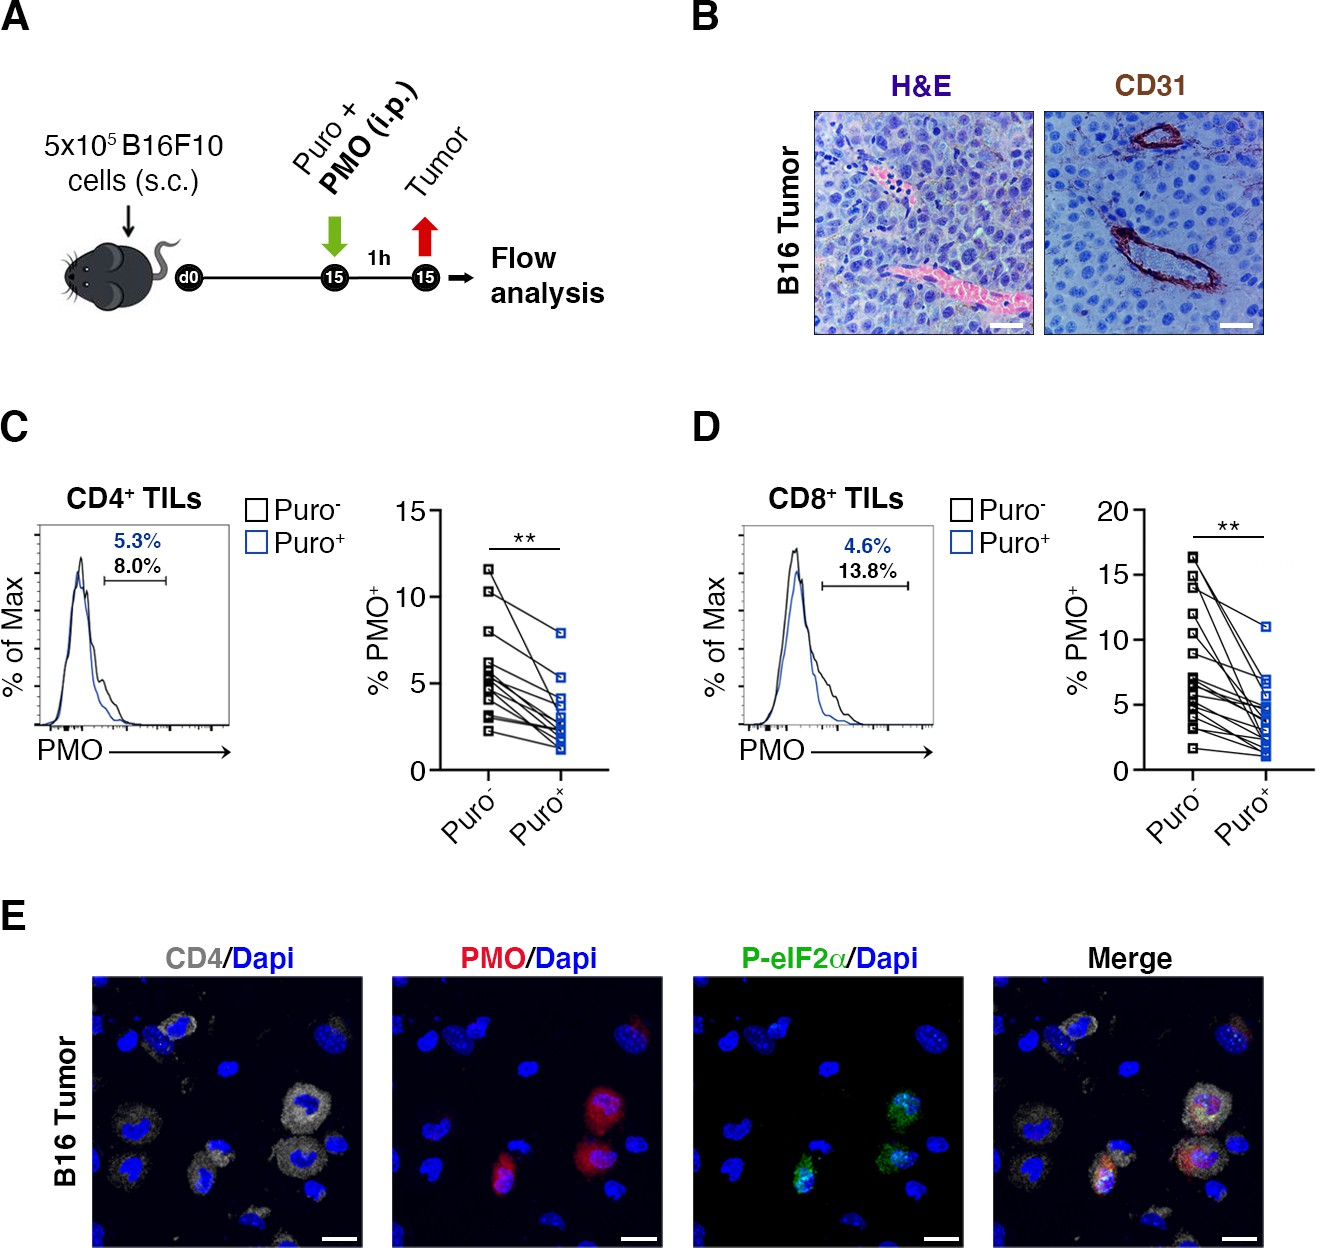
Hypoxia limits translation of tumor-infiltrating lymphocytes (TILs) in vivo.
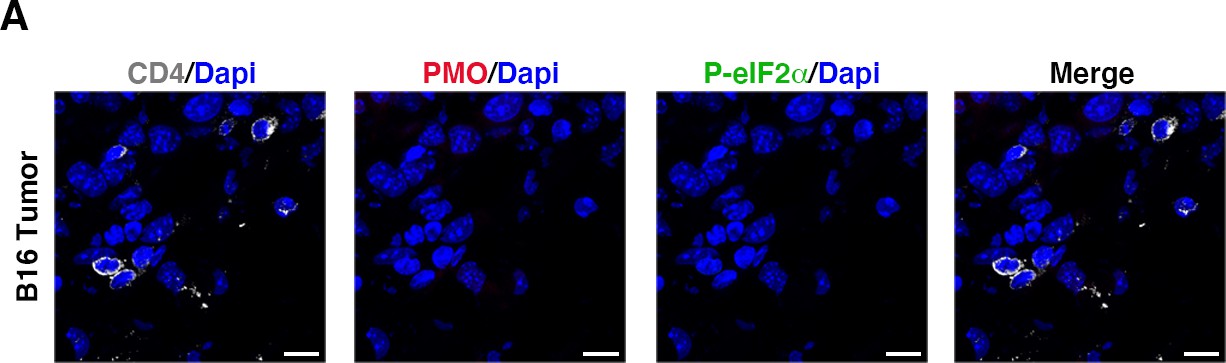
(A) Experimental outline. Tumor cells were injected in recipient mice. Puromycin was injected intraperitoneally together with the hypoxia marker pimonidazole (PMO). T cells were collected 1 hr later for the analysis. (B) CD31 staining in tumor specimens shows ample vascularization with limited areas far from blood vessels suggesting the absence of truly hypoxic areas and limited hypoxic gradients. Scale bars, 15 μm. (C and D) Representative plots (left) and statistical analysis (mean ± SEM) for PMO+ within Puro+ and Puro- CD4+ and CD8+ TILs show, in vivo, the inverse correlation between hypoxia and translational efficiency. Percentages of positive cells in each gate are shown. Data from two experiments pooled together (n = 7–8 mice per experiment) **p < 0.01. (E) Representative immunofluorescence images showing that in tumor specimens the majority of PMO+ CD4+ TILs are p-eIF2α(S51)+. Scale bars, 10 μm.
-
Figure 3—source data 1
Source data for Figure 3C and D.
- https://cdn.elifesciences.org/articles/69015/elife-69015-fig3-data1-v2.xlsx
Figure 3—figure supplement 1
Immunofluorescence staining of CD4 (in grey), PMO (in red), and p-eIF2α (in green) in B16 spleen specimens.
(A) Representative immunofluorescence images proving the absence of hypoxic areas (PMO, in red) and PMO+ p-eIF2α(S51)+ CD4+ cells in the spleen specimens, taken as control. Scale bars, 10 μm.
Figure 4 with 1 supplement
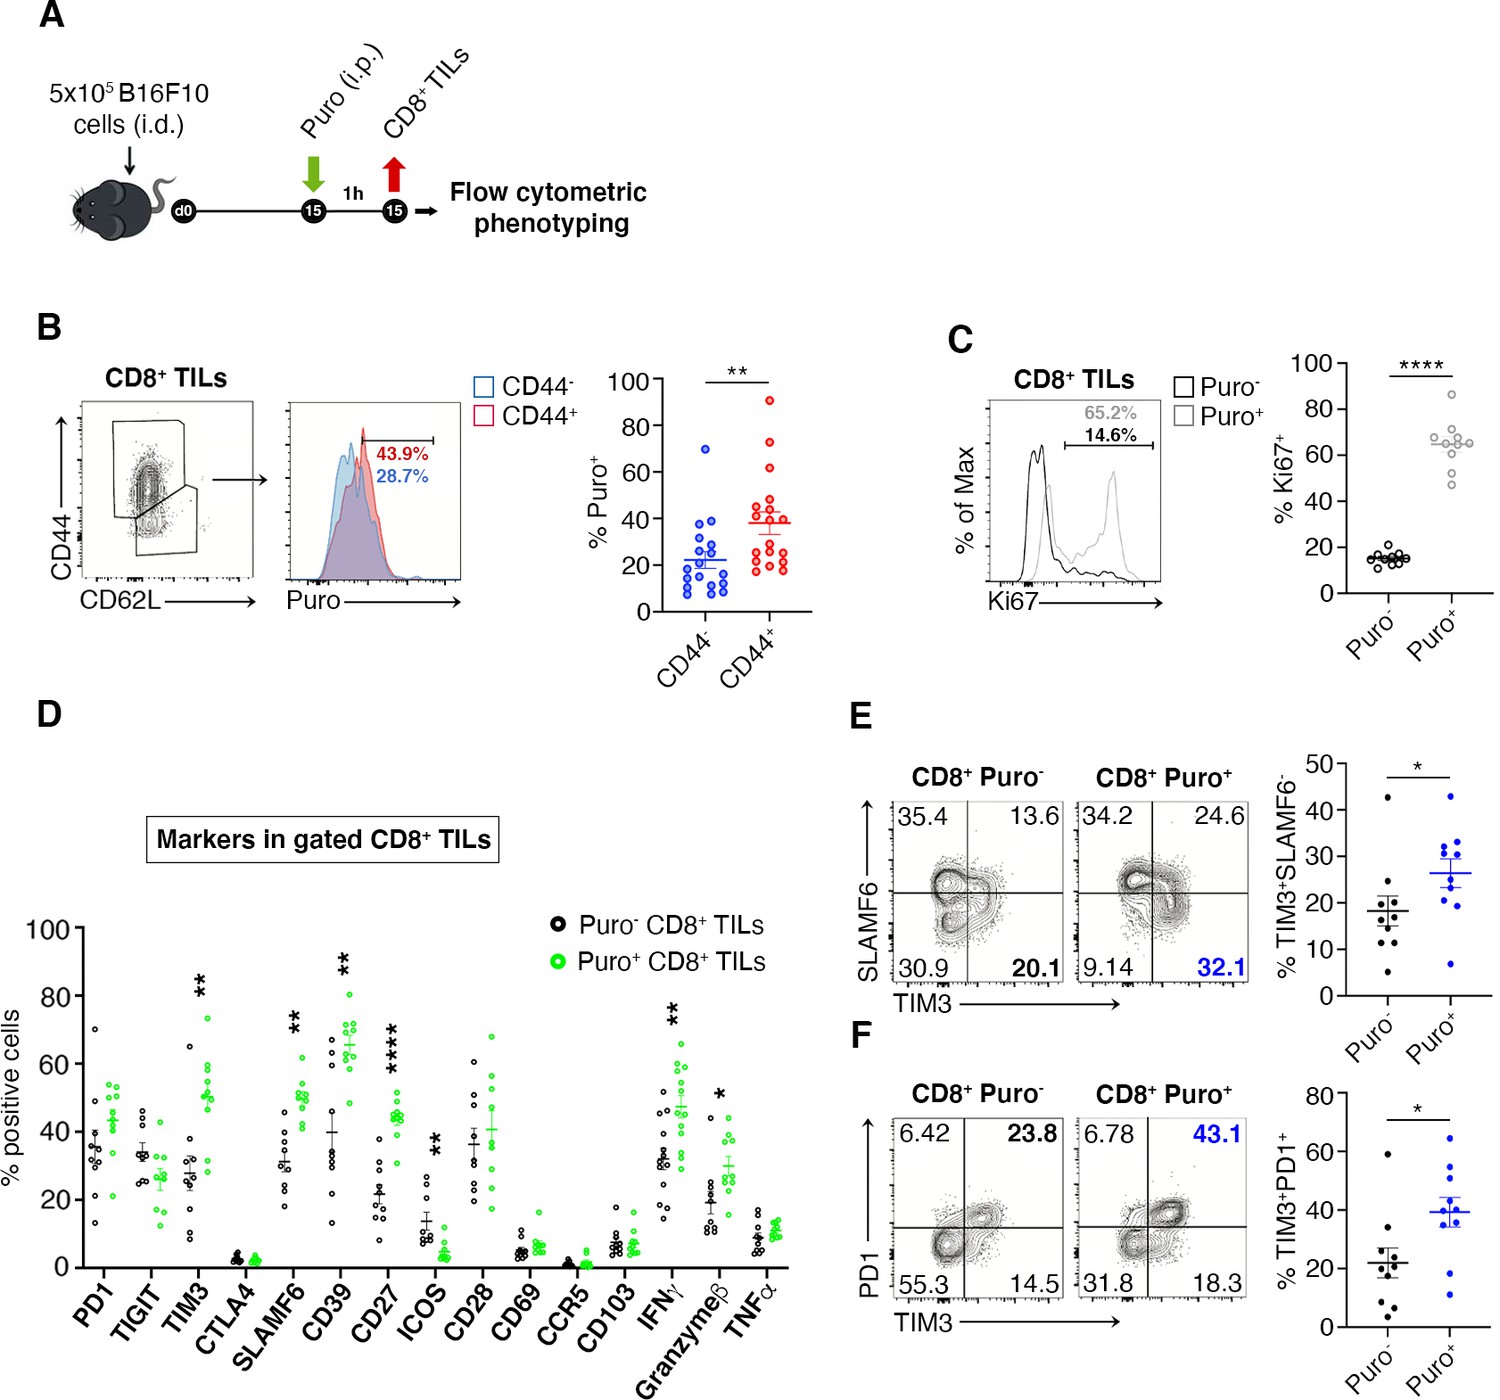
Puro+ translating CD8+ tumor-infiltrating lymphocytes (TILs) retain an activated-like phenotype.
(A) Schematic diagram for the experiment. (B) Representative plots (left) and statistical analysis (mean ± SEM) of gated CD44+ CD8+ TILs analyzed for puromycin incorporation. Quantitation shows an enrichment for the expression of CD44. Percentages of positive cells in each gate are shown. Data from three experiments pooled together (n = 6 mice per experiment) **p < 0.01. (C) Representative plots (left) and statistical analysis (mean ± SEM) of Ki67+ within Puro+ and Puro- CD8+ TILs. Quantitation shows a positive correlation between translation rate and proliferation. Percentages of positive cells in each gate are shown. Data from two experiments pooled together (n = 5 mice per experiment) **p < 0.01. (D) Statistical analysis (mean ± SEM) for the indicated markers within Puro+ and Puro- CD8+ TILs shows that Puro+ translating CD8+ TILs are enriched for TIM3, SLAMF6, CD39, CD27, ICOS, and IFN-γ expression. Percentages of positive cells in each gate are shown. Data from two experiments pooled together (n = 5 mice per experiment) **p < 0.01; ****p < 0.0001. (E) Representative plots and statistical analysis (mean ± SEM) for SLAMF6 and TIM3 within Puro+ and Puro- CD8+ TILs shows that Puro+ translating CD8+ TILs are enriched for TIM3 expression. Percentages of positive cells in each gate are shown. Data from two experiments pooled together (n = 5 mice per experiment) *p < 0.05. (F) Representative plots and statistical analysis (mean ± SEM) for PD1 and TIM3 within Puro+ and Puro- CD8+ TILs show that Puro+ translating CD8+ TILs are enriched for TIM3 and PD1 expression. Percentages of positive cells in each gate are shown. Data from two experiments pooled together (n = 5 mice per experiment) *p < 0.05.
-
Figure 4—source data 1
Source data for Figure 4B–F.
- https://cdn.elifesciences.org/articles/69015/elife-69015-fig4-data1-v2.xlsx
Figure 4—figure supplement 1
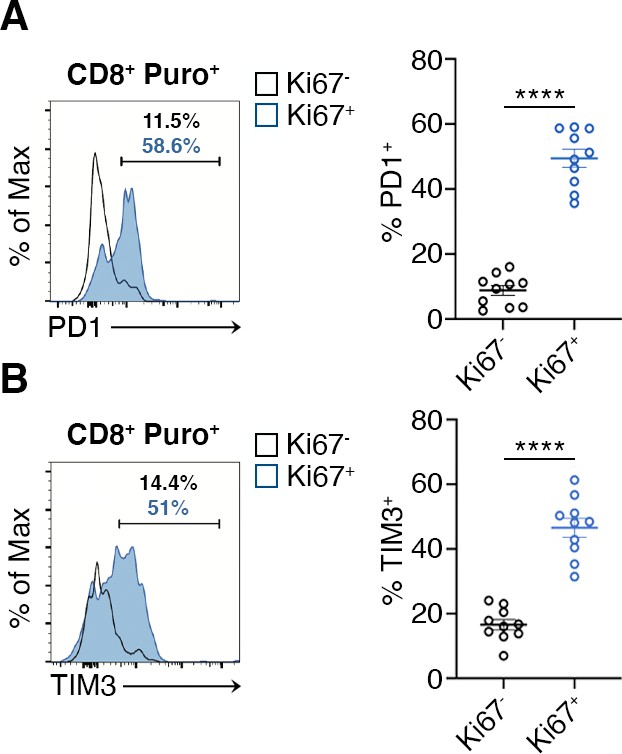
Flow cytometry analysis of PD1 and TIM3 within Ki67- puro+ and Ki67+ puro+ CD8+ tumor-infiltrating lymphocytes (TILs).
(A and B) Quantitation shows that Ki67+ CD8+ TILs express significantly more PD1 and TIM3 than Ki67- CD8+ TILs. Percentages of positive cells in each gate are shown. Data from two experiments pooled together (n = 5 mice per experiment) ****p < 0.0001.
-
Figure 4—figure supplement 1—source data 1
Source data for Figure 4—figure supplement 1A, B.
- https://cdn.elifesciences.org/articles/69015/elife-69015-fig4-figsupp1-data1-v2.xlsx
Figure 5 with 1 supplement
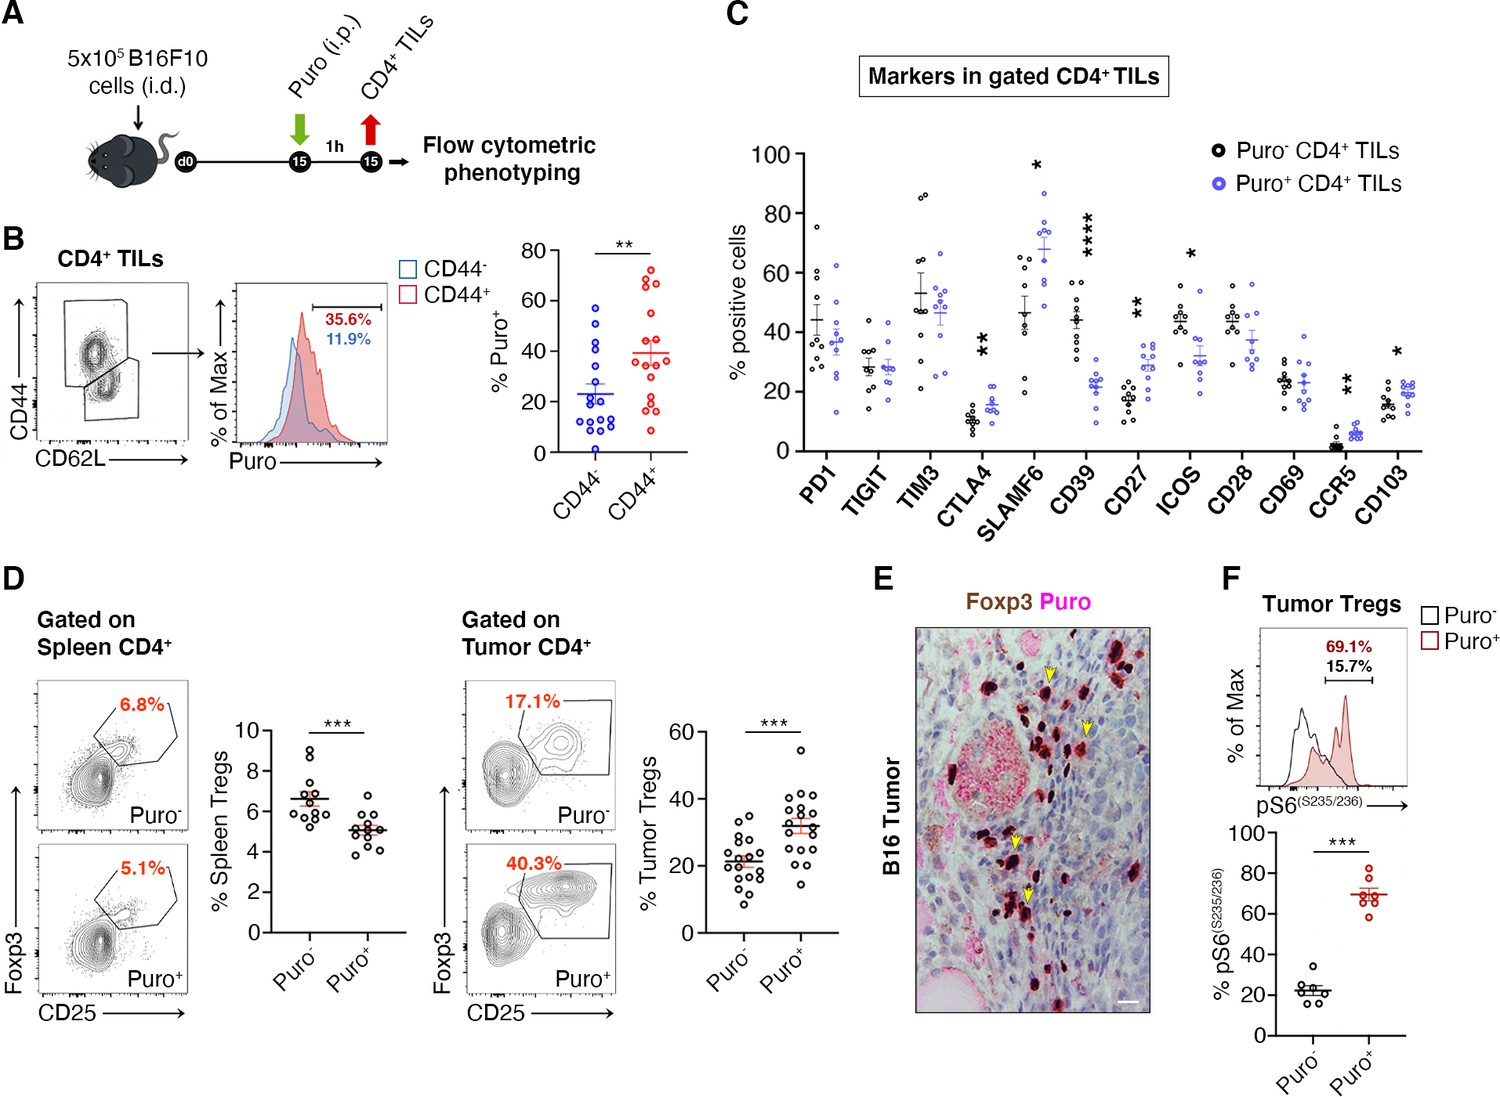
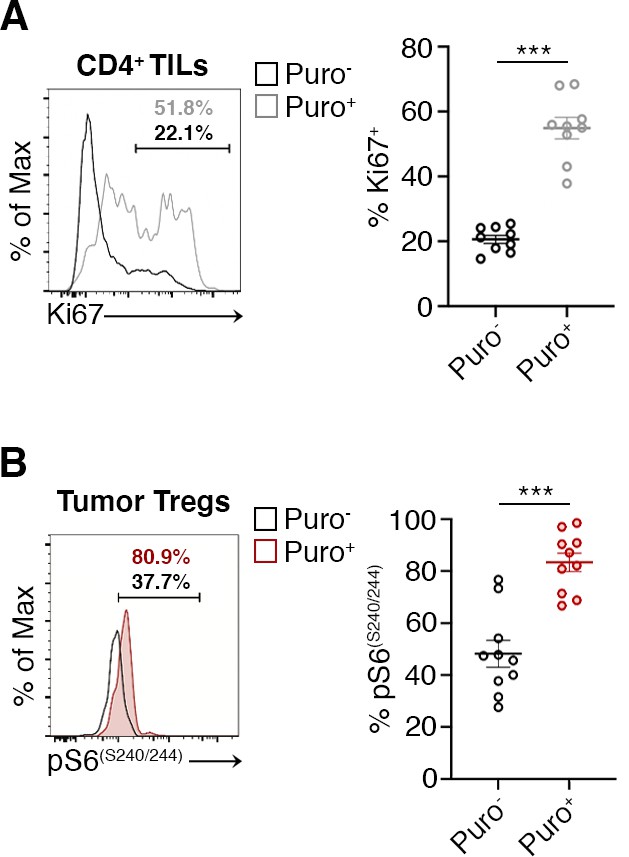
Regulatory T cells (Tregs) represents the majority of CD4+ tumor infiltrating Puro+ cells.
(A) Schematic diagram for the experiment. (B) Representative plots (left) and statistical analysis (mean ± SEM) of gated CD44+ CD4+ tumor-infiltrating lymphocytes (TILs) analyzed for puromycin incorporation. Quantitation shows an enrichment for the expression of CD44. Percentages of positive cells in each gate are shown. Data from three experiments pooled together (n = 6 mice per experiment) **p < 0.01. (C) Statistical analysis (mean ± SEM) for the indicated markers within Puro+ and Puro- CD4+ TILs shows that Puro+ translating CD4+ TILs are enriched for CTLA4, CD39, CD27, ICOS, CCR5, and CD103 expression. Data from two experiments pooled together (n = 5 mice per experiment) *p < 0.05; **p < 0.01; ****p < 0.0001. (D) Representative plots (left) and statistical analysis (mean ± SEM) of gated CD25+ Foxp3+ CD4+ lymphocytes show that the number of Puro+ Tregs is higher in tumors versus spleen. Percentages of positive cells in each gate are shown. Data from two experiments pooled together (n = 4–5 mice per experiment) ***p < 0.001. (E) Immunohistochemical analysis of puromycin in Foxp3+ TILs shows that clusters of highly translating Foxp3+ cells are found. Scale bar, 20 μm. (F) Representative plots (left) and statistical analysis (mean ± SEM) for pS6(S235/236) within Puro+ and Puro- Tregs showing that, in vivo, most of translating Tregs have the mTORC1-S6K pathway active. Percentages of positive cells in each gate are shown. Data from one experiment representative of two (n = 7) ***p < 0.001.
-
Figure 5—source data 1
Source data for Figure 5B, C, D, and F.
- https://cdn.elifesciences.org/articles/69015/elife-69015-fig5-data1-v2.xlsx
Figure 5—figure supplement 1
Flow cytometric analysis of the indicated markers in CD4+ and Tregs in tumor.
-
Figure 5—figure supplement 1—source data 1
Source data Figure 5—figure supplement 1.
- https://cdn.elifesciences.org/articles/69015/elife-69015-fig5-figsupp1-data1-v2.xlsx
Figure 6
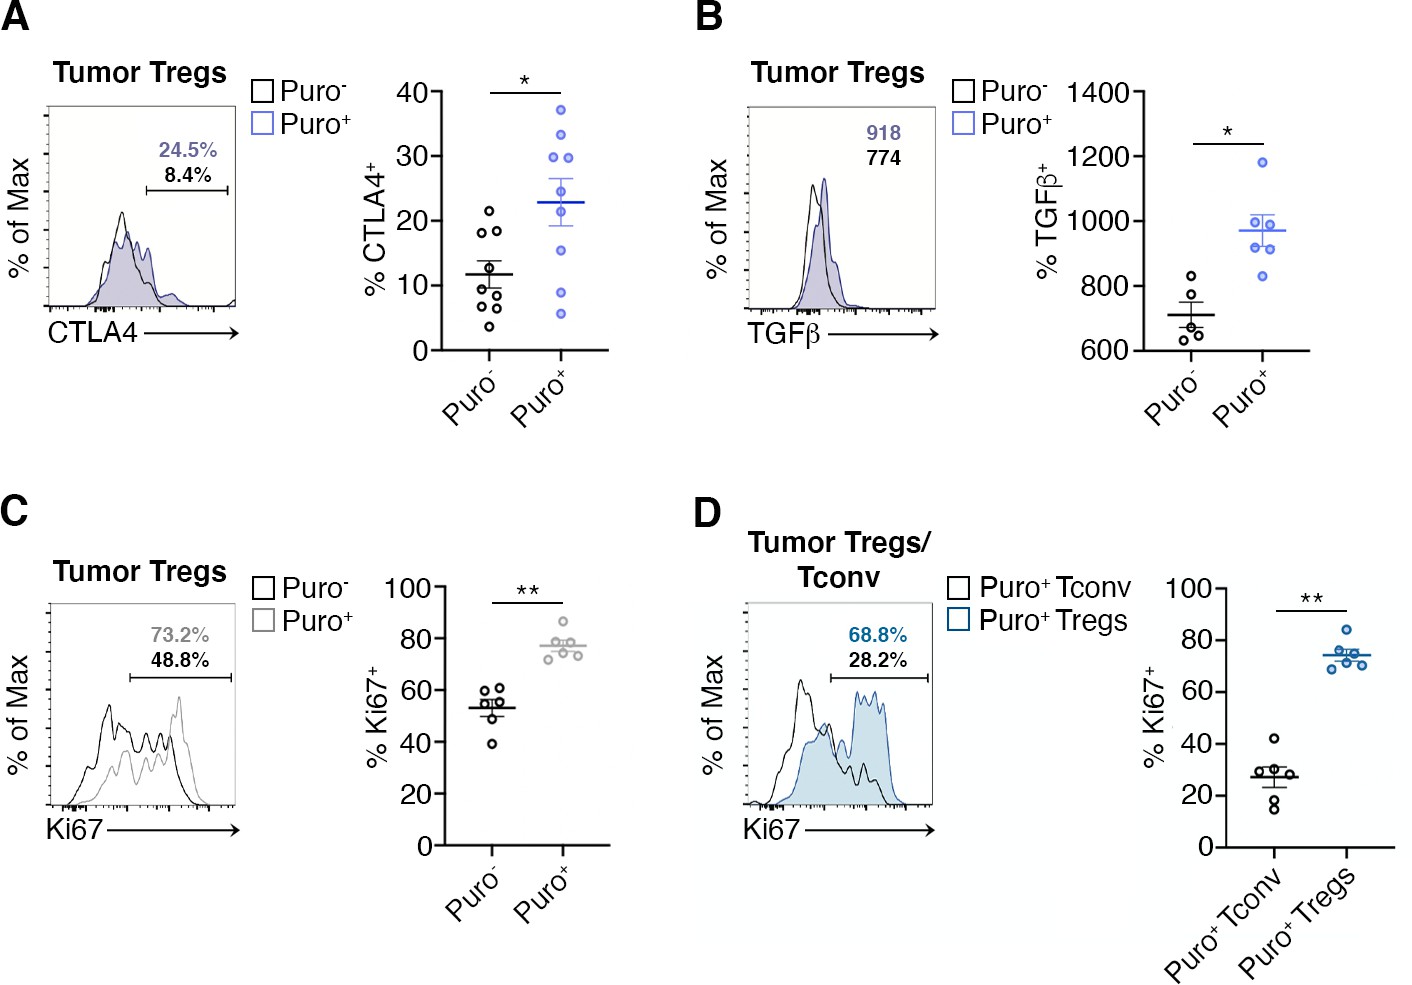
Highly translating regulatory T cells (Tregs) are functionally active and are more proliferative than highly translating Tconv.
(A) Representative plots (left) and statistical analysis (mean ± SEM) for CTLA-4+ (B), TGF-β+ (C), Ki67+ (C), within Puro+ and Puro- Tregs shows that, in vivo, Puro+ translating Tregs are more proliferative but also exhibit a more activated phenotype than Puro- Tregs. Percentages of positive cells in each gate are shown. Data from one experiment representative of two (n = 6–9) *p < 0.05; **p < 0.01. (D) Representative plots (left) and statistical analysis (mean ± SEM) for Ki67+ within Puro+ Tregs and Puro+ Tconv shows that, in vivo, Puro+ Tregs expressed significantly more Ki67 than Puro+ Tconv (C), indicating that the former are more proliferative than the latter. Percentages of positive cells in each gate are shown. Data from one experiment representative of two (n = 6) **p < 0.01.
-
Figure 6—source data 1
Source data for Figure 6A–D.
- https://cdn.elifesciences.org/articles/69015/elife-69015-fig6-data1-v2.xlsx
Author response image 1
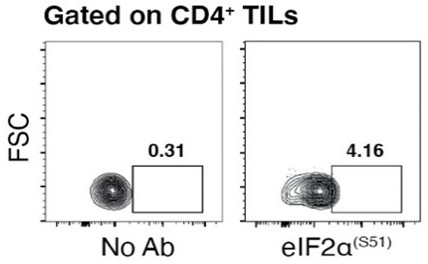
Representative flow cytometry data of unstained CD4+ TILs used as a negative control and labelled CD4+ TILs with Alexa Fluor 405 anti-human phospho-eIF2α proving the almost totally absence of a specific 2α phosphorylation signal.
Tables
Key resources table
| Reagent type (species) or resource | Designation | Source or reference | Identifiers | Additional information |
|---|---|---|---|---|
| Cell line (Mus musculus) | B16F10 | PMID:32699136 | Cells were obtained from Dr Matteo Bellone, HSR Scientific Institute, Milan, Italy | |
| Cell line (Mus musculus) | MC38 | PMID:32699136 | Cells were obtained from Dr Maria Rescigno, Humanitas University, Rozzano (MI), Italy | |
| Antibody | Mouse monoclonal anti-Puromycin, clone 12D10 | Millipore | Cat#: MABE343, RRID:AB_2566826 | WB (1:10000), IHC (1:500) |
| Antibody | Mouse monoclonal anti-Vinculin, clone V284 | Millipore | Cat#: 05–386, RRID:AB_11212640 | WB (1:1000) |
| Antibody | Mouse monoclonal anti-Actin | Sigma-Aldrich | Cat#: A4700, RRID:AB_476730 | WB (1:1000) |
| Antibody | Rabbit polyclonal anti phospho-rpS6 Ser235/236 | Cell Signaling | Cat#: 2211, RRID:AB_331679 | WB (1:1000) |
| Antibody | Rabbit polyclonal anti phospho-rpS6 Ser240/244 | Cell Signaling | Cell Signaling Technology Cat#: 2215, RRID:AB_331682 | WB (1:1000) |
| Antibody | Rabbit polyclonal anti-phospho-eIF2α Ser51 | Cell Signaling | Cat#: 3597, RRID:AB_390740 | IF (1:400), ELISA (1:500) |
| Antibody | Rabbit monoclonal anti-FoxP3 | Cell Signaling | Cat#: 98377, RRID:AB_2747370 | IHC (1:100) |
| Antibody | Rabbit monoclonal anti-CD4 | Cell Signaling | Cat#: 25229, RRID:AB_2798898 | IHC (1:100) |
| Antibody | Rat monoclonal anti-CD4 | BioLegend | BioLegend Cat#: 100401, RRID:AB_312686 | IF (1:400) |
| Antibody | Rabbit monoclonal anti-CD31 | Cell Signaling | Cat#: 77699, RRID:AB_2722705 | IHC (1:100) |
| Antibody | Mouse monoclonal APC conjugated anti-CD62L | eBioscience | Clone: MEL-14, Cat#: 17-0621-83 | FC (1:200) |
| Antibody | Mouse monoclonal PE conjugated anti-CCR5 | eBioscience | Clone: 7A4, Cat#: 12-1951-82 | FC (1:200) |
| Antibody | Mouse monoclonal FITC conjugated anti-ICOS | eBioscience | Clone: C398.4A, Cat#: 11-9949-82 | FC (1:200) |
| Antibody | Mouse monoclonal PE/Cy7 conjugated anti-CD39 | eBioscience | Clone: 24DMS1, Cat#: 25-0391-30 | FC (1:200) |
| Antibody | Mouse monoclonal PerCP/EF710 conjugated anti-CD3 | eBioscience | Clone: 17A2, Cat#: 46-0032-80 | FC (1:200) |
| Antibody | Mouse monoclonal PE conjugated anti-phospho-S6 | eBioscience | Clone: cupk43k, Cat#: 12-9007-41 | FC (1:100) |
| Antibody | Mouse monoclonal FITC conjugated anti-CD44 | BioLegend | Clone: IM7, Cat#: 103008 | FC (1:200) |
| Antibody | Mouse monoclonal PE/Cy7 conjugated anti-CD25 | BioLegend | Clone: PC61, Cat# 102016 | FC (1:200) |
| Antibody | Mouse monoclonal APC/Cy7 conjugated anti-CD4 | BioLegend | Clone: RM4-5, Cat#: 100526 | FC (1:200) |
| Antibody | Mouse monoclonal PE/Cy7 conjugated anti-CD4 | BioLegend | Clone GK1.5, Cat#: 100422 | FC (1:200) |
| Antibody | Mouse monoclonal PE/Cy7 conjugated anti-CD3 | BioLegend | Clone: 145–2C11, Cat#: 100320 | FC (1:200) |
| Antibody | Mouse monoclonal Pacific Blue conjugated anti-CD8α | BioLegend | Clone: 53–6.7, Cat#: 100725 | FC (1:200) |
| Antibody | Mouse monoclonal PE conjugated anti-CTLA-4 | BioLegend | Clone: UC10-4B9, Cat#: 106305 | FC (1:100) |
| Antibody | Mouse monoclonal APC conjugated anti-Tim3 | BioLegend | Clone: B8.2C12, Cat#: 134007 | FC (1:200) |
| Antibody | Mouse monoclonal PerCP/Cy5.5 conjugated anti-PD1 | BioLegend | Clone: RMPI-30, Cat#: 109120 | FC (1:200) |
| Antibody | Mouse monoclonal PerCP/Cy5.5 anti-CD27 | BioLegend | Clone: LG.3A10, Cat#: 124214 | FC (1:200) |
| Antibody | Mouse monoclonal FITC conjugated anti-CD28 | BioLegend | Clone: E18, Cat#: 122007 | FC (1:200) |
| Antibody | Mouse monoclonal PE conjugated anti-CD103 | BioLegend | Clone: 2E7, Cat#: 121406 | FC (1:200) |
| Antibody | Mouse monoclonal PE/Cy7 conjugated anti-CD69 | BioLegend | Clone: H1.2F3, Cat#:104526 | FC (1:200) |
| Antibody | Mouse monoclonal PE/Cy7 conjugated anti-TIGIT | BioLegend | Clone: 1G9, Cat#:142107 | FC (1:200) |
| Antibody | Mouse monoclonal PE conjugated anti-SLAMF6 | BioLegend | Clone: 330-AJ, Cat#:134605 | FC (1:200) |
| Antibody | Mouse monoclonal APC conjugated anti- FoxP3 | eBioscience | Clone: FJK-16s, Cat#: 17-5773-82 | FC (1:100) |
| Antibody | Mouse monoclonal PE conjugated anti-Ki67 | eBioscience | Clone: SolA15, Cat#: 12-5698-80 | FC (1:100) |
| Antibody | Mouse monoclonal RedMab 549 conjugated anti-PMO | Hypoxiprobe | Cat#: 5914 | FC (1:100) |
| Antibody | Mouse monoclonal APC of FITC conjugated anti-Puromycin | Millipore | Clone: 12D10 | FC (1:100) |
| Antibody | Mouse monoclonal PE conjugated anti-IFN-γ | BioLegend | Clone: XMG1.2 Cat#: 505808 | FC (1:100) |
| Antibody | Mouse monoclonal APC conjugated anti- TNF-α | eBioscience | Clone: MP6-XT22, Cat#: 506308 | FC (1:100) |
| Antibody | Mouse monoclonal APC conjugated anti-Granzyme B | BioLegend | Clone: GB11, Cat#: 515303 | FC (1:100) |
| Antibody | Mouse monoclonal BV421 conjugated anti-TGF-β | Biolegend | Clone: TW7-16B4, Cat#: 141407 | FC (1:100) |
| Commercial assay or kit | BD Fixation Permeabilization Kit | eBioscience | Cat#: 554714 | |
| Commercial assay or kit | eBioscience FoxP3 staining buffer set | eBioscience | Cat#:: 00-5523-00 | |
| Commercial assay or kit | CD4+ T Cell Isolation Kit | Miltenyi Biotec | 130-091-155 | |
| Chemical compound, drug | Human T-Activator CD3/CD28 | Thermo Fisher Scientific | 11131D | |
| Chemical compound, drug | Puromycin | Sigma-Aldrich | P8833 | |
| Chemical compound, drug | PMO | Hydroxyprobe | Cat#: HP1-XXX | |
| Chemical compound, drug | Everolimus | Sigma-Aldrich | SML2282 | |
| Chemical compound, drug | PPP242 | Sigma-Aldrich | P0037 | |
| Chemical compound, drug | MNK inhibitor | Sigma-Aldrich | 454861 |
Additional files
Download links
A two-part list of links to download the article, or parts of the article, in various formats.
Downloads (link to download the article as PDF)
Open citations (links to open the citations from this article in various online reference manager services)
Cite this article (links to download the citations from this article in formats compatible with various reference manager tools)
mTOR-dependent translation drives tumor infiltrating CD8+ effector and CD4+ Treg cells expansion
eLife 10:e69015.
https://doi.org/10.7554/eLife.69015


