Genetically incorporated crosslinkers reveal NleE attenuates host autophagy dependent on PSMD10
- Division of Respiratory and Critical Care Medicine, State Key Laboratory of Biotherapy, West China Hospital of Sichuan University and Collaborative Innovation Center of Biotherapy, China
- Department of General Practice and National Clinical Research Center for Geriatrics, State Key Laboratory of Biotherapy, West China Hospital, and Sichuan University, China
Figures
Figure 1 with 1 supplement
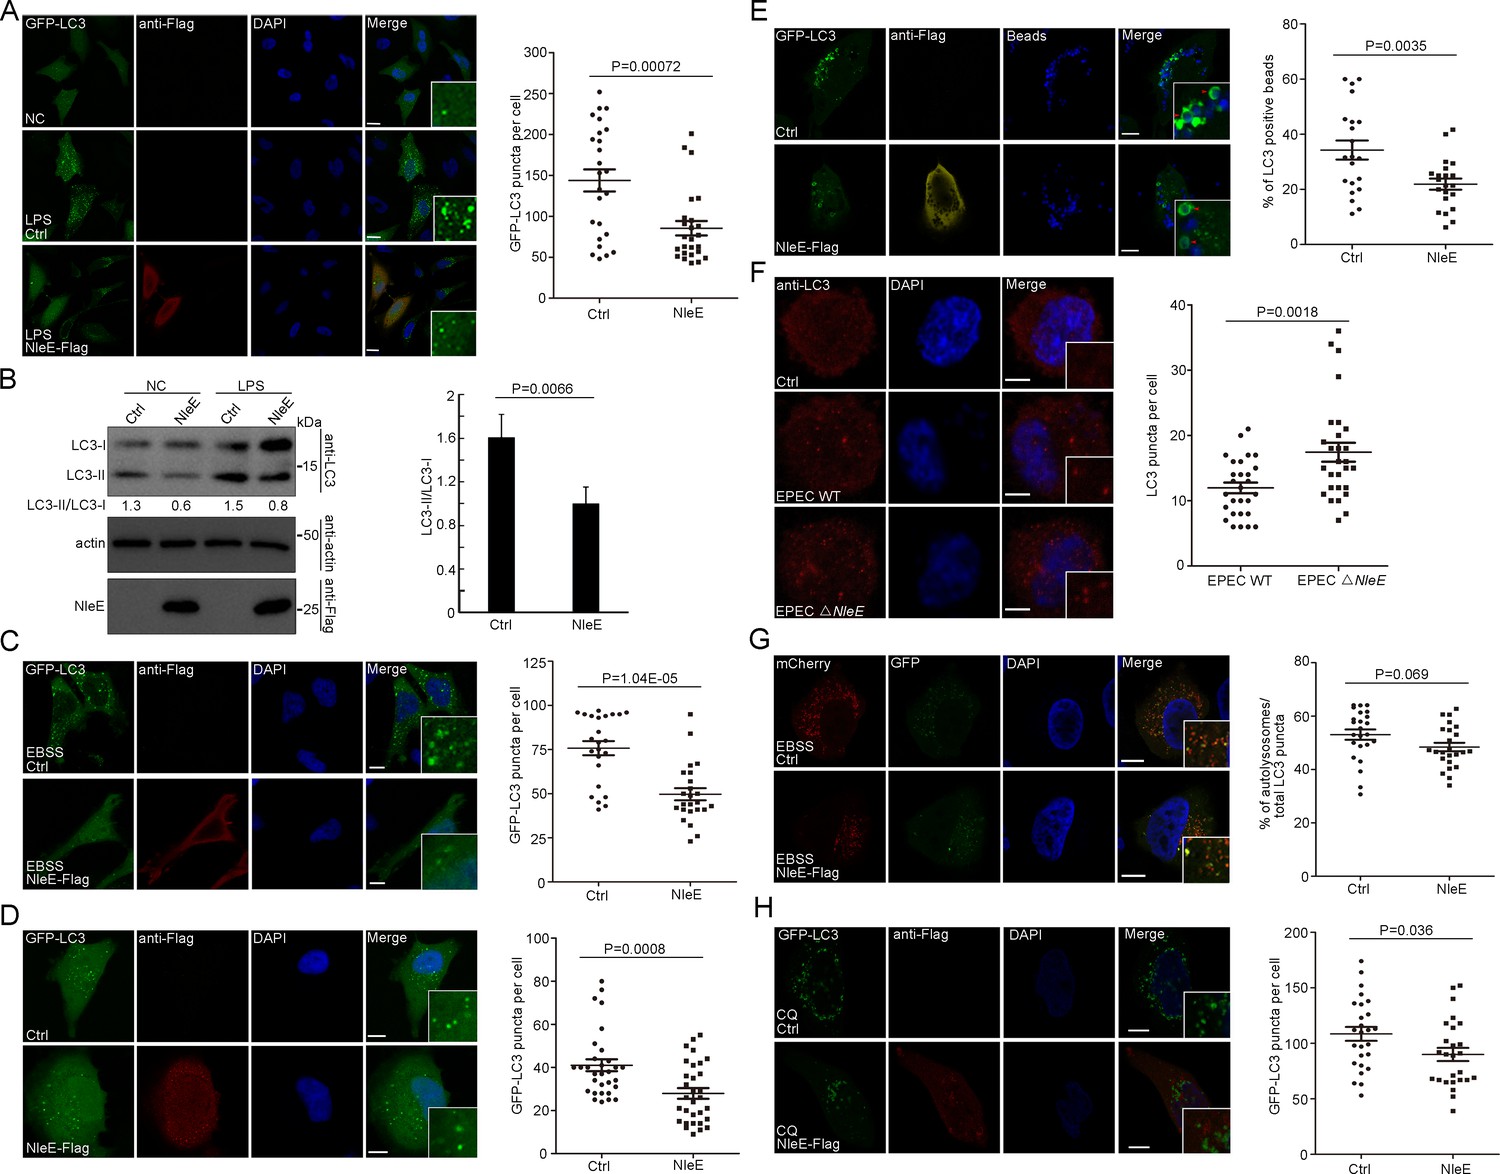
NleE attenuates autophagosome formation in host cells.
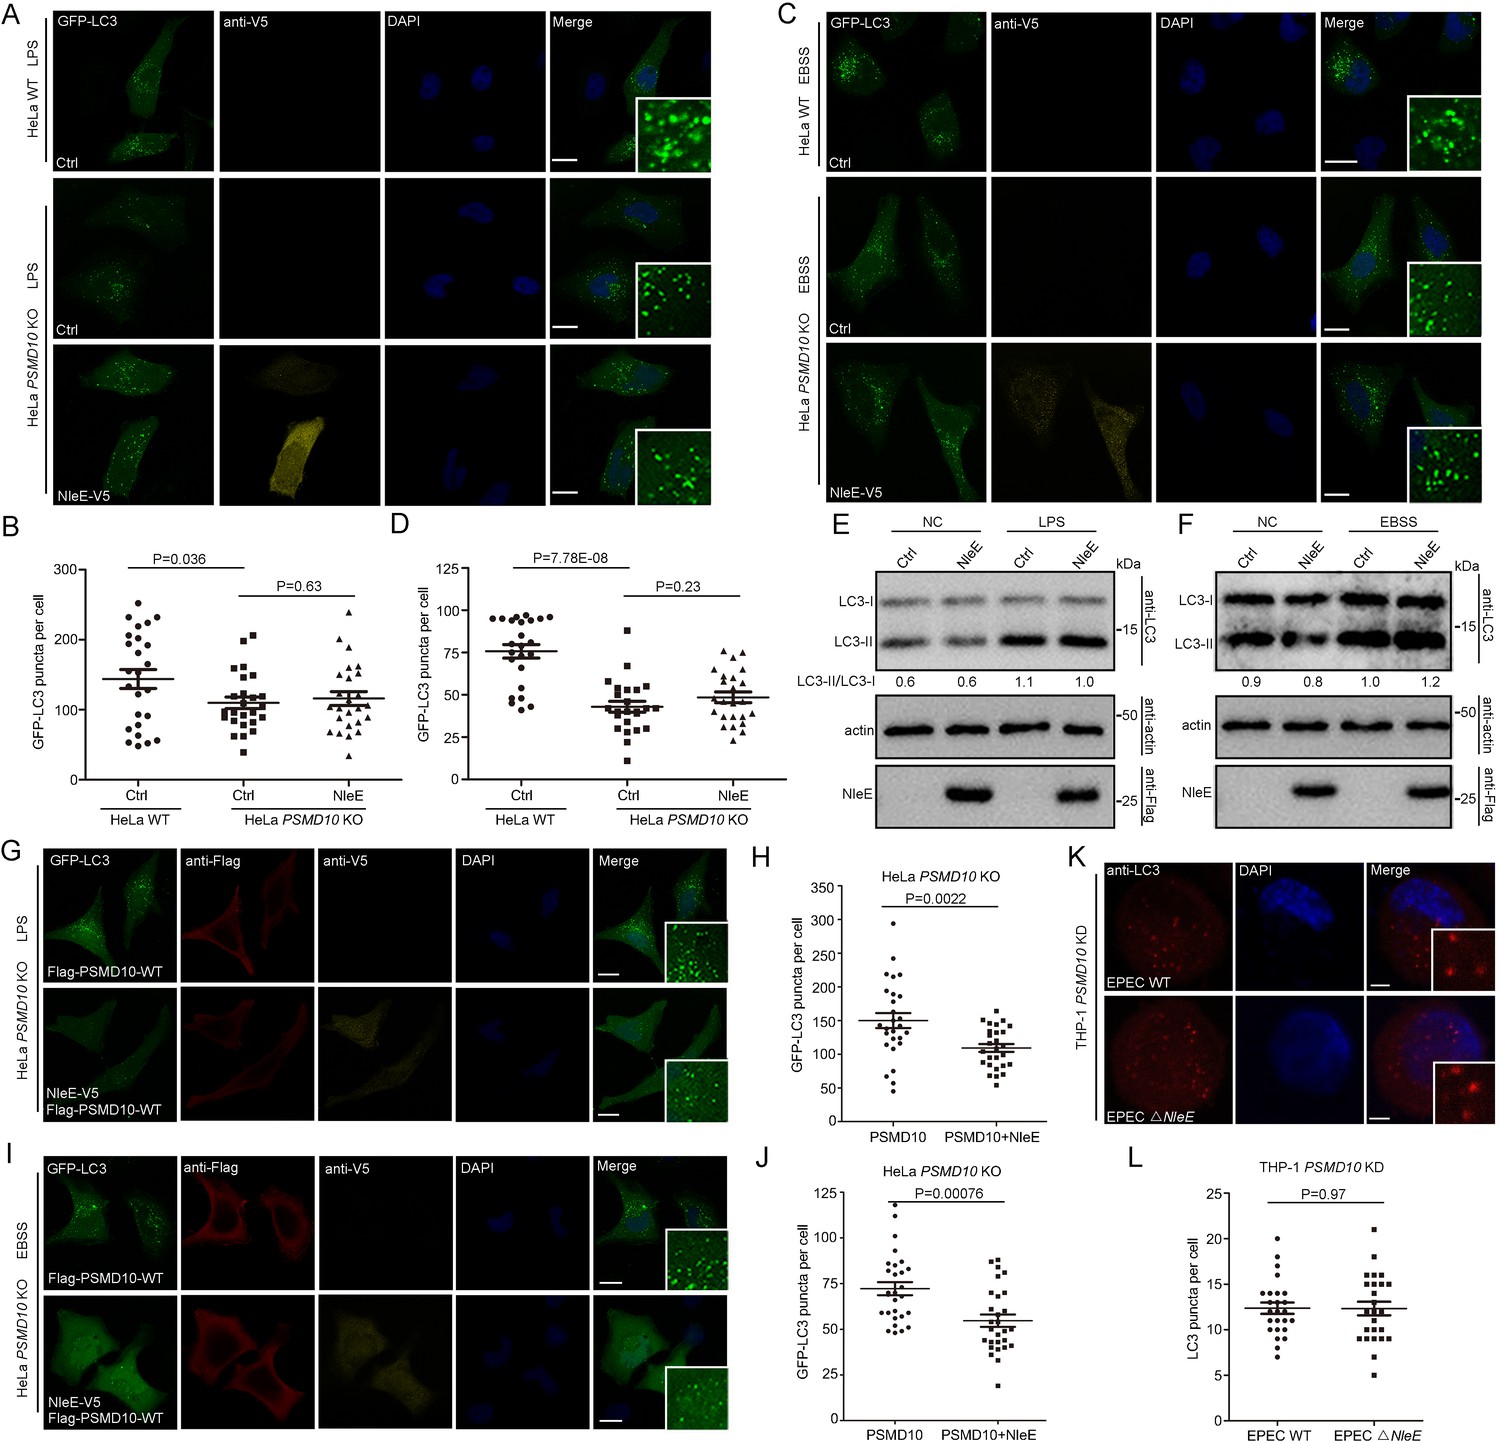
(A, B) NleE attenuates LPS-induced autophagy in HeLa cells. (A) HeLa cells expressing GFP-LC3 were transiently transfected with NleE-Flag. Representative images are shown. Scale bars, 20 μm. GFP-LC3 puncta per cell were quantified (N = 25). (B) Immunoblotting analysis of endogenous LC3 lipidation (LC3-II) in HeLa cells. Shown are the LC3–I (cytosolic) and LC3–II (lipid conjugated) forms as detected with antibodies to LC3. Experiments were repeated three times and quantified. (C, D) Starvation-induced autophagy and basel-level autophagy were partially suppressed by NleE in HeLa cells. Representative images are shown for each condition. Scale bars, 20 μm. GFP-LC3 puncta per cell were quantified (N = 24 for C and N ≥ 30 for D). (E) The LC3-mediated process was partially suppressed by NleE in HeLa cells. Arrowheads indicate internalized beads entrapped by LC3. Scale bars, 10 μm. The percentages of LC3 positive beads per cell were quantified (N = 21). (F) Live EPEC attenuates host autophagy dependent on NleE. WT EPEC and EPEC ΔNleE were cocultured with THP-1-induced macrophages. Cells were stained with anti-LC3 antibody. Scale bars, 5 μm. LC3 puncta per cell were quantified (N = 28). (G–H) NleE interferes with the autophagosome formation, but not the autophagosome fusion step. (G) HeLa cells were transfected with mCherry-GFP-LC3 or mCherry-GFP-LC3 and NleE. Representative images are shown. Scale bars, 10 μm. The ratio of autolysosomes (red) to the total autophagic vesicles (red+yellow) was quantified (N = 24). (H) NleE attenuates autophagy in choroquine (CQ)-treated host cells. Scale bars, 10 μm. GFP-LC3 puncta per cell were quantified (N = 26). All puncta quantification was performed in cells from three independent experiments. All quantification data represent the mean ± SD of three independent experiments.
-
Figure 1—source data 1
Numerical data for Figure 1A.
- https://cdn.elifesciences.org/articles/69047/elife-69047-fig1-data1-v2.xls
-
Figure 1—source data 2
Numerical data for Figure 1B.
- https://cdn.elifesciences.org/articles/69047/elife-69047-fig1-data2-v2.xls
-
Figure 1—source data 3
Numerical data for Figure 1C.
- https://cdn.elifesciences.org/articles/69047/elife-69047-fig1-data3-v2.xls
-
Figure 1—source data 4
Numerical data for Figure 1D.
- https://cdn.elifesciences.org/articles/69047/elife-69047-fig1-data4-v2.sourcedata.xls
-
Figure 1—source data 5
Numerical data for Figure 1E.
- https://cdn.elifesciences.org/articles/69047/elife-69047-fig1-data5-v2.xls
-
Figure 1—source data 6
Numerical data for Figure 1F.
- https://cdn.elifesciences.org/articles/69047/elife-69047-fig1-data6-v2.xls
-
Figure 1—source data 7
Numerical data for Figure 1G.
- https://cdn.elifesciences.org/articles/69047/elife-69047-fig1-data7-v2.xls
-
Figure 1—source data 8
Numerical data for Figure 1H.
- https://cdn.elifesciences.org/articles/69047/elife-69047-fig1-data8-v2.xls
-
Figure 1—source data 9
Original western blot files for Figure 1.
- https://cdn.elifesciences.org/articles/69047/elife-69047-fig1-data9-v2.zip
Figure 1—figure supplement 1
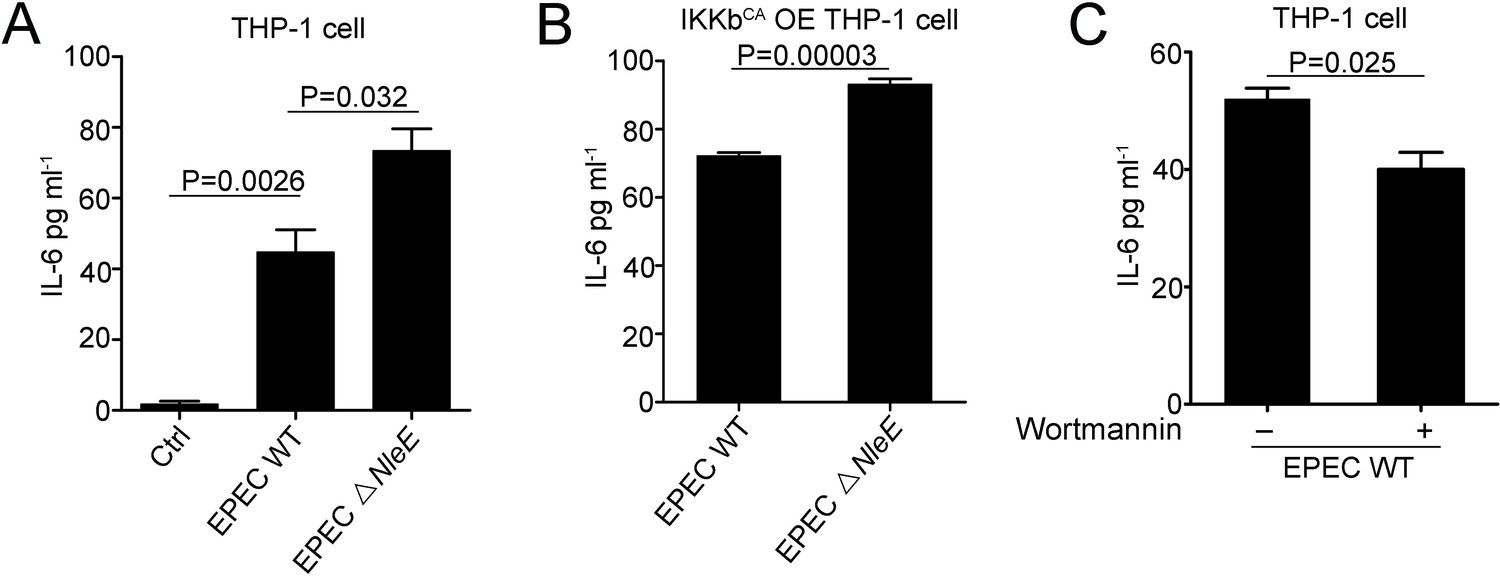
NleE inhibition of autophagy affects IL-6 production toward EPEC.
(A) EPEC suppresses IL-6 production of macrophages in a NleE-dependent manner. (B) NleE affects IL-6 production independent of TAB2/TAB3-mediated NF-κB suppression. (A, B) THP-1 cells were induced with 200 ng/ml PMA for 48 hr and infected with EPEC WT or EPEC ΔNleE for 4 hr. IL-6 secretion into supernatants was collected and measured by ELISA. (C) Autophagy affects host responses toward EPEC. THP-1 cells were induced with 200 ng/ml PMA for 48 hr and treated with 1 uM Wortmannin for 2 hr before EPEC WT infection.
-
Figure 1—figure supplement 1—source data 1
Numerical data for Figure 1—figure supplement 1A.
- https://cdn.elifesciences.org/articles/69047/elife-69047-fig1-figsupp1-data1-v2.sourcedata.xls
-
Figure 1—figure supplement 1—source data 2
Numerical data for Figure 1—figure supplement 1B.
- https://cdn.elifesciences.org/articles/69047/elife-69047-fig1-figsupp1-data2-v2.sourcedata.xls
-
Figure 1—figure supplement 1—source data 3
Numerical data for Figure 1—figure supplement 1C.
- https://cdn.elifesciences.org/articles/69047/elife-69047-fig1-figsupp1-data3-v2.xls
Figure 2 with 2 supplements
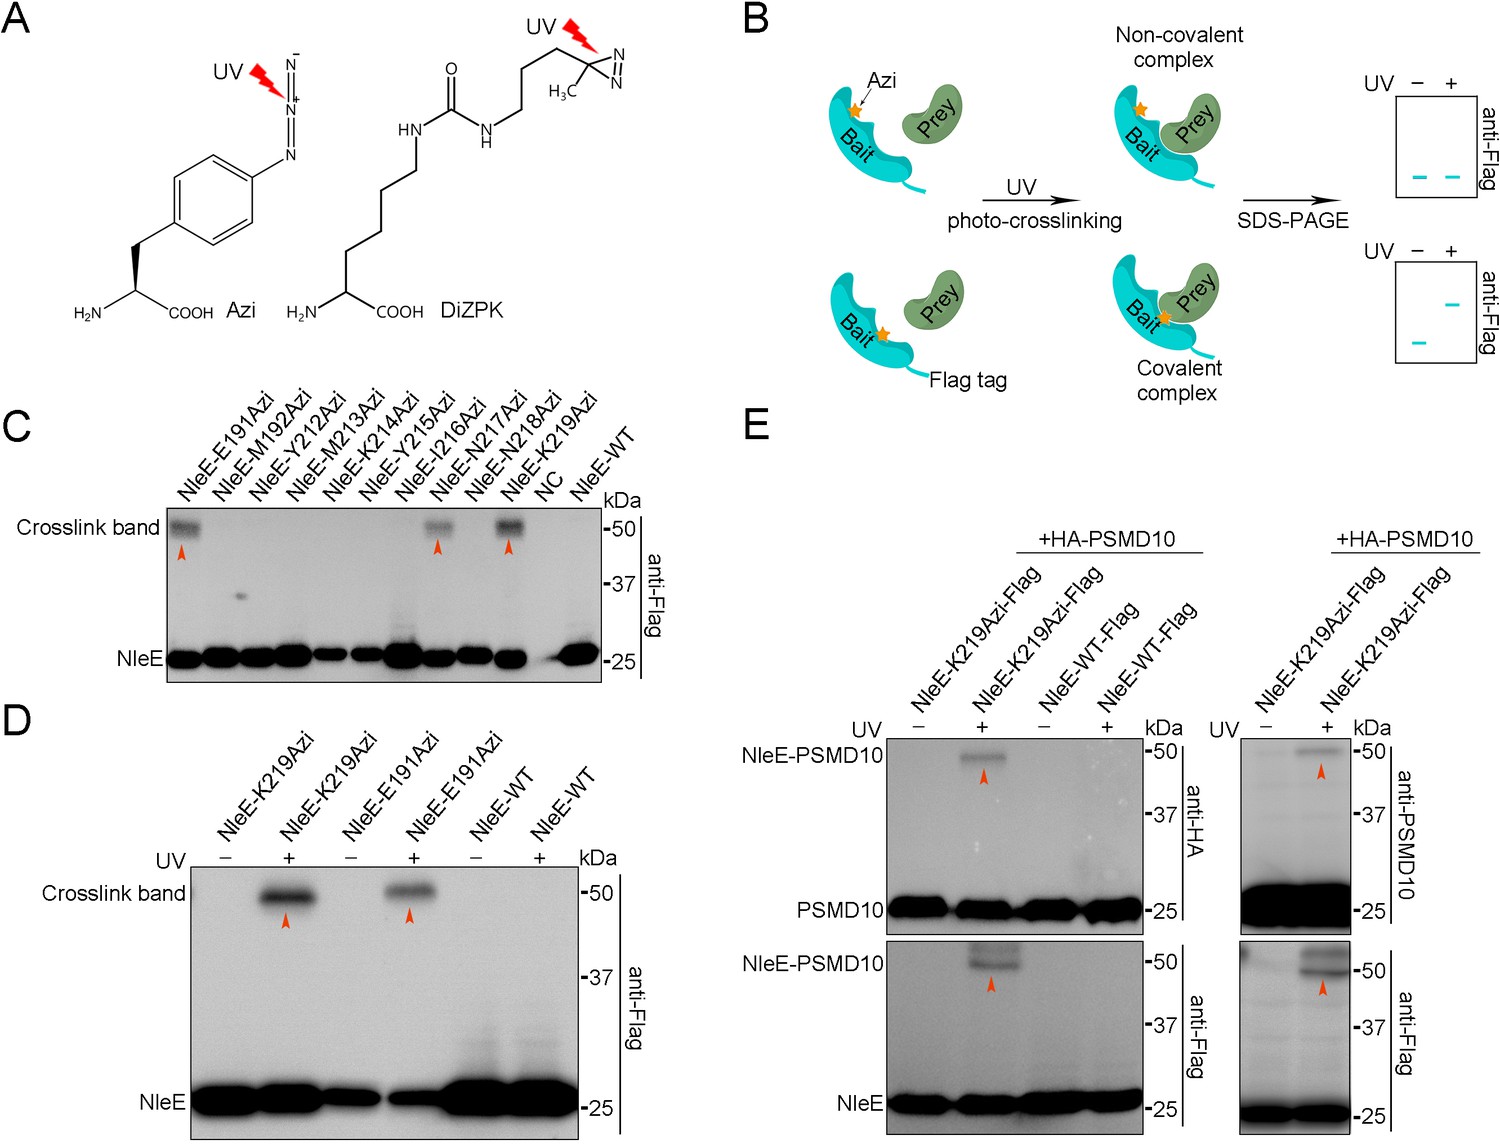
PSMD10 is an interaction partner of NleE in living cells.
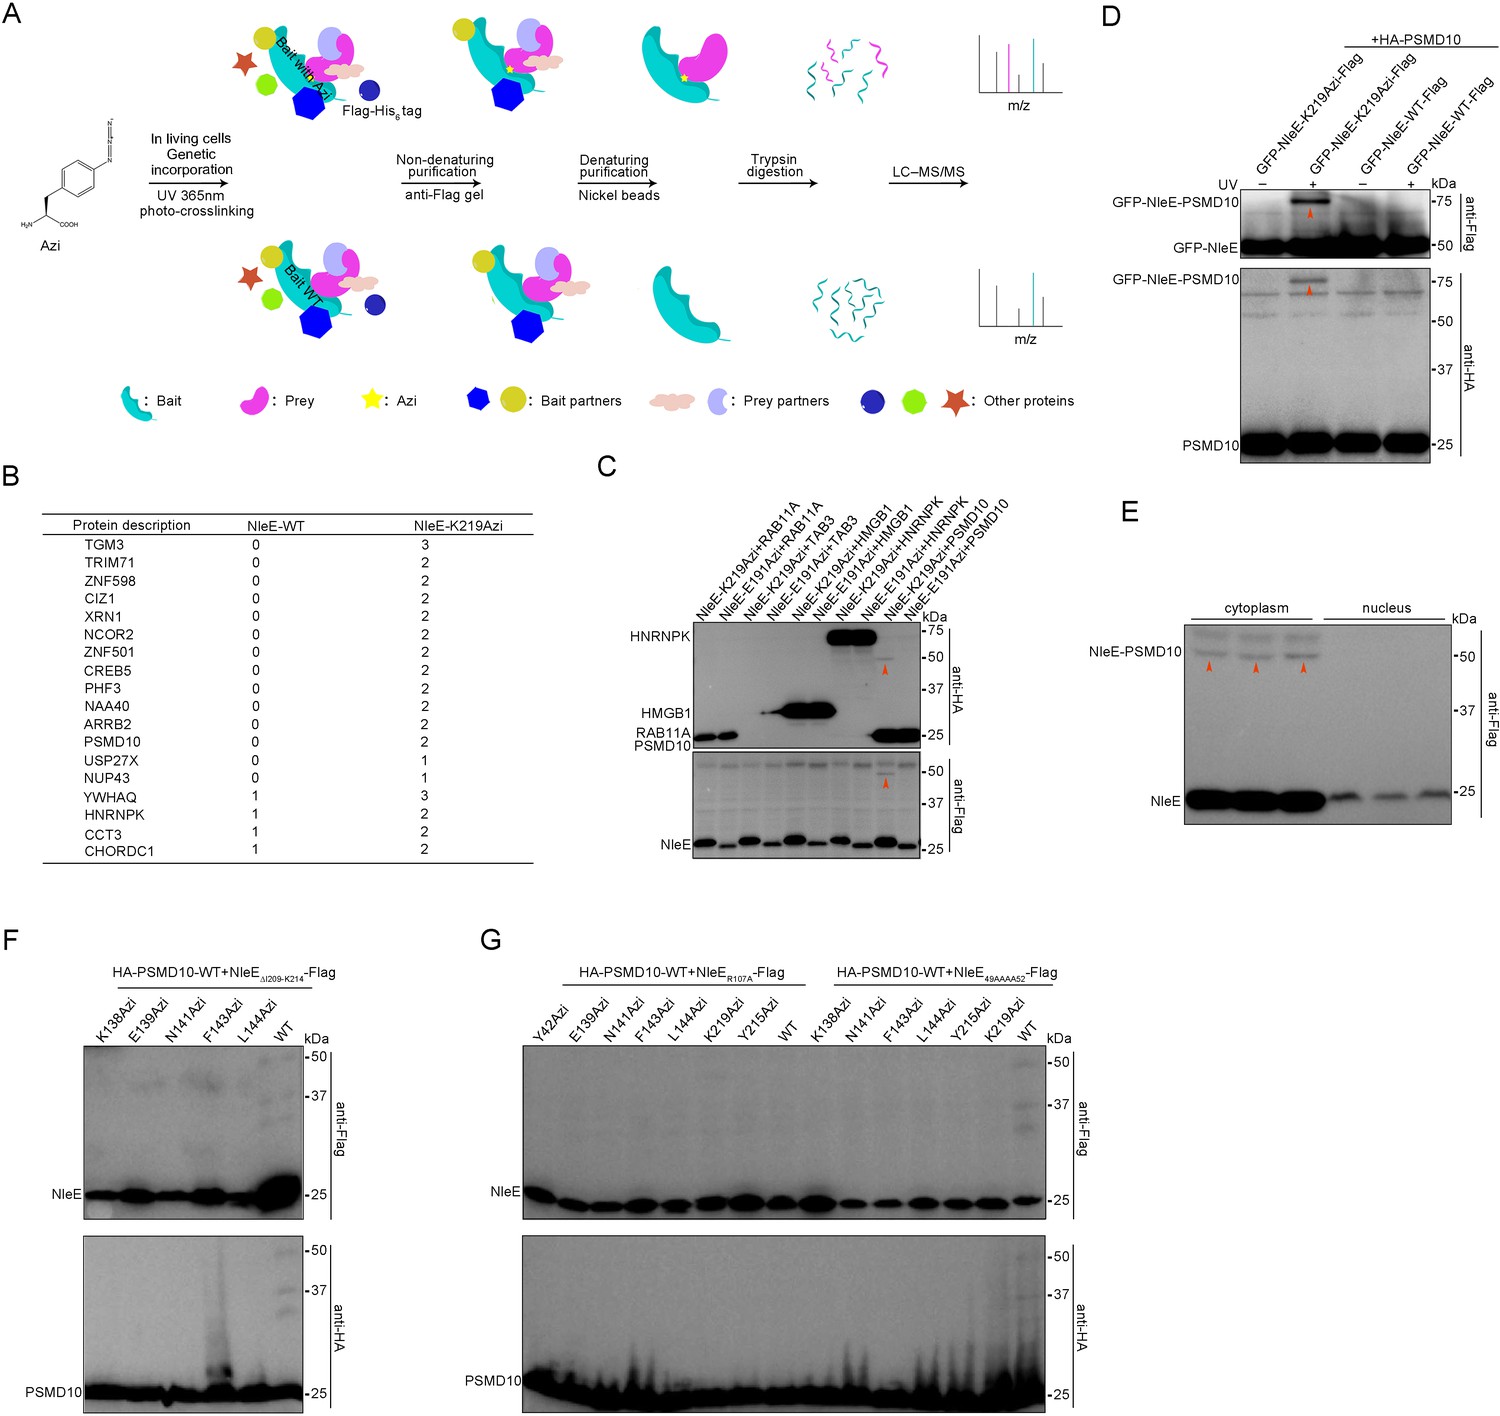
(A) Photocrosslinking Uaas used in this study. (B) Schematic diagram of genetically incorporated Uaas covalent capture interaction partners. (C) Photocrosslinking experiments map of NleE sites involved in covalent capture of interaction partners. Residues replaced by Azi are indicated in the upper row. Cell lysates were separated on SDS-PAGE gels and analyzed by immunoblotting using anti-Flag antibodies. (D) The photocrosslinking is Uaas and UV dependent. No crosslink band was identified in the WT NleE sample and NleE-K219Azi sample without UV treatment. (E) Validation of PSMD10 as a NleE interaction partner in living cells. Covalent complexes were detected with antibodies to HA, PSMD10, and Flag.
-
Figure 2—source data 1
Original western blot files for Figure 2.
- https://cdn.elifesciences.org/articles/69047/elife-69047-fig2-data1-v2.zip
Figure 2—figure supplement 1
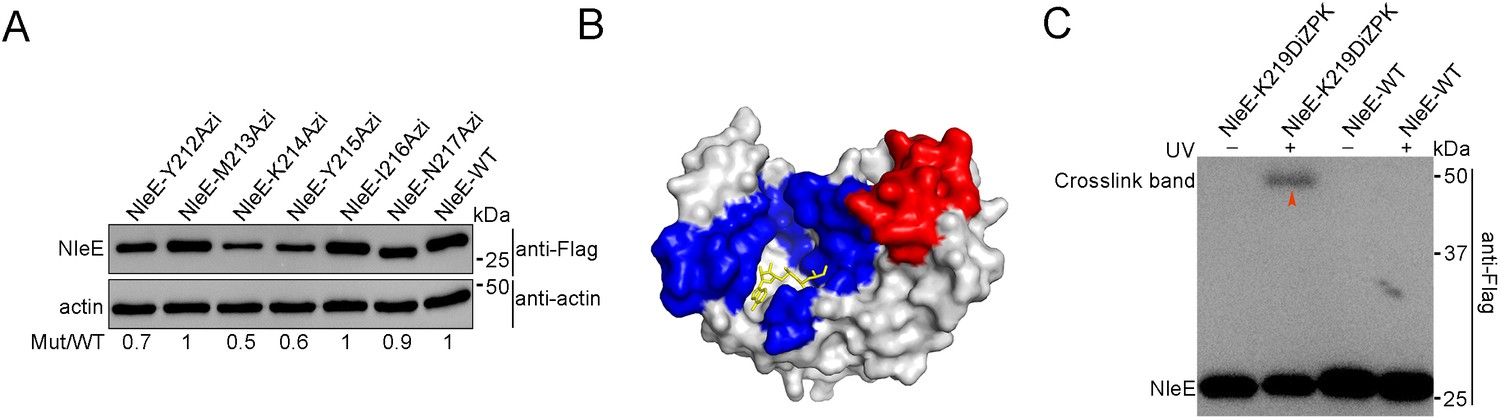
Uaas-dependent capture of NleE covalent complexes.
(A) Incorporation efficiency of Azi into NleE in HEK293T cells. (B) Structure of NleE with Uaa incorporation domains colored. The substrate binding domain was labeled with red, and the active center was colored blue. The subdivision of the domain is based on the crystal structure of NleE (PDB ID: 4R29). (C) The NleE-K219DiZPK-Flag mutant captures the covalent complex.
-
Figure 2—figure supplement 1—source data 1
Numerical data for Figure 2—figure supplement 1A.
- https://cdn.elifesciences.org/articles/69047/elife-69047-fig2-figsupp1-data1-v2.xls
-
Figure 2—figure supplement 1—source data 2
Original western blot files for Figure 2—figure supplement 1.
- https://cdn.elifesciences.org/articles/69047/elife-69047-fig2-figsupp1-data2-v2.zip
Figure 2—figure supplement 2
Identification of PSMD10 as a NleE interaction partner.
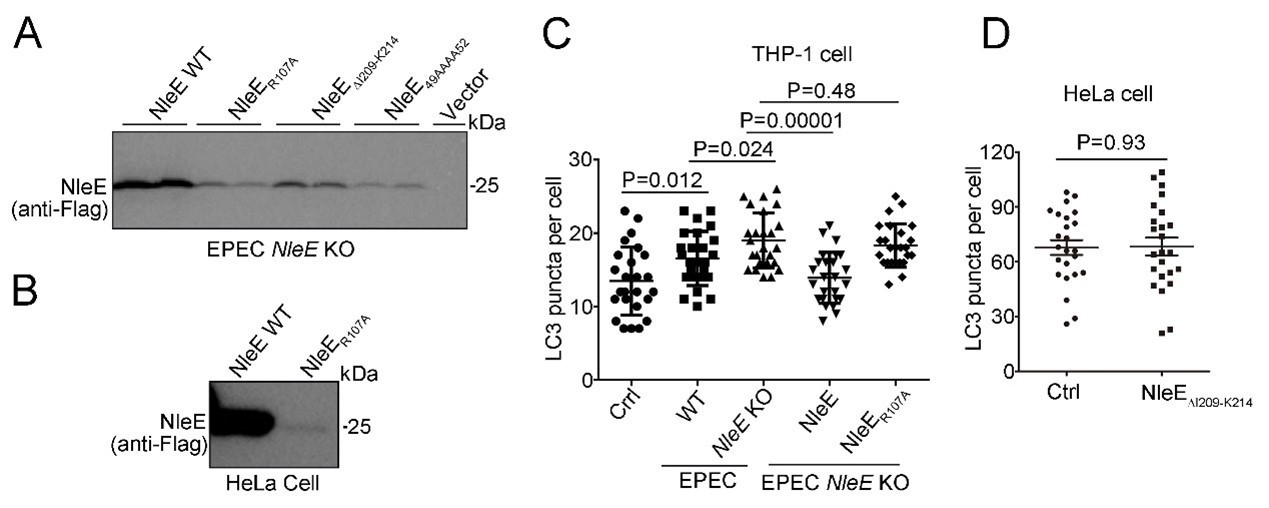
(A) Flow chart of identification of NleE binding partners. (B) List of NleE interaction candidates in cells. Proteins existing in the NleE-K219Azi-Flag-His samples, but absent or present at lower levels in the control samples were selected as candidates. (C) Screen NleE interaction partners from candidates. Shown are western blot bands detected with antibodies to HA and Flag. Arrowheads indicate NleE-PSMD10 crosslinking complexes. (D) Fusion of NleE to GFP resulted in upshifting of the covalent complexes. The GFP-NleE protein runs at MW of ~53 kDa. The GFP-NleE-PSMD10 covalent complexes run an apparent band at ~80 kDa dependent on UV treatment. Arrowheads indicate GFP-NleE-PSMD10 crosslinking complexes. (E) NleE and PSMD10 crosslinking occurs in the cytoplasm. Cytoplasmic and nuclear proteins were purified and analyzed by immunoblotting using anti-Flag antibodies. (F–G) NleE mutants with Azi incorporation fail to crosslink PSMD10 in living cells. PSMD10 was transiently transfected with NleE△209IDSYMK214 mutant(F), NleE49AAAA52 mutant and NleER107A-K219Azi mutant (G) individually into 293 T cells. Samples were treated with UV (365 nm). Shown are western blot bands detected with antibodies to HA and Flag.
-
Figure 2—figure supplement 2—source data 1
Numerical data for Figure 2—figure supplement 2B.
- https://cdn.elifesciences.org/articles/69047/elife-69047-fig2-figsupp2-data1-v2.xls
-
Figure 2—figure supplement 2—source data 2
Original western blot files for Figure 2—figure supplement 2.
- https://cdn.elifesciences.org/articles/69047/elife-69047-fig2-figsupp2-data2-v2.zip
Figure 3 with 1 supplement
NleE regulates host autophagy dependent on PSMD10.
(A–D) NleE fails to suppress host autophagy in PSMD10 KO cells. Representative images are shown. Scale bars, 20 μm. GFP-LC3 puncta per cell were quantified for LPS (B) and starvation-induced conditions (D) (N ≥ 24). (E, F) NleE does not affect the endogenous LC3-II/I ratio in PSMD10 KO cells. Shown are the LC3–I (cytosolic) and LC3–II (lipid conjugated) forms detected with anti-LC3 antibodies. Experiments were repeated three times. (G–J) WT PSMD10 restores the NleE suppression of autophagy in PSMD10 KO cells. Representative images are shown. Scale bars, 20 μm. LC3 puncta per cell were quantified for LPS (H) and starvation-induced conditions (J) (N≥27). (K, L) EPEC suppresses autophagy in a PSMD10 dependent mammer. PSMD10 KD THP-1 cells were induced with 200 ng/ml PMA for 48 hr and infected with EPEC WT or EPEC ΔNleE for 3 hr. Representative images are shown. Scale bars, 5 μm. (L) LC3 puncta per cell were quantified (N=25). All quantification was performed in cells from three independent experiments. All quantification data represent the mean ± SD of three independent experiments.
-
Figure 3—source data 1
Numerical data for Figure 3B.
- https://cdn.elifesciences.org/articles/69047/elife-69047-fig3-data1-v2.xls
-
Figure 3—source data 2
Numerical data for Figure 3D.
- https://cdn.elifesciences.org/articles/69047/elife-69047-fig3-data2-v2.xls
-
Figure 3—source data 3
Numerical data for Figure 3H.
- https://cdn.elifesciences.org/articles/69047/elife-69047-fig3-data3-v2.xls
-
Figure 3—source data 4
Numerical data for Figure 3J.
- https://cdn.elifesciences.org/articles/69047/elife-69047-fig3-data4-v2.xls
-
Figure 3—source data 5
Numerical data for Figure 3L.
- https://cdn.elifesciences.org/articles/69047/elife-69047-fig3-data5-v2.sourcedata.xls
-
Figure 3—source data 6
Original western blot files for Figure 3.
- https://cdn.elifesciences.org/articles/69047/elife-69047-fig3-data6-v2.zip
Figure 3—figure supplement 1
NleE expression was not affected by PSMD10.
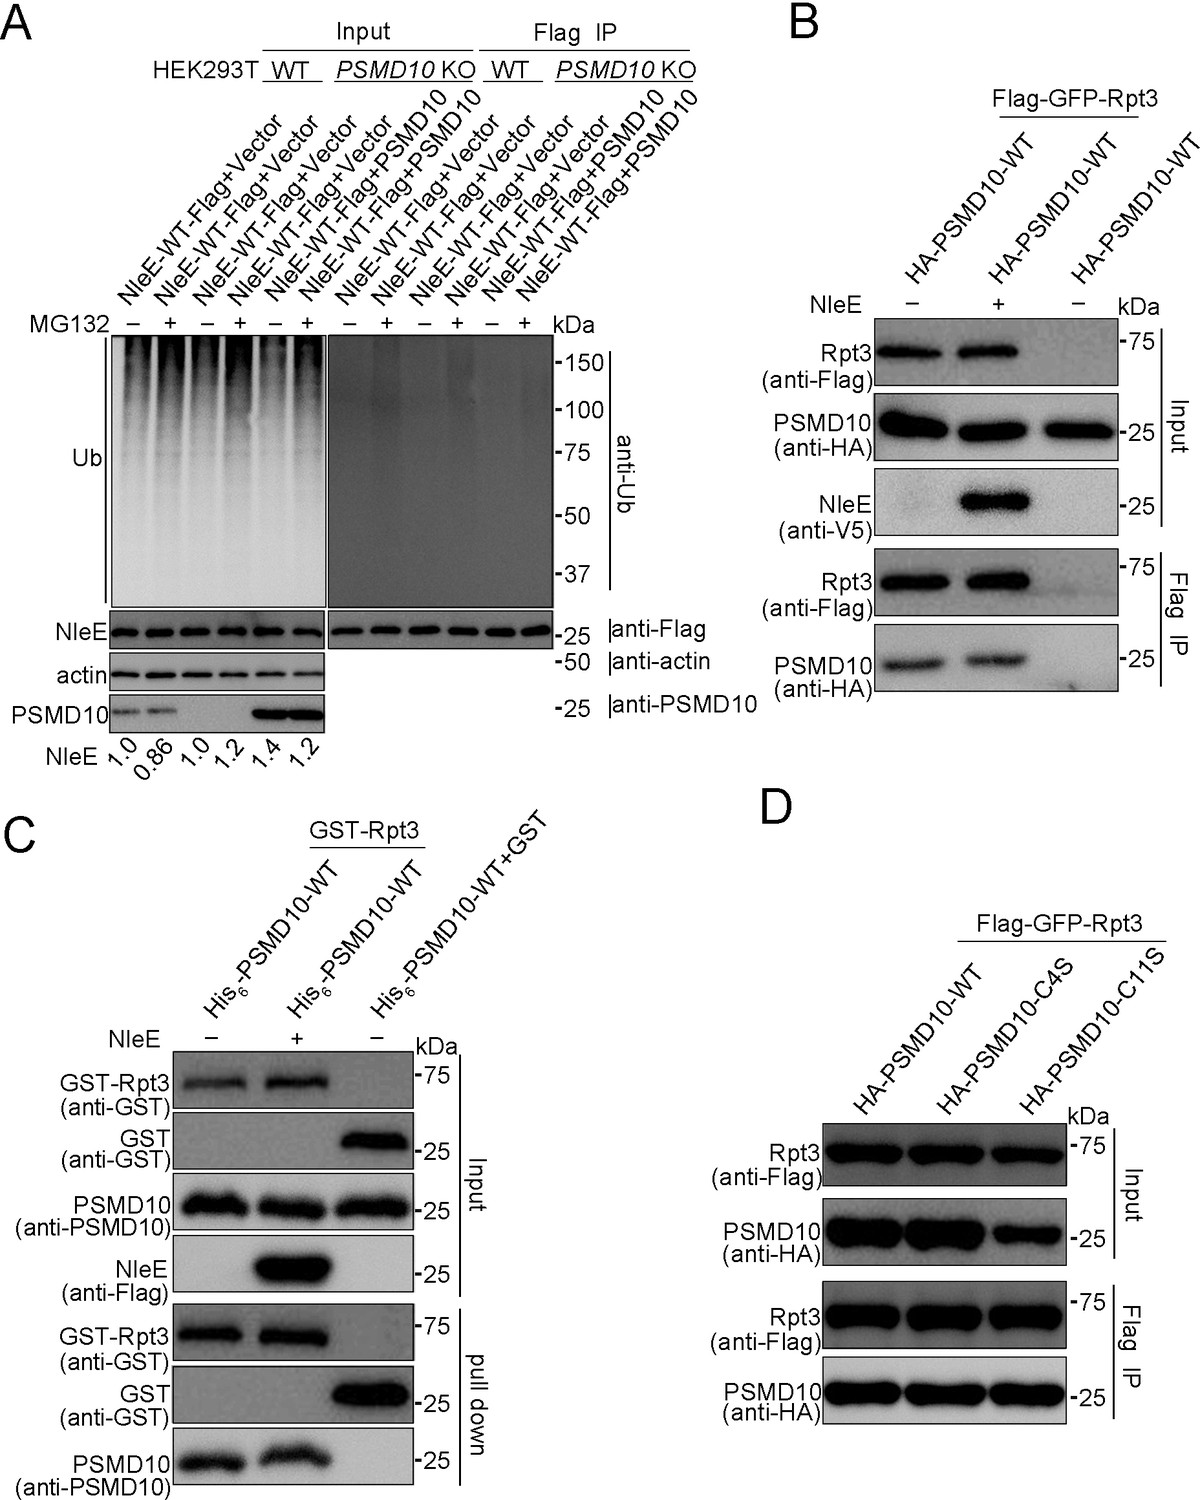
(A) NleE protein levels and ubiquitination levels were not affected by PSMD10. Shown are immunoblots of Flag IP and total cell lysates (Input). (B, C) PSMD10 interaction with Rpt3 was not affected by NleE. (B) Immunoblots of Flag IP and total cell lysates (Input) are shown. (C) GST-pulldown assay monitors the interaction between PSMD10 and Rpt3 in the presence or absence of NleE. (D) The C4S mutation did not affect PSMD10 interaction with Rpt3.
-
Figure 3—figure supplement 1—source data 1
Numerical data for Figure 3—figure supplement 1A.
- https://cdn.elifesciences.org/articles/69047/elife-69047-fig3-figsupp1-data1-v2.xls
-
Figure 3—figure supplement 1—source data 2
Original western blot files for Figure 3—figure supplement 1.
- https://cdn.elifesciences.org/articles/69047/elife-69047-fig3-figsupp1-data2-v2.zip
Figure 4 with 2 supplements

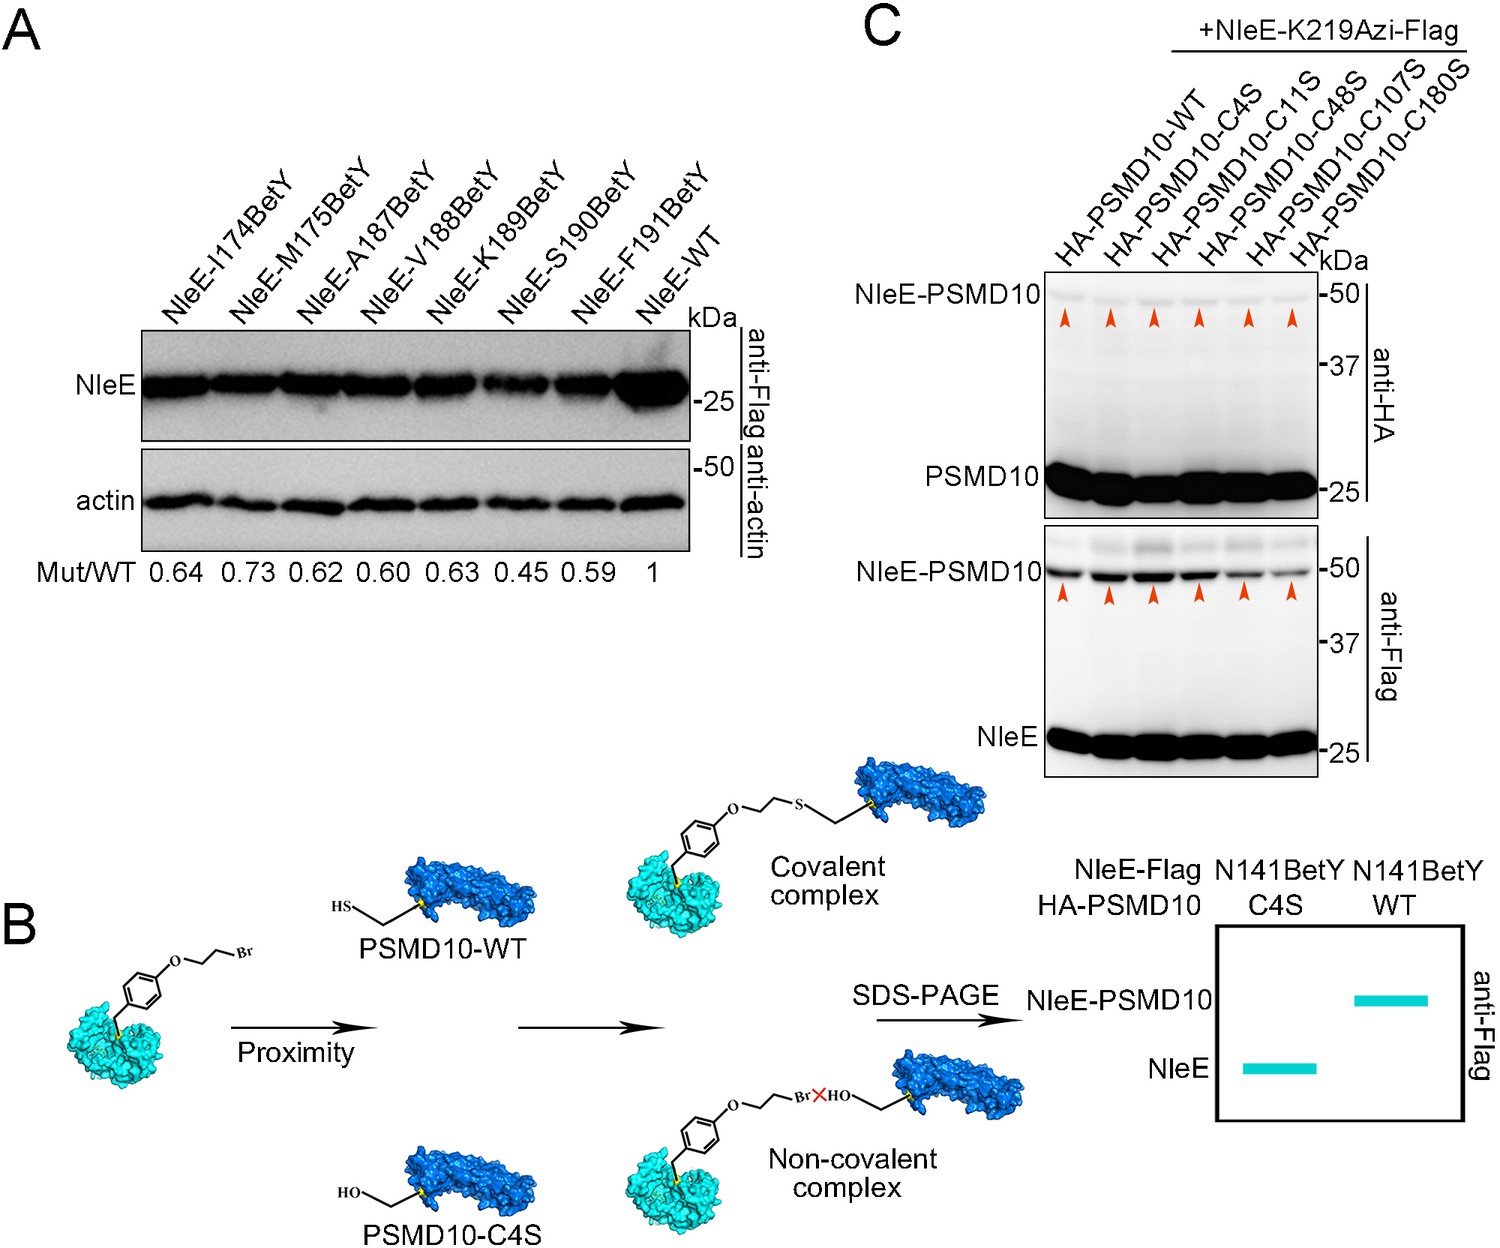
NleE interacts with the N-terminus of PSMD10.
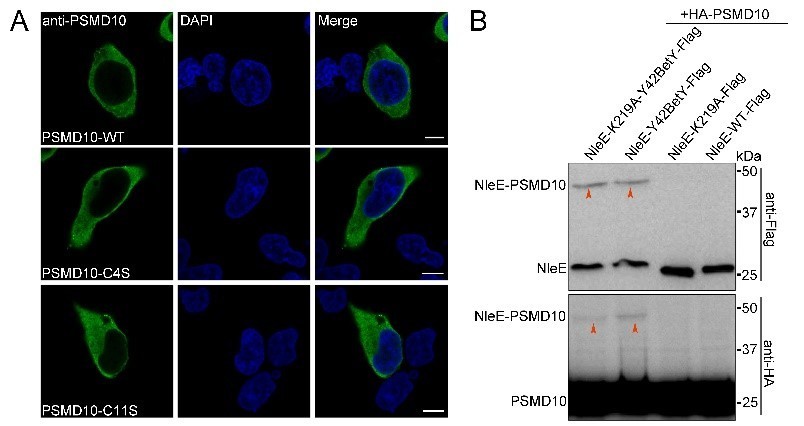
(A) Covalent crosslinking between cysteine (Cys) in PSMD10 and Uaa (BetY) in NleE. BetY was genetically incorporated in the substrate binding domain (colored red) and active center (colored blue) of NleE. (B) NleE-XBetY mutants covalent capture PSMD10. Residues X replaced by BetY are indicated in the upper row. (C) NleE structure with BetY positions crosslinked with PSMD10 colored in magenta. The NleE structure was downloaded from the Protein Data Bank with the accession code 4R29. (D) Cys4 mutation of PSMD10 disrupts covalent crosslinking with NleE-N141BetY. The mutated Cys in PSMD10 are indicated in the upper row.
-
Figure 4—source data 1
Original western blot files for Figure 4.
- https://cdn.elifesciences.org/articles/69047/elife-69047-fig4-data1-v2.zip
Figure 4—figure supplement 1
PSMD10 is not a NleE substrate.
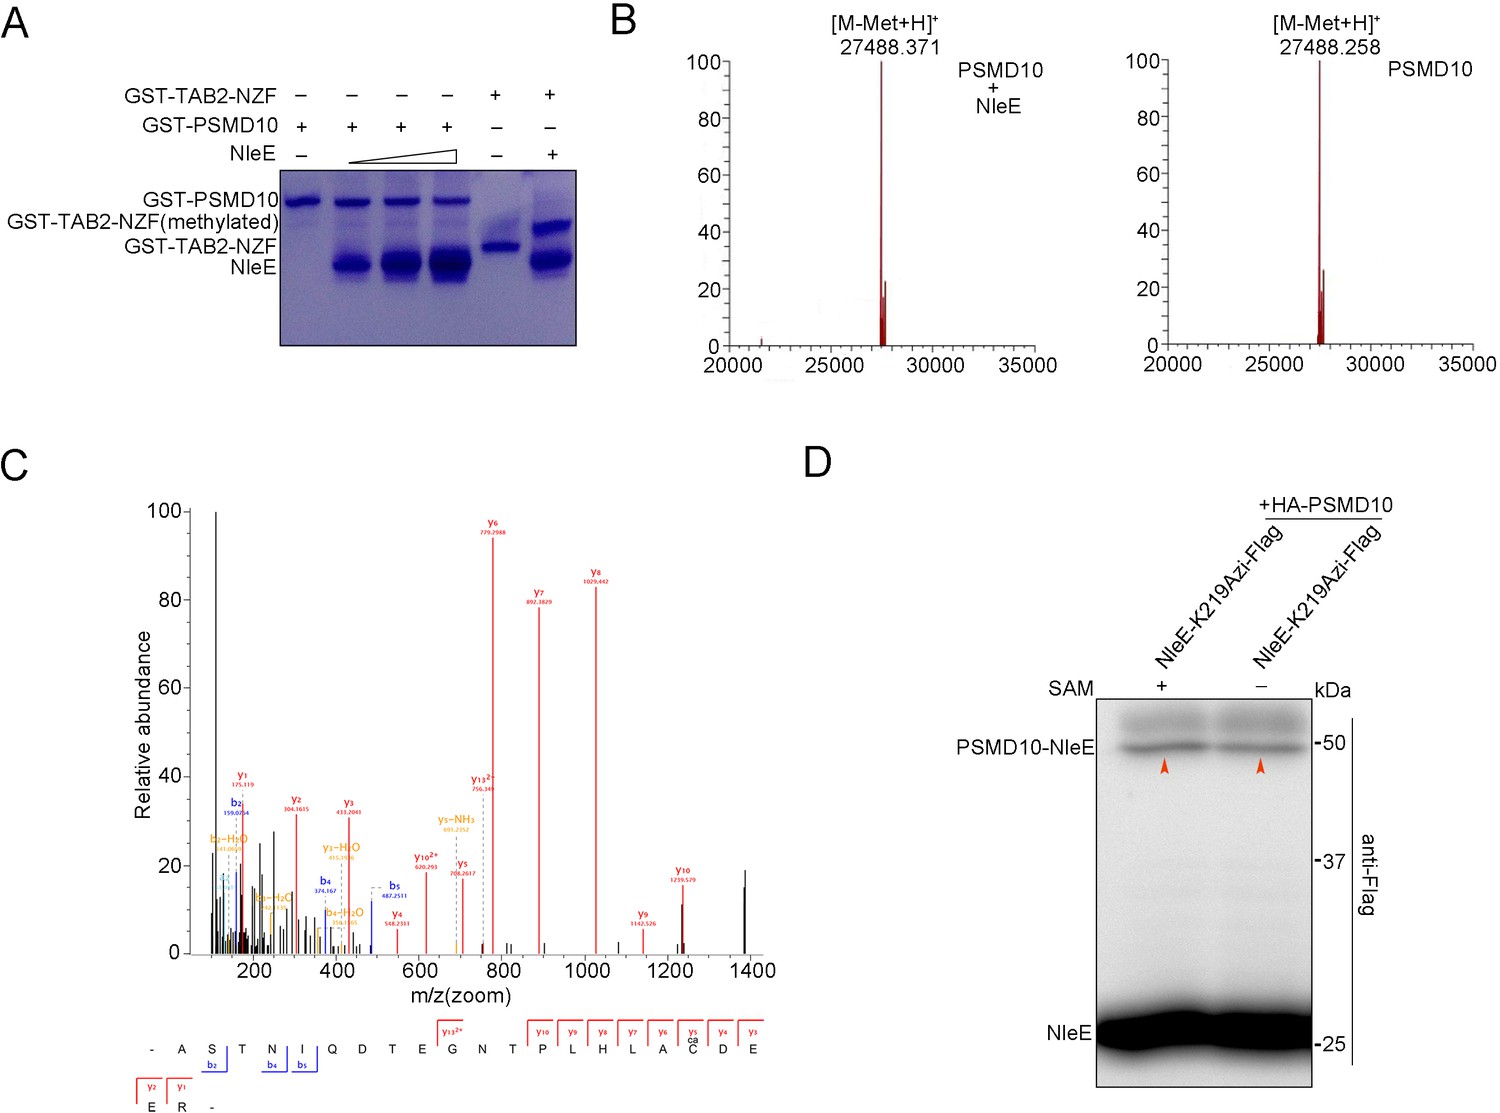
(A–C) PSMD10 was not methylated by NleE. (A, B) PSMD10 was not methylated by NleE in vitro. (A) Samples were subjected to native page analysis. (B) MS analysis of purified PSMD10 protein. (C) PSMD10 is not methylated by NleE in living cells. Cells were subjected to anti-Flag immunoprecipitation followed by MS analysis. (D) Interaction between NleE and PSMD10 is not affected by SAM.
-
Figure 4—figure supplement 1—source data 1
Numerical data for Figure 4—figure supplement 1B.
- https://cdn.elifesciences.org/articles/69047/elife-69047-fig4-figsupp1-data1-v2.xls
-
Figure 4—figure supplement 1—source data 2
Numerical data for Figure 4—figure supplement 1C.
- https://cdn.elifesciences.org/articles/69047/elife-69047-fig4-figsupp1-data2-v2.xls
-
Figure 4—figure supplement 1—source data 3
Original western blot files for Figure 4—figure supplement 1.
- https://cdn.elifesciences.org/articles/69047/elife-69047-fig4-figsupp1-data3-v2.zip
Figure 4—figure supplement 2
Pinpoint interaction residue pairs in NleE-PSMD10 complexes.
(A) Incorporation efficiency of BetY into NleE in HEK293T cells. The working concentration of BetY is 0.5 mM in DMEM. (B) Schematic representation of pinpointing interaction residue pairs. (C) PSMD10 Cys mutants maintain binding activity with NleE. PSMD10 Cys mutants were coexpressed with NleE-K219Azi. Samples were treated with UV (365 nm). Shown are western blot bands detected with antibodies to HA and Flag.
-
Figure 4—figure supplement 2—source data 1
Numerical data for Figure 4—figure supplement 2A.
- https://cdn.elifesciences.org/articles/69047/elife-69047-fig4-figsupp2-data1-v2.xls
-
Figure 4—figure supplement 2—source data 2
Original western blot files for Figure 4—figure supplement 2.
- https://cdn.elifesciences.org/articles/69047/elife-69047-fig4-figsupp2-data2-v2.zip
Figure 5 with 1 supplement
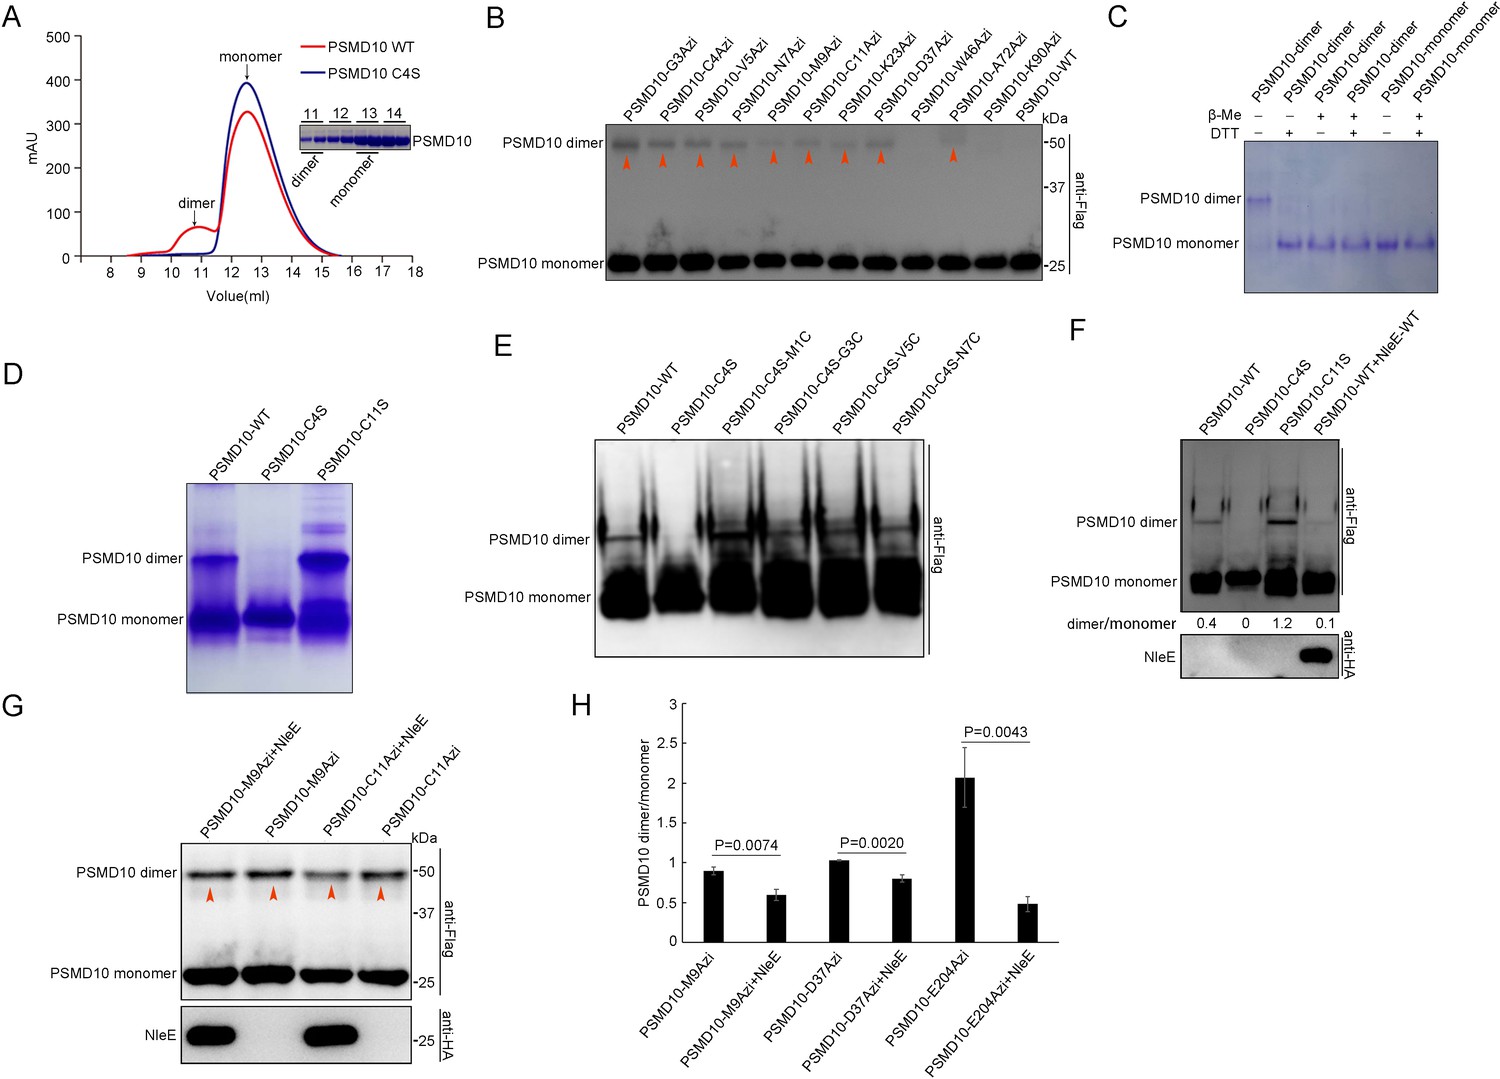
NleE suppresses homodimerization of PSMD10.
(A) C4S mutation suppresses homodimerization of purified PSMD10 protein in vitro. Protein from the dimer fraction of WT PSMD10 shows MW corresponding to the PSMD10 monomer on SDS–PAGE analysis. (B) Covalent capture of PSMD10 homodimers in living cells. (C) Disulfide bonds stabilize the PSMD10 homodimer in vitro. The dimer and monomer PSMD10 were analyzed on native gel in the absence and presence of 100 mM DTT or 1% β-Me. (D) The disulfide bond of Cys4 stabilizes the PSMD10 homodimer in vitro. (E) Disulfide bonds at the N-terminus stabilize homodimer of PSMD10. (F) NleE suppresses PSMD10 homodimerization in living cells. (G–H) NleE partially suppresses PSMD10 homodimer crosslinking by Uaas in living cells. Crosslinking efficiency were quantified (H). Quantification data represent the mean ± SD of independent experiments.
-
Figure 5—source data 1
Numerical data for Figure 5H.
- https://cdn.elifesciences.org/articles/69047/elife-69047-fig5-data1-v2.xls
-
Figure 5—source data 2
Original western blot files for Figure 5.
- https://cdn.elifesciences.org/articles/69047/elife-69047-fig5-data2-v2.zip
Figure 5—figure supplement 1
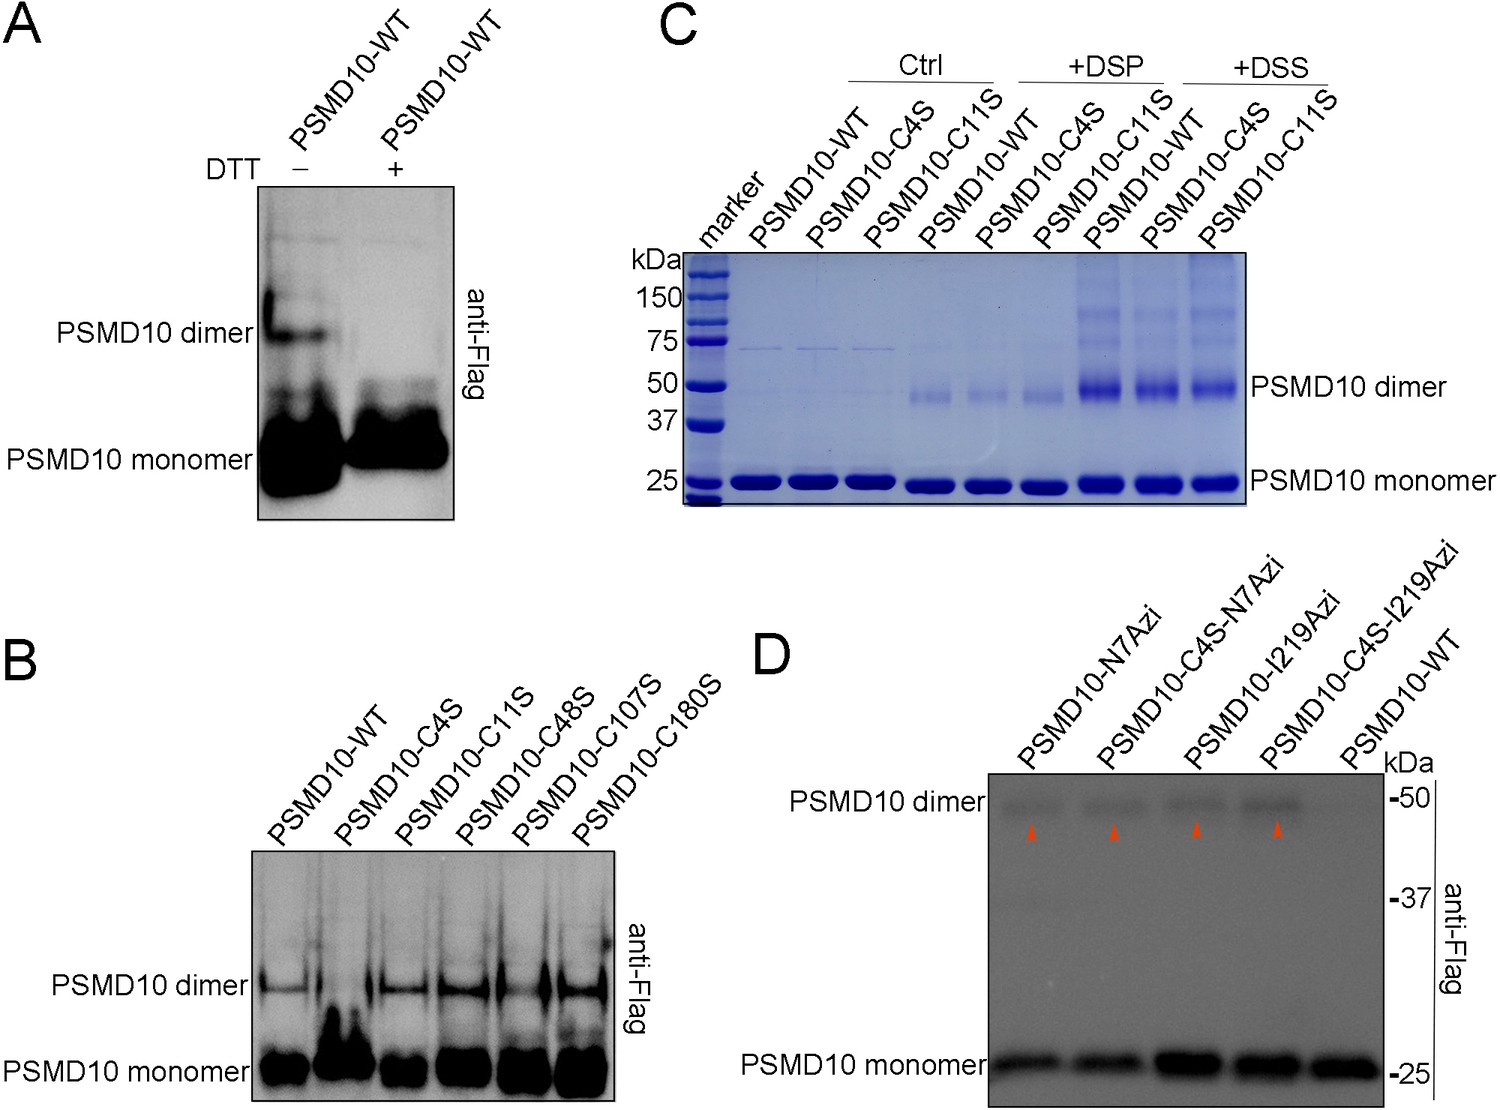
Disulfide bonds stabilize the PSMD10 homodimer.
(A) Disulfide bonds stabilize the PSMD10 homodimer in living cells. HEK293T cells expressing Flag-PSMD10 were analyzed on native gel in the absence and presence of DTT. (B) The disulfide bond of Cys4 stabilizes the PSMD10 homodimer in living cells. PSMD10 KO cells were transiently transfected with WT PSMD10 or PSMD10 Cys mutants. Cells were collected and subjected to native page analysis followed by immunoblotting. (C, D) Covalent capture of PSMD10 C4S homodimer. (C) Purified PSMD10-WT/C4S/C11S proteins were crosslinked with 1 mM dithiobis succinimidyl propionate (DSP) or disuccinimidyl suberate (DSS). The reaction products were separated on SDS–PAGE. (D) PSMD10 KO cells were transiently transfected with PSMD10-N7/I219Azi or PSMD10-C4S-N7/I219Azi and irradiated with UV (365 nm).
-
Figure 5—figure supplement 1—source data 1
Original western blot files for Figure 5—figure supplement 1.
- https://cdn.elifesciences.org/articles/69047/elife-69047-fig5-figsupp1-data1-v2.zip
Figure 6
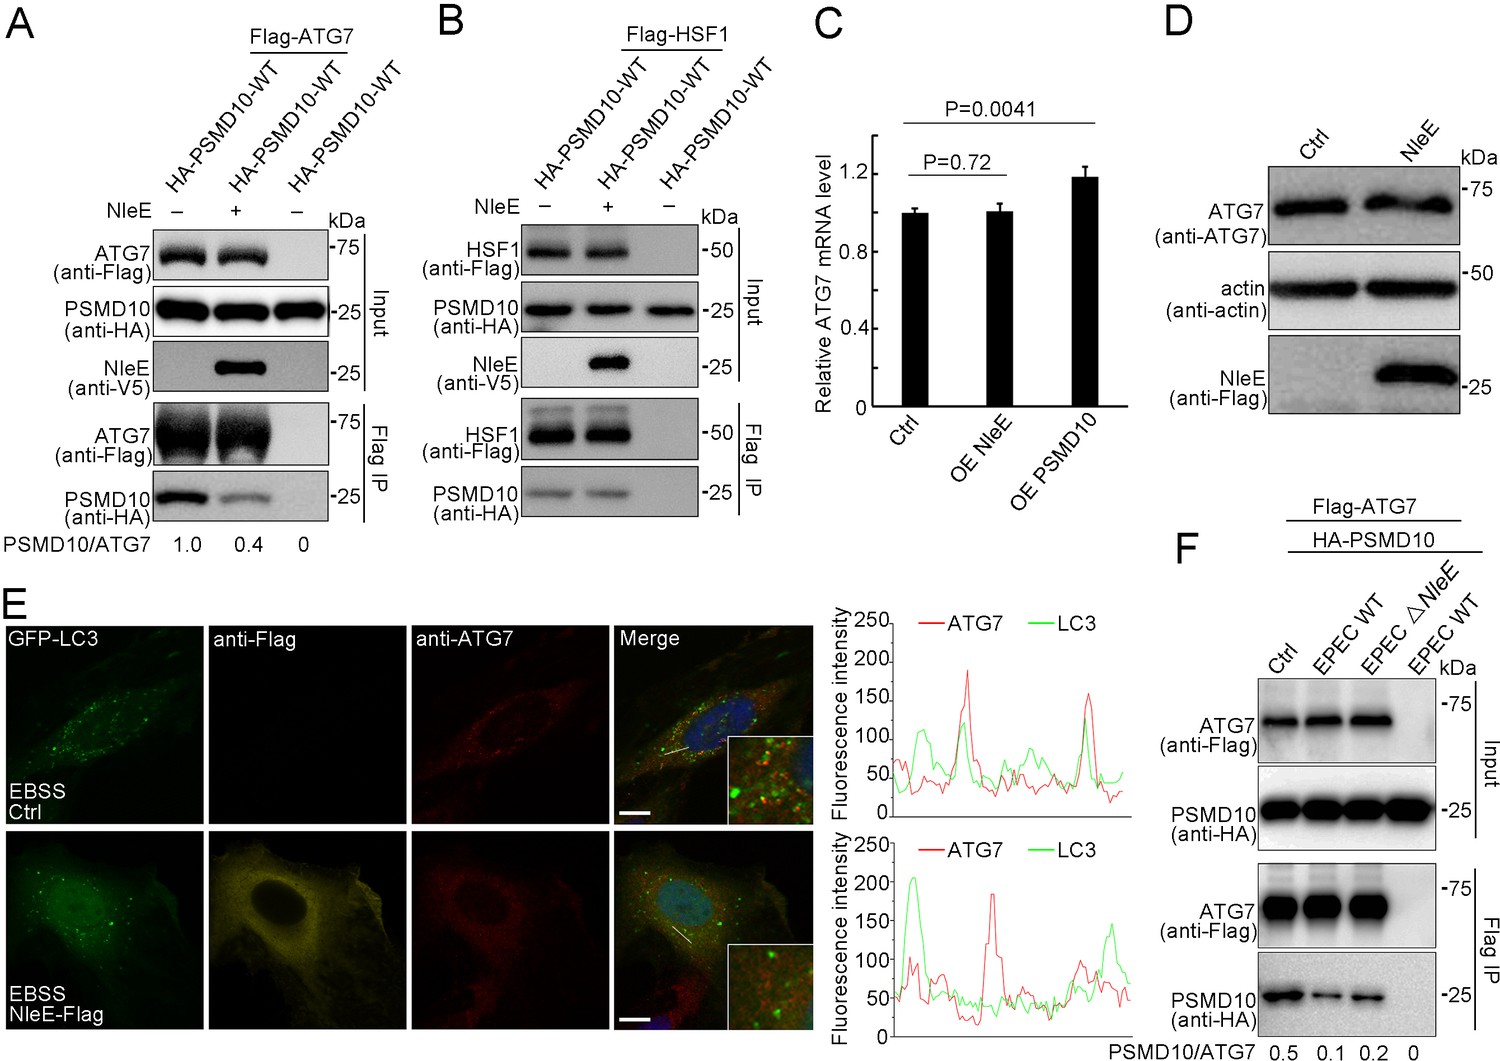
NleE suppresses PSMD10 interaction with ATG7.
(A,B) NleE suppresses the PSMD10 interaction with ATG7, but not the interaction with HSF1. Immunoblots of anti-Flag immunoprecipitates (Flag IP) and total cell lysates (Input) are shown. (C) Transcription of ATG7 is not affected by NleE in HeLa cells. Real-time PCR was performed to detect mRNA level of ATG7. Data represent the mean ± SD of three independent experiments. Each sample performs three times technical repeats. (D) NleE does not affect the protein level of ATG7 in HeLa cells. Cells were treated with 10 µg/ml LPS for 12 hr and analyzed by immunoblotting using anti-Flag and anti-ATG7 antibodies. (E) NleE suppresses ATG7 colocalization with LC3. Representative images are shown. Scale bars, 10 μm. (F) PSMD10 interaction with ATG7 was suppressed by EPEC in a NleE dependent manner. HEK293T cells were transiently transfected with PSMD10 or PSMD10 and ATG7. 24 hr later, the cells were infected with EPEC or EPEC ΔNleE for 4 hr. Shown are immunoblots of Flag IP and total cell lysates (Input).
-
Figure 6—source data 1
Numerical data for Figure 6C.
- https://cdn.elifesciences.org/articles/69047/elife-69047-fig6-data1-v2.xls
-
Figure 6—source data 2
Original western blot files for Figure 6.
- https://cdn.elifesciences.org/articles/69047/elife-69047-fig6-data2-v2.zip
Figure 7 with 3 supplements

Stabilized PSMD10 homodimer plays vital roles in enhancement of autophagy.
(A) The N-terminus of PSMD10 is indispensable for interacting with ATG7 and ATG10. Shown are immunoblots of anti-Flag immunoprecipitates (Flag IP) and total cell lysates (Input). (B) Deletion of the PSMD10 N-terminus does not affect its interaction with ATG12. (C) The PSMD10 C4S mutant failed to enhance LPS and starve-induced autophagy in PSMD10 KO cells. Scale bars, 10 μm. (D) ATG7 and LC3 were not colocalized in PSMD10 KO cells expressing the PSMD10 C4S mutant. Representative images are shown. Scale bars, 10 μm. (E, F) Stabilized PSMD10 C4S homodimers restore its interaction with ATG7 in living cells. Shown are immunoblots of anti-Flag immunoprecipitates (Flag IP) and total cell lysates (Input). PSMD10 C4S homodimers stabilized by chemical crosslinking (E) and disulfide bonds (F). (G) The stabilized PSMD10 C4S homodimer functions in enhancing autophagy in PSMD10 KO cells. Scale bars, 10 μm. (H) NleE attenuates host autophagy in a PSMD10 homodimer-dependent manner. The PSMD10 C11S mutant, but not the PSMD10 C4S mutant, rescued the NleE functions in regulating host autophagy in PSMD10 KO cells. Scale bars, 10 μm.
-
Figure 7—source data 1
Original western blot files for Figure 7.
- https://cdn.elifesciences.org/articles/69047/elife-69047-fig7-data1-v2.zip
Figure 7—figure supplement 1
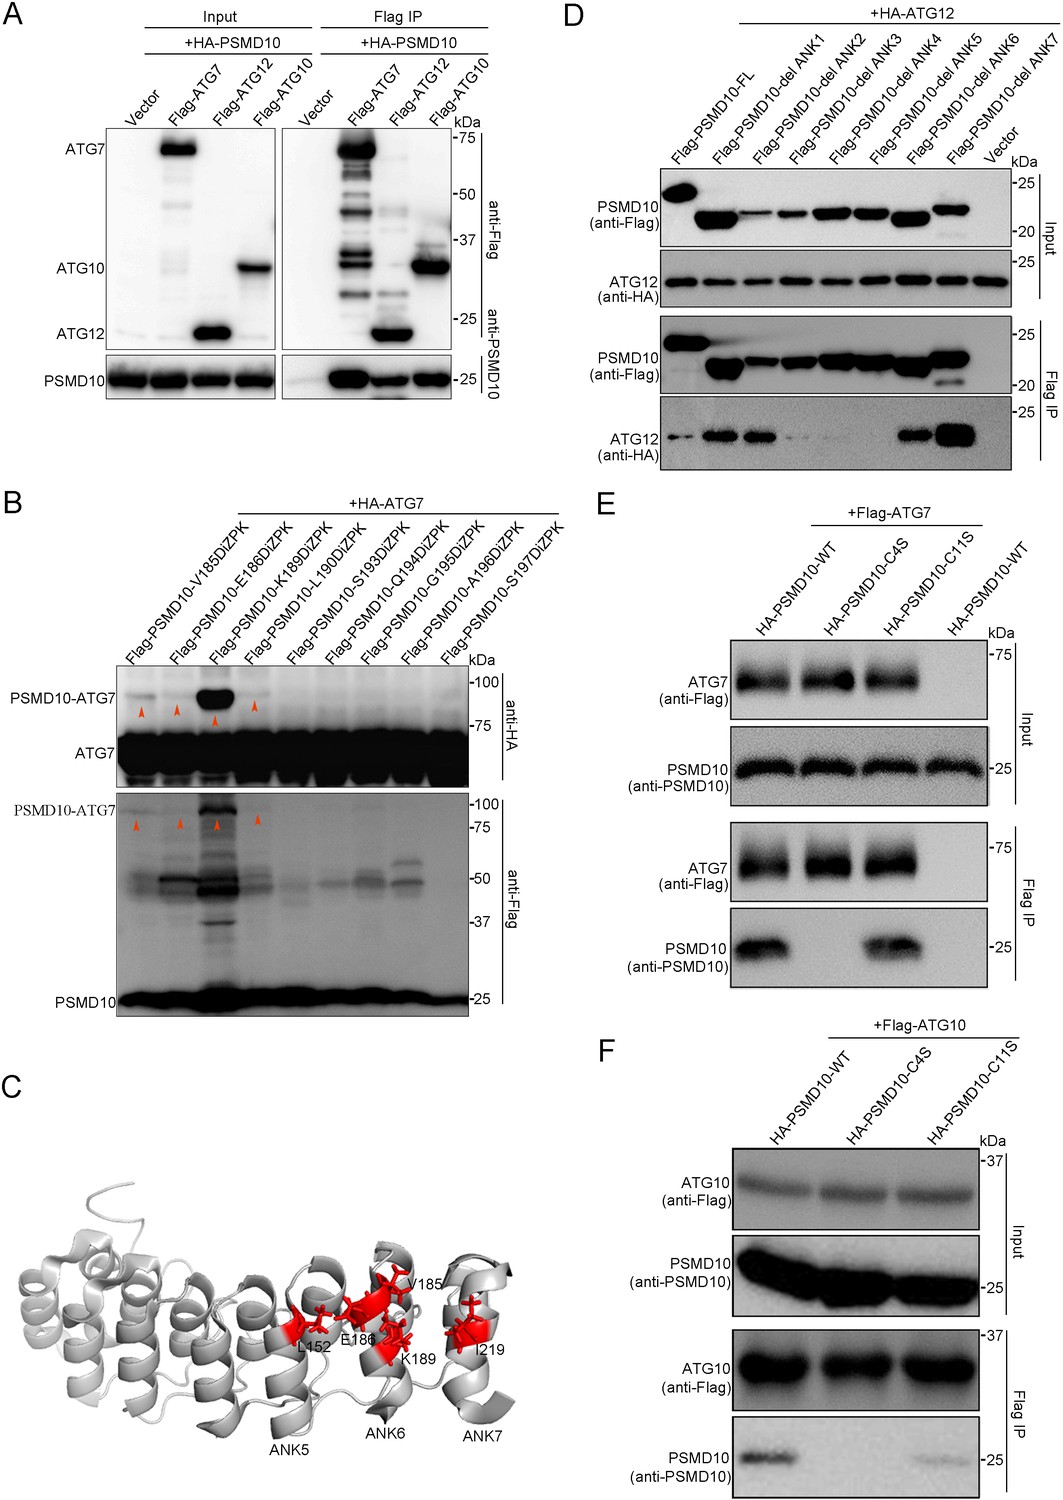
Stabilized PSMD10 homodimer is indispensable for interaction with ATG7 and ATG10.
(A) PSMD10 interacts with ATG10 and ATG12 in living cells. Shown are immunoblots of anti-Flag immunoprecipitates (Flag IP) and total cell lysates (Input). (B, C) Photocrosslinking experiments map of the PSMD10 interaction surface with ATG7. Residues X replaced by DiZPK are indicated in the upper row. (D) Three to five ankyrin repeats of PSMD10 are indispensable for interacting with ATG12. Shown are immunoblots of anti-Flag immunoprecipitates (Flag IP) and total cell lysates (Input). (E, F) The PSMD10 C4S mutation destroyed its interaction with ATG7 (E) and ATG10 (F).
-
Figure 7—figure supplement 1—source data 1
Original western blot files for Figure 7—figure supplement 1.
- https://cdn.elifesciences.org/articles/69047/elife-69047-fig7-figsupp1-data1-v2.zip
Figure 7—figure supplement 2
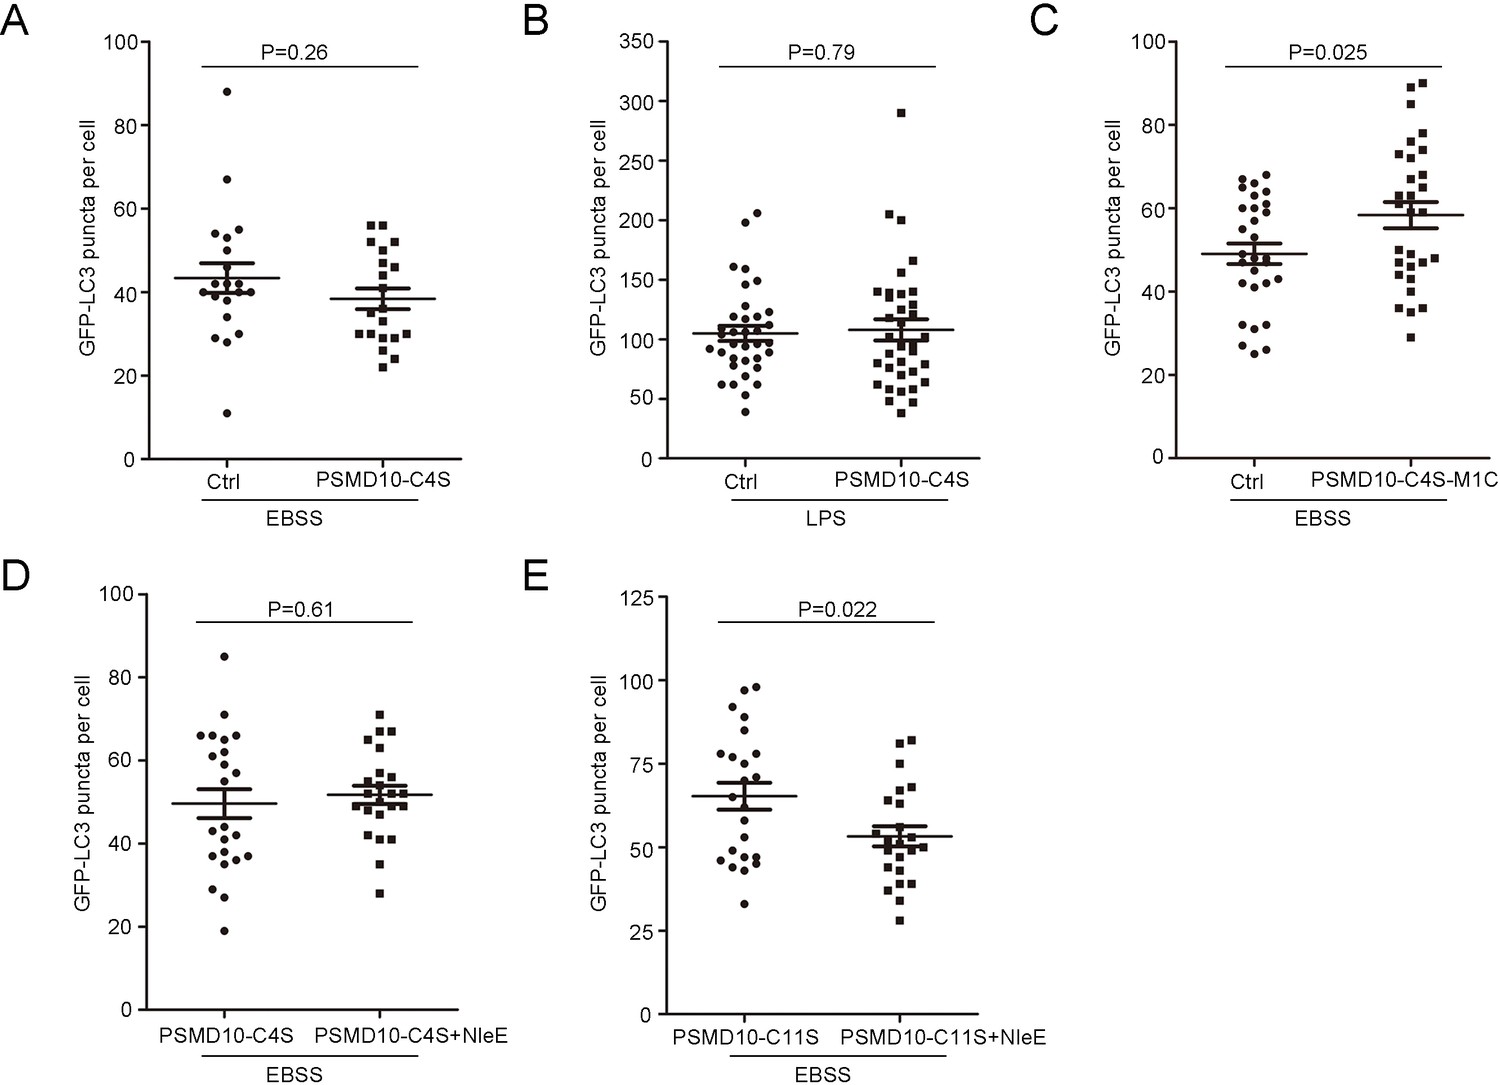
The stabilized PSMD10 homodimer plays vital roles in enhancement of autophagy.
(A, B) The PSMD10 C4S mutant was unable to enhance autophagy in PSMD10 KO HeLa cells. Autophagy was induced by EBSS (A) or 10 µg/ml LPS (B). LC3 puncta per cell were quantified. (A) N = 20 and (B) N = 35. (C) The stabilized PSMD10 C4S homodimer enhances autophagy in PSMD10 KO HeLa cells. LC3 puncta per cell were quantified (N = 29). (D–E) NleE attenuates host autophagy in PSMD10 KO cells in a PSMD10 homodimer dependent manner. The PSMD10 C11S homodimer (E), but not the PSMD10 C4S mutant (E), rescued the NleE functions in regulating host autophagy in PSMD10 KO cells. LC3 puncta per cell were quantified (N = 23). All quantification was performed in cells from three independent experiments. All quantification data represent the mean ± SD of three independent experiments.
-
Figure 7—figure supplement 2—source data 1
Numerical data for Figure 7—figure supplement 2A.
- https://cdn.elifesciences.org/articles/69047/elife-69047-fig7-figsupp2-data1-v2.xls
-
Figure 7—figure supplement 2—source data 2
Numerical data for Figure 7—figure supplement 2B.
- https://cdn.elifesciences.org/articles/69047/elife-69047-fig7-figsupp2-data2-v2.xls
-
Figure 7—figure supplement 2—source data 3
Numerical data for Figure 7—figure supplement 2C.
- https://cdn.elifesciences.org/articles/69047/elife-69047-fig7-figsupp2-data3-v2.xls
-
Figure 7—figure supplement 2—source data 4
Numerical data for Figure 7—figure supplement 2D.
- https://cdn.elifesciences.org/articles/69047/elife-69047-fig7-figsupp2-data4-v2.xls
-
Figure 7—figure supplement 2—source data 5
Numerical data for Figure 7—figure supplement 2E.
- https://cdn.elifesciences.org/articles/69047/elife-69047-fig7-figsupp2-data5-v2.xls
Figure 7—figure supplement 3
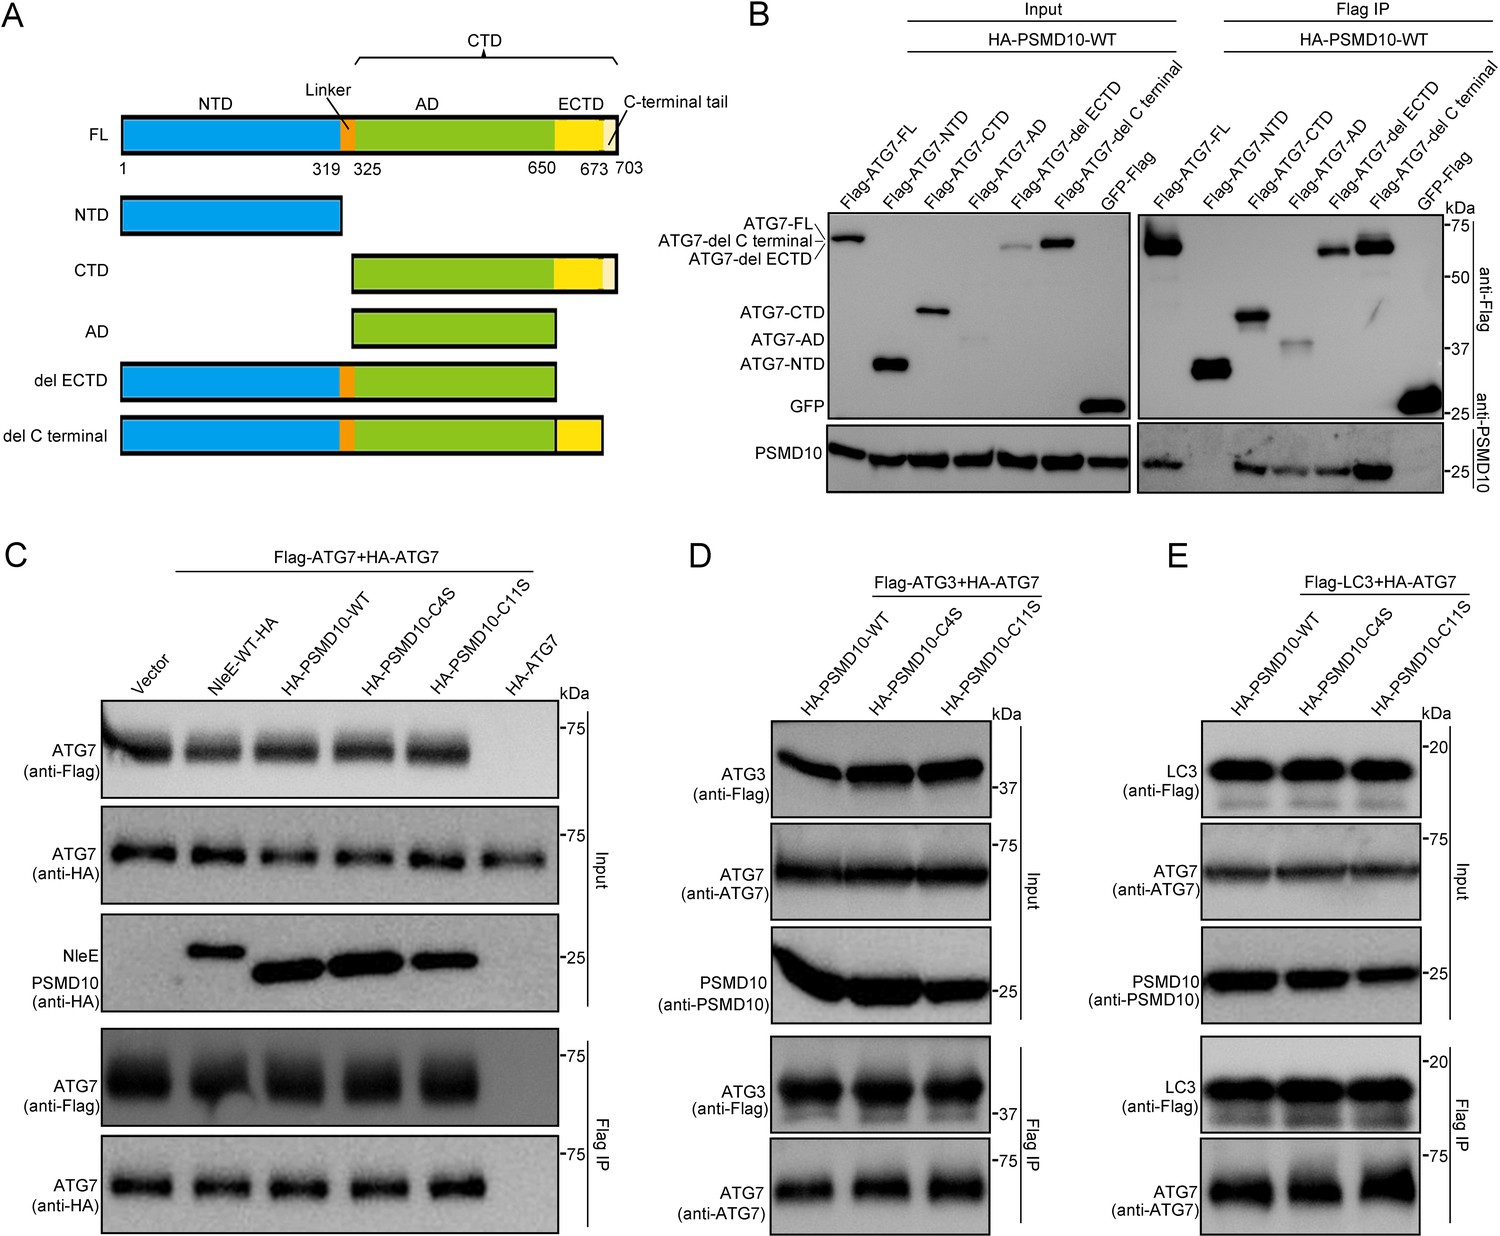
PSMD10 homodimer is indispensable for ATG7 dimerization and its interaction with ATG3 and LC3.
(A, B) PSMD10 binds with AD of ATG7 in living cells. Shown are immunoblots of Flag IP and total cell lysates (Input). (C) PSMD10 dimerization and NleE did not affect the dimerization of ATG7 in living cells. PSMD10 KO cells were transiently transfected with plasmids indicated in the upper rows. Shown are immunoblots of Flag IP and total cell lysates (Input). (D, E) ATG7 interaction with LC3 and ATG3 was not affected by the C4S mutation. PSMD10 KO cells were transiently transfected with Flag-ATG3(D)/LC3(E), HA-ATG7, and PSMD10 WT/C4S/C11S. Shown are immunoblots of Flag IP and total cell lysates (Input).
-
Figure 7—figure supplement 3—source data 1
Original western blot files for Figure 7—figure supplement 3.
- https://cdn.elifesciences.org/articles/69047/elife-69047-fig7-figsupp3-data1-v2.zip
Author response image 1
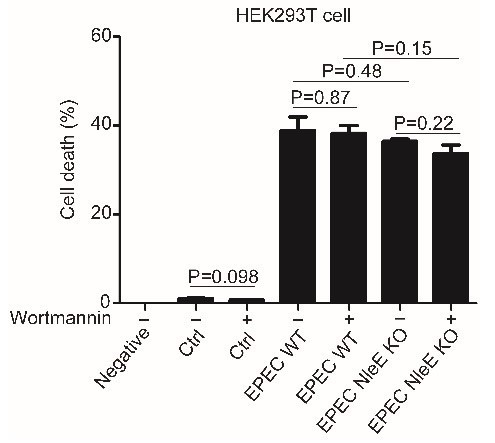
Cell death was not affected by NleE.
Author response image 2
(A) Expression pattern of PSMD28 C4S mutant.
(B) K219 mutation does not affect NleE interaction with PSMD10.
Author response image 3
(A) Expression level of NleE mutants in EPEC.
(B) Expression level of NleE R107A mutant in Hela cells. (C) NleE R107A mutant fails to suppress host autophagy during infection. (D) Overexpression of NleE mutant fails to suppress autophagy in HeLa cells.
Author response image 4
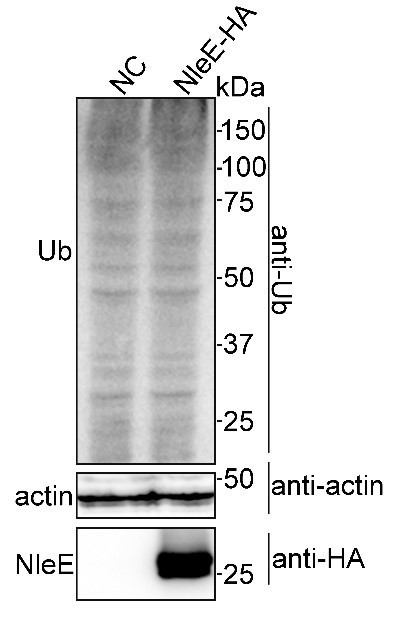
Ubiquitination level was not affected by NleE.
Tables
Key resources table
| Reagent type (species) or resource | Designation | Source or reference | Identifiers | Additional information |
|---|---|---|---|---|
| Gene (Homo sapiens) | ATG7 | National Center for Biotechnology Information | Gene ID: 10533 | |
| Gene (Homo sapiens) | PSMD10 | National Center for Biotechnology Information | Gene ID: 5716 | |
| Gene (Homo sapiens) | ATG3 | National Center for Biotechnology Information | Gene ID: 64422 | |
| Gene (Homo sapiens) | LC3B | National Center for Biotechnology Information | Gene ID: 81631 | |
| Gene (Homo sapiens) | ATG10 | National Center for Biotechnology Information | Gene ID: 83734 | |
| Gene (Homo sapiens) | ATG12 | National Center for Biotechnology Information | Gene ID: 9140 | |
| Gene (Homo sapiens) | Rpt3 | National Center for Biotechnology Information | Gene ID: 5704 | |
| Gene (Homo sapiens) | TAB2 | National Center for Biotechnology Information | Gene ID: 23118 | |
| Gene (Homo sapiens) | HSF1 | National Center for Biotechnology Information | Gene ID: 3297 | |
| Gene (Escherichia coli) | NleE | National Center for Biotechnology Information | Gene ID: NC_011601.1 | |
| Strain, strain background (Escherichia coli) | EPEC E2348/69 | National Institute of Biological Sciences | ||
| Strain, strain background (Escherichia coli) | DH5α | Tsingke Biotechnology | Catalog # TSV-A07 | Chemically Competent Cell |
| Strain, strain background (Escherichia coli) | BL21 | Tsingke Biotechnology | Catalog # TSV-A09 | Chemically Competent Cell |
| Cell line (Homo sapiens) | HeLa | National Collection of Authenticated Cell Cultures | Catalog # TCHu187 | |
| Cell line (Homo sapiens) | THP-1 | National Collection of Authenticated Cell Cultures | Catalog # TCHu57 | |
| Cell line (Homo sapiens) | HEK293T | National Collection of Authenticated Cell Cultures | Catalog # GNHu17 | |
| Antibody | DYKDDDDK-Tag (3B9) Mouse monoclonal antibody | Abmart | RRID:AB_2713960; Catalog # M20008 | Western blot (1:2000); Immunofluorescence (1:500) |
| Antibody | LC3A/B (D3U4C) XP Rabbit monoclonal antibody | Cell Signaling Technology | RRID:AB_2617131; Catalog # 12741S | Western blot (1:2000); Immunofluorescence (1:500) |
| Antibody | ACTB Rabbit monoclonal antibody | ABclonal | RRID:AB_2768234; Catalog # AC026 | Western blot (1:5000) |
| Antibody | V5 tag Rabbit monoclonal antibody | Abmart | RRID:AB_2864358; Catalog # T40006 | Western blot (1:2000); Immunofluorescence (1:500) |
| Antibody | HA-Tag(26D11) Mouse monoclonal antibody | Abmart | RRID:AB_2864345; Catalog # M20003 | Western blot (1:2000); Immunofluorescence (1:500) |
| Antibody | Anti-HA tag Rabbit monoclonal antibody | Abcam | RRID:AB_2864361; Catalog # ab236632 | Western blot (1:2000); Immunofluorescence (1:500) |
| Antibody | HRP Anti-DDDDK tag Goat polyclonal antibody | Abcam | RRID:AB_299061; Catalog # ab1238 | Western blot (1:2000) |
| Antibody | Goat anti-rabbit IgG (H+L), HRP conjugate polyclonal antibody | Proteintech | RRID:AB_2722564; Catalog # SA00001-2 | Western blot (1:2000) |
| Antibody | Anti-ATG7 Rabbit monoclonal antibody | Abcam | RRID:AB_867756; Catalog # ab52472 | Western blot (1:2000); Immunofluorescence (1:500) |
| Antibody | Anti-Gankyrin Rabbit monoclonal antibody | Abcam | RRID:AB_2864359; Catalog # ab188315 | Western blot (1:2000) |
| Antibody | Ub (P4D1) Mouse monoclonal antibody | Santa Cruz Biotechnology | RRID:AB_628423; Catalog # sc-8017 | Western blot (1:2000) |
| Antibody | gankyrin (A-8) Mouse monoclonal antibody | Santa Cruz Biotechnology | RRID:AB_2172940; Catalog # sc-166376 | Western blot (1:2000) |
| Antibody | GST-Tag(12G8) Mouse monoclonal antibody | Abmart | RRID:AB_2864360; Catalog # M20007 | Western blot (1:2000) |
| Recombinant DNA reagent | pCMV and derivatives (plasmids) | This paper | Described in Materials and methods section | |
| Recombinant DNA reagent | pcDNA3.1(+) and derivatives (plasmids) | This paper | Described in Materials and methods section | |
| Recombinant DNA reagent | pLKO.1 and derivatives (plasmids) | This paper | Described in Materials and methods section | |
| Recombinant DNA reagent | px330 and derivatives (plasmids) | This paper | Described in Materials and methods section | |
| Recombinant DNA reagent | pCVD442 and derivatives (plasmids) | This paper | Described in Materials and methods section | |
| Recombinant DNA reagent | pET-28a(+) and derivatives (plasmids) | This paper | Described in Materials and methods section | |
| Recombinant DNA reagent | pGEX-6P-1 and derivatives (plasmids) | This paper | Described in Materials and methods section | |
| Commercial assay or kit | Cell Total RNA Isolation Kit | FOREGENE | Catalog # RE-03113 | |
| Commercial assay or kit | HiScript II Q RT SuperMix (+gDNA wiper) | Vazyme | Catalog # R223-01 | |
| Commercial assay or kit | AceQ Universal SYBR qPCR Master Mix | Vazyme | Catalog # Q511-02 | |
| Commercial assay or kit | Human IL-6 ELISA Kit | ABclonal | Catalog # RK00004 | |
| Commercial assay or kit | Apoptosis and Necrosis Assay Kit | Beyotime Biotechnology | Catalog # C1056 | |
| Chemical compound, drug | LPS | Sigma-Aldrich | Catalog # L3024 | 10 ug/ml for HeLa cells |
| Chemical compound, drug | Phorbol 12-myristate 13-acetate(PMA) | MedChemExpress | Catalog # HY-18739 | 200 ng/ml for THP-1 cells |
| Chemical compound, drug | Chloroquine(CQ) | MedChemExpress | Catalog # HY-17589 | 50 uM for HeLa cells |
| Chemical compound, drug | Azi | SustGreen Tech | CAS # 33173-53-4 | 1 mM for HEK293T cells |
| Chemical compound, drug | DiZPK | SustGreen Tech | Catalog # HBC-066 | 1 mM for HEK293T cells |
| Chemical compound, drug | BetY | SustGreen Tech | CAS # 481052-60-2 | 0.5 mM for HEK293T cells |
| Chemical compound, drug | MG132 | MedChemExpress | Catalog # HY-13259 | 10 uM for HEK293T cells |
| Chemical compound, drug | SAM | Sangon Biotech | Catalog # A506555-0005 | 0.8 mM for in vitro methylation assay |
| Chemical compound, drug | DSS | Sangon Biotech | Catalog # C100015-0100 | 1 mM for extracellular protein crosslinking |
| Chemical compound, drug | DSP | Sangon Biotech | Catalog # C110213-0100 | 1 mM for extracellular protein crosslinking |
| Chemical compound, drug | Wortmannin | selleck | Catalog # S2758 | 1 uM for THP-1 cell |
| Software, algorithm | GraphPad Prism 5 | GraphPad Prism | RRID:SCR_002798; http://www.graphpad.com/ | |
| Software, algorithm | ChemDraw | ChemDraw | RRID:SCR_016768; http://www.perkinelmer.co.uk/category/chemdraw | |
| Software, algorithm | Origin 9 | Originlab | https://www.originlab.com/ | |
| Software, algorithm | ImageJ | ImageJ | RRID:SCR_003070; https://imagej.net/ | |
| Software, algorithm | PyMOL | PyMOL | RRID:SCR_000305; http://www.pymol.org/ | |
| Other | Anti-DYKDDDDK-Tag Mouse Antibody (Agarose Conjugated) | Abmart | Catalog # M20018L | |
| Other | Mounting Medium With DAPI Aqueous, Fluoroshield | Abcam | Catalog # ab104139 | |
| Other | Fluoresbrite BB Carboxylate Microspheres1.75 µm | Polysciences | Catalog # 17686–5 |
Additional files
-
Supplementary file 1
List of primers used in this paper.
- https://cdn.elifesciences.org/articles/69047/elife-69047-supp1-v2.doc
-
Transparent reporting form
- https://cdn.elifesciences.org/articles/69047/elife-69047-transrepform-v2.docx
Download links
A two-part list of links to download the article, or parts of the article, in various formats.
Downloads (link to download the article as PDF)
Open citations (links to open the citations from this article in various online reference manager services)
Cite this article (links to download the citations from this article in formats compatible with various reference manager tools)
Genetically incorporated crosslinkers reveal NleE attenuates host autophagy dependent on PSMD10
eLife 10:e69047.
https://doi.org/10.7554/eLife.69047


