Maternal diet-induced obesity during pregnancy alters lipid supply to mouse E18.5 fetuses and changes the cardiac tissue lipidome in a sex-dependent manner
- Wellcome-MRC Institute of Metabolic Science and Medical Research Council Metabolic Diseases Unit, University of Cambridge, Addenbrooke’s Hospital, United Kingdom
- Core Metabolomics and Lipidomics Laboratory, Wellcome-MRC Institute of Metabolic Science, University of Cambridge, Addenbrooke’s Treatment Centre, United Kingdom
- Cancer Research UK Beatson Institute, United Kingdom
- Institute of Cancer Sciences, University of Glasgow, United Kingdom
Figures
Figure 1 with 2 supplements

Fetal characteristics at gestational day 18.5.
(A) Body weight of male and female fetuses from healthy control (CTL) and obese (OB) mouse dams at gestational day 18.5. Male CTL n = 6, male OB n = 6, female CTL n = 7, female OB n = 6. (B–C) Heart weight and heart weight/litter average body weight ratio of male and female fetuses from CTL and OB dams at gestational day 18.5. Male CTL n = 10, male OB n = 10, female CTL n = 12, female OB n = 12. (D) Histological sections stained with eosin of male and female fetuses from CTL and OB dams at gestational day 18.5 used in cardiac stereology (see also Figure 1—figure supplement 1). Scale bar indicates 500 µm. (E–H) Left and right ventricular wall volume and ventricular wall volume/body weight ratio of male and female fetuses from healthy control (CTL) and obese (OB) mouse dams at gestational day 18.5. Male CTL n = 4, male OB n = 6, female CTL n = 4, female OB n = 5. (I) Boxplot showing median and quartiles of cardiomyocyte area distribution in male and female fetuses from CTL and OB dams at gestational day 18.5. Under the boxplot a beeswarm plot shows individual area of each cardiomyocyte analysed. Male CTL n = 6, male OB n = 7, female CTL n = 6, female OB n = 6 (see Figure 1—figure supplement 2 for a representative image of stained cardiomyocytes). (J) Nuclear PCNA-positive cells percentage in hearts of male and female fetuses from CTL and OB dams at gestational day 18.5. Male CTL n = 6, male OB n = 5, female CTL n = 3, female OB n = 5. In panels A-H and J, p-values were calculated by Student t-test. In panel I, p-values were calculated using linear mixed-effects model followed by Tukey’s post-hoc test.
-
Figure 1—source data 1
Sex-specific fetal body weight at E18.5 (Figure 1A).
- https://cdn.elifesciences.org/articles/69078/elife-69078-fig1-data1-v3.csv
-
Figure 1—source data 2
Fetal heart weight at E18.5 (Figure 1B).
- https://cdn.elifesciences.org/articles/69078/elife-69078-fig1-data2-v3.csv
-
Figure 1—source data 3
Fetal heart weight at E18.5 relative to the average litter weight (Figure 1C).
- https://cdn.elifesciences.org/articles/69078/elife-69078-fig1-data3-v3.csv
-
Figure 1—source data 4
Left ventricle wall volume (Figure 1E).
- https://cdn.elifesciences.org/articles/69078/elife-69078-fig1-data4-v3.csv
-
Figure 1—source data 5
Right ventricle wall volume (Figure 1F).
- https://cdn.elifesciences.org/articles/69078/elife-69078-fig1-data5-v3.csv
-
Figure 1—source data 6
Relative left ventricle wall volume (Figure 1G).
- https://cdn.elifesciences.org/articles/69078/elife-69078-fig1-data6-v3.csv
-
Figure 1—source data 7
Relative right ventricle wall volume (Figure 1H).
- https://cdn.elifesciences.org/articles/69078/elife-69078-fig1-data7-v3.csv
-
Figure 1—source data 8
Fetal cardiomyocyte area (Figure 1I).
- https://cdn.elifesciences.org/articles/69078/elife-69078-fig1-data8-v3.csv
-
Figure 1—source data 9
% Nuclear PCNA-positive cardiac cells (Figure 1J).
- https://cdn.elifesciences.org/articles/69078/elife-69078-fig1-data9-v3.csv
Figure 1—figure supplement 1
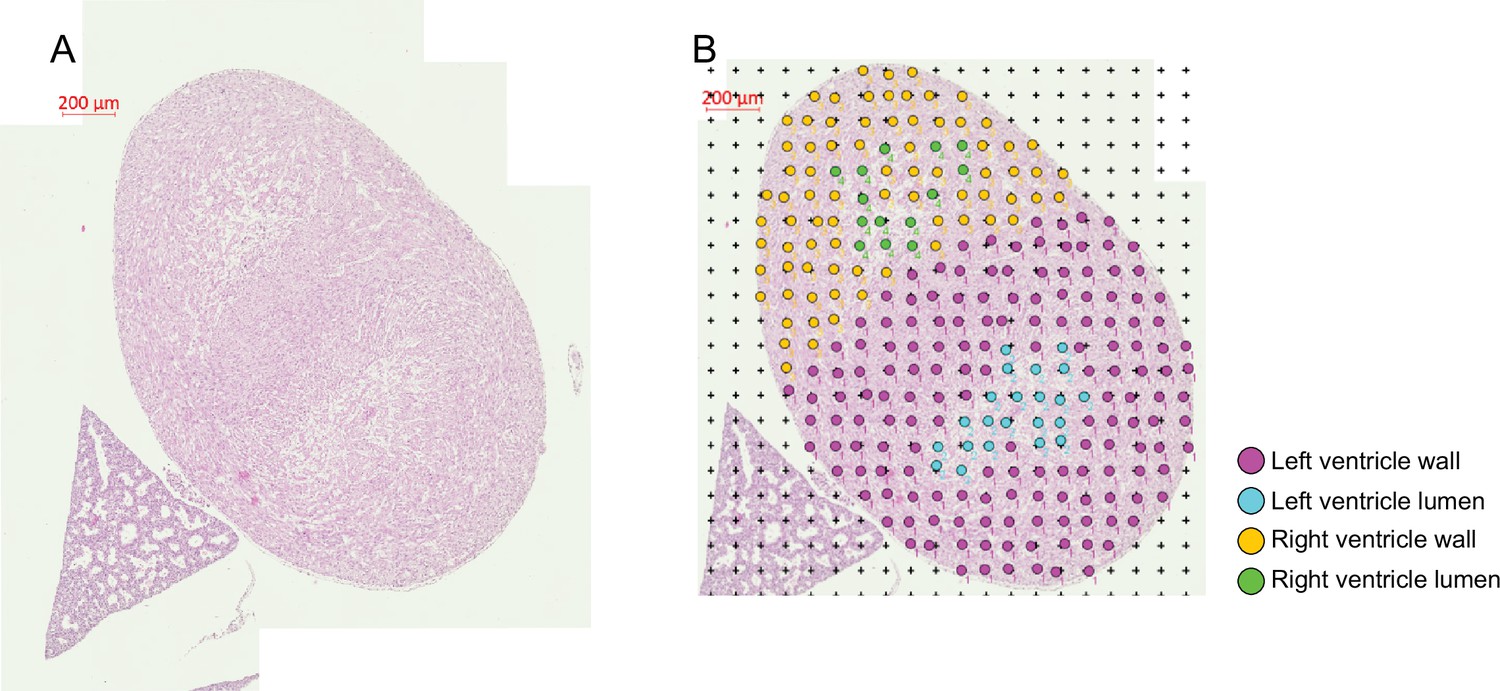
Stereological analysis of the gestational day 18.5 fetal heart.
(A–B) Representative images of fetal torso prior (A) and after (B) blinded identification of cardiac structures by a trained histologist.
Figure 1—figure supplement 2

Representative image of immunofluorescence identifying cardiomyocytes using a mAb anti-Cardiac Troponin I IgG followed by incubation with an Alexa Fluor 488-conjugated secondary IgG.
Figure 2 with 2 supplements
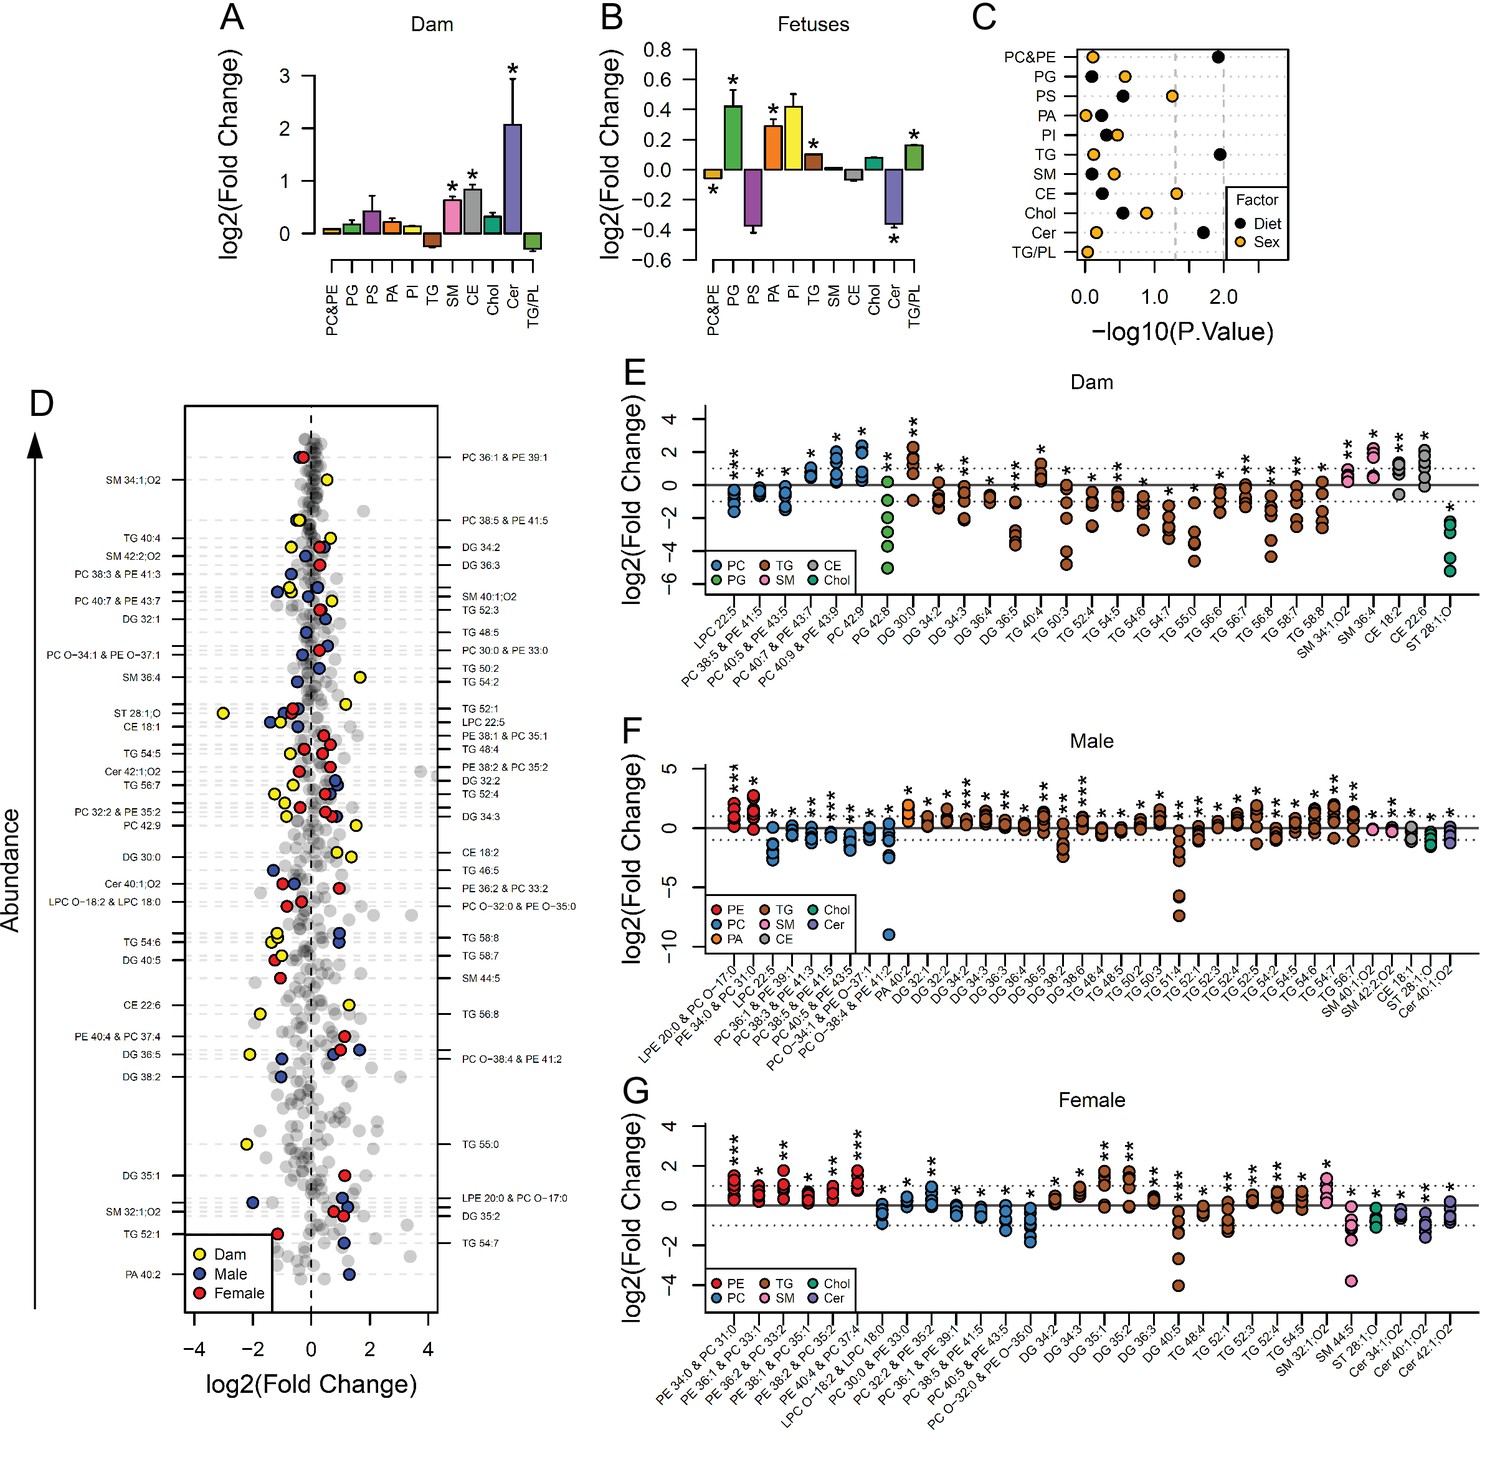
Maternal and fetal serum lipidome measured by direct infusion mass spectrometry.
(A–B) Relative changes in serum lipid classes abundance in obese dams (A) and in obese fetuses (B). Values are mean + SE. *p < 0.05 calculated by Student t-test or Mann-Whitney test. (C) Influence of maternal diet and sex on fetal serum lipid classes abundance as calculated by factorial ANOVA. (D) Regulation of maternal and fetal serum lipid species ranked according to their abundance. Coloured dots represent statistically regulated species as calculated by univariate Student t-test (p < 0.05) and PLS-DA VIP (vip score >1) in maternal or fetal OB serum compared to CTL. (E–G) Serum levels of regulated lipids from obese dams (E) and from male (F) and female (G) fetuses of obese dams at gestational day 18.5. Each dot represents a result from one obese fetus' serum relative to the average of results for individual lipids in the control group (straight line). Dam CTL n = 9, dam OB n = 6, male fetuses CTL n = 10, male fetuses OB n = 8, female fetuses CTL n = 10, female fetuses OB n = 7; * p < 0.05, ** p < 0.01, *** p < 0.001 calculated by Student t-test. In figures A-C: PE, phosphatidylethanolamines/odd chain phosphatidylcholines; PC, phosphatidylcholines/odd-chain phosphatidylethanolamines; PG, phosphatidylglycerols; PS, phosphatidylserines; PA, phosphatidic acids; PI, phosphatidylinositols; TG, monoglycerides, diglycerides and triglycerides; SM, sphingomyelins; CE, cholesteryl esters; Cer, ceramides; PL, phospholipids. In figures D-G, other isobaric lipids can contribute to these signals (Supplementary file 1). See also Figure 2—figure supplement 1 and Figure 2—figure supplement 2.
-
Figure 2—source data 1
Relative lipid classes abundance in maternal serum (Figure 2A).
- https://cdn.elifesciences.org/articles/69078/elife-69078-fig2-data1-v3.csv
-
Figure 2—source data 2
Relative lipid classes abundance in fetal serum (Figure 2B).
- https://cdn.elifesciences.org/articles/69078/elife-69078-fig2-data2-v3.csv
-
Figure 2—source data 3
Direct infusion high-resolution mass spectrometry of the serum (positive mode only) (Figure 2D–G).
Scaled raw data and statistical significance.
- https://cdn.elifesciences.org/articles/69078/elife-69078-fig2-data3-v3.csv
Figure 2—figure supplement 1
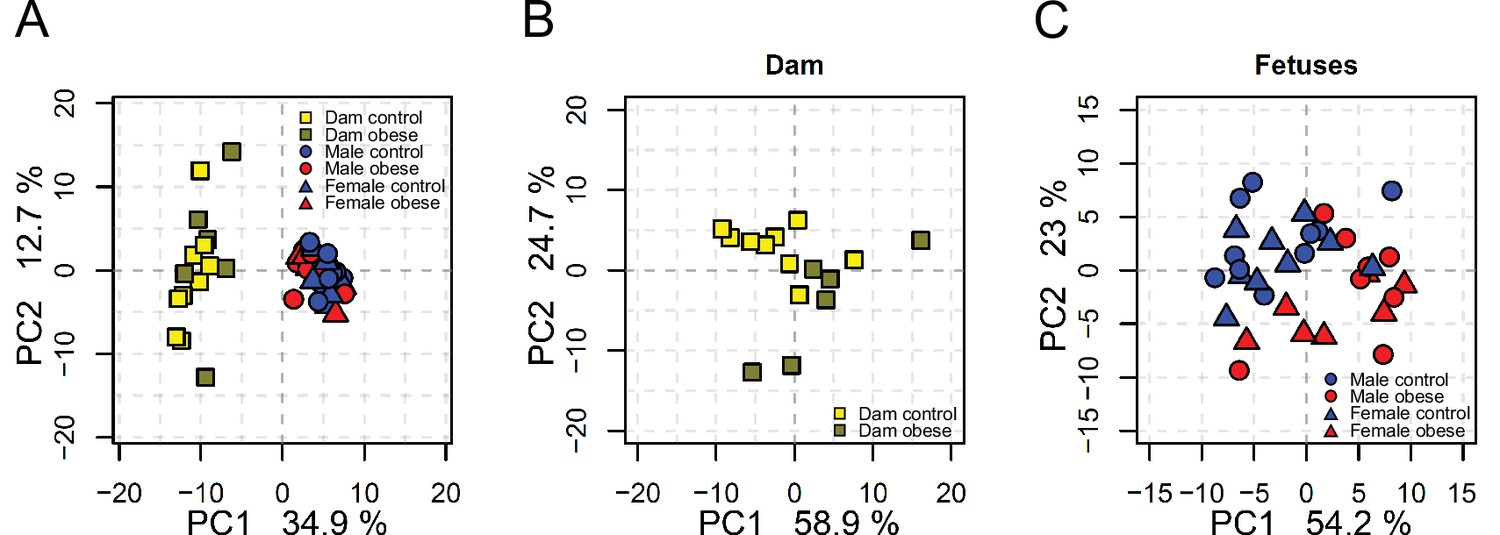
Multivariate analysis of the maternal and fetal serum lipid profiles.
(A) PCA plots showing the PC1 and PC2 scores for individual dam and fetal serum lipidomes at gestational day 18.5. (B–C) PCA plots showing the PC1 and PC2 scores for individual dam (B) or fetal (C) serum lipidomes.
Figure 2—figure supplement 2
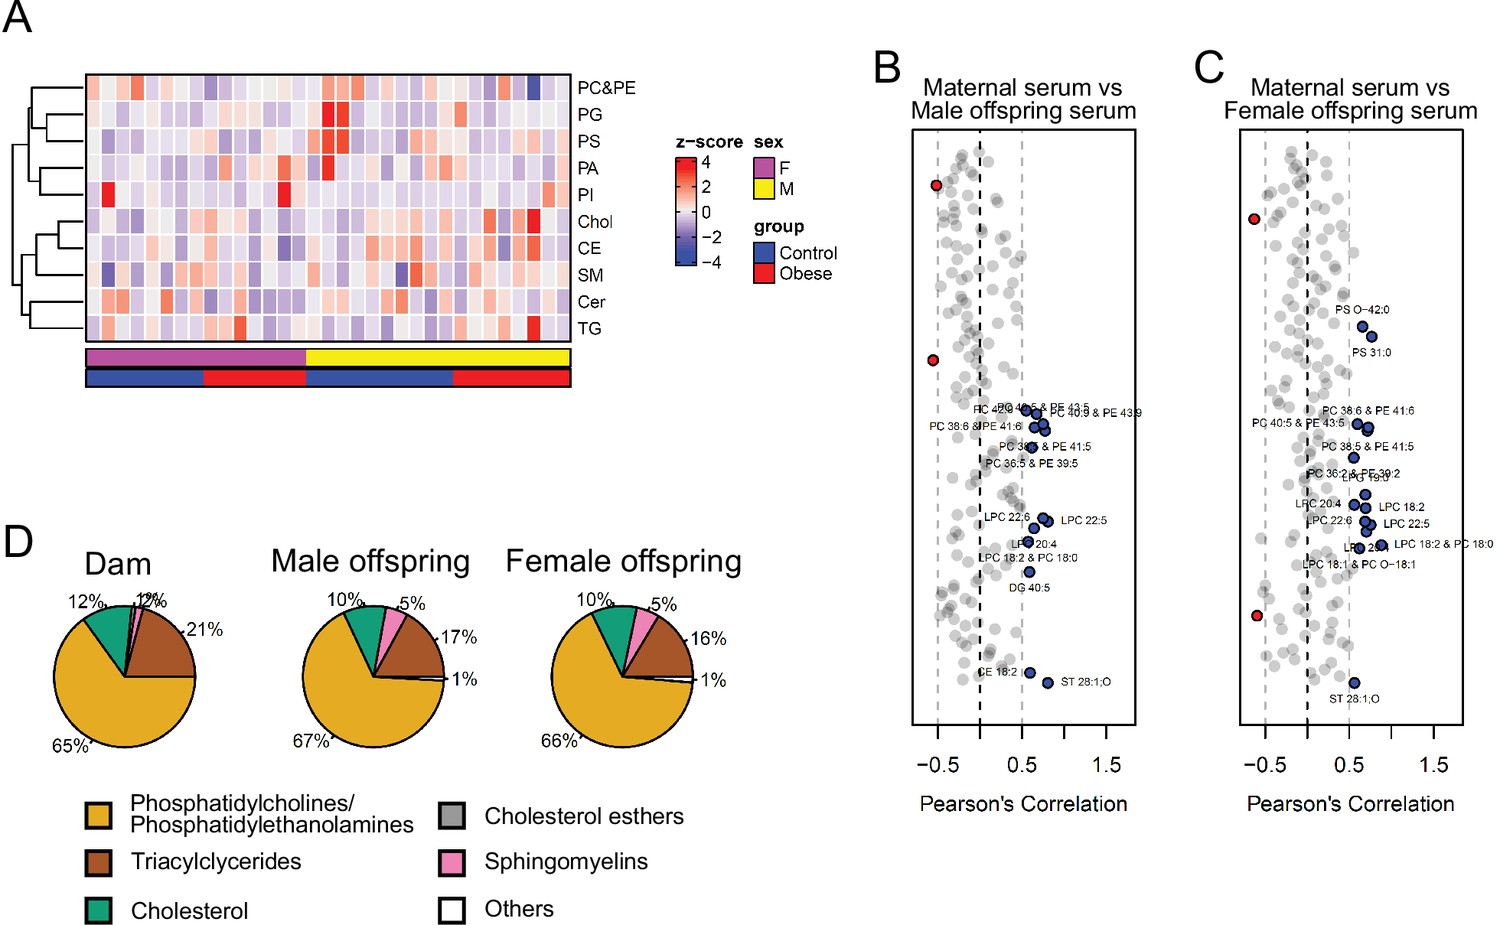
Serum levels of lipid groups.
(A) Heatmap showing lipid classes serum levels in male and female E18.5 fetuses. (B–C) Pearson’s correlation between individual lipid species in maternal serum and male (B) and female (C) fetal serum at gestational day 18.5. Blue dots represent positively correlated lipid species between maternal and fetal serum deemed statistically significant (p < 0.05). Red dots represent negatively correlated lipid species between maternal and fetal serum deemed statistically significant (p < 0.05). (D) Relative abundance of different lipid classes in maternal and fetal control serum.
Figure 3 with 2 supplements
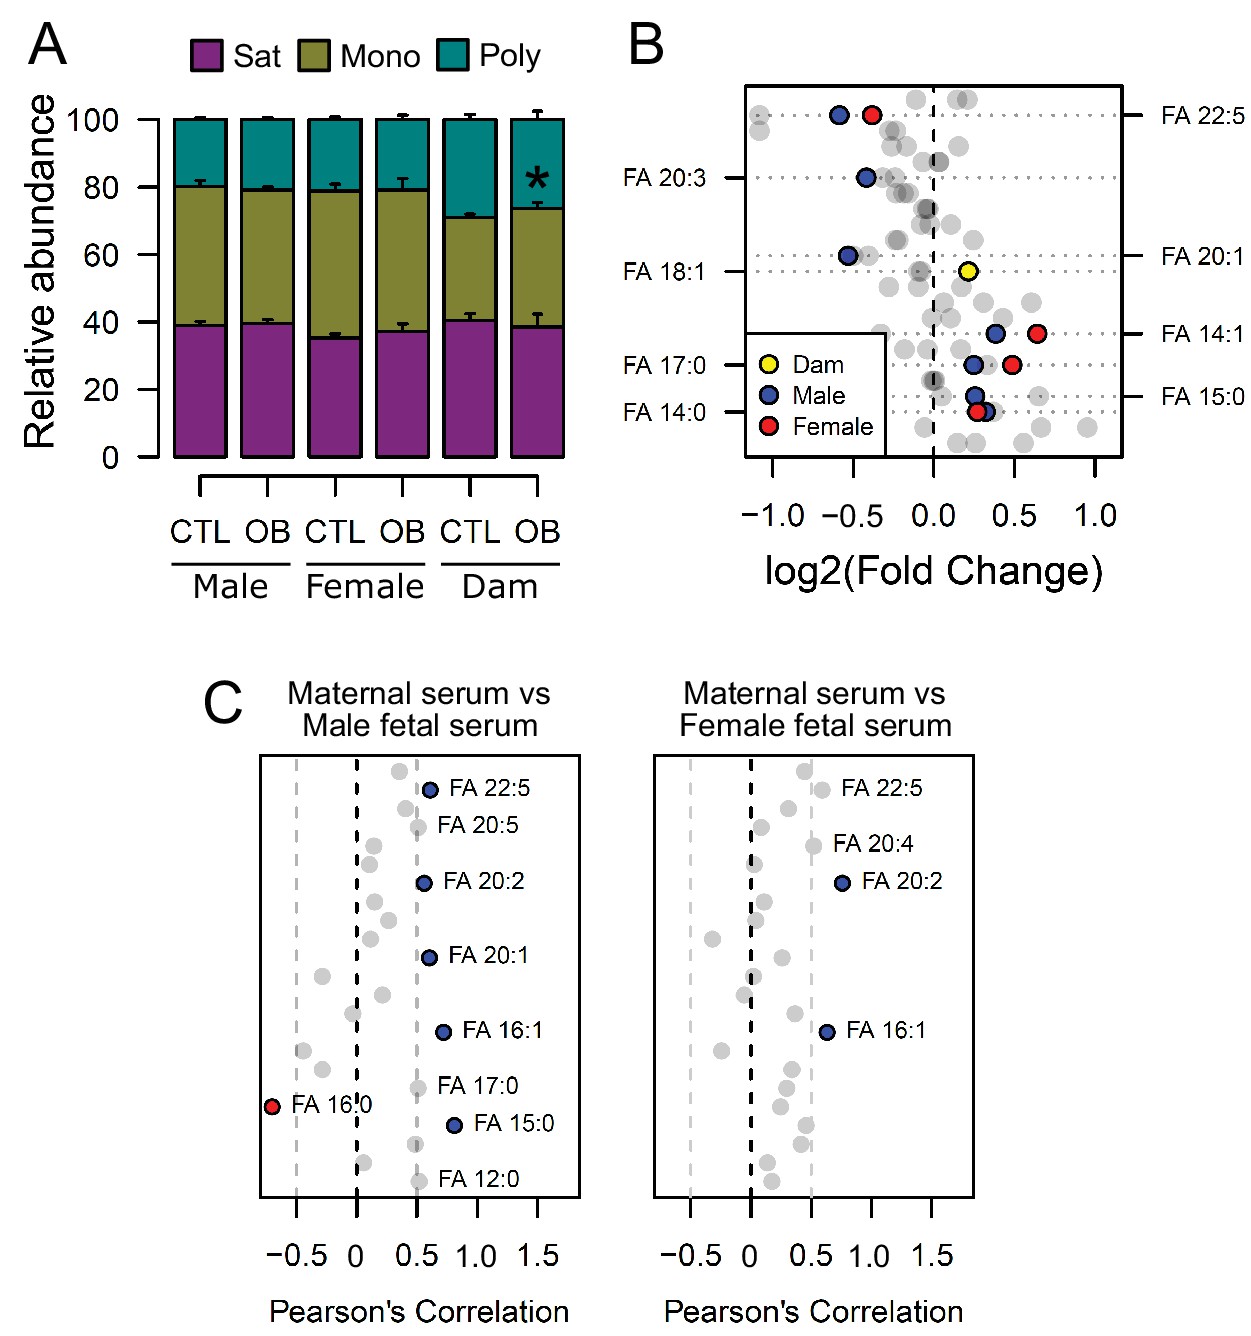
Fatty acid composition of serum phospholipids measured by direct infusion mass spectrometry using in-source CID fragmentation.
(A) Grouped saturated, monounsaturated and polyunsaturated fatty acids content in maternal, male and female fetal serum at gestational day 18.5. Values are mean + SE. (B) Regulation of maternal and fetal serum fatty acids. Coloured dots represent statistically regulated fatty acids as calculated by univariate Student t-test or Mann-Whitney test (p < 0.05) in maternal or fetal OB serum compared to CTL. (C) Pearson’s correlation between maternal serum fatty acids and the same fatty acids detected in the fetal serum. Blue and red dots represent species with significant positive and negative association (p < 0.05). Dam CTL n = 8, dam OB n = 6, male fetuses CTL n = 10, male fetuses OB n = 8, female fetuses CTL n = 8, female fetuses OB n = 6. See also Figure 3—figure supplement 1 and Figure 3—figure supplement 2.
-
Figure 3—source data 1
Relative fatty acid classes abundance in maternal and fetal serum (Figure 3A).
- https://cdn.elifesciences.org/articles/69078/elife-69078-fig3-data1-v3.csv
-
Figure 3—source data 2
Fatty acids abundance obtained by direct infusion high-resolution mass spectrometry of the serum (negative mode) (Figure 3B).
Scaled raw data and statistical significance.
- https://cdn.elifesciences.org/articles/69078/elife-69078-fig3-data2-v3.csv
Figure 3—figure supplement 1
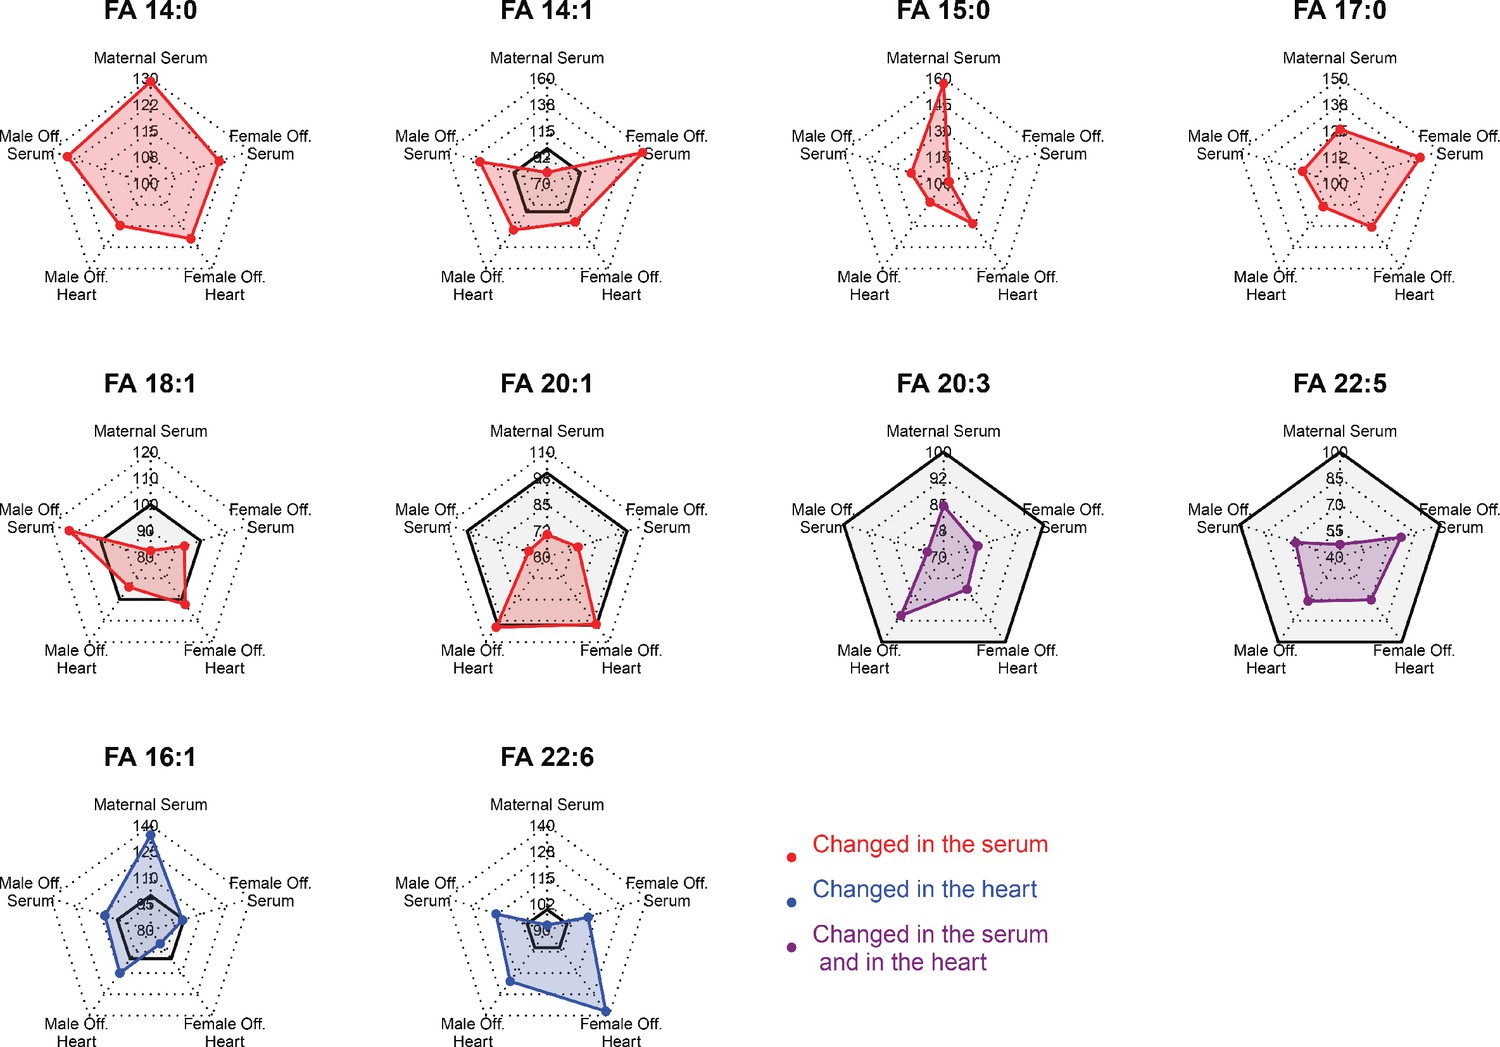
Radar plots showing regulation of fatty acids statistically changed in the serum or in the heart of fetuses from obese dams in different compartments.
Gray-shaded area indicates negative changes.
Figure 3—figure supplement 2
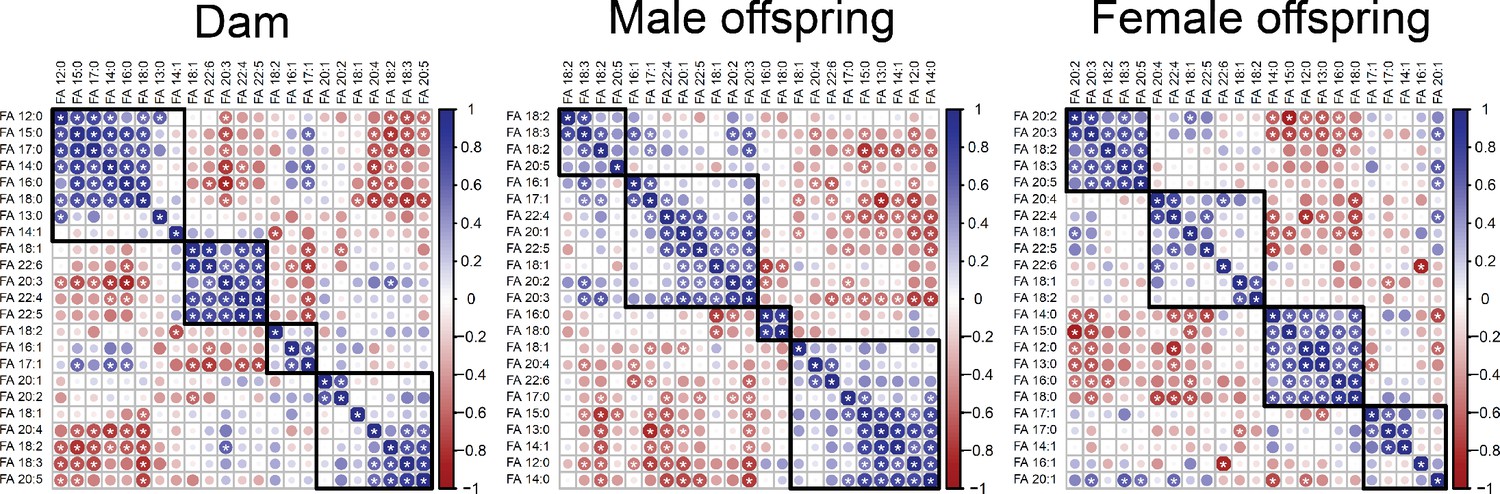
Correlation matrices showing Pearson’s correlation between cardiac fatty acids in dams and fetuses.
Fatty acids grouped following Euclidian clusterisation.
Figure 4 with 2 supplements
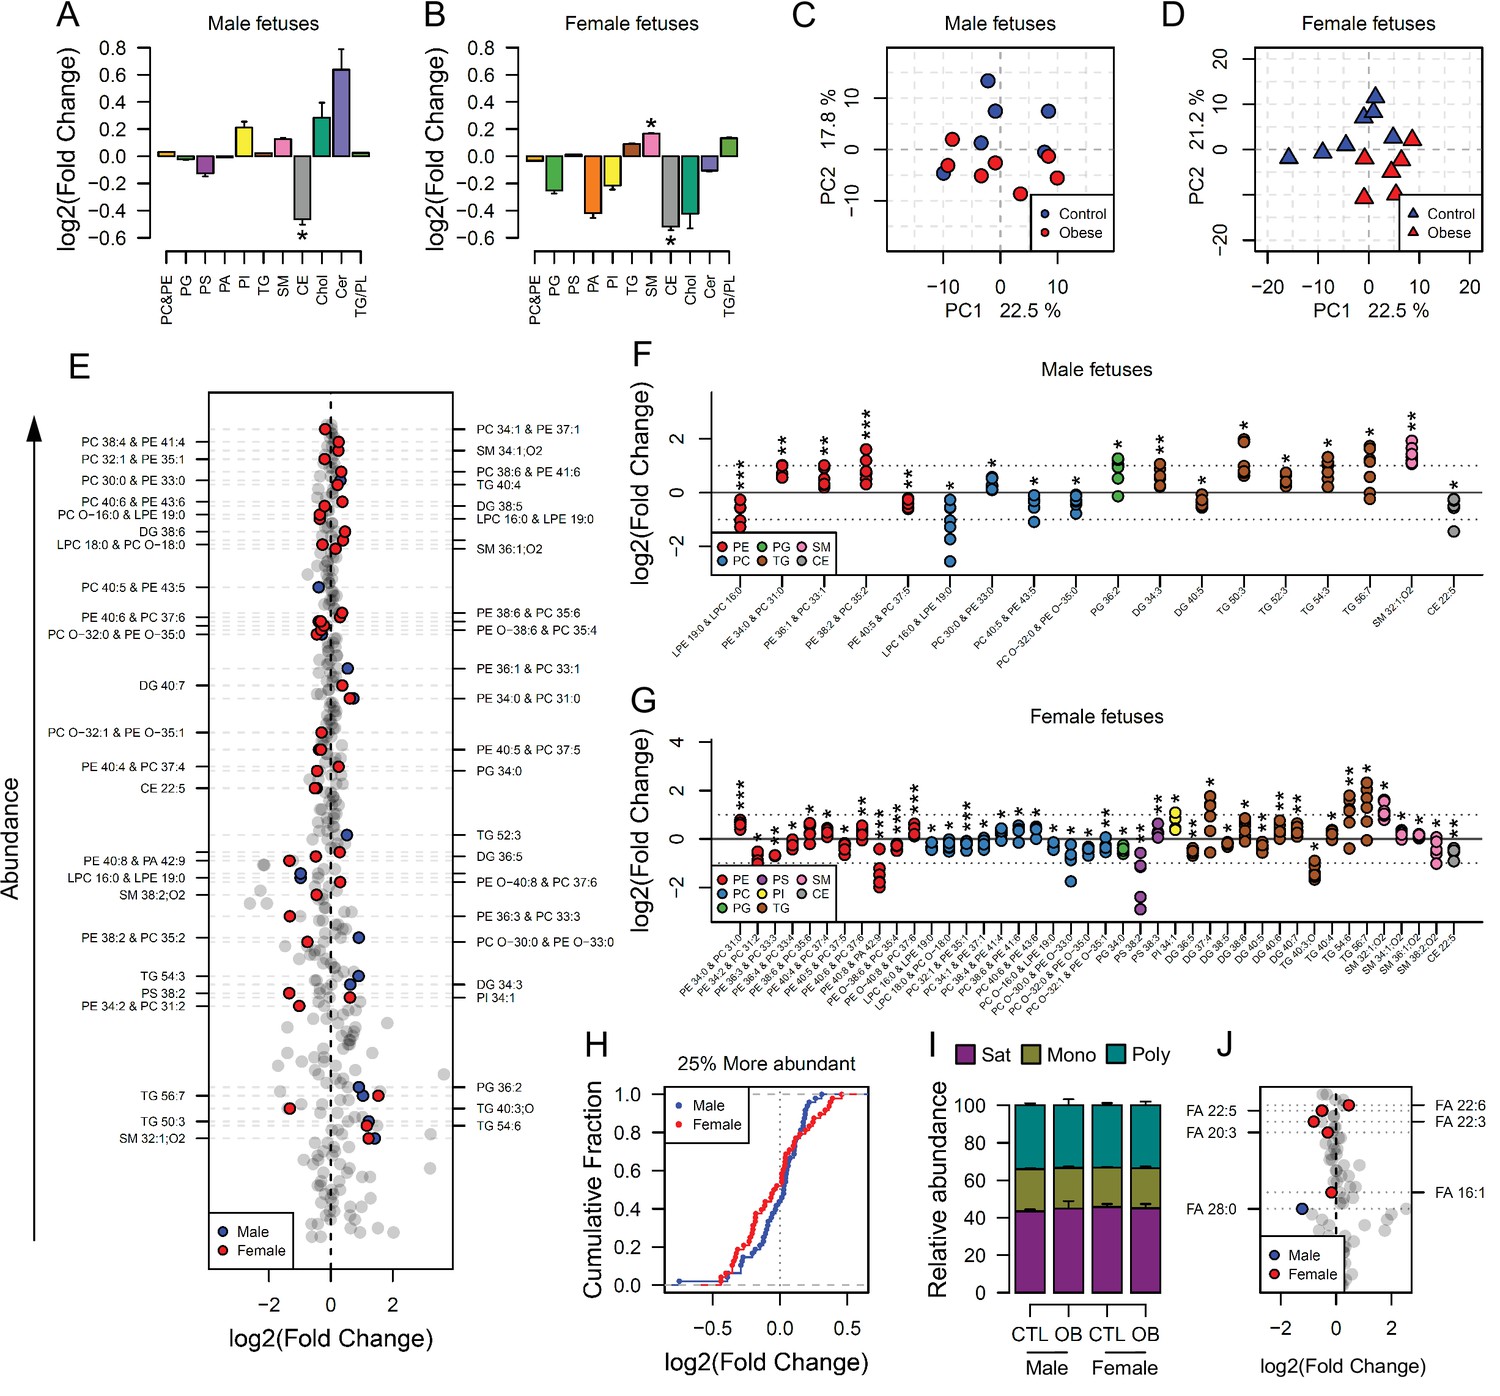
Maternal and fetal cardiac lipidome.
(A–B) Relative changes in cardiac lipid classes in male (A) and female (B) fetuses from obese dams. Values are mean + SE. *p < 0.05 calculated by Student t-test or Mann-Whitney test. (C–D) PCA plots showing the PC1 and PC2 scores for individual male (C) and female (D) cardiac lipidomes. (E) Regulation of fetal cardiac lipid species ranked according to their abundance. Coloured dots represent statistically regulated species as calculated by univariate Student t-test (p < 0.05) and PLS-DA VIP (vip score >1) in fetal OB hearts compared to CTL. (F–G) Cardiac levels of regulated lipids from male (F) and female (G) fetuses of obese dams at gestational day 18.5. Each dot represents a result from one obese heart, relative to the average of results for individual lipids in the control group (straight line). Male fetuses CTL n = 6, male fetuses OB n = 7, female fetuses CTL n = 7, female fetuses OB n = 6. * p < 0.05, ** p < 0.01, *** p < 0.001 calculated by Student t-test. (H) Cumulative frequency of cardiac lipid species according to the log2 of the fold change in abundance between male and female fetuses from obese and control dams. (I) Grouped saturated, monounsaturated and polyunsaturated fatty acids content in male and female fetal hearts at gestational day 18.5. (J) Regulation of maternal and fetal serum fatty acids. Coloured dots represent statistically regulated fatty acids as calculated by univariate Student t-test or Mann-Whitney test (p < 0.05) in fetal OB hearts compared to CTL. Male fetuses CTL n = 8, male fetuses OB n = 6, female fetuses CTL n = 7, female fetuses OB n = 7. In figures A-B: PE, phosphatidylethanolamines/odd chain phosphatidylcholines; PC, phosphatidylcholines/odd-chain phosphatidylethanolamines; PC, phosphatidylcholines; PG, phosphatidylglycerols; PS, phosphatidylserines; PA, phosphatidic acids; PI, phosphatidylinositols; TG, monoglycerides, diglycerides and triglycerides; SM, sphingomyelins; CE, cholesteryl esters; Cer, ceramides; PL, phospholipids. In figures E-G, other isobaric lipids can contribute to these signals (Supplementary file 2). See also Figure 4—figure supplement 1 and Figure 4—figure supplement 2.
-
Figure 4—source data 1
Relative lipid classes abundance in fetal heart (Figure 4A–B).
- https://cdn.elifesciences.org/articles/69078/elife-69078-fig4-data1-v3.csv
-
Figure 4—source data 2
Direct infusion high-resolution mass spectrometry of the heart (positive mode only) (Figure 4E–H).
Scaled raw data and statistical significance.
- https://cdn.elifesciences.org/articles/69078/elife-69078-fig4-data2-v3.csv
-
Figure 4—source data 3
Relative fatty acids classes abundance in fetal heart (Figure 4I).
- https://cdn.elifesciences.org/articles/69078/elife-69078-fig4-data3-v3.csv
-
Figure 4—source data 4
Fatty acids abundance obtained by direct infusion high-resolution mass spectrometry of the heart (negative mode) (Figure 4J).
Scaled raw data and statistical significance.
- https://cdn.elifesciences.org/articles/69078/elife-69078-fig4-data4-v3.csv
Figure 4—figure supplement 1
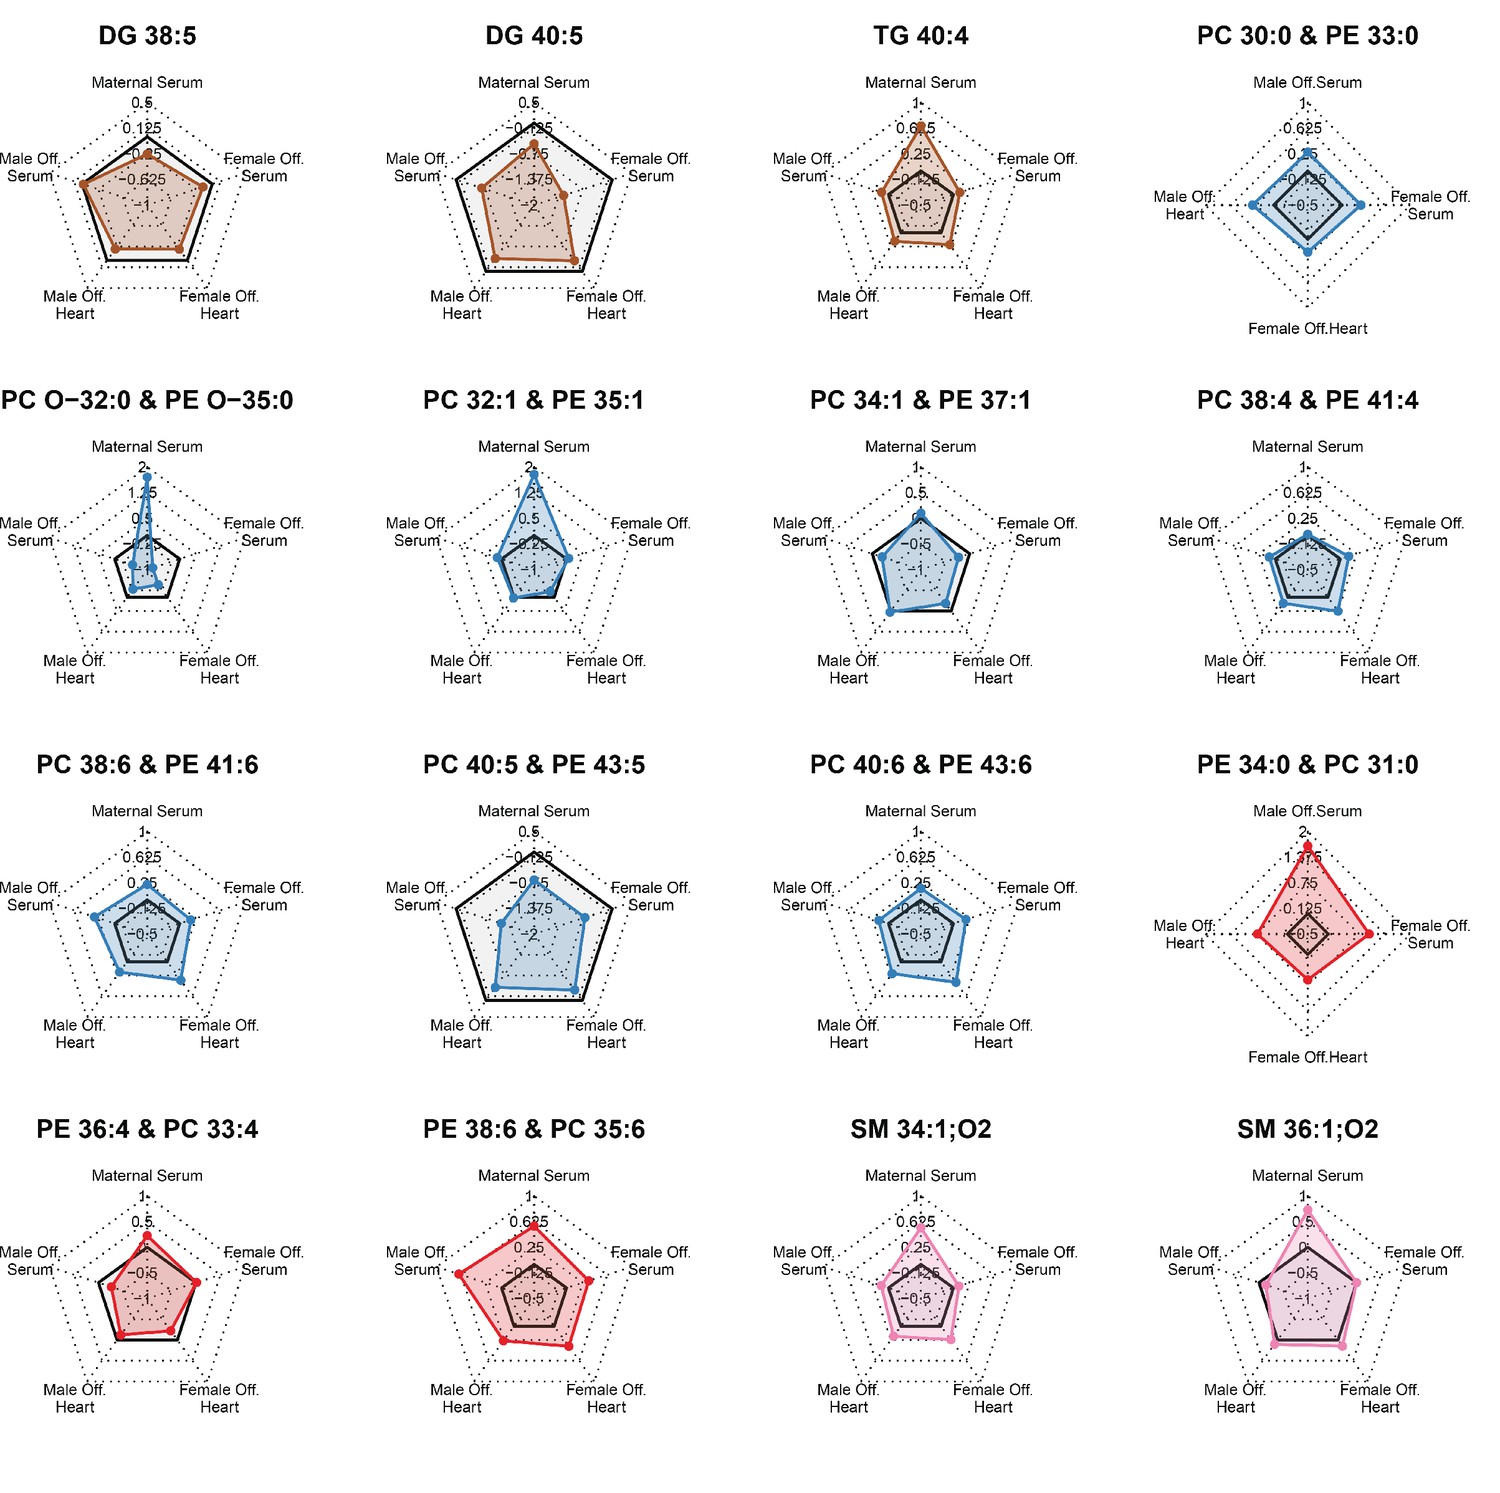
Radar plots showing regulation of most abundant statistically regulated lipids in the heart of fetuses from obese pregnancies in different compartments.
Grey-shaded area indicates negative regulation.
Figure 4—figure supplement 2
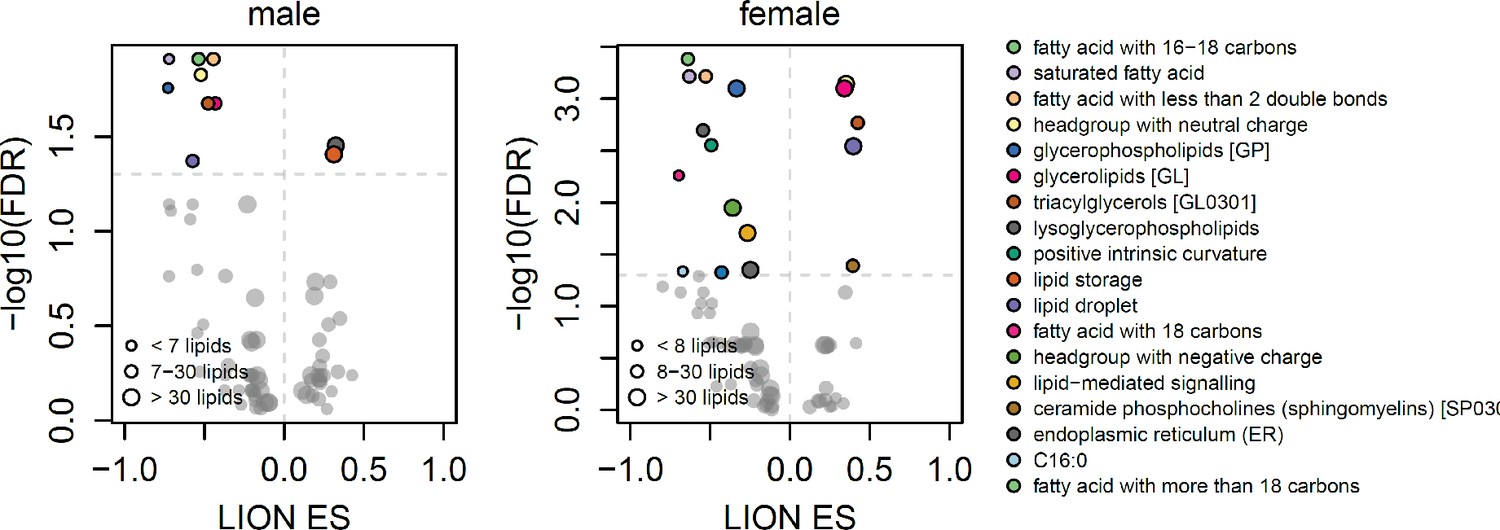
Scatterplots showing enrichment score (ES) and statistical significance of lipid ontology pathways from LION.
Figure 5
Fetal cardiac transcriptomics.
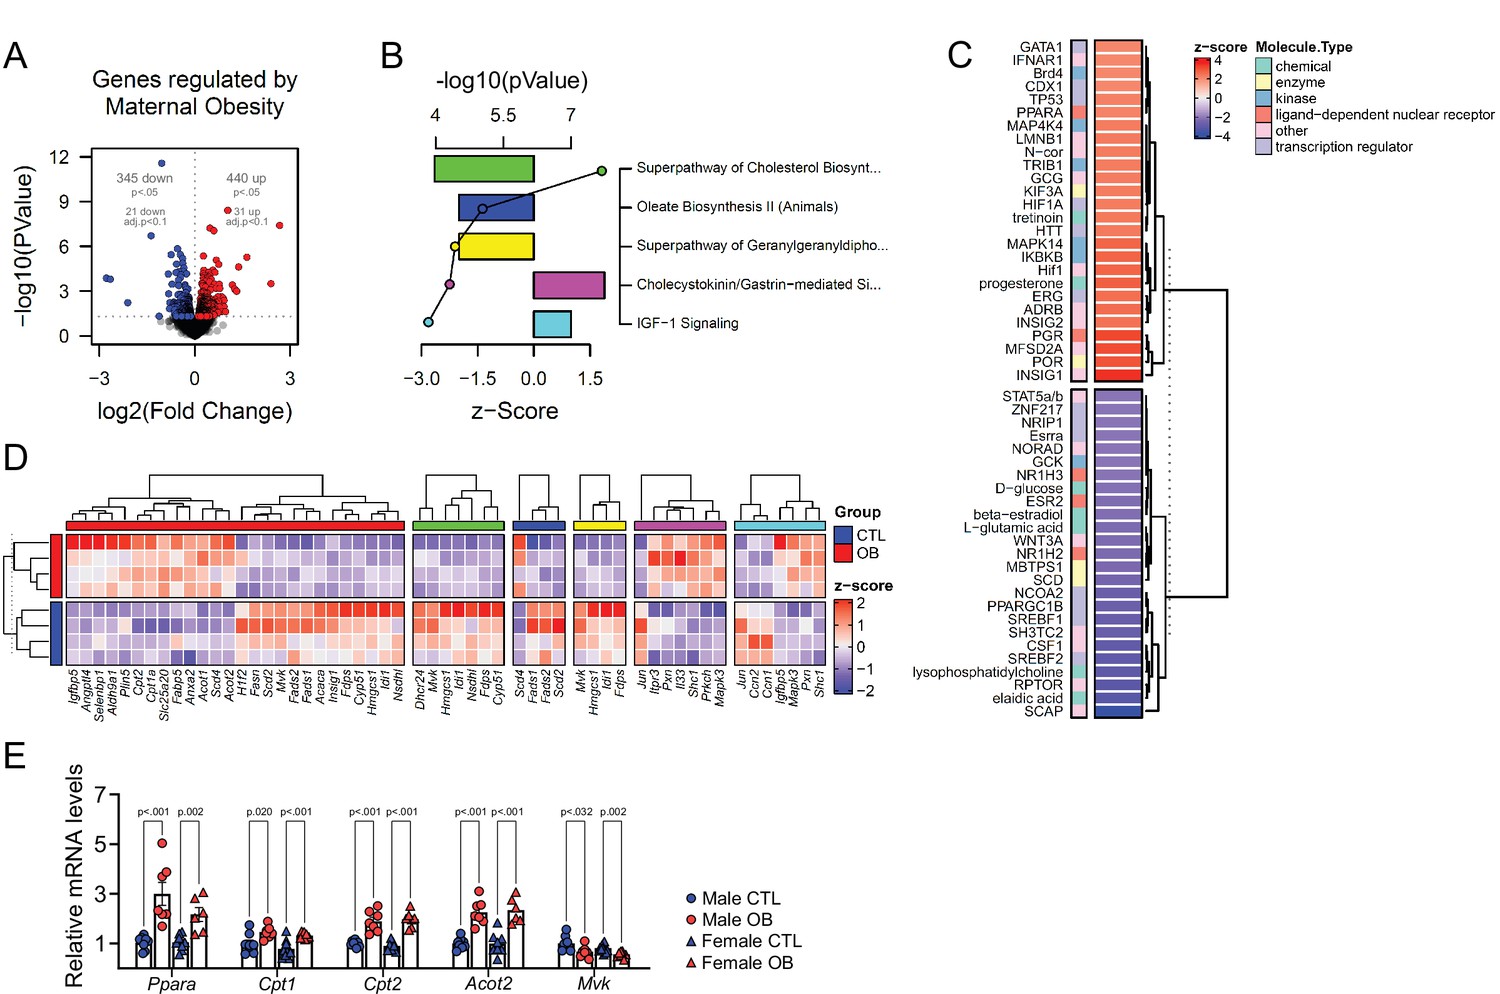
(A) Volcano plot showing up and downregulated genes in the heart of obese fetuses. p < 0.05 and FDR < 0.1 by generalised linear models with quasi-likelihood tests. Full statistical data is available in Figure 5—source data 1. (B) Top five regulated Ingenuity Canonical Pathways predicted by analysis of cardiac transcriptome from male fetuses from obese dams compared to fetuses from control dams. A p-value cut-off of 0.01 calculated by likelihood-ratio test was used to select regulated genes included in the IPA analysis. Bars represent activation z-score per pathway; points represent p-value of enriched pathways estimated by IPA algorithm. (C) Activation z-score of top Ingenuity Upstream Regulators predicted by analysis of cardiac transcriptome from male fetuses from obese dams compared to fetuses from control dams. The complete lists of regulated IPA canonical pathways and IPA upstream regulators are available in Figure 5—source data 2 and Figure 5—source data 3, respectively (D) Heatmap showing mRNA levels of genes regulated by PPAR-alpha activity (red bar), and genes mapped to ‘Superpathway of Cholesterol Biosynthesis’ (green bar), ‘Oleate Biosynthesis II’ (blue bar), ‘Superpathway of Geranylgeranyldiphosphate Biosynthesis I’ (yellow bar), ‘Cholecystokinin/Gastrin-mediated Signalling’ (pink bar) and ‘IGF-1 Signalling’ (light blue bar) Ingenuity Canonical Pathways in male E18.5 hearts as analysed by RNA Seq. CTL n = 4 and OB n = 4. (E) mRNA levels of selected markers of lipid metabolism in male and female fetal heats. Male CTL n = 8, male OB n = 8, female CTL n = 6, female OB n = 11. *p < 0.05, **p < 0.01, ***p < 0.001 by Student t-test. Diet ***p < 0.001 by factorial ANOVA. Primer sequences are available in Table 1.
-
Figure 5—source data 1
Quasi-likelihood general linear models generated from the analysis of E18.5 fetal cardiac transcriptomes (obese versus control) (Figure 5A).
- https://cdn.elifesciences.org/articles/69078/elife-69078-fig5-data1-v3.csv
-
Figure 5—source data 2
List of IPA canonical pathways with mapped E18.5 fetal cardiac genes confidently regulated by maternal obesity (Figure 5B).
- https://cdn.elifesciences.org/articles/69078/elife-69078-fig5-data2-v3.csv
-
Figure 5—source data 3
List of IPA upstream regulators with mapped E18.5 fetal cardiac genes confidently regulated by maternal obesity (Figure 5C).
- https://cdn.elifesciences.org/articles/69078/elife-69078-fig5-data3-v3.csv
-
Figure 5—source data 4
Counts per million of selected genes (Figure 5D).
- https://cdn.elifesciences.org/articles/69078/elife-69078-fig5-data4-v3.csv
-
Figure 5—source data 5
Fetal cardiac mRNA levels by qPCR (Figure 5E).
- https://cdn.elifesciences.org/articles/69078/elife-69078-fig5-data5-v3.csv
Figure 6 with 1 supplement
Acyl-carnitine levels in fetal hearts measured by LC-MS.
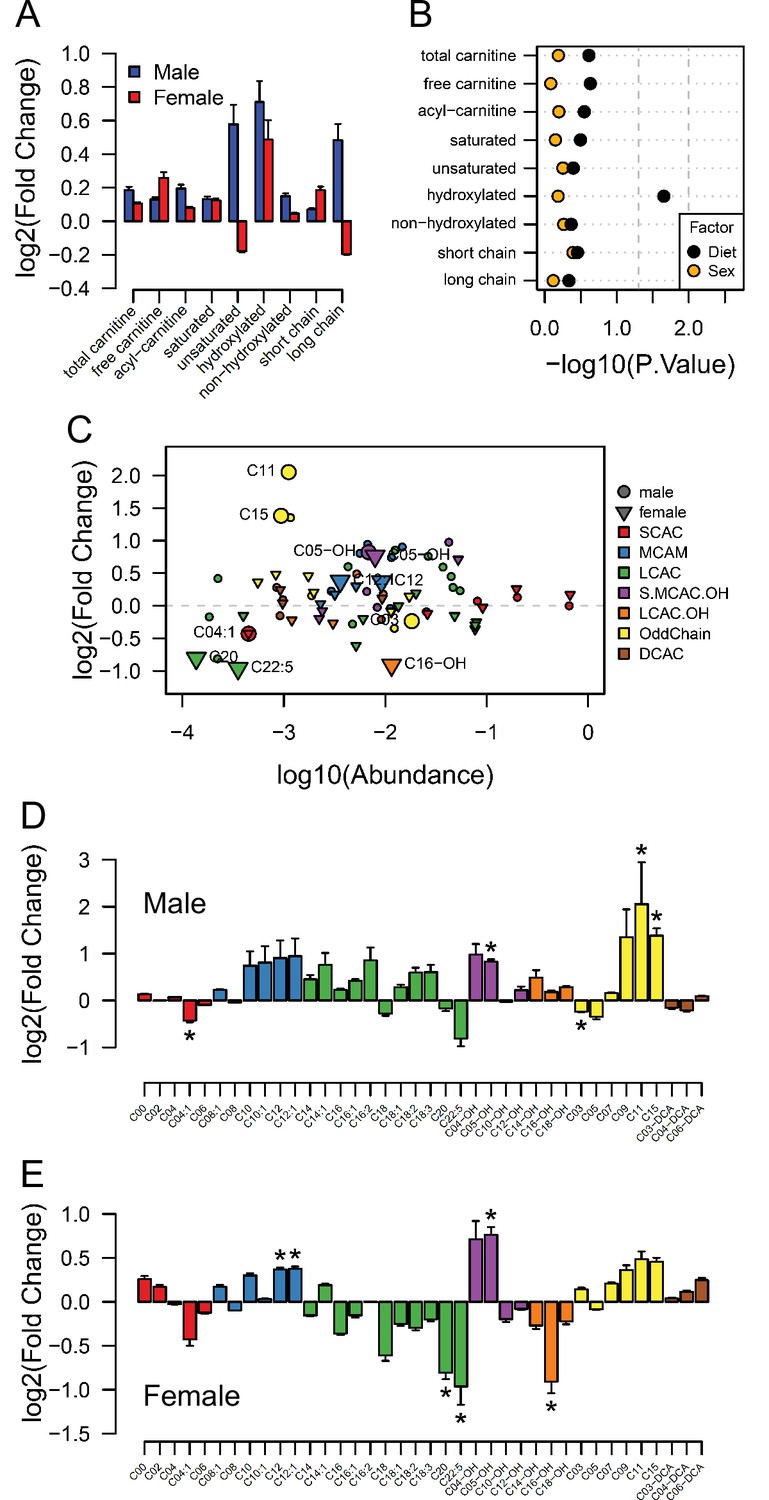
(A) Relative changes in cardiac carnitine classes levels in male and female fetuses from obese dams. (B) Influence of maternal diet and sex on fetal cardiac carnitine classes levels as calculated by factorial ANOVA. (C) Relative fold change of individual acyl-carnitine levels in the heart of E18.5 fetuses from obese dams according to their abundance. Larger figures are acyl-carnitine species deemed as regulated with p < 0.05 by Student t-test or Mann-Whitney test. SCAC: small-chain acyl-carnitine; MCAC: medium-chain acyl-carnitine; LCAC: long-chain acyl-carnitine; S.MCAM.OH: small- and medium-chain hydroxy acyl-carnitine, LCAC.OH: Long-chain hydroxy acyl-carnitine; Odd Chain: acyl-carnitines with an odd chain number; DCAC: dicarboxylic acyl-carnitines. (D–E) Individual acyl-carnitine species levels in male (D) and female (E) fetal hearts at 18.5 days of pregnancy. See Supplementary file 3 for list of full names. *p < 0.05 by Student t-test or Mann-Whitney test. Male fetuses CTL n = 7, male fetuses OB n = 7, female fetuses CTL n = 7, female fetuses OB n = 6.
-
Figure 6—source data 1
Acyl-carnitine classes abundance in fetal heart (Figure 6A).
- https://cdn.elifesciences.org/articles/69078/elife-69078-fig6-data1-v3.csv
-
Figure 6—source data 2
Acyl-carnitines abundance obtained by spectrometry of the heart (negative mode) (Figure 6C–E).
Raw data and statistical significance.
- https://cdn.elifesciences.org/articles/69078/elife-69078-fig6-data2-v3.csv
-
Figure 6—source data 3
Estimated pmol [14C]-CO2/ nmol [1-14C]-oleate produced by male and female fetal cardiomyocytes from CTL and OB dams at gestational day 18.5 (Figure 6—figure supplement 1).
- https://cdn.elifesciences.org/articles/69078/elife-69078-fig6-data3-v3.csv
Figure 6—figure supplement 1

Estimated pmol [14C]-CO2/ nmol [1-14C]-oleate produced by male and female fetal cardiomyocytes from CTL and OB dams at gestational day 18.5.
Male CTL n = 3, male OB n = 6, female CTL n = 2, female OB n = 5.
Tables
Key resources table
| Reagent type (species) or resource | Designation | Source or reference | Identifiers | Additional information |
|---|---|---|---|---|
| Biological sample (Mus musculus) | Murine cardiac ventricles | UBS, Cambridge, UK | Excised and frozen from Mus musculus | |
| Biological sample (Mus musculus) | Whole murine cardiac torsos | UBS, Cambridge, UK | Fixed Mus musculus torsos after culling | |
| Biological sample (Mus musculus) | Primary murine cardiomyocytes | UBS, Cambridge, UK | Freshly isolated from Mus musculus | |
| Antibody | Anti-Cardiac Troponin I(mouse monoclonal) | Abcam | Cat# ab8295 | IF(1:50) |
| Antibody | Anti-mouse IgG (FITC)(goat polyclonal) | Abcam | Cat# ab6785 | IF(1:1000) |
| Antibody | Anti-PCNA(mouse monoclonal) | Abcam | Cat# ab29 | IHC(1:10,000) |
| Commercial assay or kit | Pierce Primary Cardiomyocyte Isolation Kit | Thermo-Fisher | Cat# 88,281 | |
| Commercial assay or kit | HRP/DAB (AMB) detection IHC kit | Abcam | ab64264 | |
| Commercial assay or kit | miRNeasy mini kit | Qiagen | 217,004 | |
| Commercial assay or kit | TruSeq RNA Library Preparation kit v2 | Illumina | RS-122–2001 | |
| Commercial assay or kit | High-Capacity cDNA Reverse Transcription Kit | Thermo-Fisher | 4368814 | |
| Software, algorithm | Bowtie | Bowtie | RRID:SCR_005476 | V 1.2.3 |
| Software, algorithm | Ingenuity Pathways Analysis (IPA) | Qiagen | RRID:SCR_008653 | V 42012434 |
| Software, algorithm | edgeR | Bioconductor (R) | RRID:SCR_012802 | V 3.36.0 |
| Software, algorithm | RStudio | RStudio | RRID:SCR_000432 | V 1.4 |
| Software, algorithm | Prism | GraphPad | RRID:SCR_002798 | V 9.3.0 |
| Software, algorithm | QuPath | QuPath | RRID:SCR_018257 | V 0.3.0 |
| Software, algorithm | Xcalibur | Thermo | RRID:SCR_014593 | V 4.3 |
| Software, algorithm | Inkscape | Inkscape | RRID:SCR_014479 | V 1.1.1 |
| Software, algorithm | Harmony | PerkinElmer | RRID:SCR_018809 | V 5.0 |
| Software, algorithm | ImageJ | ImageJ | RRID:SCR_003070 | V 1.53 n |
| Software, algorithm | XCMS | Bioconductor (R) | RRID:SCR_015538 | V 3.16.1 |
| Software, algorithm | Peakpicker | R | Harshfield et al., 2019 | V 2.0 |
| Other | Horse Serum, heat inactivated | Thermo-Fisher | Cat# 26050070 | |
| Other | Fetal bovine serum (FBS) for standard applications | Thermo-Fisher | Cat#26,140 | |
| Other | Paraformaldehyde Solution, 4% in PBS | Thermo-Fisher | Cat# 15670799 | |
| Other | Animal-free blocking buffer | Vector laboratories | Cat# SP-5030–250 | |
| Other | Formalin solution, neutral buffered, 10% | Merck | HT501128 | |
| Other | Haematoxylin QS Counterstain | Vector laboratories | H-3404–100 | |
| Other | Hepes | Merck | Cat# H3375 | |
| Other | DAPI solution | Merck | 10236276001 | (1 µg/mL) |
| Other | Guanidine | Merck | CAS 50-01-1 | |
| Other | Thiourea | Merck | CAS 62-56-6 | |
| Other | Dichloromethane | Merck | CAS 75-09-2 | |
| Other | Methanol | Merck | CAS 67-56-1 | |
| Other | Triethylammonium chloride | Merck | CAS 554-68-7 | |
| Other | Ammonium Acetate | Merck | CAS 631-61-8 | |
| Other | Chloroform | Merck | 34854–2.5 L-M | |
| Other | Butyryl-d7-L-carnitine | QMX laboratory | D-7761/0.05 | |
| Other | Hexadecanoyl-L-carnitine-d3 | QMX laboratory | D-6646/0.05 | |
| Other | Acetone | Merck | A/0560/17 | |
| Other | Acetonitrile | Merck | 2856–25 | |
| Other | Power SYBR Green PCR Master Mix | Thermo-Fisher | 4367659 | |
| Other | Fatty acid-free bovine serum albumin (BSA) | Merck | A9205 | |
| Other | DMEM – low glucose | Merck | D6046 | |
| Other | L-Carnitine | Merck | CAS 541-15-1 | |
| Other | Oleic Acid, [1–14 C]-, 50 µCi | PerkinElmer | NEC317050UC |
Table 1
Sequence-specific primers for qPCR.
| Gene | Forward primer (5’ to 3’) | Reverse primer (5’ to 3’) |
|---|---|---|
| Acot2 | GCCACCCCGAGGTAAAAGGA | CCACGACATCCAAGAGACCAT |
| Cpt1 | TCCGCTCGCTCATTCCGC | TGCCATTCTTGAATCGGATGAACT |
| Cpt2 | TCGTACCCACCATGCACTAC | GTTTAGGGATAGGCAGCCTGG |
| Mvk | CGGGGCAGAAGTCTCAGAAG | TTCTCAAGTTCAAGGCCGCT |
| Ppara | TGCAGCCTCAGCCAAGTTGAA | CCCGAACTTGACCAGCCACA |
Author response table 1
| Lipid | Direction | CTL | OB | P.value |
|---|---|---|---|---|
| Cer 34:1;O2_[M + H-H2O]+ | Low | 5 | 2 | 0.6083916 |
| High | 4 | 4 | ||
| Cer 42:1;O2_[M + H-H2O]+ | Low | 5 | 2 | 0.6083916 |
| High | 4 | 4 | ||
| Cer 42:2;O2_[M + H-H2O]+ | Low | 4 | 3 | 1 |
Additional files
-
Supplementary file 1
Isobars and main predicted classes for m/z detected in direct infusion high-resolution mass spectrometry of the serum (positive mode only).
Isobar annotations were obtained from LIPID MAPS Structure Database and a mass tolerance (m/z) threshold:±0.001 was used. For multiple isobars per m/z, biological likelihood was employed to predict the likely identification. Main classes were predicted according to the likely identification.
- https://cdn.elifesciences.org/articles/69078/elife-69078-supp1-v3.csv
-
Supplementary file 2
Isobars and main predicted classes for m/z detected in direct infusion high-resolution mass spectrometry of the heart (positive mode only).
Isobar annotations were obtained from LIPID MAPS Structure Database and a mass tolerance (m/z) threshold:±0.001 was used. For multiple isobars per m/z, biological likelihood was employed to predict the likely identification. Main classes were predicted according to the likely identification.
- https://cdn.elifesciences.org/articles/69078/elife-69078-supp2-v3.csv
-
Supplementary file 3
List of names for acyl-carnitines identified in E18.5 fetal hearts by LCMS.
- https://cdn.elifesciences.org/articles/69078/elife-69078-supp3-v3.csv
-
Transparent reporting form
- https://cdn.elifesciences.org/articles/69078/elife-69078-transrepform1-v3.pdf
Download links
A two-part list of links to download the article, or parts of the article, in various formats.
Downloads (link to download the article as PDF)
Open citations (links to open the citations from this article in various online reference manager services)
Cite this article (links to download the citations from this article in formats compatible with various reference manager tools)
Maternal diet-induced obesity during pregnancy alters lipid supply to mouse E18.5 fetuses and changes the cardiac tissue lipidome in a sex-dependent manner
eLife 11:e69078.
https://doi.org/10.7554/eLife.69078


