Optogenetic inhibition of actomyosin reveals mechanical bistability of the mesoderm epithelium during Drosophila mesoderm invagination
- Department of Biological Sciences, Dartmouth College, United States
- Department of Molecular Biology, Princeton University, United States
Figures
Figure 1 with 3 supplements
Light-dependent membrane recruitment of CRY2-Rho1DN results in rapid myosin inactivation.
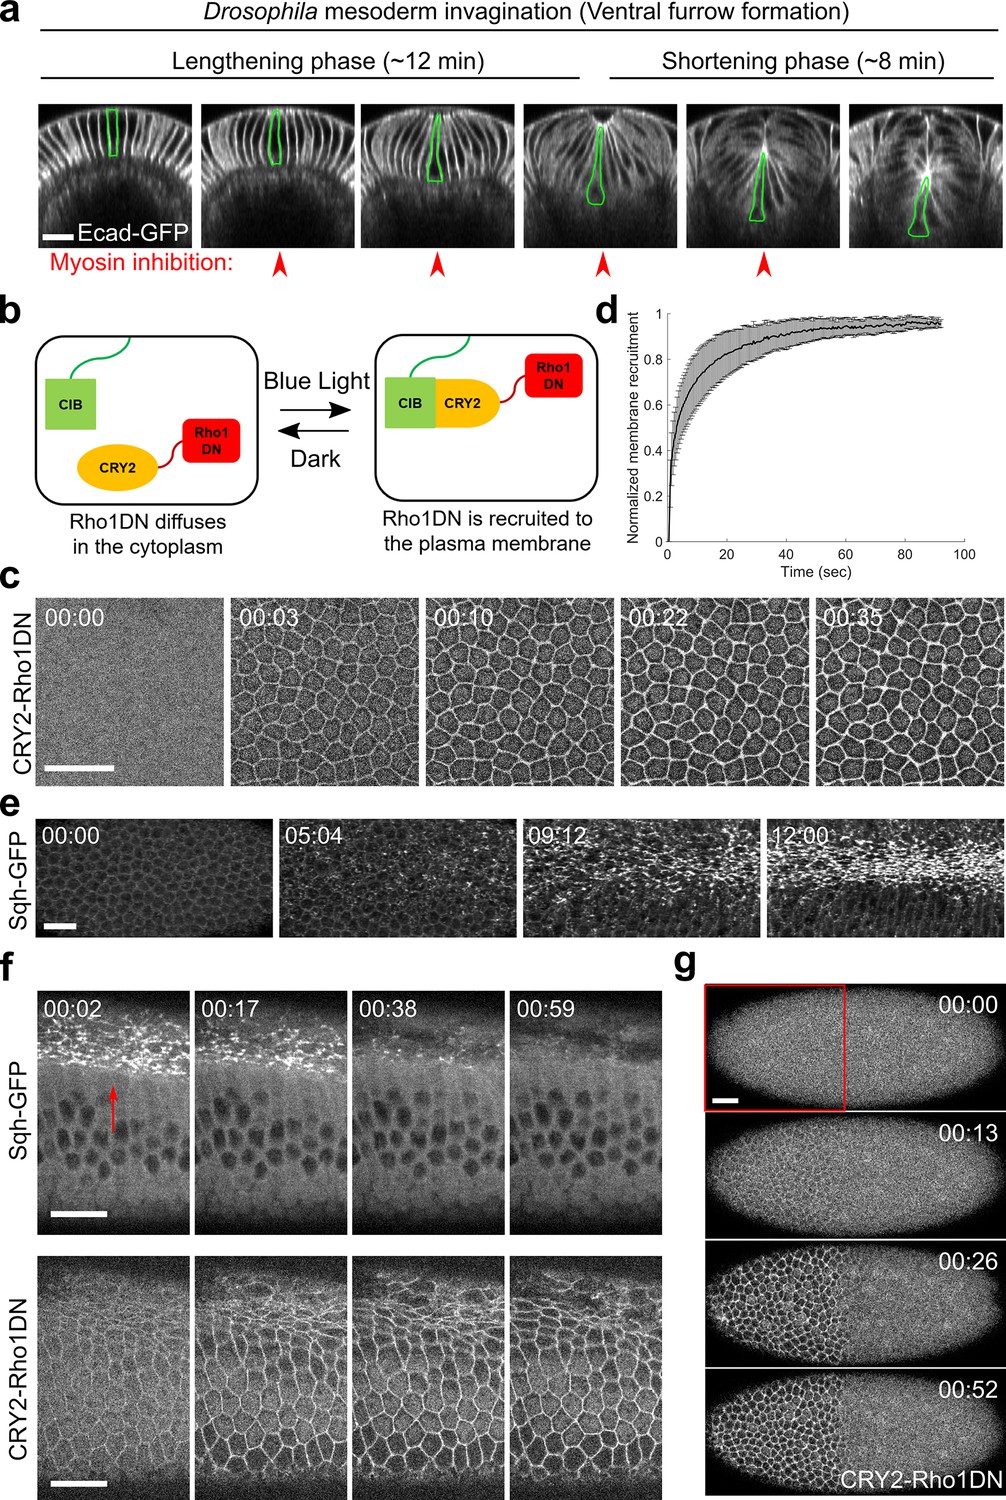
(a) Drosophila mesoderm invagination occurs in distinct lengthening and shortening phases. Ventral side is up (same for all cross-section images in this work unless otherwise stated). A single ventral cell undergoing apical constriction is outlined in green. In this study, we sought to test whether myosin contractility is required throughout the folding process by acute, stage-specific inhibition of Rho1 (arrowheads). (b) Cartoon depicting the principle of the optogenetic tool used in this study. Upon blue light stimulation, CRY2-Rho1DN is translocated from the cytosol to the plasma membrane through the interaction between CRY2 and membrane anchored CIBN. (c) Confocal images showing the rapid membrane recruitment of CRY2-Rho1DN upon blue light illumination. (d) Relative abundance of membrane recruited CRY2-Rho1DN over time after blue light stimulation. Error bar: s.d., N=6 embryos. (e) A wild-type embryo expressing Sqh-GFP showing apical myosin accumulation during ventral furrow formation. N=4 embryos. (f) Activation of Opto-Rho1DN results in rapid dissociation of myosin from the ventral cell cortex (arrow) in a gastrulating embryo. N=8 embryos. (g) Confocal images showing the confined membrane recruitment of CRY2-Rho1DN within a region of interest (ROI, red box) that has been scanned by a focused beam of blue laser. N=6 embryos. All scale bars=20 μm.
Figure 1—figure supplement 1
Activation of Opto-Rho1DN inhibits apical constriction during gastrulation.
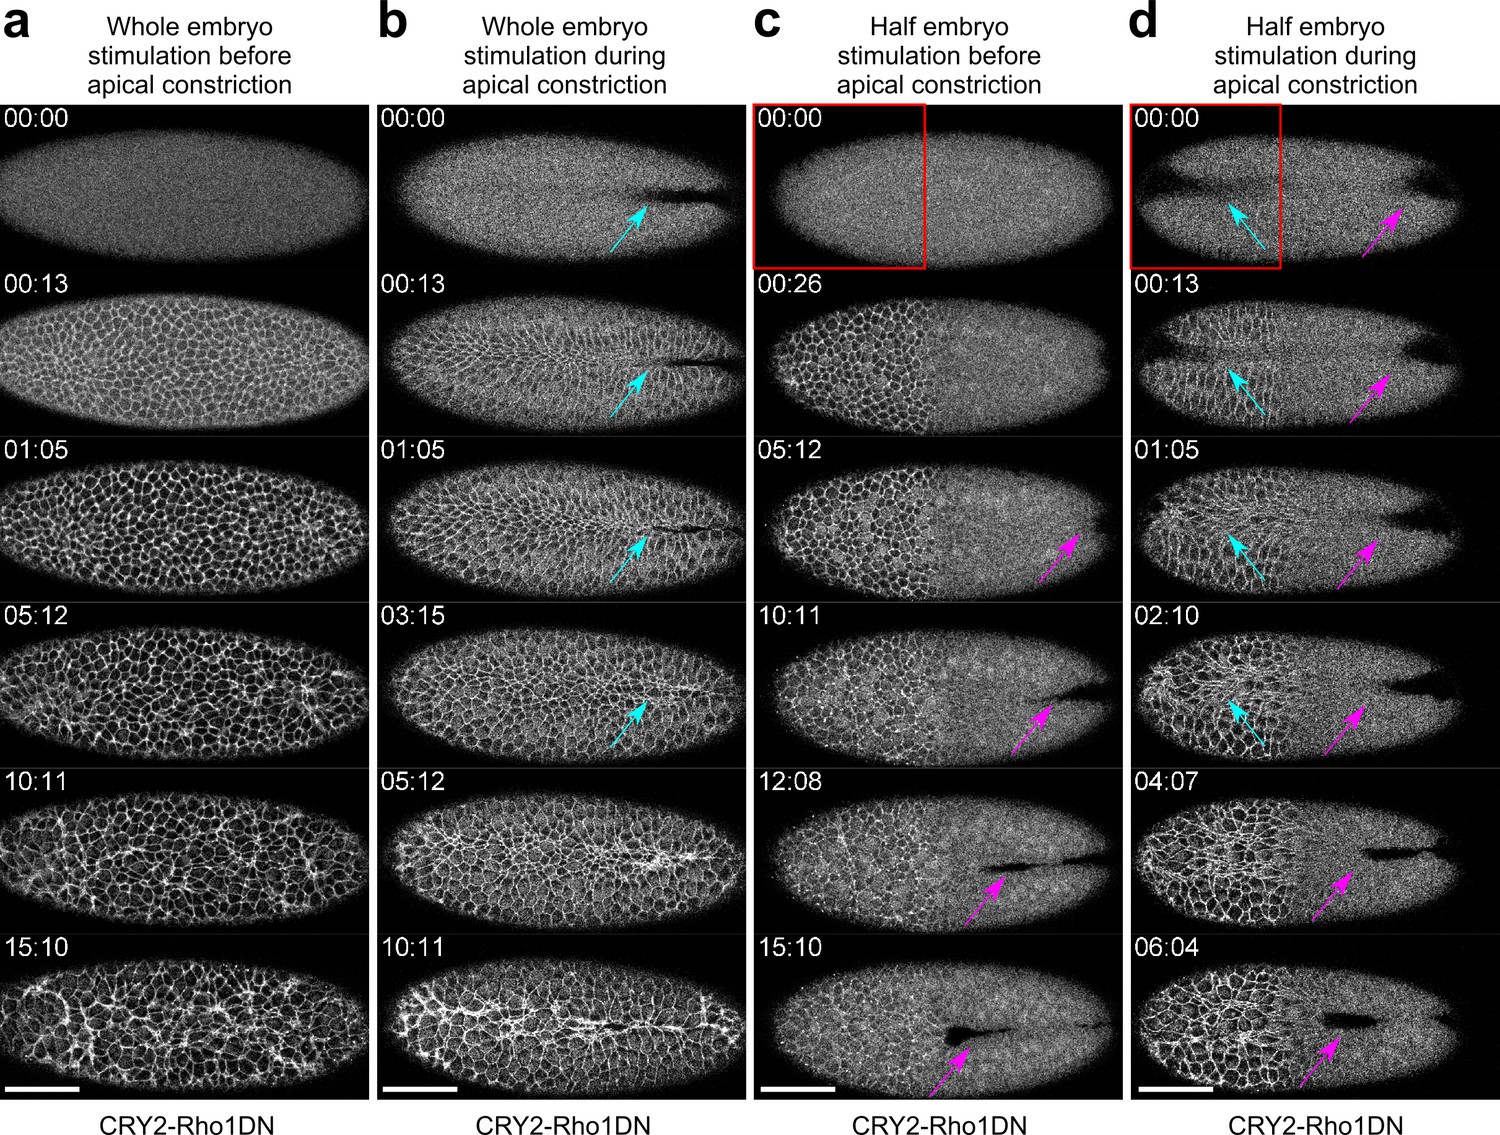
Confocal images showing the effect of activating Opto-Rho1DN on apical constriction during ventral furrow formation. Time zero corresponds to the time of stimulation. N≥2 embryos were tested for each condition. (a) Activating Opto-Rho1DN before the onset of gastrulation blocks apical constriction and ventral furrow formation. In the stimulated embryo, only a small set of cells scattered across the ventral domain undergo limited apical constriction over the course of 15 min. This is in contrast to the wild-type embryo where mesoderm invagination completes in 15–20 min. (b) Activating Opto-Rho1DN during apical constriction results in immediate relaxation of the constricted cells (cyan arrows). (c) Spatially confined activation of Opto-Rho1DN (red box) before gastrulation blocks apical constriction specifically in the stimulated region. Ventral furrow still forms in the unstimulated region of the embryo (magenta arrows). (d) Spatially confined activation of Opto-Rho1DN (red box) during apical constriction results in an immediate relaxation of the constricted cells specifically in the stimulated region (cyan arrows). Ventral furrow continues to form in the unstimulated region (magenta arrows). Scale bars: 50 μm.
Figure 1—video 1
Rapid membrane recruitment of CRY2-Rho1DN upon blue light irradiation.
Shown is an embryo at late cellularization stage containing CIBNpm-GFP (magenta) and CRY2-Rho1DN-mCherry (green). Stimulation starts when 488 nm laser is turned on at T=00:00 (mm:ss, same format for all movies). Rapid membrane recruitment of CRY2-Rho1DN-mCherry appears within 10 s and maximum recruitment is achieved at around 30 s.
Figure 1—video 2
Loss of apical myosin during apical constriction upon activation of Opto-Rho1DN.
Shown is an embryo at early gastrulation stage expressing CIBNpm, CRY2-Rho1DN-mCherry (green), and Sqh-GFP (magenta). Myosin disappears from the apical cortex of the ventral cells within 1 min after 488 nm laser illumination.
Figure 2
Rapid disassembly of apical F-actin in the constricting cells after Opto-Rho1DN stimulation.
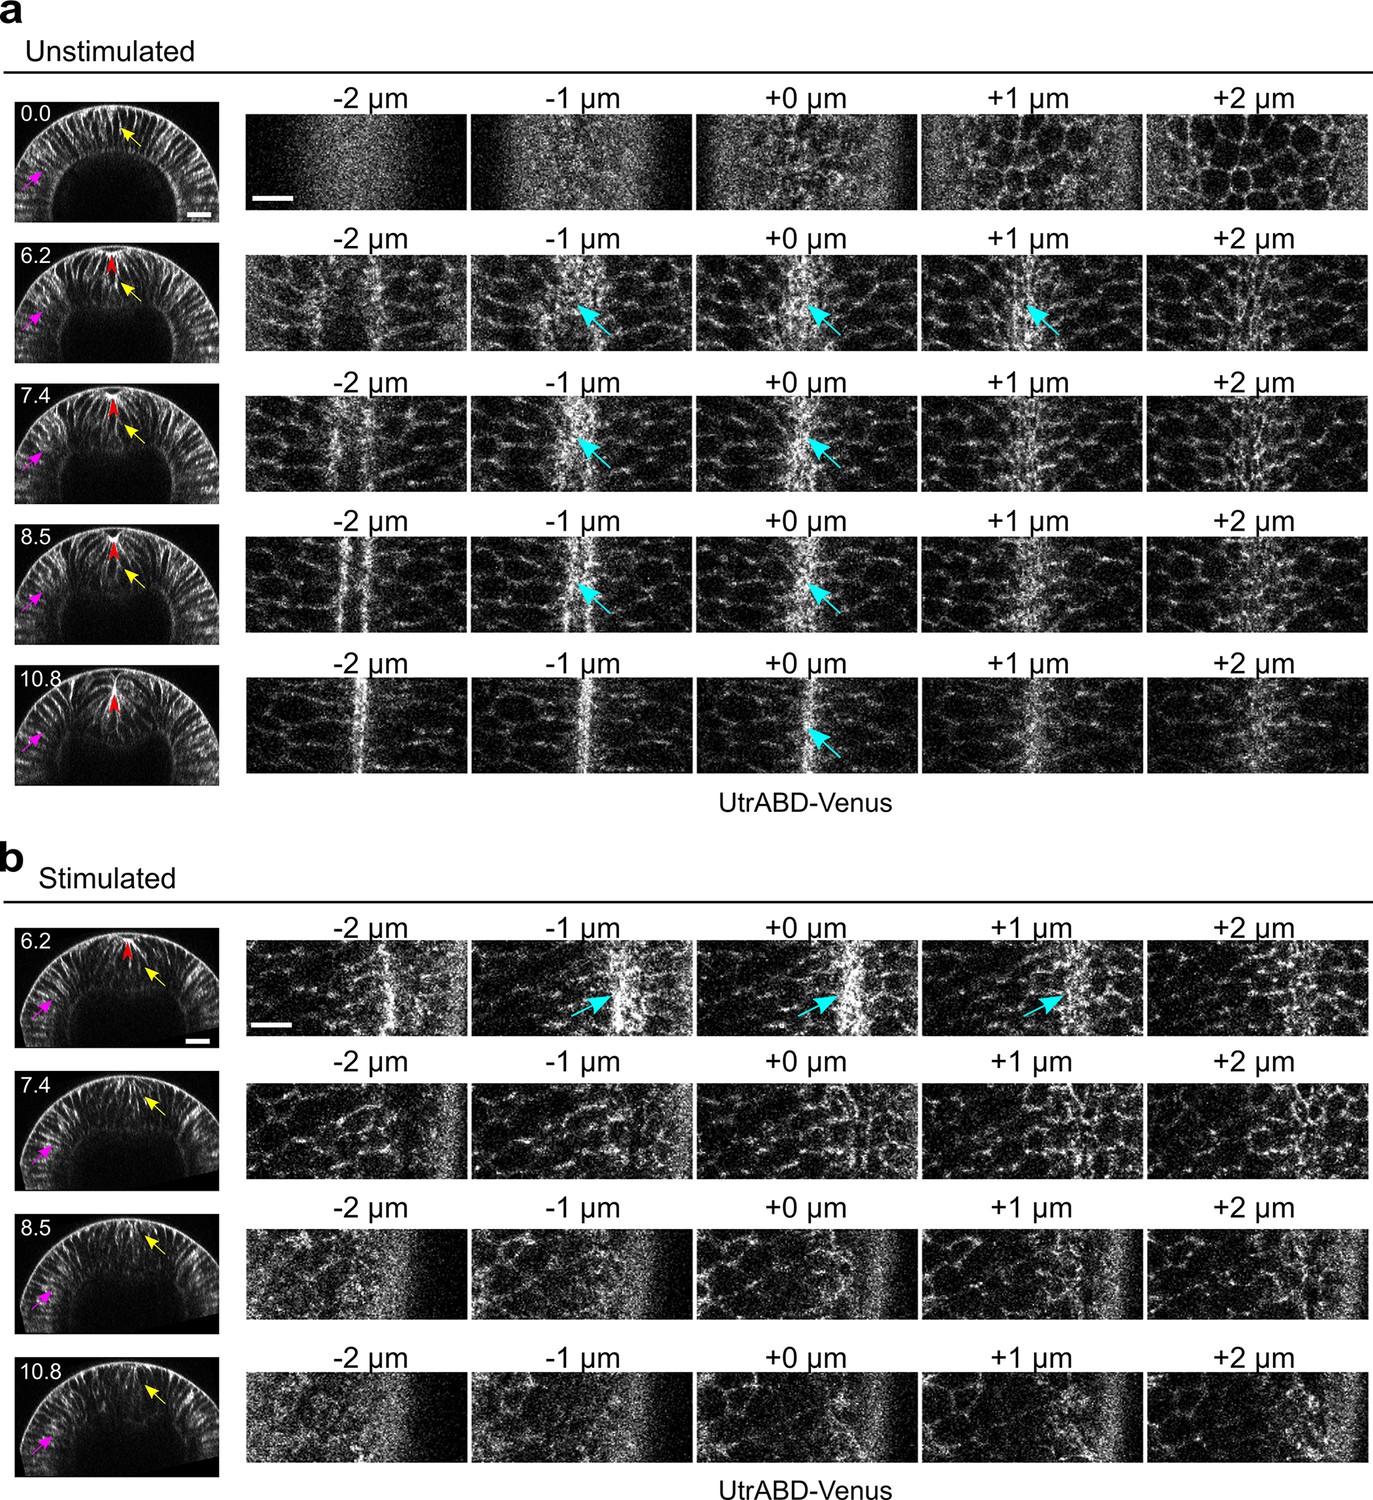
(a) Cross-sections (left) and en face views (right) of a representative unstimulated embryo showing the localization of the F-actin marker UtrophinABD-Venus (UtrABD-Venus) during ventral furrow formation. At the onset of apical constriction, F-actin is enriched along the lateral membrane in both mesodermal and ectodermal cells (yellow and magenta arrows, respectively). During apical constriction, F-actin also accumulates at the apical domain of the constricting cells (cyan arrows). T=0 (min) is the onset of ventral furrow formation. +0 μm indicates the apex of the ventral most cells (red arrowheads) where the strongest accumulation of apical F-actin is observed. (b) Upon Opto-Rho1DN stimulation (immediately before 6.2 min), apical F-actin disappears within 1.2 min (cyan arrows). Lateral F-actin in the constricting cells was not immediately affected and only started to diminish 4 min after stimulation (yellow arrows). Lateral F-actin in the ectodermal cells was not significantly affected (magenta arrows). Note that the initial apical indentation (red arrowheads) quickly disappeared after stimulation upon relaxation of the cell apex. N=3 for unstimulated embryos and N=10 for stimulated embryos. Scale bars: cross-sections, 20 μm; en face views, 10 μm.
Figure 3
Opto-Rho1DN stimulation during apical constriction results in an immediate loss of cortical tension at ventral surface of the embryo.
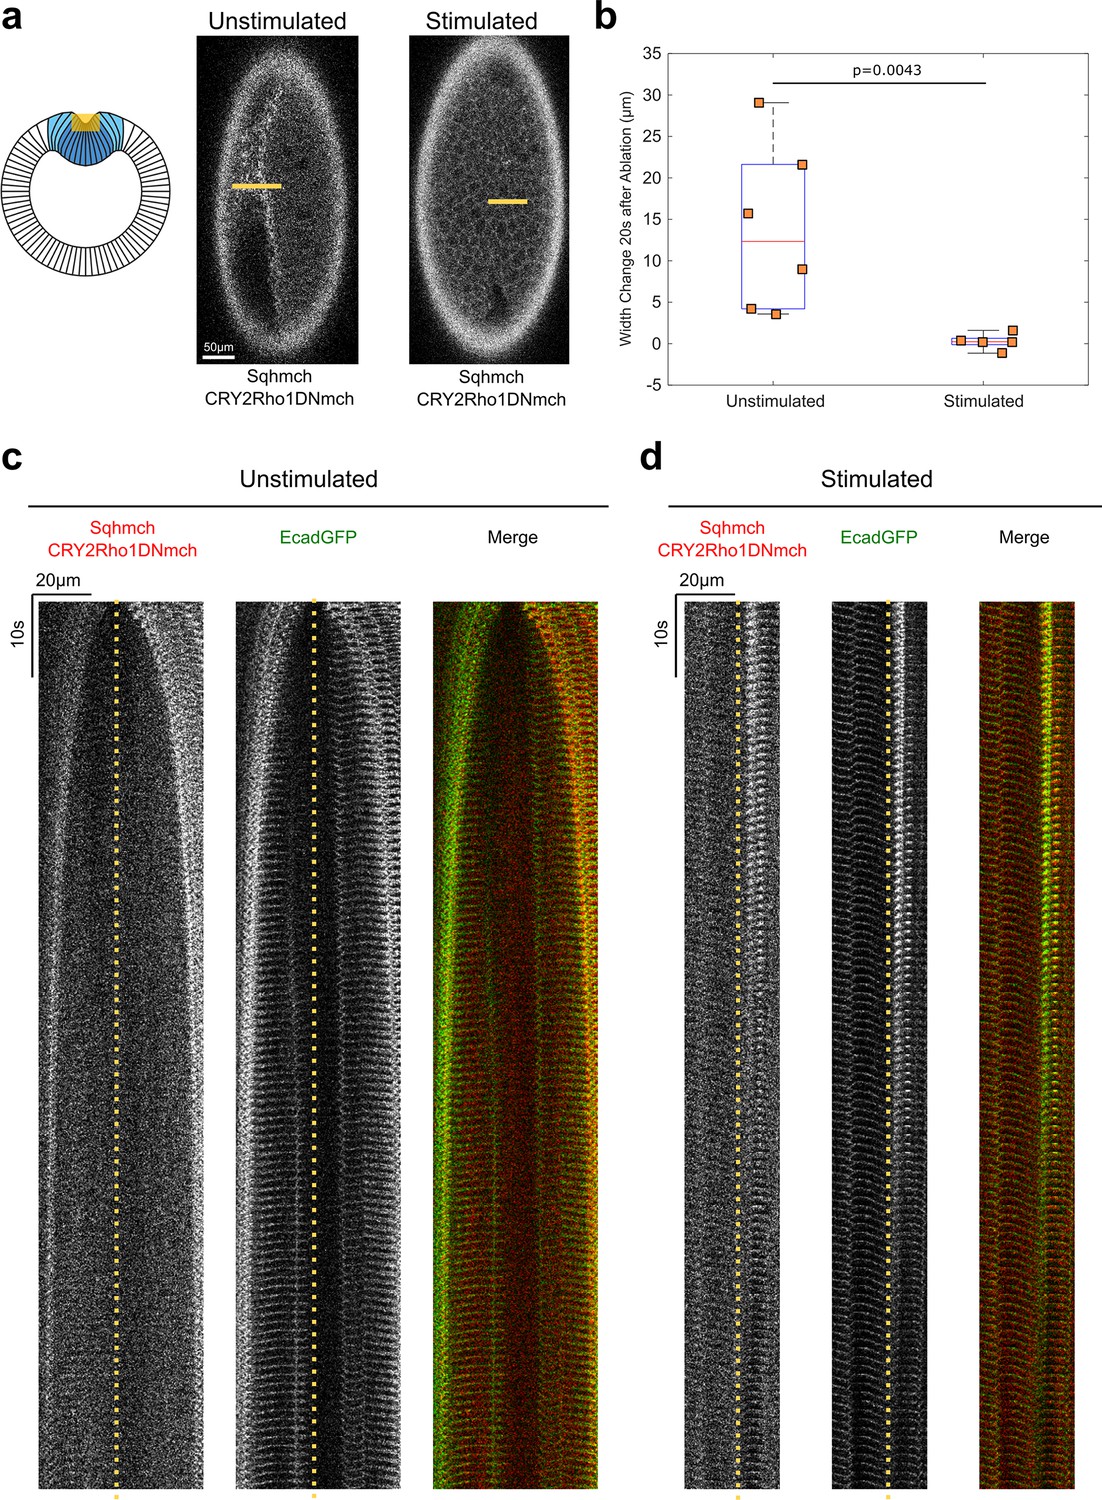
(a) Cartoon depicting the experimental setup for laser ablation to detect cortical tension. Yellow shaded regions indicate the ablated regions. For stimulated embryos, light-activation of Opto-Rho1DN was performed 3 min before the laser ablation. Due to apical relaxation after stimulation, multiple z-planes were ablated (yellow shaded region) in order to ensure the ablation of the very apical surface of the ventral cells. (b) Width changes of the ablated region along the A-P axis during the first 20 s after laser ablation. A clear tissue recoil was observed after laser cutting in the unstimulated control embryos. In contrast, little to no tissue recoil was observed in the stimulated embryos, indicating lack of apical tension after Rho1 inhibition. p value was calculated using two-sided Wilcoxon rank-sum test. (c–d) Kymographs showing the comparison between unstimulated and stimulated embryos. No obvious tissue recoil was observed in the stimulated embryos (N=6 for unstimulated embryos and N=5 for stimulated embryos). Dotted line indicates ablation site.
Figure 4 with 4 supplements
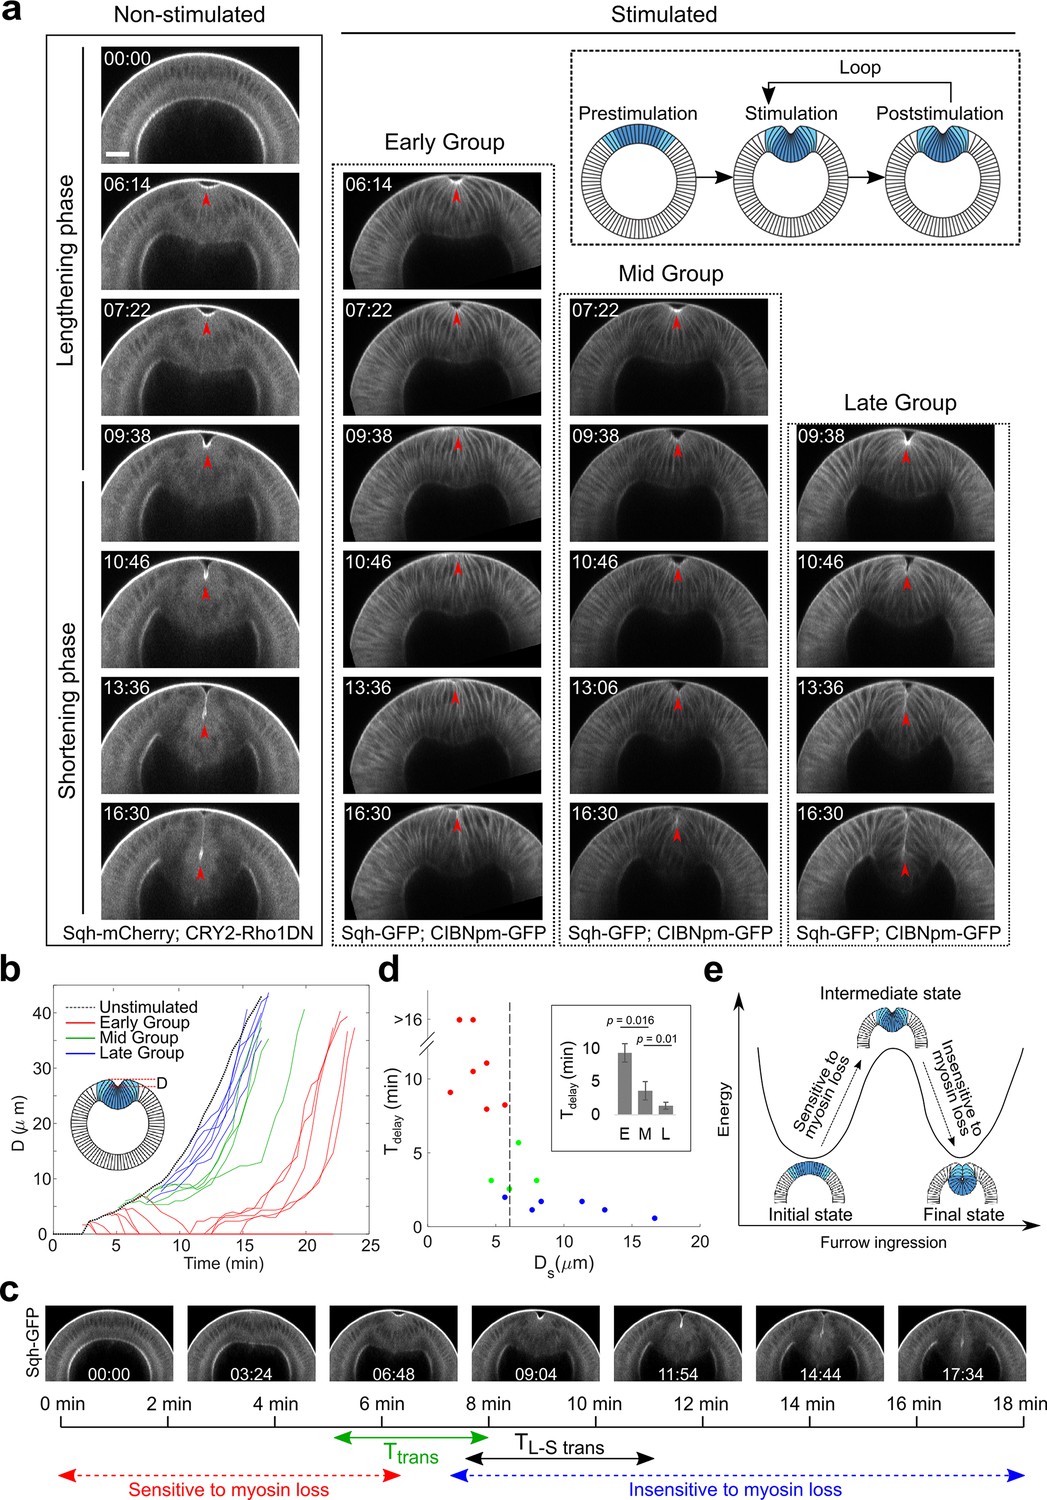
Acute inhibition of actomyosin contractility results in stage-dependent response during ventral furrow formation.
(a) Still images from multiphoton movies showing different tissue responses to acute loss of myosin contractility during ventral furrow formation. Early Group, Mid Group, and Late Group embryos (N=8, 4, and 6 embryos, respectively) are defined based on their immediate response to myosin inhibition. For stimulated embryos, the first frame corresponds to the time point immediately after stimulation. The inset depicts the stimulation and imaging protocol. Arrowheads indicate the apex of the ventral most cells. (b) Time evolution of the invagination depth ‘D’ for the stimulated embryos and a representative unstimulated control embryo. For stimulated embryos, all movies were aligned in time to the representative control embryo based on furrow morphology at the time of stimulation. (c) Relationship between the transition phase for sensitivity to myosin inhibition (Ttrans) and lengthening-shortening transition (TL-S trans). (d) Scatter plot showing the relation between invagination depth at the time of stimulation (Ds) and the delay time (Tdelay) in furrow invagination compared to the representative control embryo. Tdelay is highly sensitive to Ds, with a switch-like change at Ds~6 μm (dashed line). Inset: Average Tdelay in Early (E, n=5 embryos that invaginated), Mid (M, n=4), and Late (L, n=6) Group embryos. Statistical comparisons were performed using two-sided Wilcoxon rank-sum test. (e) Cartoon depicting mechanical bistability of the mesoderm during gastrulation. Both the initial, pre-constriction state and the final, fully invaginated state are stable. During gastrulation, actomyosin contractility is critical for bringing the system from the initial state to an intermediate, transitional state, whereas the subsequent transition to the final state can occur independent of myosin contractility.
-
Figure 4—source data 1
Cell length measurements for determining lengthening-shortening transition time.
- https://cdn.elifesciences.org/articles/69082/elife-69082-fig4-data1-v2.xlsx
Figure 4—figure supplement 1
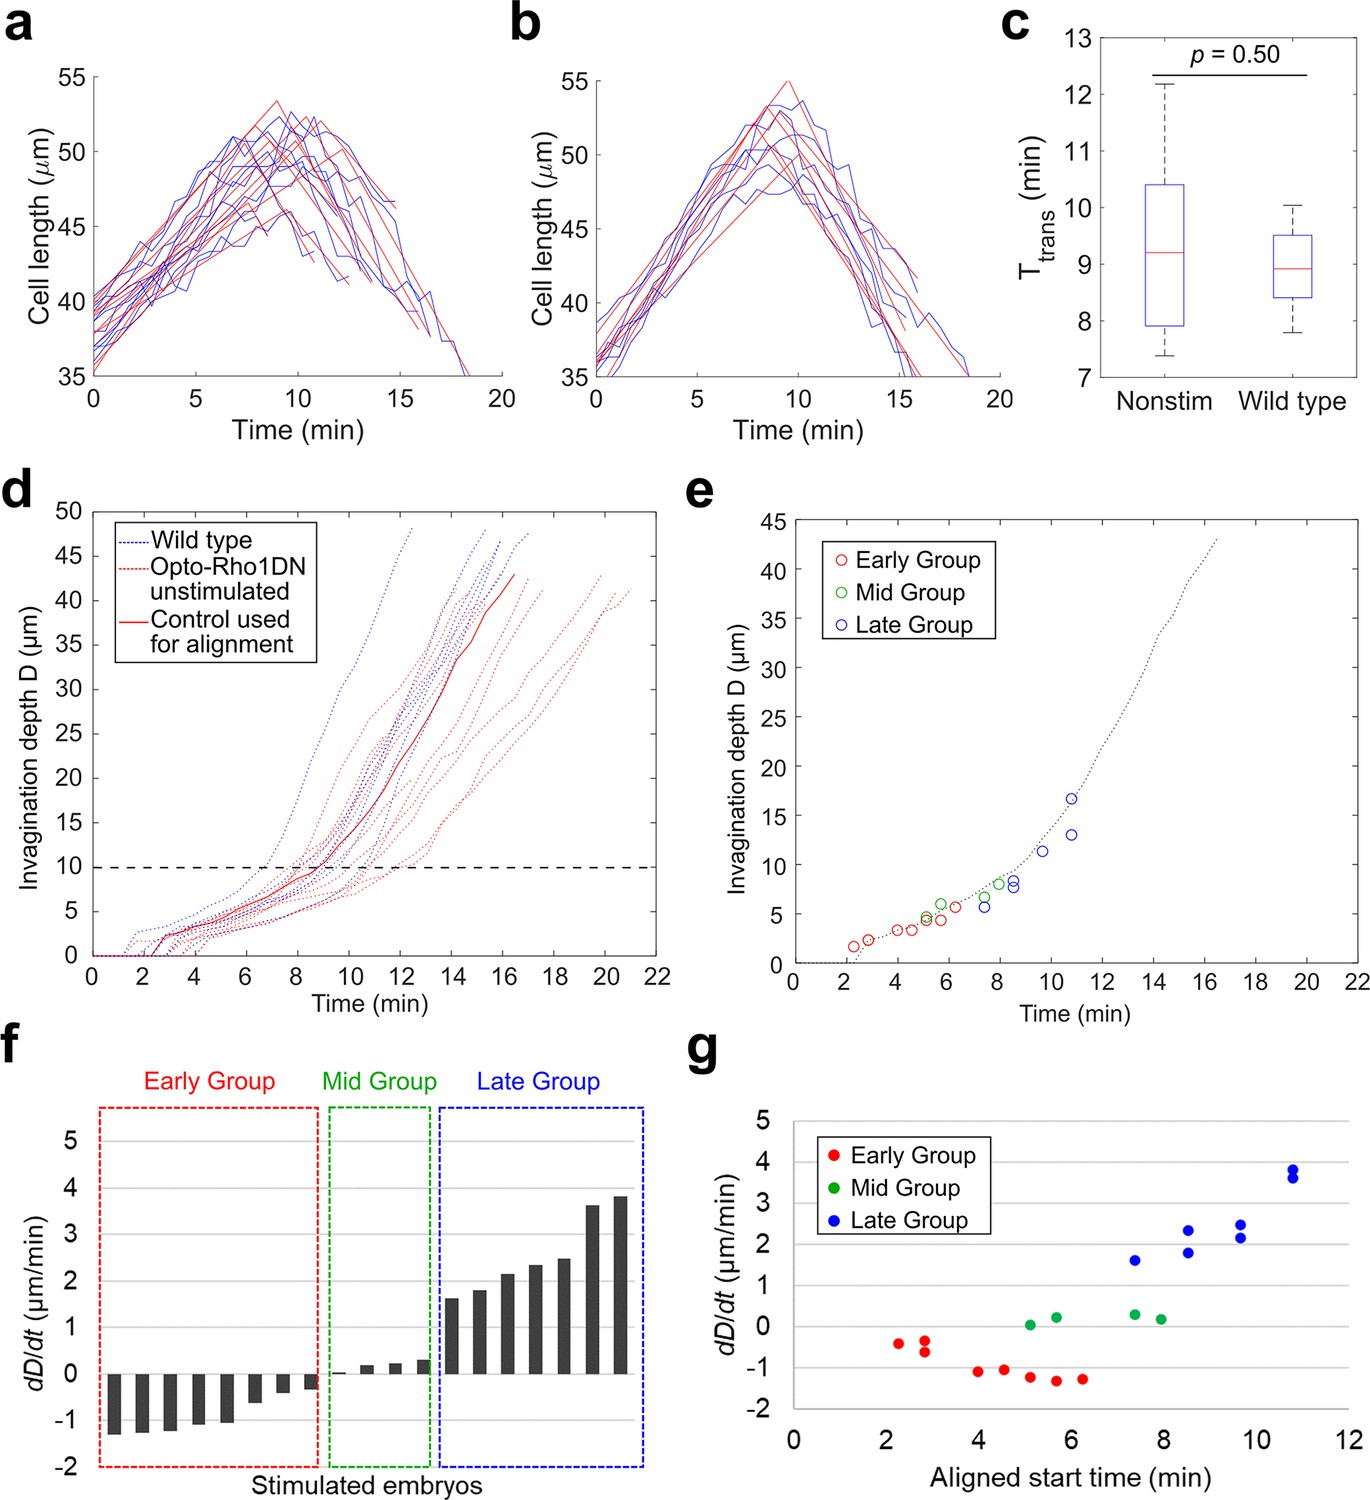
Classification of the response of embryos to acute myosin inhibition during ventral furrow formation.
(a–c) Determining the transition point between the lengthening and shortening phases (TL-S trans). (a, b) Measurement of apical-basal cell length of the ventral most cells over the course of ventral furrow formation in unstimulated control embryos that express Opto-Rho1DN (a, unstimulated control, N=10) and wild-type embryos that do not express Opto-Rho1DN (b, wild-type, N=6). For each group, one obvious outlier was excluded from the analysis. The raw measurement for each embryo (blue) is fitted with two intersecting line segments (red) to determine TL-S trans. The distribution of TL-S trans for unstimulated control embryos and wild-type embryos is shown in (c). There is no significant difference between the two control groups (Student’s t-test). Error bars: s.d. (d) Measurement of invagination depth D in unstimulated control embryos (red dotted lines) and wild-type embryos (blue dotted lines). Red solid line marks the representative unstimulated control embryo used for time alignment of the stimulated embryos. Black dashed line indicates the average invagination depth at TL-S trans. (e) Alignment of the stimulated embryos to the representative control embryo (dotted line) based on furrow morphology immediately before stimulation. Each open circle shows the invagination depth D of a stimulated embryo at the aligned starting time. (f) The average rate of invagination within the first 4 min immediately after stimulation (dD/dt) is used to categorize the stimulated embryos into three groups. Early Group: dD/dt<–0.3 μm/min; Mid Group: dD/dt is between –0.3 μm/min and 0.3 μm/min; and Late Group: dD/dt>0.3 μm/min. (g) dD/dt as a function of aligned starting time as defined in (e). Note that there is no positive correlation between dD/dt and the stage of stimulation among Early Group or Mid Group embryos.
Figure 4—figure supplement 2
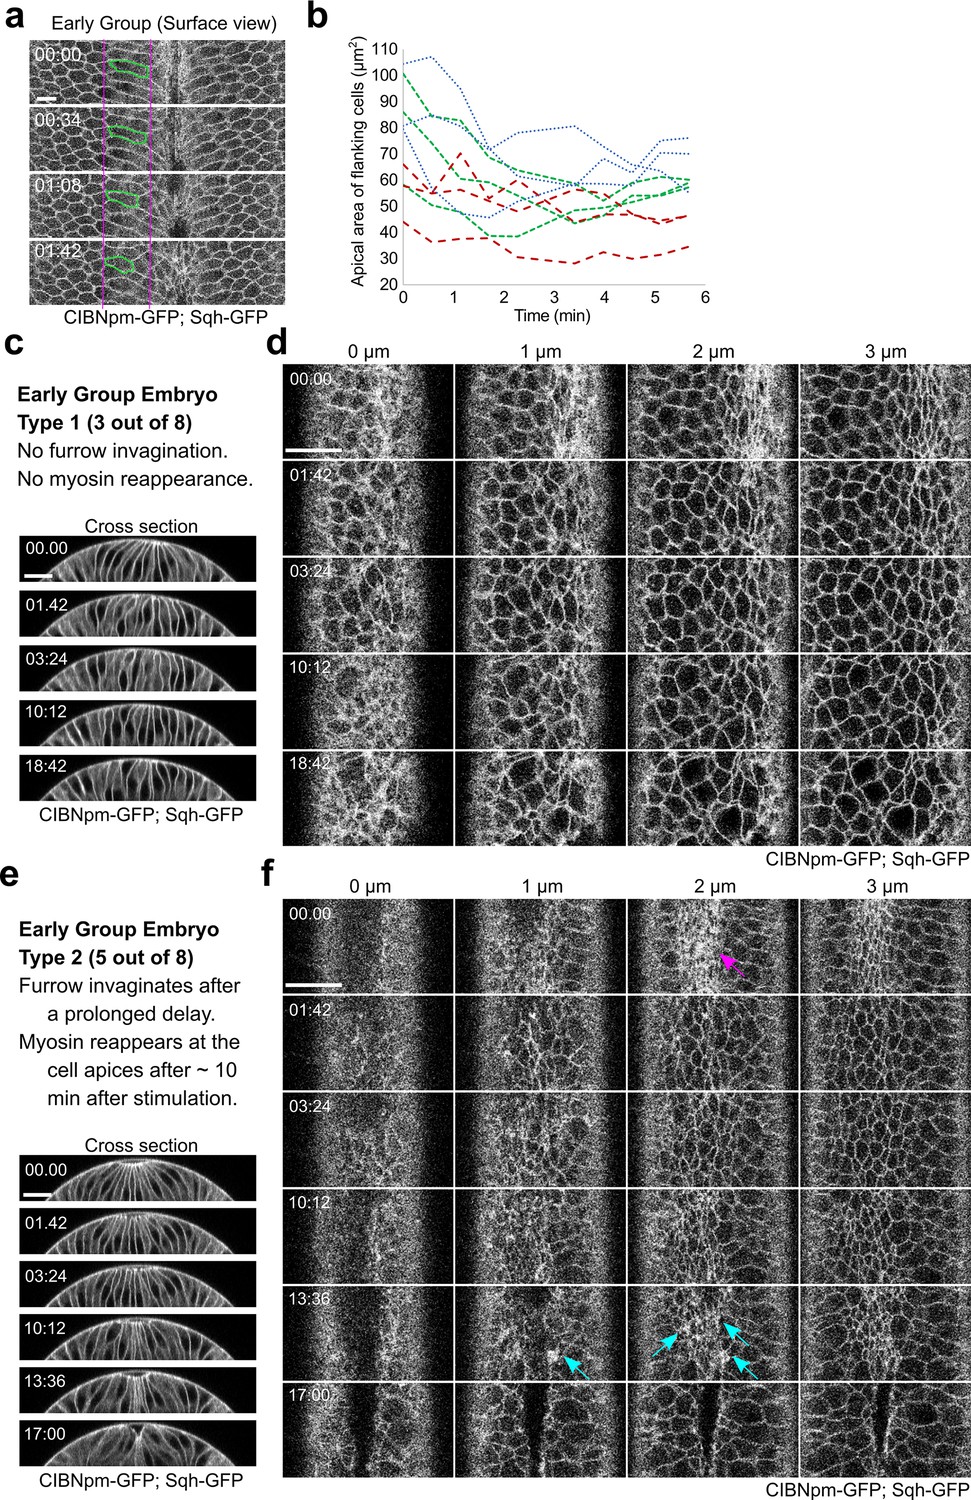
Tissue response to acute myosin inhibition in Early Group embryos.
(a) Surface view of a representative Early Group embryo showing elastic recoil of apical domain of the flanking non-constricting cells upon activation of Opto-Rho1DN. During apical constriction, the apical domain of the flanking non-constricting cells is stretched by the ventral constricting cells. Upon myosin inhibition, the stretched apical domain relaxes back. One example cell is marked in green. Scale bar: 10 μm. (b) Quantification of apical domain size of the flanking non-constricting cells in three Early Group embryos after stimulation, with three cells measured in each embryo. (c, d) A representative Early Group embryo that remains at the non-constricted configuration after apical relaxation (Early Group Type 1, three out of eight embryos). Images show a combined signal from CIBNpm-GFP (cell membrane) and Sqh-GFP (medial apical). After the initial relaxation of the apical domain, the apical cell area becomes progressively heterogeneous, but no net apical constriction occurs. Ventral cells remain at the surface of the embryo without forming a furrow. (e, f) A representative Early Group embryo that undergoes ventral furrow invagination after a prolonged delay (Early Group Type 2, five out of eight embryos). In these embryos, Sqh-GFP partially reaccumulates at the cell apices, which becomes obvious approximately 10 min after the first stimulation (cyan arrows in (f)). The reaccumulated myosin has a lower level and more heterogeneous distribution compared to the same embryo before stimulation (magenta arrow in (f)). Nevertheless, accompanying with the reaccumulation of apical myosin, the ventral cells invaginate and form a ventral furrow. Scale bars: 20 μm. In all panels, time zero corresponds to the time of first stimulation.
Figure 4—figure supplement 3
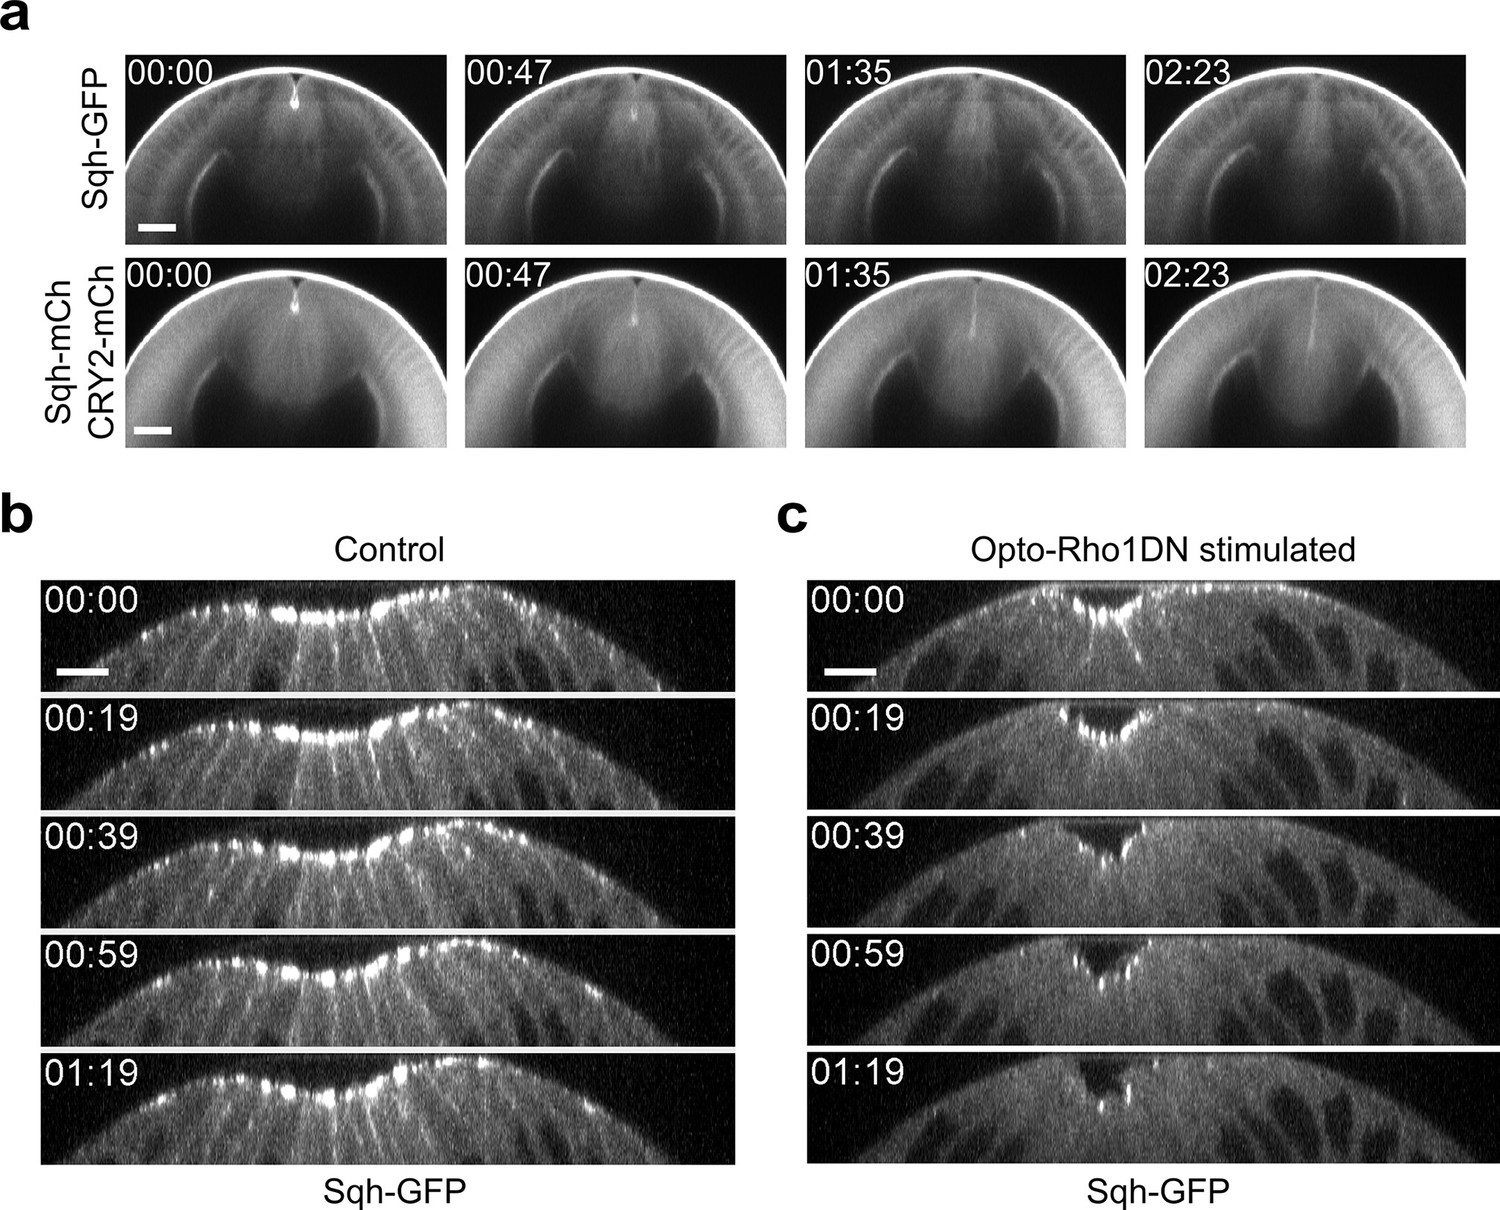
Dissociation of myosin from both apical and lateral cell cortices in constricting cells upon Opto-Rho1DN stimulation.
(a) Cross-section views of a representative Late Group embryo showing prompt dissociation of apical myosin from the apical cortex (N=4 embryos). The embryo expresses CIBNpm instead of CIBNpm-GFP to allow better visualization of Sqh-GFP. Sqh-GFP is accumulated at the apical cortices before stimulation but disappears from the apical cortices in less than 1.6 min. Sqh-mCherry and mCherry-tagged CRY2-Rho1DN signals in the same embryo are shown at the lower panel for comparison. Time zero corresponds to the time of stimulation. Scale bars: 20 μm. (b, c) Cross-section views of a control embryo expressing Sqh-GFP and CIBNpm (b) and an embryo expressing Sqh-GFP, CIBNpm, and CRY2-Rho1DN (c). In control embryos, lateral myosin appears during apical constriction and can always be detected as constriction proceeds (N=8 embryos). In contrast, in embryos expressing Opto-Rho1DN, lateral myosin disappears within 20 s after stimulation, faster than the loss of apical myosin (N=6 embryos). Scale bars: 10 μm.
Figure 4—video 1
Stage-dependent response to acute myosin inhibition during ventral furrow formation.
In Early Group embryos, the apically constricting cells relax immediately as myosin dissociates from the cortex, causing the disappearance of the initial apical indentation. In Mid Group embryos, no obvious relaxation occurs, but ventral furrow invagination is paused for approximately 5 min before invagination resumes. In Late Group embryos, furrow invagination proceeds at a normal speed without obvious pause or tissue relaxation after stimulation. In all cases, apical myosin disappears 60–90 s after stimulation.
Figure 5 with 1 supplement
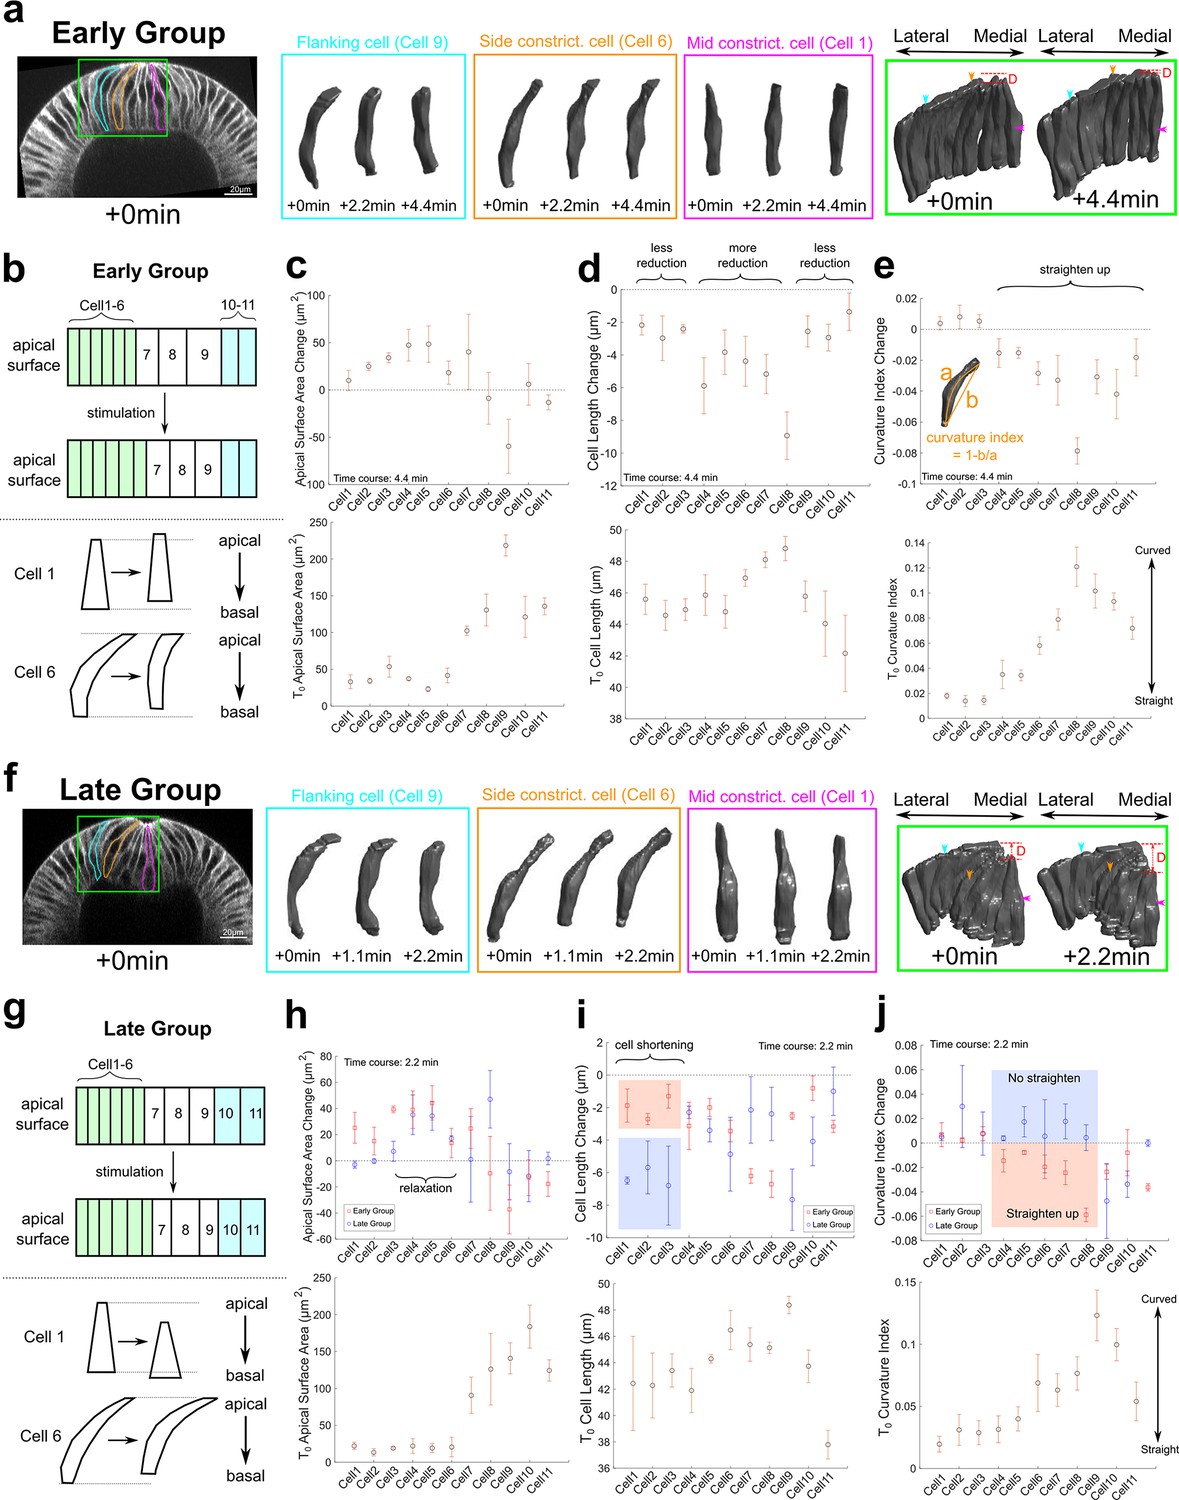
Three-dimensional segmentation reveals details of cell response after Opto-Rho1DN stimulation.
(a–e) Early Group embryos and (f–j) Late Group embryos. (a, f) A row of cells along the medial-lateral axis on one side of the ventral midline was segmented in 3D (green box) over time after stimulation. Cells 1–6: constricting cells; Cells 7–9: flanking cells; Cells 10 and 11: ectodermal cells. Early Group: T=0, 2.2, and 4.4 min. Late Group: T=0, 1.1, and 2.2 min. 3D rendering of three representative cells, cell 1 (mid constricting cell), cell 6 (side constricting cell), and cell 9 (flanking cell), are shown in magenta, orange, and cyan boxes, respectively. These cells are also marked on the cross-section views (outlines) and the 3D tissue renderings (arrowheads) with the same color code. D: invagination depth. (b, g) Cartoon depicting apical surface area change (top) and characteristic cell shape changes (bottom) observed in Early Group (b) and Late Group (g) embryos. (c–e, h–j) Upper panels: quantifications showing the apical surface area change (c, h), cell length change (d, i), and cell curvature change (e, j) between 0 and 4.4 min (c–e) or between 0 and 2.2 min (h–j). Measurements from both Early and Late Groups are shown in (h-j) for comparison. Bottom panels show the measurements for each quantity immediately after stimulation (T=0). Error bars: ±s.e. N=3 embryos for each group.
Figure 5—figure supplement 1
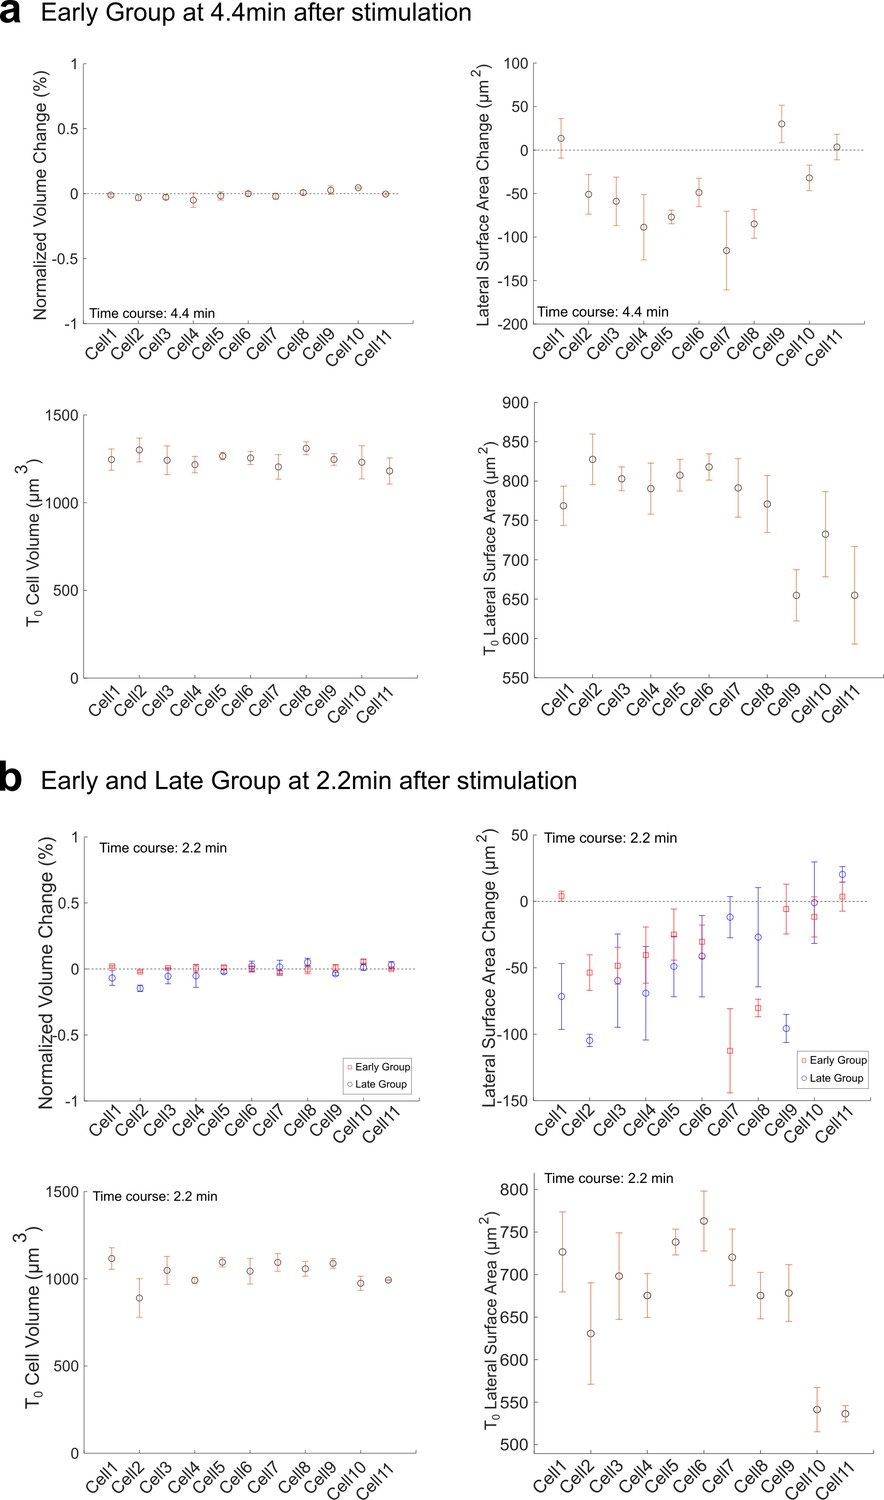
Volume conservation and lateral surface change in Early (a) and Late (b) Group embryos after Opto-Rho1DN stimulation.
Top panels: Volume change and lateral surface change between 0 and 4.4 min or between 0 and 2.2 min after stimulation. Measurements from both Early and Late Groups are shown in (b) for comparison. Bottom panels: Initial volume and lateral surface area immediately after stimulation (T=0) in both groups. The change of volume is normalized to the initial cell volume at T=0.
Figure 6 with 2 supplements
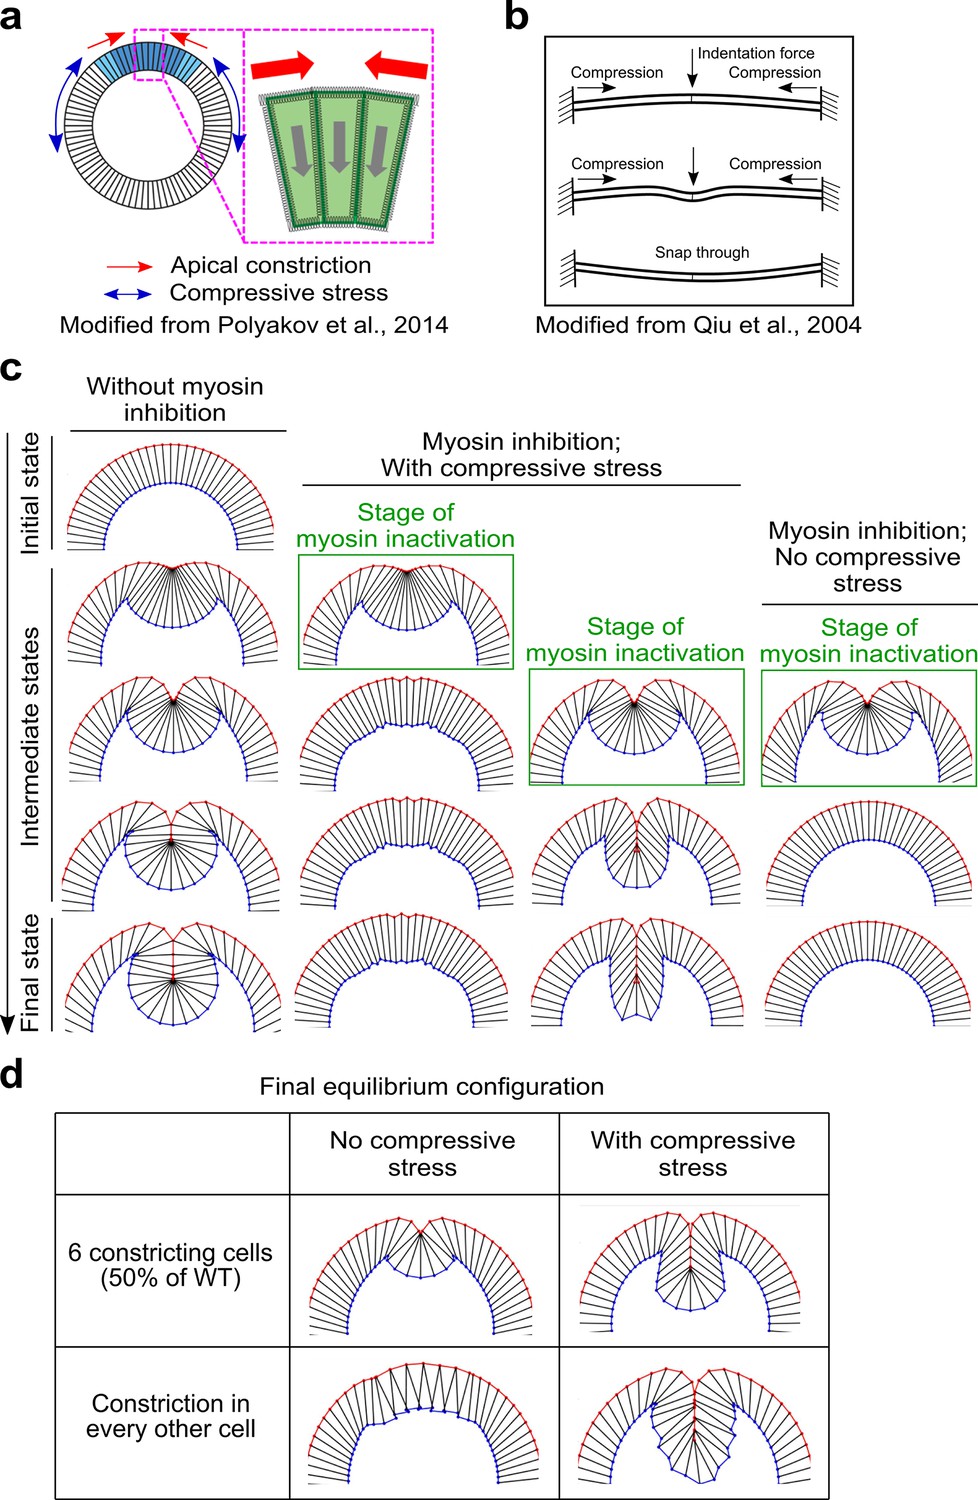
Mechanical bistability of the mesoderm during gastrulation can arise from ectoderm-derived compressive stresses.
(a) 2D vertex model testing the mechanisms of mechanical bistability of the mesoderm during gastrulation. In this model, the apical, lateral, and basal cortices of cells are modeled as elastic springs that resist deformations, the cell interiors are non-compressible, and the only two active energy inputs are apical constriction in the mesoderm (blue cells) and in-plane compression generated by the ectoderm (white cells). (b) Buckling of a compressed elastic beam triggered by a transverse indentation force. (c) The model recapitulates the bipartite response to acute loss of actomyosin contractility only when the in-plane compression is present. Column 1 shows normal ventral furrow formation. Columns 2–4 show tissue response when apical constriction is inhibited at different stages of ventral furrow formation with or without ectodermal compression. (d) Model predictions on the impact of reducing the width of apical constriction domain or the uniformity of apical constriction on final invagination depth. In the presence of compressive stress, final invagination depth becomes less sensitive to perturbations of apical constriction.
-
Figure 6—source data 1
Computer code for the energy minimization-based vertex model for ventral furrow formation.
- https://cdn.elifesciences.org/articles/69082/elife-69082-fig6-data1-v2.zip
Figure 6—figure supplement 1
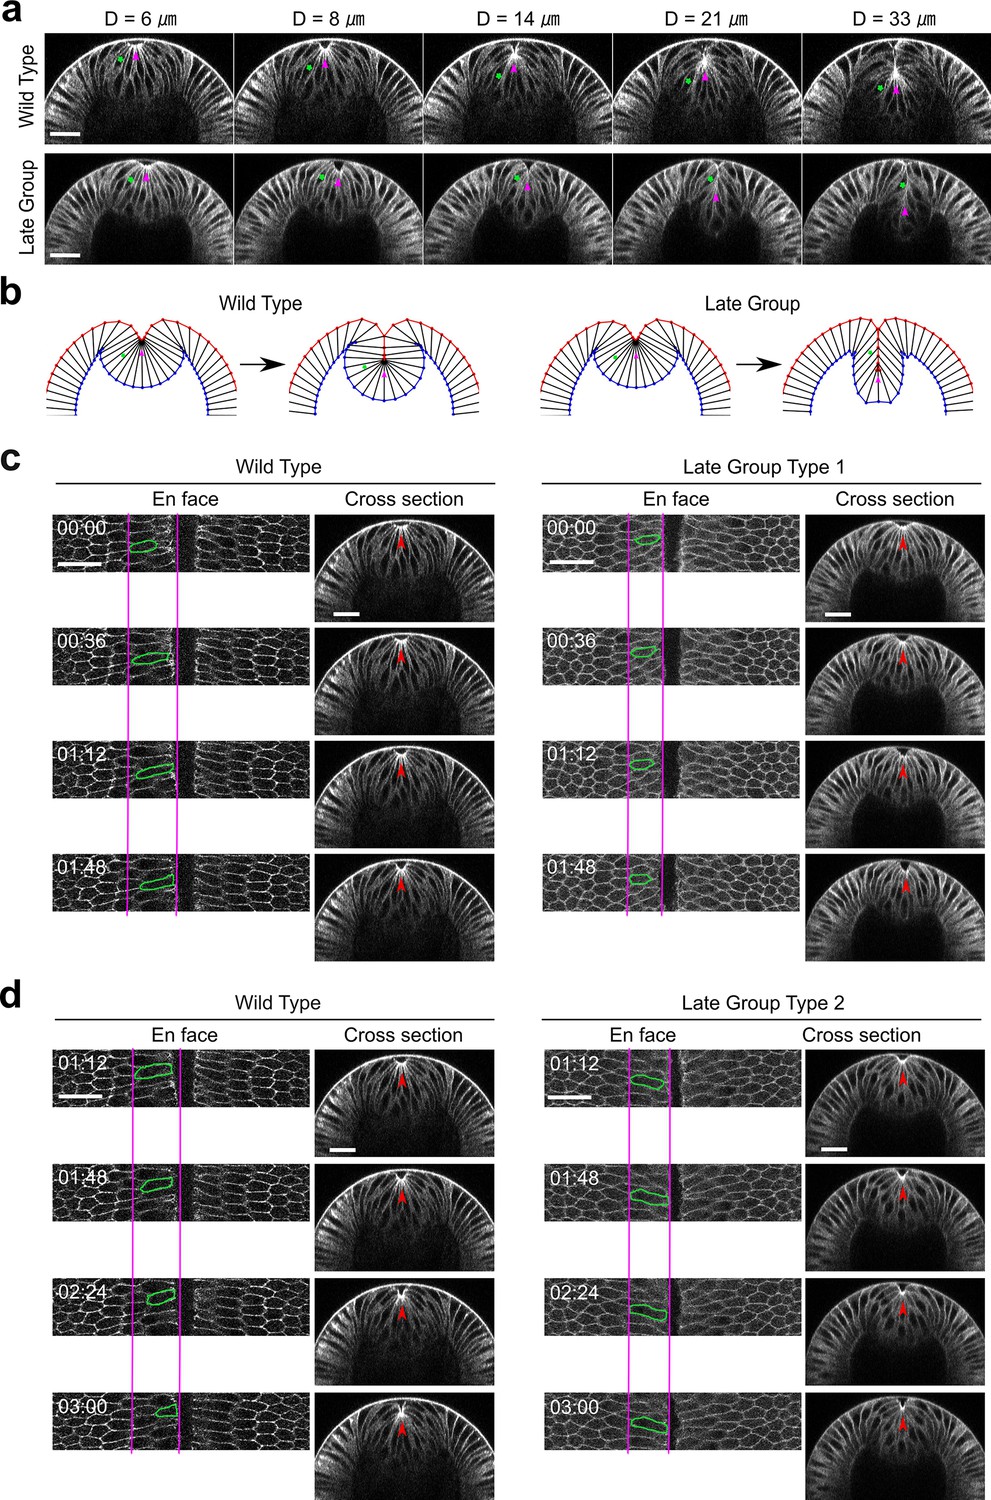
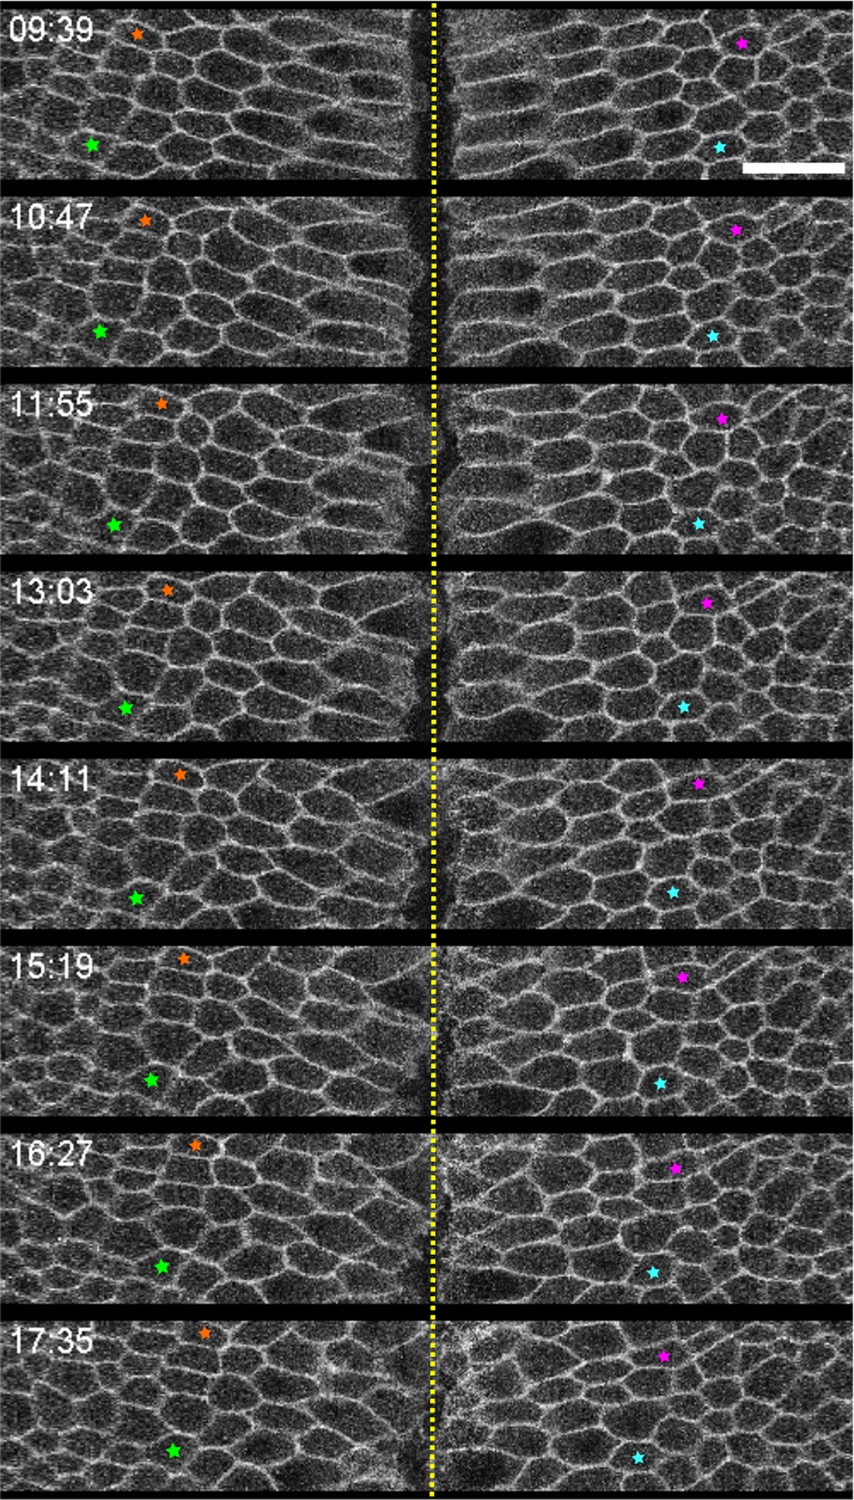
Myosin inhibition in Late Group embryos results in fewer cells incorporated into the ventral furrow.
(a) Selected constricting cells (green stars) located near the boundary of the apical constriction domain are tracked over time in a wild-type embryo and a Late Group embryo. Magenta arrowheads indicate the apex of the ventral most cells. In both embryos, the tracked cells start at similar location. However, in the fully invaginated configuration, the cell in the Late Group embryo is located closer to the surface of the embryo compared to that in the wild-type embryo, suggesting that fewer cells are incorporated into the furrow (N=6 embryos). Note that the reduction in the number of cells incorporated into the furrow does not affect the rate of D increase over time. Scale bars: 25 μm. (b) The phenotype in furrow morphology is well recapitulated in the simulated Late Group embryo presented in Figure 6. (c, d) Behavior of the flanking non-constricting cells in Late Group embryos. Representative cells are outlined in green. Red arrowheads indicate the apex of the ventral most cells. (c) After stimulation, the flanking cells in Late Group embryos that have shallower Ds (i.e., embryos that just pass Ttrans; Late Group Type 1, N=2 embryos) show mild apical retraction. For comparison, in the stage-matched wild-type embryos, the flanking cells continue to move ventrally. (d) After stimulation, the flanking cells in Late Group embryos with deeper Ds (i.e., embryos that are more advanced in the invagination process, Late Group Type 2, N=4 embryos) show no apical relaxation, but their ventral movement is slower than those in the stage-matched wild-type embryos. Despite these differences, the rate of furrow invagination is comparable between Late Group embryos and wild-type embryos. Scale bars: 25 μm.
Figure 6—figure supplement 2
Lack of AP movement in Late Group embryos during ventral furrow invagination.
Four ectodermal cells near the ventral furrow were indicated in a Late Group embryo. No obvious AP movement was observed, which is consistent with the notion that ventral furrow invagination in Late Group embryos is not attributed to germband extension. Shown is a representative embryo of six Late Group embryos analyzed. Time zero corresponds to the onset of gastrulation. Scale bars: 20 μm.
Figure 7
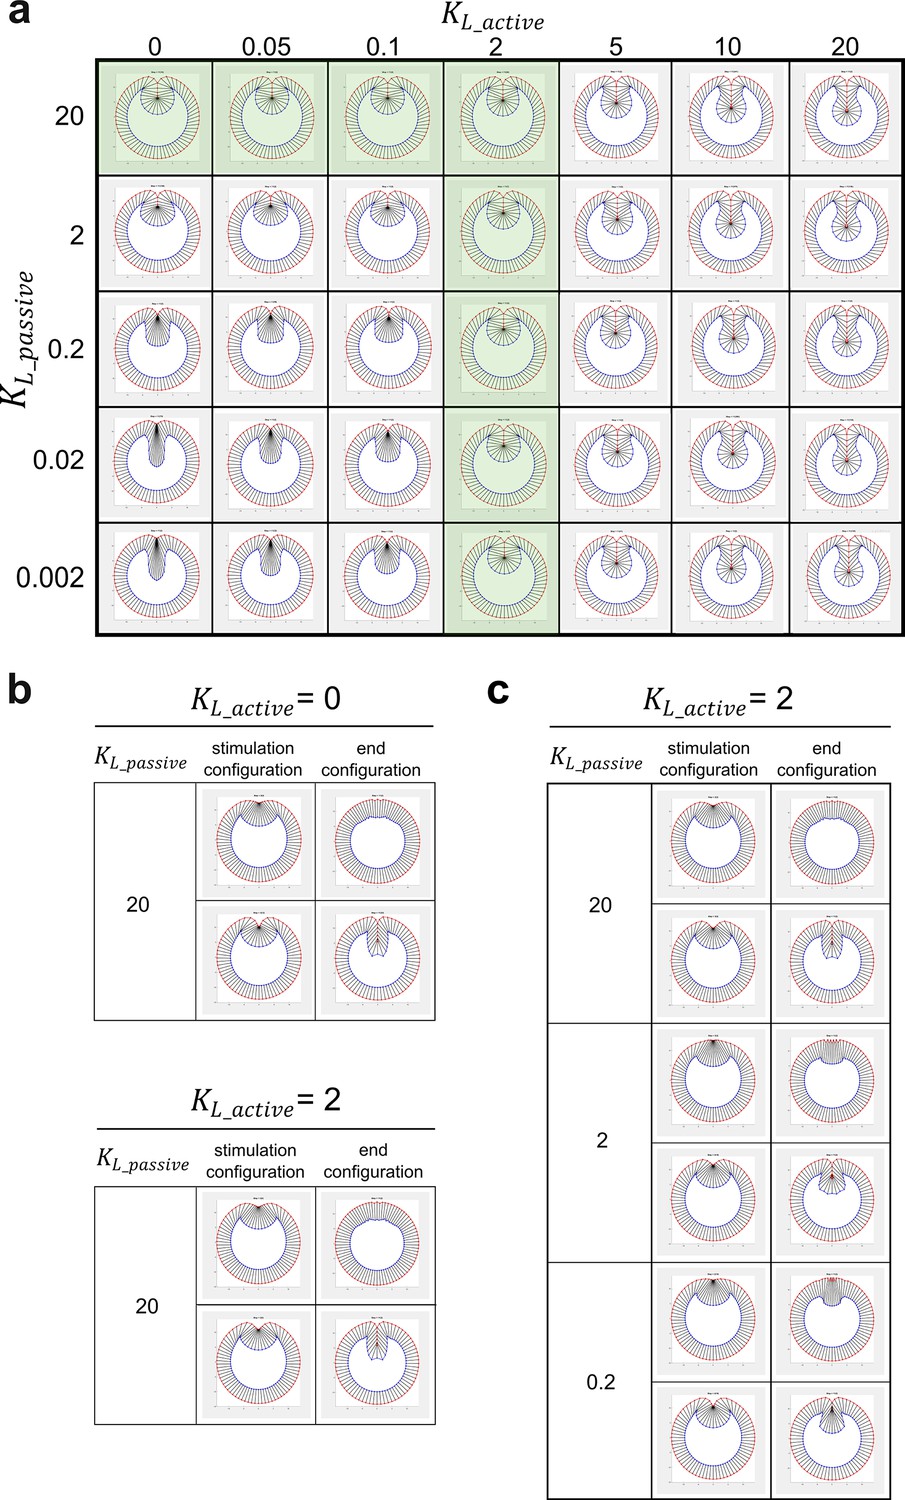
Modeling analysis of the impact of myosin-dependent and myosin-independent cell shortening forces in the constriction domain on binary tissue response.
(a) The myosin-dependent, active lateral shortening forces and myosin-independent, passive lateral shortening forces function additively to mediate cell shortening and furrow invagination in the 2D vertex model. The active and passive lateral forces are given by and , respectively, where and are the current and the resting length of the lateral edge, respectively. Green shaded region represents the conditions where the model generates normal final furrow morphology. (b) When , changing has little impact on the binary response of the model to stimulation. (c) When , changing does not affect the binary tissue response per se but influences the final morphology after stimulation.
Figure 8 with 3 supplements
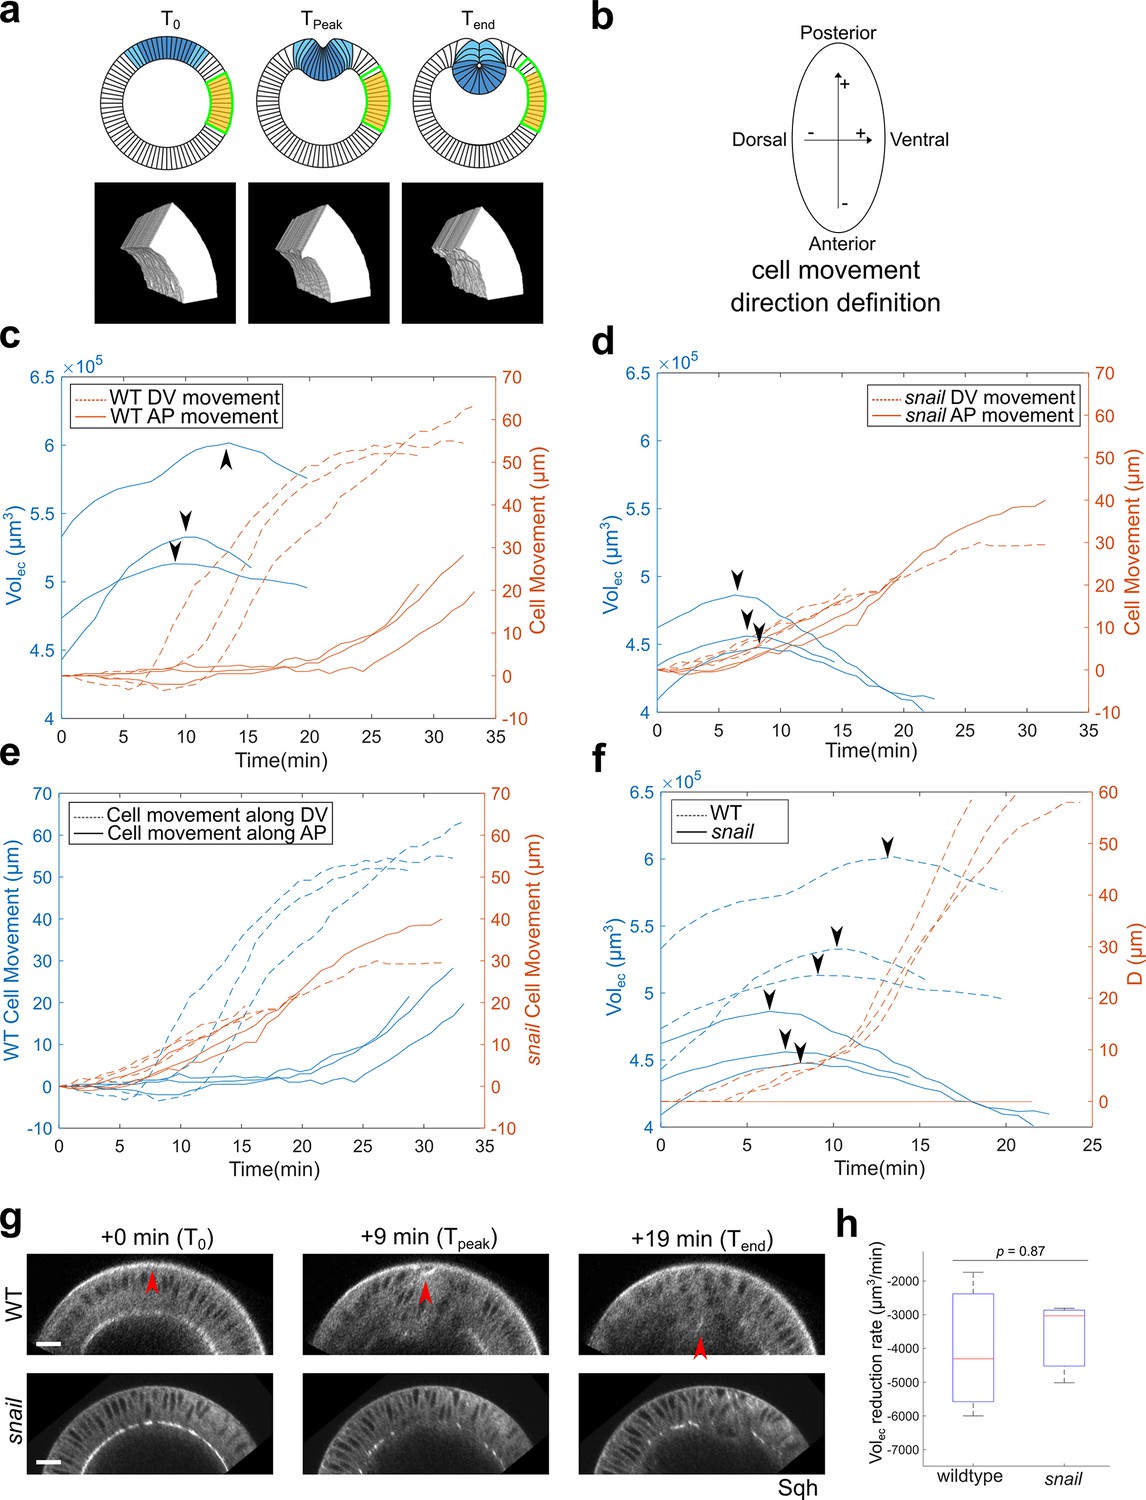
The lateral ectoderm undergoes apical-basal shortening during gastrulation independently of ventral furrow formation.
(a) Top: cartoon showing a cross-section view of an embryo. Blue: mesoderm. Yellow: segmented ectoderm region (ROI). Green: the same group of ectoderm cells. The ROI (in 3D) covers the lateral ectodermal region that is 60°–120° away from the ventral midline and 75-μm long along the AP axis. The change in the volume of ROI (Volec) is used as a readout for change in average tissue thickness. Bottom: representative segmented 3D views showing the ectoderm at the onset of apical constriction (T0), reaches the thickest point (Tpeak) and at the last time frame of ventral furrow formation that is reliably segmented (Tend). (b) Definition for the direction of cell movement used in (c–f). (c, d) Change in Volec over time and cell movement along A-P and D-V axis in wild-type (c) and snail mutant embryos (d). Arrowheads indicate the start of ectoderm shortening. (e) Cell movement along A-P and D-V axis in wild-type and snail mutants are replotted together for better comparison. (f) Change in Volec and invagination depth D over time in wild-type and snail mutant embryos. Arrowheads indicate the start of ectoderm shortening. (g) Representative cross-section views showing the wild-type and snail mutant embryos at T0, Tpeak, and Tend, respectively. Arrowheads indicate the apex of the mid constricting cells. N=3 embryos for each genotype. Scale bars: 20 μm. (h) Comparison of the ectoderm volume reduction rate between the wild-type and snail mutant embryos. The descending part of the volume curve was fitted into a straight line to calculate the rate of volume reduction.
Figure 8—figure supplement 1
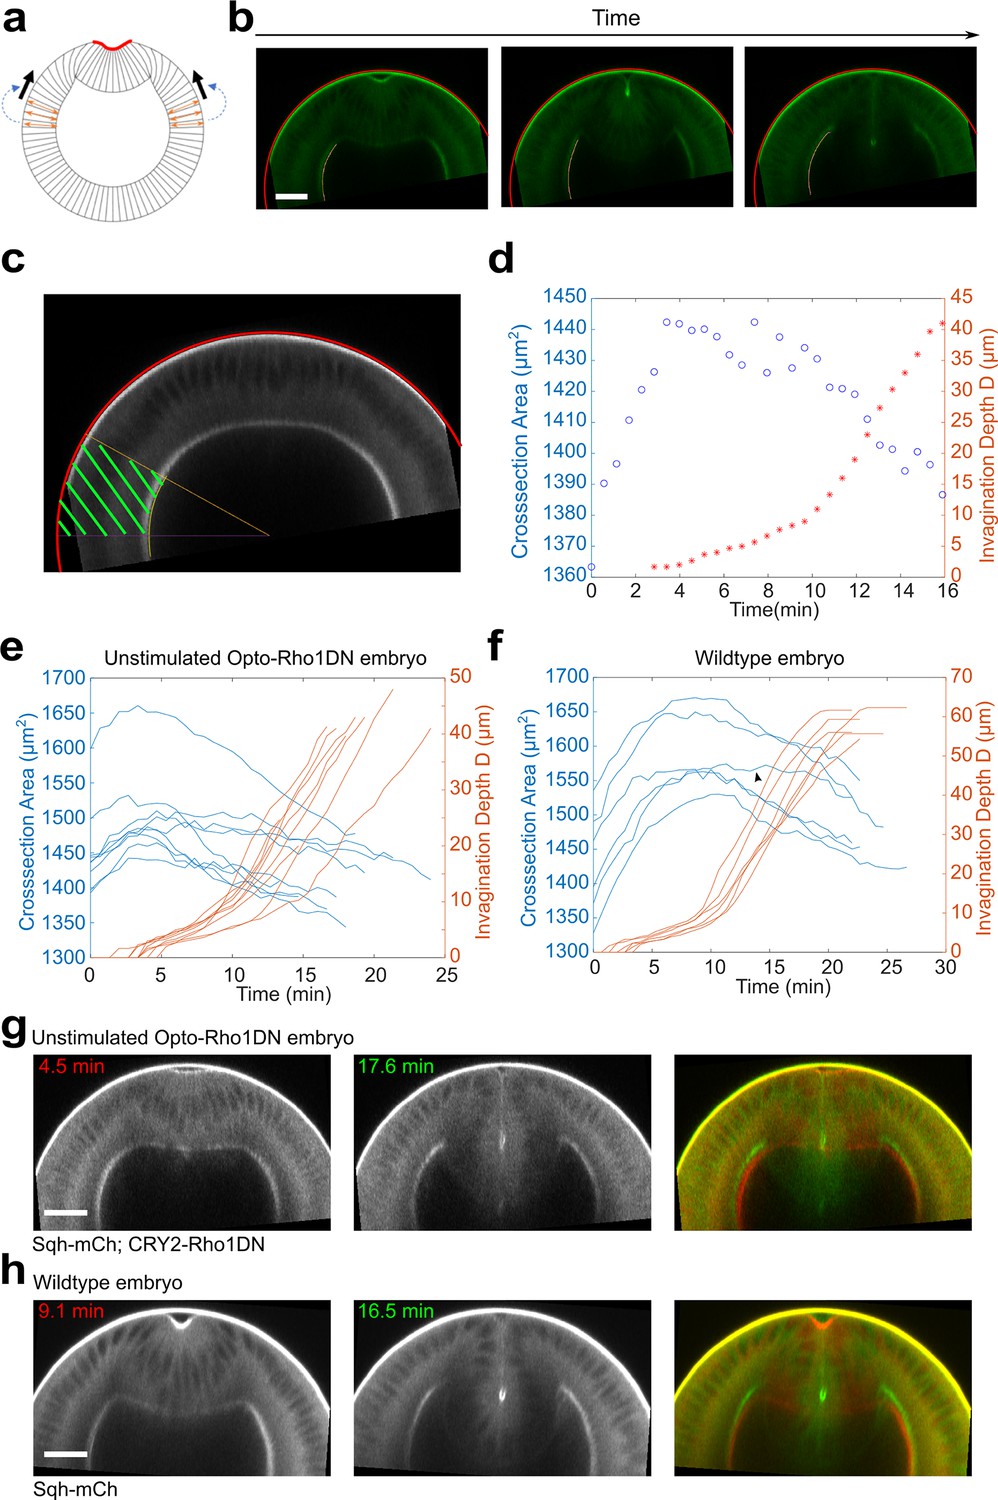
Lateral ectoderm undergoes apical-basal shortening during ventral furrow formation.
(a) Cartoon depicting a possible link between ectodermal shortening and the generation of compressive stress. Because the cytoplasm is non-compressible, apical basal shortening of the ectodermal cells could lead to cell expansion in the planar direction, thereby generating in-plane compression that facilitates mesoderm invagination. (b) Images show the tracked apical (red) and basal (yellow) surfaces of the lateral ectoderm during furrow formation. (c) The ectodermal region in the cross-section view between 60° and 90° from the ventral midline was selected for area measurement (‘cross-section area,’ green shaded region). (d) Relationship between ectodermal tissue area and invagination depth D in a representative unstimulated Opto-Rho1DN embryo. Ectodermal tissue shortening happens prior to TL-S trans. T=0 min represents the onset of apical constriction. (e, f) Time evolution of the invagination depth D (orange lines) and the cross-section area of the lateral ectodermal tissue (blue lines) measured in unstimulated Opto-Rho1DN embryos ((e), N=9 embryos) and in wild-type embryos expressing Ecad-GFP and Sqh-mCherry ((f), N=6 embryos). In unstimulated Opto-Rho1DN embryos, the onset of ectodermal shortening is consistently earlier than TL-S trans. A similar trend is observed in most (five out of six) wild-type embryos, although the onset of ectodermal shortening was overall closer to TL-S trans in this background. In one out of six wild-type embryos, ectodermal shortening only became obvious at a late stage of furrow invagination (arrowheads in (f)). (g, h) Cross-section views of representative unstimulated Opto-Rho1DN embryo (g) and wild-type embryo (h) at early and late stages of furrow formation. Overlayed images highlight the reduction of ectodermal thickness. Scale bars: 25 μm.
Figure 8—figure supplement 2
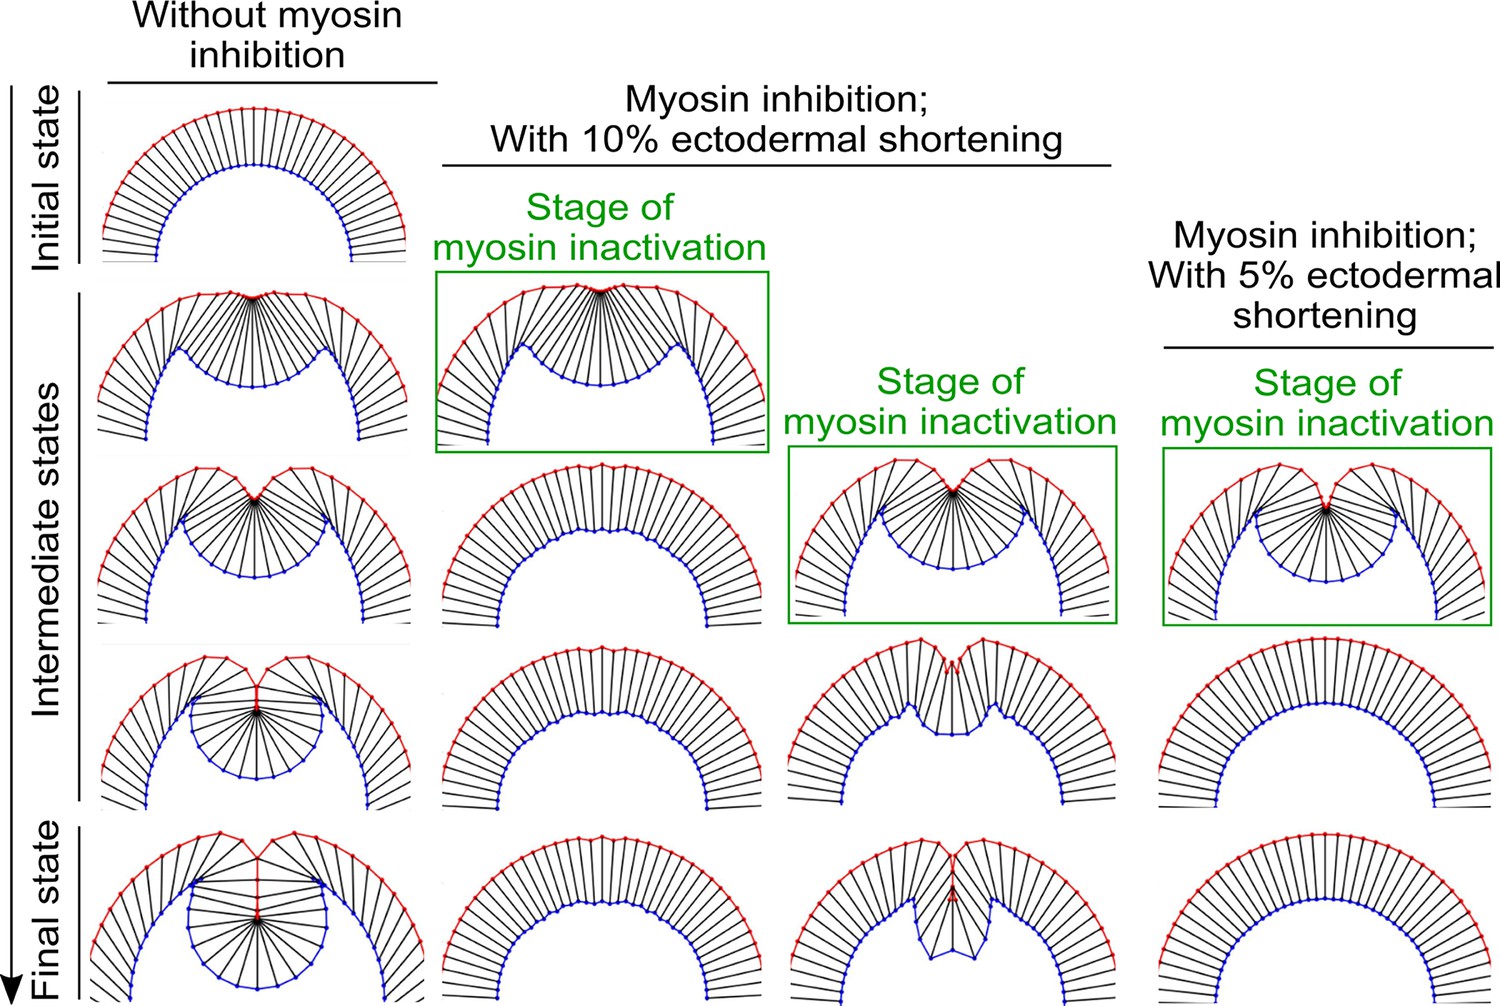
The impact of altering the extent of ectodermal shortening on the response of the model to acute myosin inhibition.
When the percent reduction of the ectodermal cell length is lowered from 20% to 10%, the binary response to acute myosin inhibition is still present, although the final depth of the furrow in the simulated Late Group embryo is reduced. Further lowering the percent reduction of the ectodermal cell length to 5% abolishes the binary response—in this case, the intermediate furrow always relaxes back to the surface of the embryo after myosin inhibition regardless of the stage of stimulation.
Figure 8—figure supplement 3
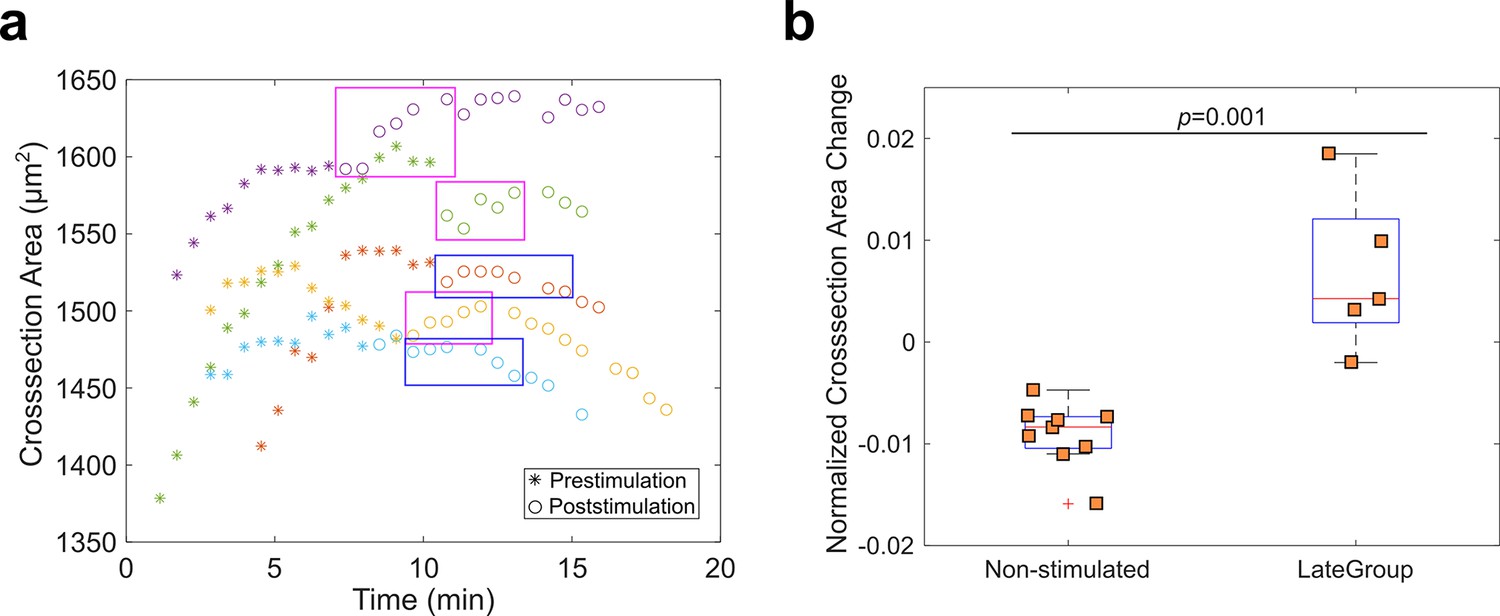
Measurement of ectoderm cross-section area in Late Group embryos.
(a) To examine whether Rho1 inhibition influences ectodermal shortening, we measured the ectoderm cross-section area as a proxy of the ectodermal cell length (ectoderm thickness) for Late Group embryos. T0 is the onset of apical constriction. Each color is one Late Group embryo. In three out of five Late Group embryos, Opto-Rho1DN stimulation resulted in a slight increase in ectoderm thickness (magenta boxes). This increase is both mild and transient, and the trend of change in thickness rapidly resumed the pre-stimulation pattern (in 2–3 min). In the remaining two out of five Late Group embryos, Opto-Rho1DN stimulation did not have an obvious impact on ectoderm thickness (blue boxes). (b) Relative change of ectoderm cross-section area in non-stimulated control embryos and Late Group embryos. Shown is percent ectoderm area change within a 1.7-min duration, either immediately after stimulation (Late Group embryos) or after the maximal ectoderm area was reached (non-stimulated control embryos). Each data point represents one embryo. Wilcoxon rank-sum test is used for statistical comparison. The observed impact of Opto-Rho1DN stimulation on ectoderm thickness change was both mild and transient even though Rho1 inhibition was persistent, suggesting that Rho1 inhibition did not directly impact ectodermal shortening. Instead, the observed effect is likely to be an indirect consequence of the mild tissue relaxation near the constriction domain upon Rho1 inhibition (cell 9 in Figure 5f – j; Figure 6—figure supplement 1; data not shown).
Figure 9

Lateral ectodermal cells still move ventrally in Early Group embryos when the ventral cells undergo apical relaxation upon Opto-Rho1DN stimulation.
(a) Montage showing the surface view of an Early Group embryo during the first 6 min after stimulation (T=0). Yellow dashed line depicts ventral midline. Despite the tissue relaxation in the ventral region of the embryo (green and cyan dots), the ectodermal cells continue to move toward the ventral midline. (b) Kymograph generated from the surface view of the same movie as shown in (a). Magenta box indicates the time window where the average velocity of tissue movement is measured. (c) Cross-section view of the same embryo in (a) showing the relaxation of the apical indentation at the ventral side of the embryo. Yellow line: DV axis. (d) Velocity of tissue movement as a function of the initial distance from the ventral midline. N=7 Early Group embryos. (e) Box plot showing the velocity of tissue movement at ventral mesodermal ((ii): from –10 μm to –40 μm, and (iii): from 10 μm to 40 μm) or lateral ectodermal ((i): from –60 μm to –120 μm, and (iv): from 60 μm to 120 μm) regions of the embryo. Statistical analysis testing whether the measured velocities are significantly larger (i, iii) or smaller (ii, iv) than 0 is performed using one-tailed one-sample t-test against 0. p<0.001 for all tests. (f, g) Surface kymograph (f) and cross-section views (g) of embryos expressing Opto-Rho1DN and stimulated at the onset of apical constriction. Yellow line: ventral midline. Ectoderm cells (magenta dots) still move toward ventral midline even though no ventral furrow was formed (g). The left and right panels in (g) show the mCherry and GFP signals from the same embryo. N=3 embryos. T=0 is the onset of apical constriction. All scale bars: 20 μm. (h) Velocity of tissue movement as a function of the initial distance from the ventral midline. N = 3 snail mutant embryos. (i) Box plot showing the velocity of tissue movement at lateral ectodermal regions of the embryo ((i): from –40 μm to –110 μm, and (ii): from 40 μm to 110 μm). Statistical analysis testing whether the measured velocities are significantly larger (i) or smaller (ii) than 0 is performed using one-tailed one-sample t-test against 0. p<0.001 for both tests. (j) Cartoon depicting the proposed model for mechanical bistability of the mesoderm epithelium during gastrulation. Actomyosin-mediated apical constriction is important for the system to transition from the initial state to an intermediate state, whereas the subsequent transition into the final, fully invaginated state is facilitated by ectodermal compression and is insensitive to loss of actomyosin contractility. The presence and potential function of ectodermal compression remain to be tested experimentally.
-
Figure 9—source data 1
Measurements of velocity of tissue movement as a function of the initial distance from the ventral midline in Early Group embryos.
- https://cdn.elifesciences.org/articles/69082/elife-69082-fig9-data1-v2.xlsx
-
Figure 9—source data 2
Measurements of velocity of tissue movement as a function of the initial distance from the ventral midline in Opto-Rho1DN embryos stimulated before gastrulation.
- https://cdn.elifesciences.org/articles/69082/elife-69082-fig9-data2-v2.xlsx
Tables
Key resources table
| Reagent type (species) or resource | Designation | Source or reference | Identifiers | Additional information |
|---|---|---|---|---|
| Genetic reagent (Drosophila melanogaster) | Sqh-GFP | Royou et al., 2002 | ||
| Genetic reagent (D. melanogaster) | Sqh-mCherry | Martin et al., 2009 | ||
| Genetic reagent (D. melanogaster) | E-cadherin-GFP | Oda and Tsukita, 2001 | ||
| Genetic reagent (D. melanogaster) | UASp-P4M-mCherry | Chen and He, 2021 | ||
| Genetic reagent (D. melanogaster) | Utrophin-Venus | Figard and Sokac, 2011 | ||
| Genetic reagent (D. melanogaster) | halo snail/CyO, Sqh-GFP | Martin et al., 2009 | ||
| Genetic reagent (D. melanogaster) | UASp-CIBN-pm-GFP (II) | Guglielmi et al., 2015 | ||
| Genetic reagent (D. melanogaster) | UASp-CIBN-pm (I) | Guglielmi et al., 2015 | ||
| Genetic reagent (D. melanogaster) | UASp-CRY2-Rho1DN -mCherry (III) | This study | See ‘Fly stocks and genetics’ for details | |
| Genetic reagent (D. melanogaster) | UASp-CIBN-pm-GFP; CRY2-Rho1DN | This study | See ‘Fly stocks and genetics’ for details | |
| Genetic reagent (D. melanogaster) | UASp-CIBN-pm; CRY2-Rho1DN | This study | See ‘Fly stocks and genetics’ for details | |
| Genetic reagent (D. melanogaster) | Maternal-Tubulin-Gal4 (67) | Hunter and Wieschaus, 2000 | Maternal-Tubulin-Gal4 on Chromosome II | |
| Genetic reagent (D. melanogaster) | Maternal-Tubulin-Gal4 (15) | Hunter and Wieschaus, 2000 | Maternal-Tubulin-Gal4 on Chromosome III | |
| Genetic reagent (D. melanogaster) | 67; 15 | Hunter and Wieschaus, 2000 | Maternal-Tubulin-Gal4 on II and III | |
| Genetic reagent (D. melanogaster) | 67 Sqh-mCherry; 15 Sqh-GFP | This study | See ‘Fly stocks and genetics’ for details | |
| Genetic reagent (D. melanogaster) | 67 Sqh-mCherry; 15 E-cadherin-GFP | This study | See ‘Fly stocks and genetics’ for details | |
| Genetic reagent (D. melanogaster) | 67 Sqh-GFP; 15 | This study | See ‘Fly stocks and genetics’ for details | |
| Genetic reagent (D. melanogaster) | 67 Sqh-GFP; 15 Sqh-GFP | This study | See ‘Fly stocks and genetics’ for details | |
| Genetic reagent (D. melanogaster) | 67 Sqh-mCherry; 15 Utrophin-Venus | This study | See ‘Fly stocks and genetics’ for details | |
| Genetic reagent (D. melanogaster) | 67 Sqh-GFP; 15 P4M-mCherry | This study | See ‘Fly stocks and genetics’ for details | |
| Recombinant DNA reagent | pTiger | S. Ferguson, State University of New York at Fredonia | Transformation vector containing the attB site and 14 upstream UAS sites | |
| Recombinant DNA reagent | pTiger-CRY2-mCherry-Rho1DN | This study | Transformation construct containing CRY2-mCherry-Rho1DN | |
| Software, algorithm | MATLAB | MathWorks | https://www.mathworks.com/?s_tid=gn_logoRRID:SCR_001622 | |
| Software, algorithm | Fiji | ImageJ | http://fiji.scRRID:SCR_002285 | |
| Software, algorithm | Embryo Development Geometry Explorer (EDGE) | Gelbart et al., 2012 | https://github.com/mgelbart/embryo-development-geometry-explorer, Gelbart, 2018 | |
| Software, algorithm | ilastik | Berg et al., 2019 | https://www.ilastik.org/RRID:SCR_015246 |
Additional files
Download links
A two-part list of links to download the article, or parts of the article, in various formats.
Downloads (link to download the article as PDF)
Open citations (links to open the citations from this article in various online reference manager services)
Cite this article (links to download the citations from this article in formats compatible with various reference manager tools)
Optogenetic inhibition of actomyosin reveals mechanical bistability of the mesoderm epithelium during Drosophila mesoderm invagination
eLife 11:e69082.
https://doi.org/10.7554/eLife.69082


