N501Y mutation of spike protein in SARS-CoV-2 strengthens its binding to receptor ACE2
- State Key Laboratory of Coordination Chemistry, Chemistry and Biomedicine Innovation Center (ChemBIC), School of Chemistry and Chemical Engineering, Nanjing University, China
- Institute of Botany, Jiangsu Province, China
- Chinese Academy of Sciences, China
- State Key Laboratory of Pharmaceutical Biotechnology, School of Life Sciences, Nanjing University, China
- Engineering Research Center of Protein and Peptide Medicine, Ministry of Education, China
Figures
Figure 1
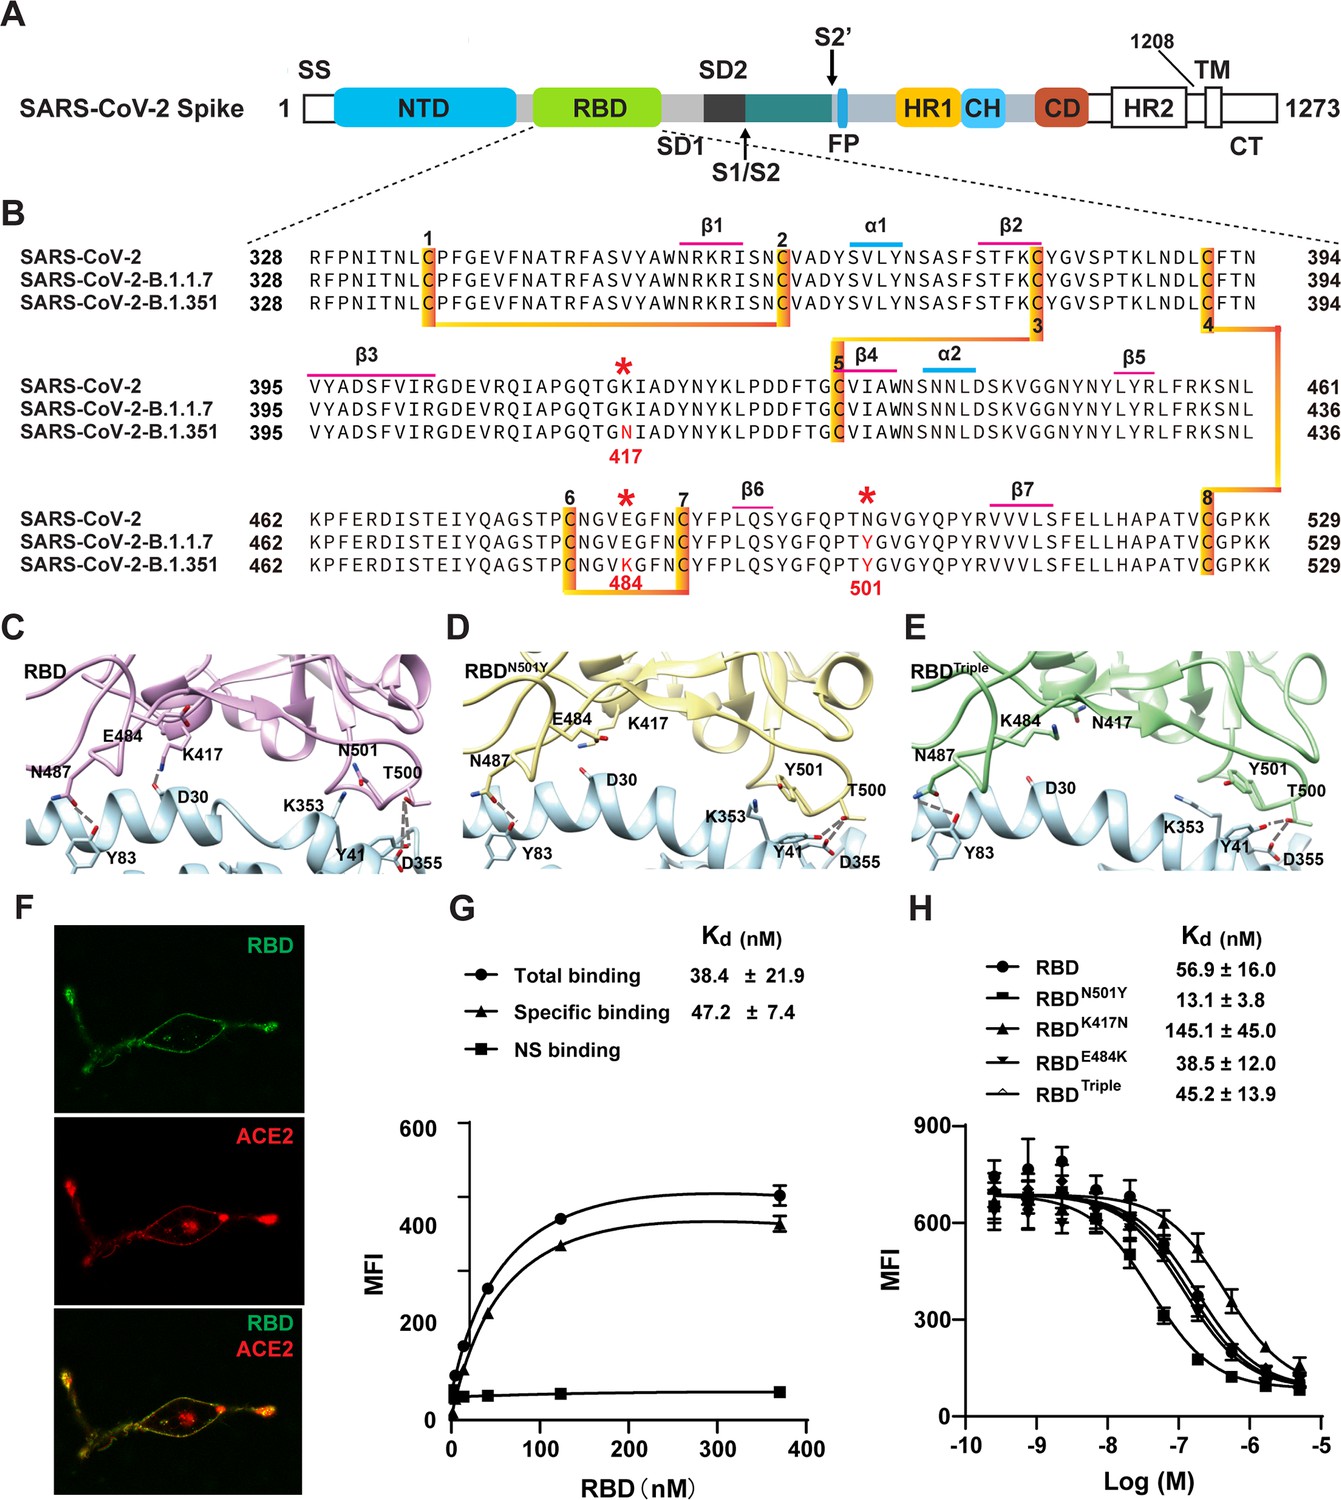
Two SARS-CoV-2 variants bind to ACE2 with higher affinity.
(A) Domain architecture of the SARS-CoV-2 spike monomer. NTD, N-terminal domain; RBD, receptor-binding domain; SD1, subdomain 1; SD2, subdomain 2; FP, fusion peptide; HR1, heptad repeat 1; CH, central helix; CD, connector domain; HR2, heptad repeat 2; TM, transmembrane region; CT, C-terminal. (B) Sequence alignment of RBD from SARS-CoV-2, B.1.1.7, and B.1.351 variant spike proteins. The N501Y, K417N, and E484K mutations are highlighted in red with a *. Cysteines forming disulfide bonds are marked in orange. (C–E) The interface of ACE2 (cyan) in complex with spike RBD from SARS-CoV-2 (violet), B.1.1.7 lineage (yellow), and B.1.351 lineage (green). Residues 501, 500, 417, 487, and 484 from the RBD and the mutant RBD, and the contacting residues from ACE2 (Y41, K353, D355, D30, and Y83) are shown in sticks. Hydrogen bonds are shown in dash lines. (F) Representative images of ACE2–mCherry (red) HEK293 cells stained with 100 nM AlexaFluor488-labeled RBD (green). (G) Saturated binding of AlexaFluor488-labeled RBD to cell-surface ACE2. NS, non-specific. (H) Series-diluted RBD and RBD mutants were incubated with ACE2-expressing cells in the presence of AlexaFluor488-labeled RBD protein (100 nM). Concentrations used for unlabeled RBD and RBD mutants were from 5 μM to 0.25 nM with threefold dilution. Kd values were calculated using the Cheng–Prusoff equation.
-
Figure 1—source data 1
Source cell-surface-binding data used for Figure 1G,H.
- https://cdn.elifesciences.org/articles/69091/elife-69091-fig1-data1-v2.xlsx
Figure 2 with 1 supplement
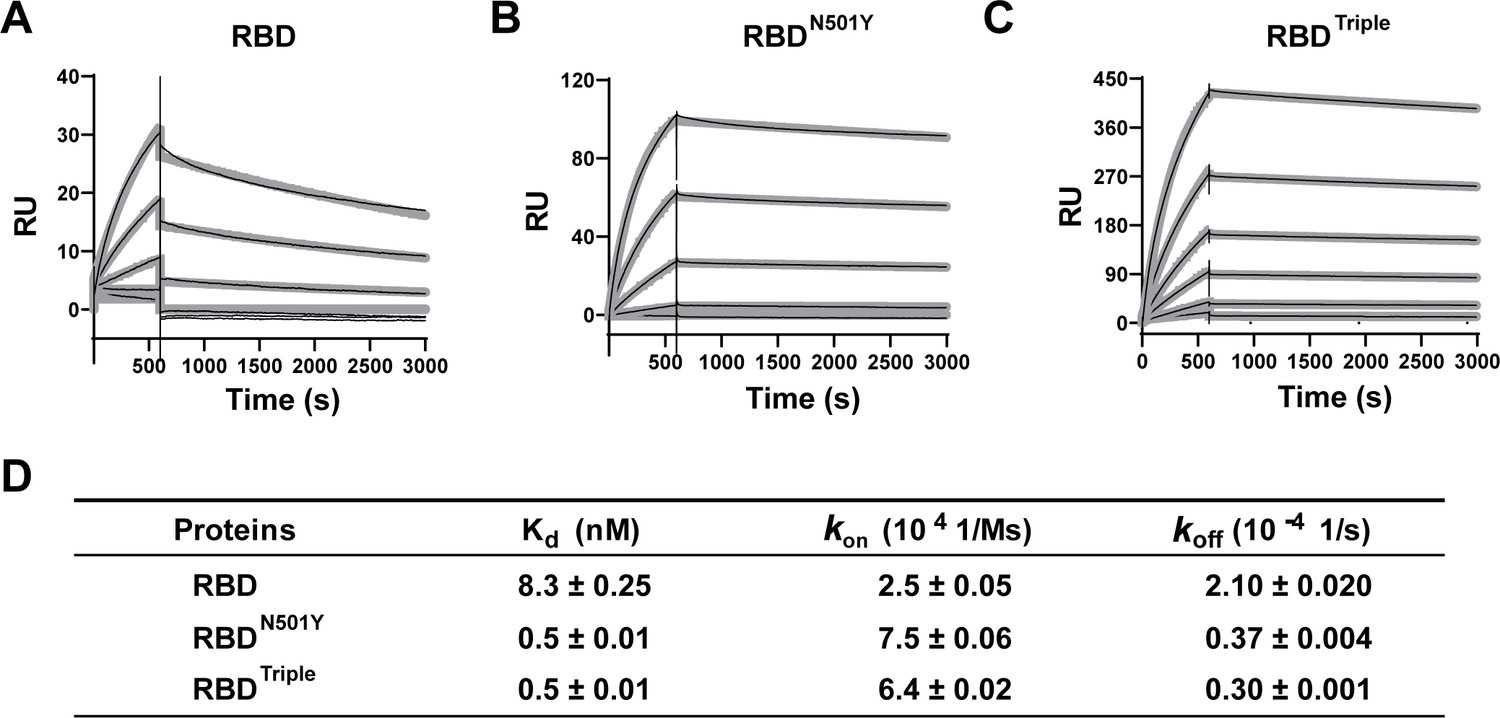
Kinetics of the binding of the receptor-binding domain (RBD) and of RBD mutants to the ACE2 protein.
(A–C) Surface plasmon resonance (SPR) sensorgrams (thin black lines) with fits (thick gray lines). ACE2 protein concentrations of 50, 20, 10, 5, 2, and 1 nM were used. Values were fitted to the 1:1 binding model. (D) Kd and kinetic rates are shown as fit ± fitting error.
-
Figure 2—source data 1
Source data describing the kinetics of each receptor-binding domain (RBD) bound to ACE2 protein used for Figure 2 and Figure 2—figure supplement 1.
- https://cdn.elifesciences.org/articles/69091/elife-69091-fig2-data1-v2.xlsx
Figure 2—figure supplement 1
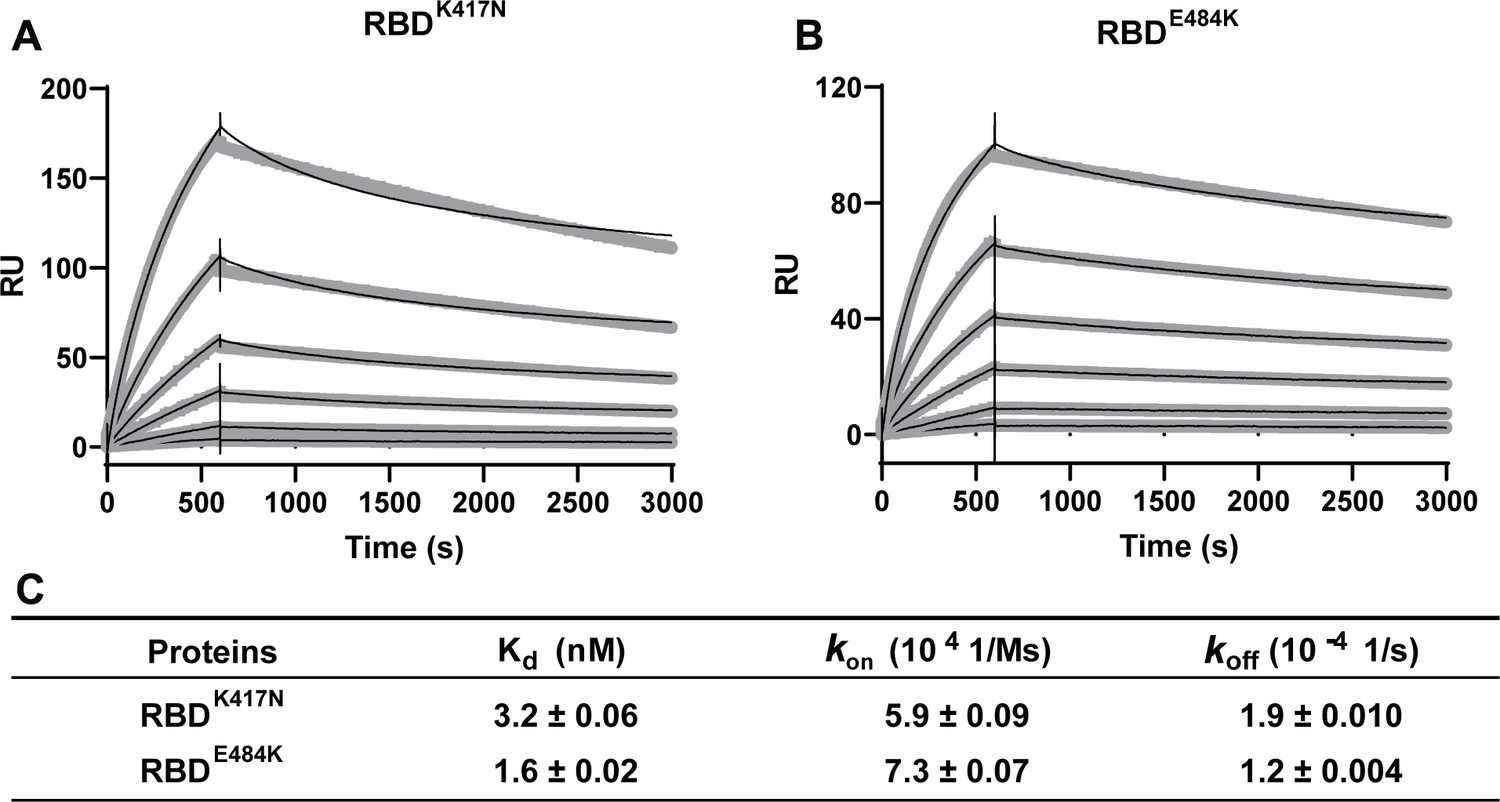
Kinetics of RBDK417N and RBDE484K binding to ACE2 protein.
(A, B) Surface plasmon resonance (SPR) sensorgrams (thin black lines) are shown with fits (thick gray lines). Concentrations used for ACE2 protein were 50, 20, 10, 5, 2, and 1 nM, respectively. Values were fitted to the 1:1 binding model. (C) Kd and kinetic rates are shown as fit ± fitting error.
Figure 3 with 4 supplements
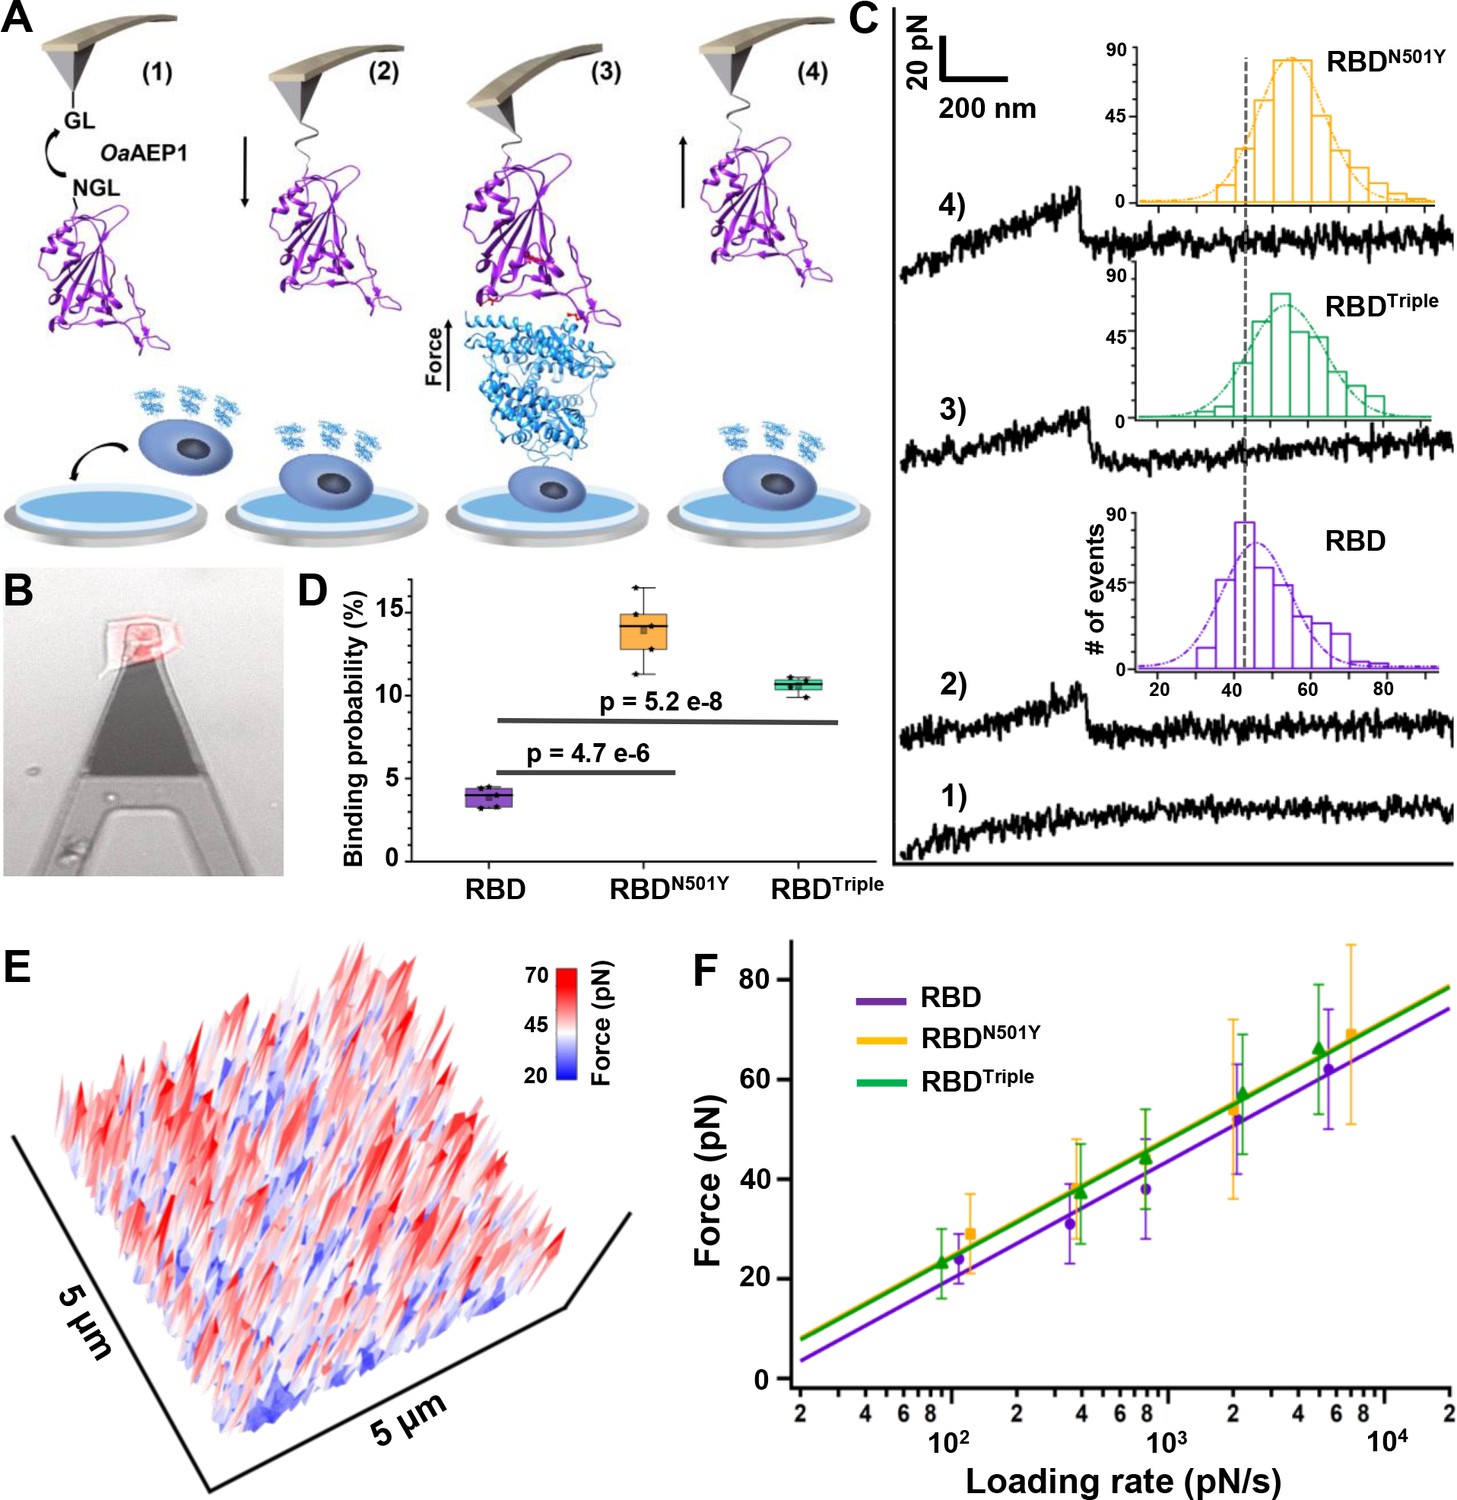
Atomic force microscopy-based single-molecule force spectroscopy (AFM-SMFS) experiment to quantify the strength of binding between the receptor-binding domains (RBDs) and ACE2 in living cells.
(A) Schematic of the AFM-SMFS measurement process showing how the interaction is quantified. RBD with an N-terminal NGL recognition sequence is immobilized on a GL-coated AFM tip by the ligase OaAEP1, which recognizes the two sequences and ligates them to form a peptide bond (1). As the AFM tip approaches the target cell (2), RBD binds to ACE2 (3). Then the tip retracts, and the complex dissociates, leading to an unbinding force peak (4). (B) The reddish ACE2–mCherry-transfected HEK293 cell is measured under the AFM tip by an inverted fluorescent microscope. (C) Representative force-extension curves show no binding event (curve 1) and specific binding events between RBD–ACE2 complexes with an unbinding force peak (curves 2–4). In the force histograms (inset), RBDN501Y and RBDTriple show higher unbinding forces (57 pN and 56 pN) than the RBD (49 pN). (D) Box plot of the specific binding probabilities between the three RBDs and target cells from AFM experiments, indicating a higher binding probability for the two mutants under five different velocities. The box indicates the 25th and 75th percentiles. (E) 3D AFM force mapping of the cell surface showed the unbinding force distribution. (F) A plot of loading rate against the most probable unbinding forces from the complexes showed a linear relationship. The data are fitted to the Bell–Evans model to extract the off-rate.
-
Figure 3—source data 1
Source data for the histograms of unbinding force for different RBD–ACE2 complexes used in Figure 3C and Figure 3—figure supplement 3.
- https://cdn.elifesciences.org/articles/69091/elife-69091-fig3-data1-v2.xlsx
-
Figure 3—source data 2
Binding probabilities for different RBD–ACE2 complexes used for Figure 3D.
- https://cdn.elifesciences.org/articles/69091/elife-69091-fig3-data2-v2.xlsx
-
Figure 3—source data 3
Force mapping results for the different complexes used for Figure 3E and Figure 3—figure supplement 4.
- https://cdn.elifesciences.org/articles/69091/elife-69091-fig3-data3-v2.xlsx
-
Figure 3—source data 4
Loading rates for different RBD–ACE2 complexes used for Figure 3F.
- https://cdn.elifesciences.org/articles/69091/elife-69091-fig3-data4-v2.xlsx
-
Figure 3—source data 5
The spring constant (k) for all 15 cantilevers.
- https://cdn.elifesciences.org/articles/69091/elife-69091-fig3-data5-v2.xlsx
Figure 3—figure supplement 1
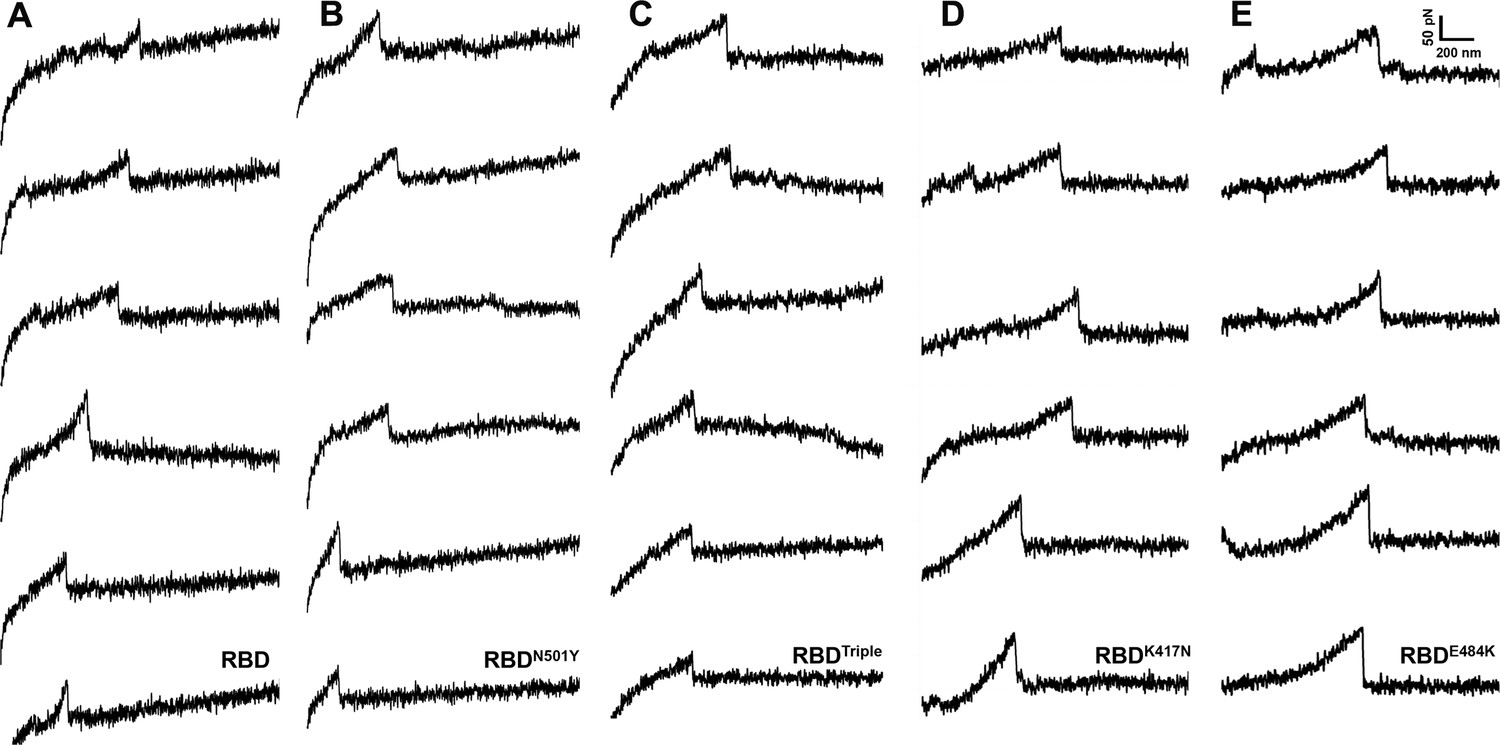
Representative force-extension curves for different RBD–ACE2 complexes involving (A) RBD, (B) RBDN501Y, (C) RBDTriple, (D) RBDK417N, or (E) RBDE484K.
A clear unbinding peak with force higher than 20 pN is present.
Figure 3—figure supplement 2
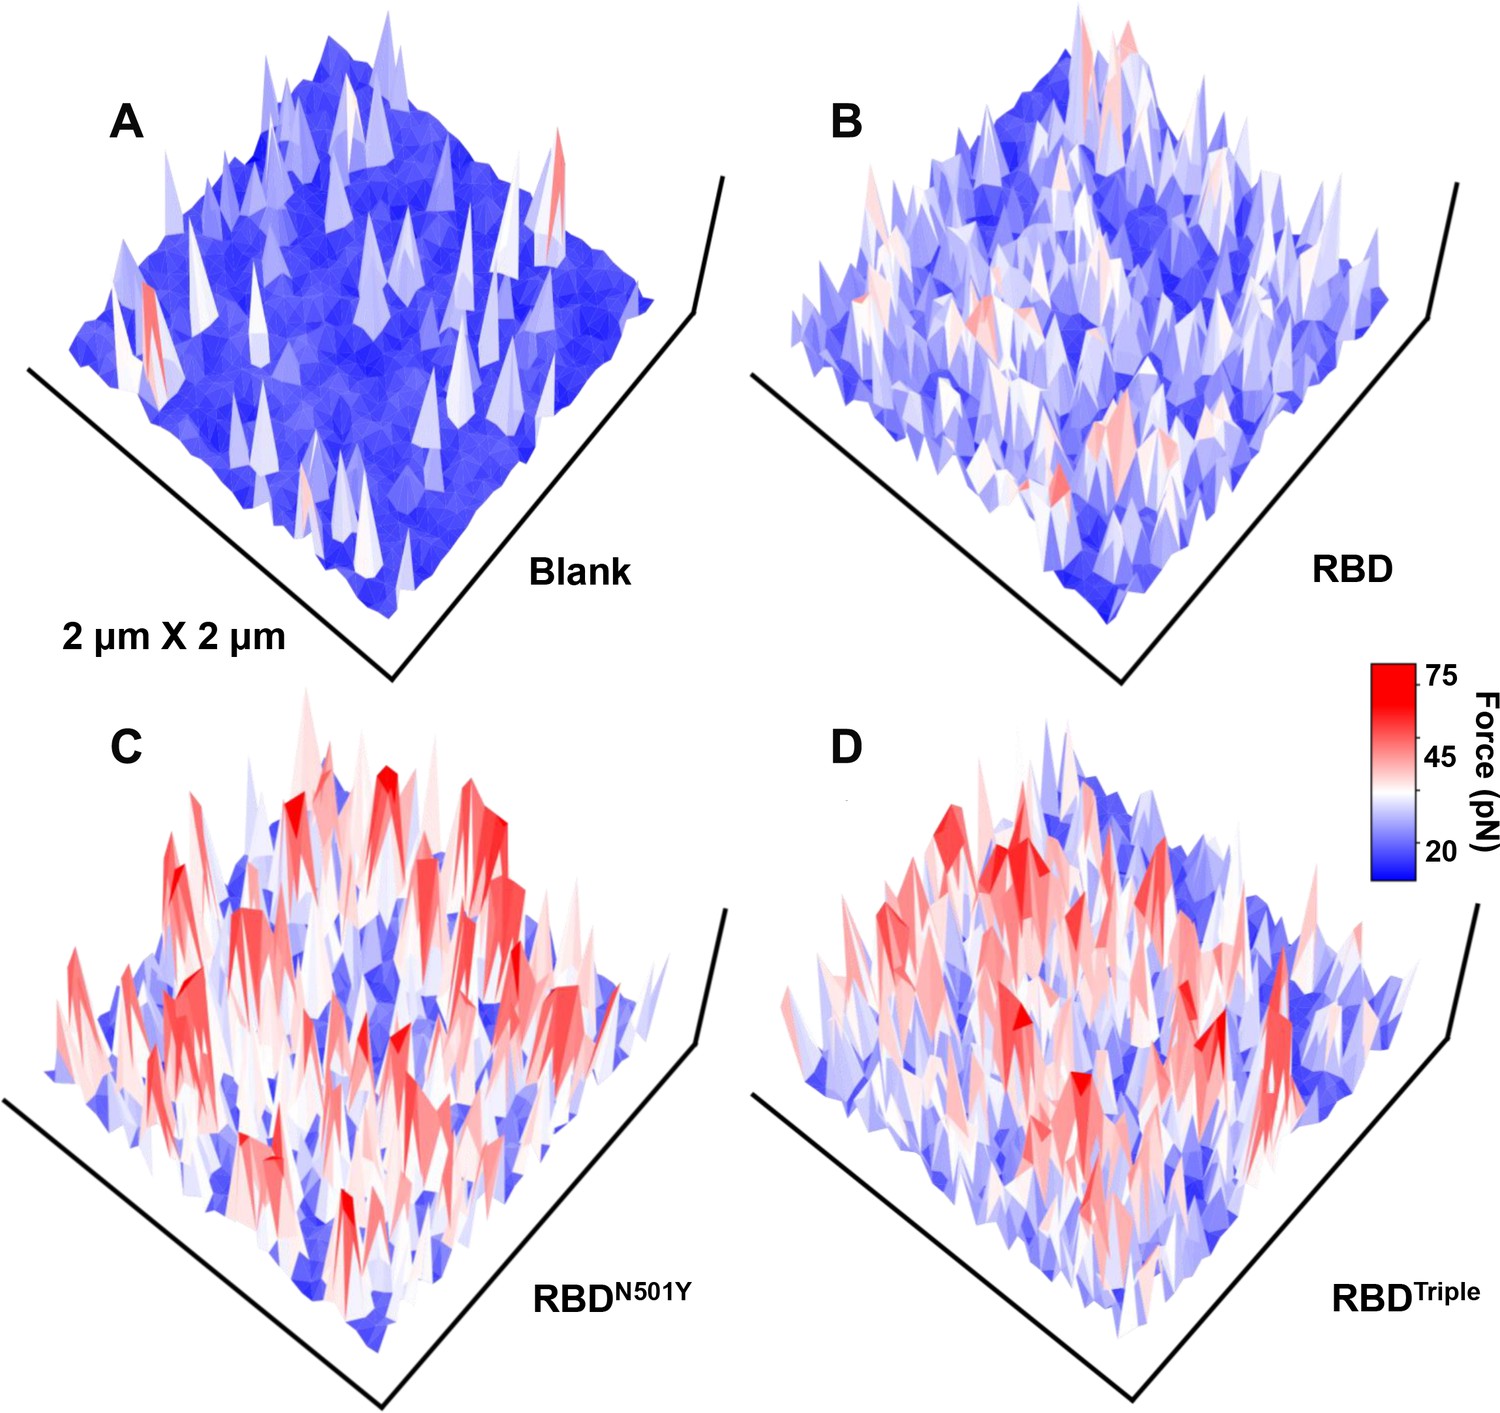
The force mapping results for the three different complexes in a 2 × 2 µm area: (A) blank on untransfected normal HEK293 cell, (B) RBD, (C) RBDN501Y, and (D) RBDTriple.
Figure 3—figure supplement 3
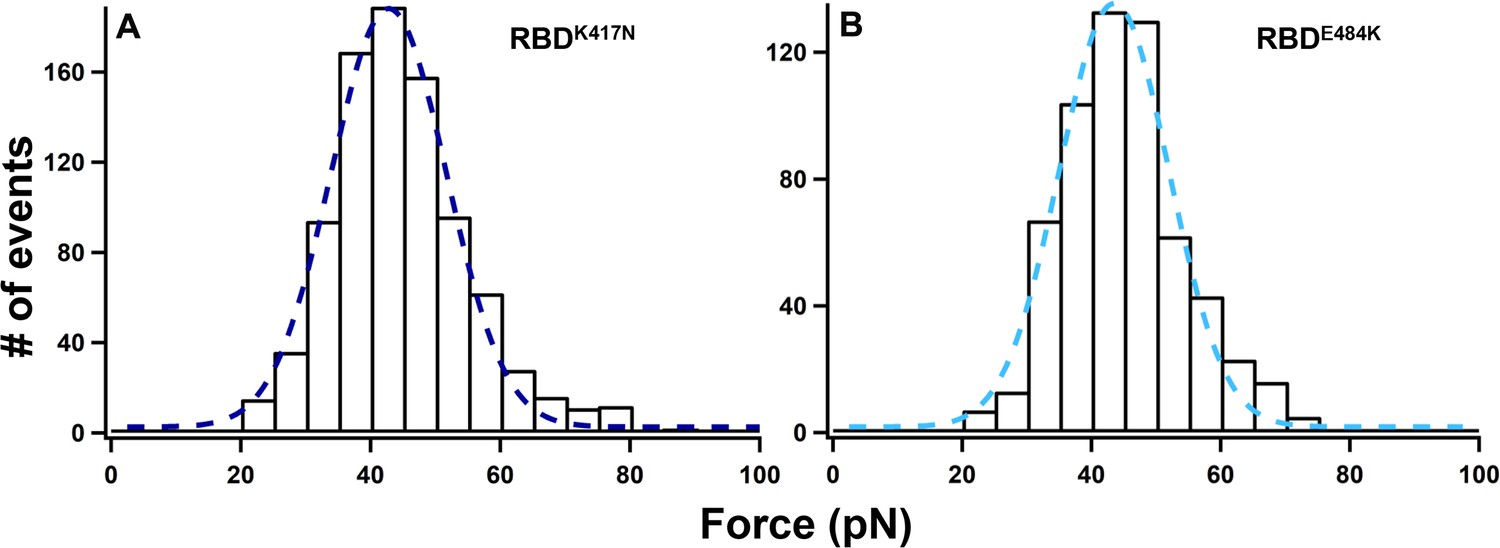
Histograms of unbinding force for RBDK417N–ACE2 (A) and RBDE484K–ACE2 (B) under a pulling speed of 5 µm/s.
The rupture forces are 40 ± 11 pN (RBDK417N, n = 894) and 41 ± 9 pN (RBDE484K, n = 606), respectively.
Figure 3—figure supplement 4
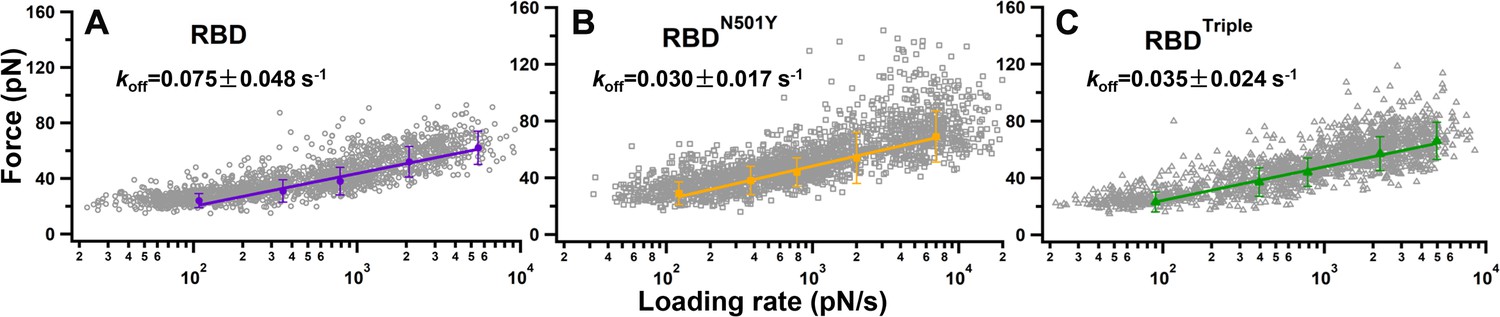
Plots of raw unbinding force against the loading rate of the three different complexes: (A) RBD, (B) RBDN501Y, and (C) RBDTriple.
The gray symbols are the forces required for an individual unbinding event under a specific loading rate. The five solid markers in each graph are the most probable unbinding forces under the five different loading rates. The data are fitted by the Bell–Evans model to obtain the koff.
Figure 4 with 4 supplements
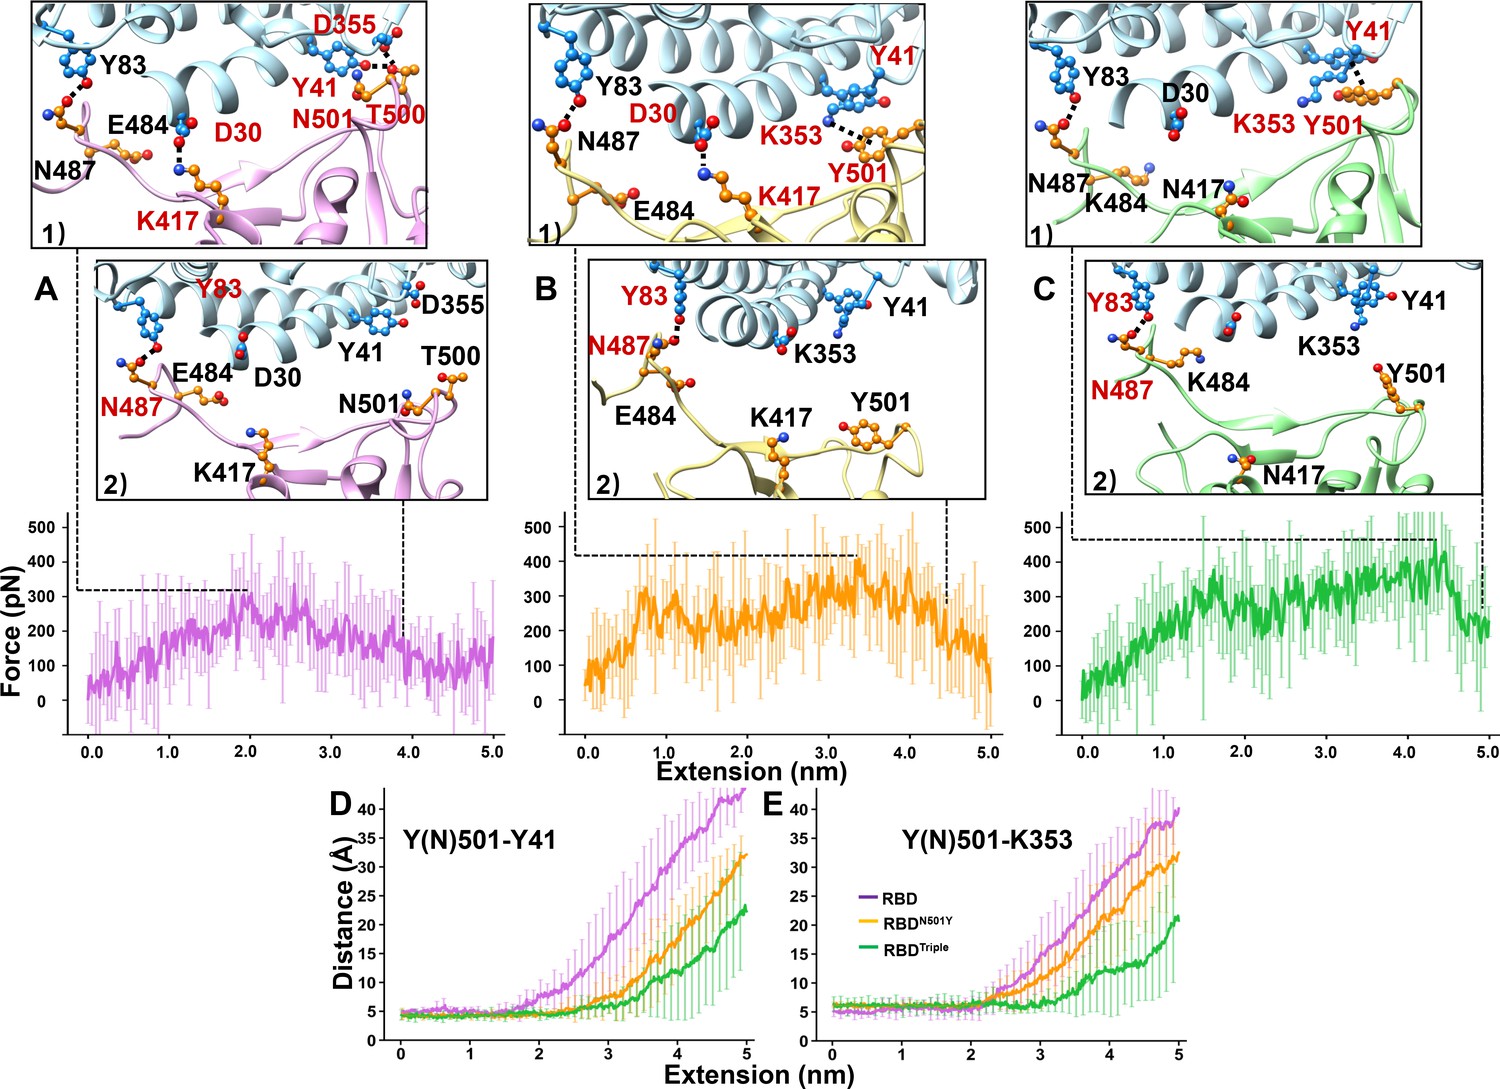
SMD simulations of RBD–ACE2 complex dissociation.
(A–C) Force-extension traces of RBD–ACE2 (violet), RBDN501Y–ACE2 (orange), and RBDTriple–ACE2 (green) complexes pulled apart at 5 Å/ns. The curves represent the average results from 20 simulations, with the standard deviations represented by vertical lines. In the ribbon diagrams, ACE2 is colored in cyan. Snapshots 1 and 2 represent the changes that occur as the RBDs are dissociated from ACE2 sequentially. The residues that are involved in the interaction between RBDs and ACE2 are labeled and depicted in sphere models, and the residue is colored in red if the interaction in which it participates is ruptured in the snapshot. (D, E) The distances between the Y41 (left) and K353 (right) residues of the ACE2 receptor and the Y(N)501 and residue of RBD (colored in purple), RBDN501Y (orange) or RBDTriple (green) as the extension elongates.
-
Figure 4—source data 1
Rupture forces for the three complexes from 20 SMD simulations.
- https://cdn.elifesciences.org/articles/69091/elife-69091-fig4-data1-v2.xlsx
-
Figure 4—source data 2
Distances between key residues in the RBDs–ACE2 complexes used for Figure 4D,E.
- https://cdn.elifesciences.org/articles/69091/elife-69091-fig4-data2-v2.xlsx
Figure 4—figure supplement 1
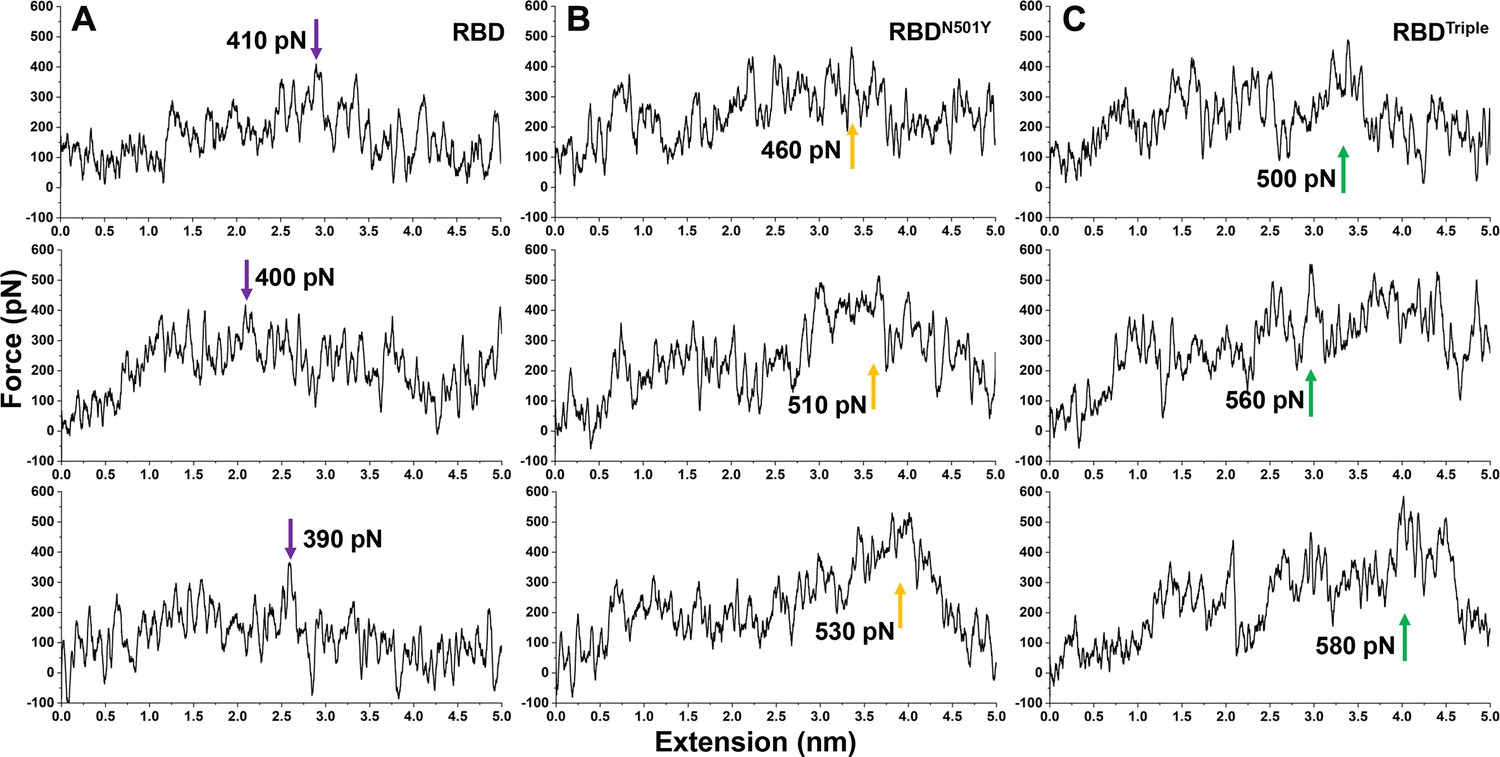
SMD simulations of the dissociation of the different RBD–ACE2 complexes involving (A) RBD, (B) RBDN501Y or (C) RBDTriple.
Figure 4—video 1
Representative SMD simulation of the RBD (violet)–ACE2 complex at a constant velocity of 5.0 Å/ns.
ACE2 is colored in cyan. Residues 500, 501, 417, 484, and 487 of RBD, and contacting residues from ACE2 (D355, K353, Y41, D30, and Y83) are labeled and shown as sphere models. The distances between key residues are shown.
Figure 4—video 2
Representative SMD simulation of the RBDN501Y(orange)–ACE2 complex at a constant velocity of 5.0 Å/ns.
ACE2 is colored in cyan. Residues 500, 501, 417, 484, and 487 from RBD, and contacting residues from ACE2 (D355, K353, Y41, D30, and Y83) are labeled and shown as sphere models. The distances between key residues are shown.
Figure 4—video 3
Representative SMD simulation of the RBDTriple (green)–ACE2 complex at a constant velocity of 5.0 Å/ns.
ACE2 is colored in cyan. Residues 500, 501, 417, 484, and 487 from RBD, and contacting residues from ACE2 (D355, K353, Y41, D30, and Y83) are labeled and shown as sphere models. The distances between key residues are shown.
Additional files
Download links
A two-part list of links to download the article, or parts of the article, in various formats.
Downloads (link to download the article as PDF)
Open citations (links to open the citations from this article in various online reference manager services)
Cite this article (links to download the citations from this article in formats compatible with various reference manager tools)
N501Y mutation of spike protein in SARS-CoV-2 strengthens its binding to receptor ACE2
eLife 10:e69091.
https://doi.org/10.7554/eLife.69091


