A novel mitochondrial Kv1.3–caveolin axis controls cell survival and apoptosis
- Molecular Physiology Laboratory, Dpt. de Bioquímica i Biomedicina Molecular, Institut de Biomedicina (IBUB), Universitat de Barcelona, Spain
- Department of Biology, University of Padova, Italy
- Dept de Fisiología, Genética y Microbiología, Universidad de Alicante, Spain
Figures
Figure 1 with 3 supplements

The caveolin-binding domain (CBD) of Kv1.3 mediates the interaction with Cav1 targeting the channel to lipid raft microdomains.
(A) Ribbon representation of a Kv1.3 tetramer. For clarity, the transmembrane domain structures are highlighted with different colors in one monomer, with the CBD in red. Both the cytoplasmic (bottom view) and the side (side view) planes are shown. Note the exposed orientation of the CBD at the proximal cytoplasmic N-terminal domain. A zoomed in image is provided for detail. Aminoacids are identified with letters and positions. Lateral chains are colored by element (C, gray; N, blue; O, red). The consensus sequence of the CBD is provided. The amino acid sequence shows the CBD of wild type (WT) Kv1.3. The Kv1.3 CBD mutant (CBDless) contains amino acid substitutions (in red) to abrogate the CBD. (B) Kv1.3–Cav1 coimmunoprecipitation assay. HEK 293 Cav− cells were cotransfected with Cav1 and Kv1.3YFP WT or Kv1.3YFP CBDless. Total cell lysates were immunoprecipitated with Cav1 (IP: Cav1). IP−, absence of Cav1 antibody. SM, starting materials. Samples were immunoblotted (IB) against Cav1 or Kv1.3. (C) Representative images from a Förster resonance energy transfer (FRET) experiment on cell unroofing preparations (CUPs). HEK 293 Cav− cells were cotransfected with Kv1.3YFP WT+Cav1 Cerulean (Cav1 Cer) and Kv1.3YFP CBDless+Cav1 Cer. From left to right: acceptor (Kv1.3 YFP) and donor (Cav1 Cer) prebleach and postbleach images. Square insets indicate the bleached zone. Line graphs at the right show changes in donor (cerulean) and acceptor (yellow) fluorescence after bleaching. (D) FRET efficiency (%). Values are the mean ± SE (n > 25). **p<0.01, ***p<0.001 (Student’s t-test). YFP+Cer were used as negative control. Positive controls were Kv1.3 YFP WT+Kv1.3 Cer WT. (E, F) Purification of detergent-resistant membrane fractions (lipid rafts). HEK293 cells were transfected with Kv1.3YFP WT or Kv1.3YFP CBDless and samples subjected to sucrose-density gradients (1–12 from low [top of tube] to high [bottom of tube] density fractions, respectively). Clathrin was used as a non-raft marker, and flotillin and caveolin as lipid raft markers.
Figure 1—figure supplement 1
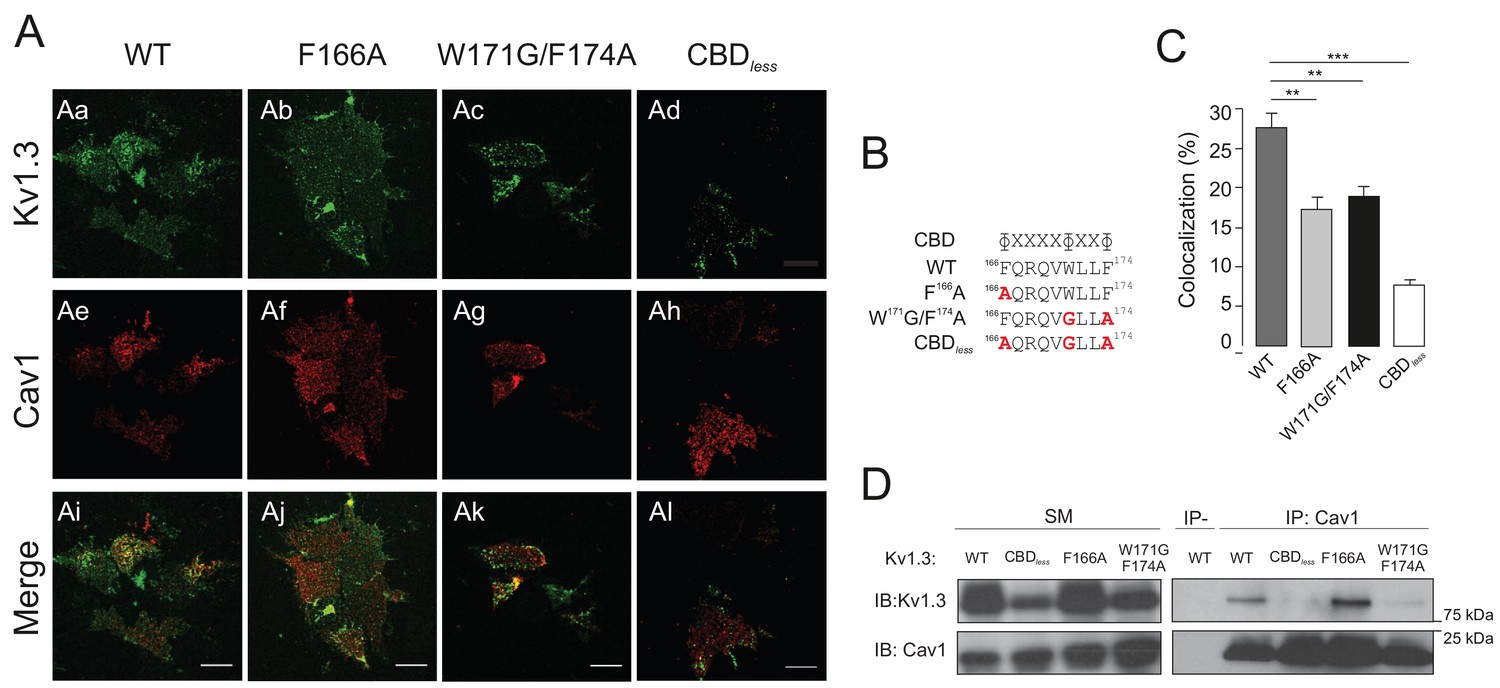
Disruption of the CBD of Kv1.3 impairs caveolin colocalization, as well as association with the channel.
HEK 293 Cav− cells were cotransfected with Kv1.3YFP WT and Kv1.3YFP mutants (F166A, W171G/F174A, and CBDless) and Cav1. (A) Representative confocal images from an experiment on cell unroofing preparations (CUPs). HEK 293 Cav− cells were cotransfected with Kv1.3YFP WT+Cav1 or Kv1.3YFP mutants (F166A, W171G/F174A, and CBDless)+Cav1. (Aa, Ae, Ai) Kv1.3YFP WT; (Ab, Af, Aj) Kv1.3YFP (F166A); (Ac, Ag, Ak) Kv1.3YFP (W171G/F174A); (Ad, Ah, Al) Kv1.3YFP CBDless. Green, Kv1.3 channels; Red, Cav1; Merge, colocalization between Kv1.3 and Cav1 in yellow. The scale bar represents 10 μm. (B) Consensus sequence of the CBD. The amino acid sequence shows the CBD of wild type (WT) Kv1.3. The Kv1.3 CBD mutants contain amino acid substitutions (in red) to disrupt the CBD. (C) Pixel by pixel colocalization analysis of Kv1.3 channels and Cav1. Dark gray bar, Kv1.3 WT; light gray bar, Kv1.3 F166A mutant; black bar, Kv1.3 W171G/F174A; white bar, Kv1.3 CBDless. Values are the mean ± SE (n > 25). **p<0.01, ***p<0.001 (Student’s t-test). (D) Kv1.3–Cav1 coimmunoprecipitation assay. HEK 293 Cav− cells were cotransfected with Cav1 and Kv1.3YFP WT or Kv1.3YFP mutants. Total cell lysates were immunoprecipitated with Cav1 (IP: Cav1). IP-, absence of anti-Cav1 antibody. SM, starting materials. Samples were immunoblotted (IB) against Cav1 or Kv1.3.
Figure 1—figure supplement 2
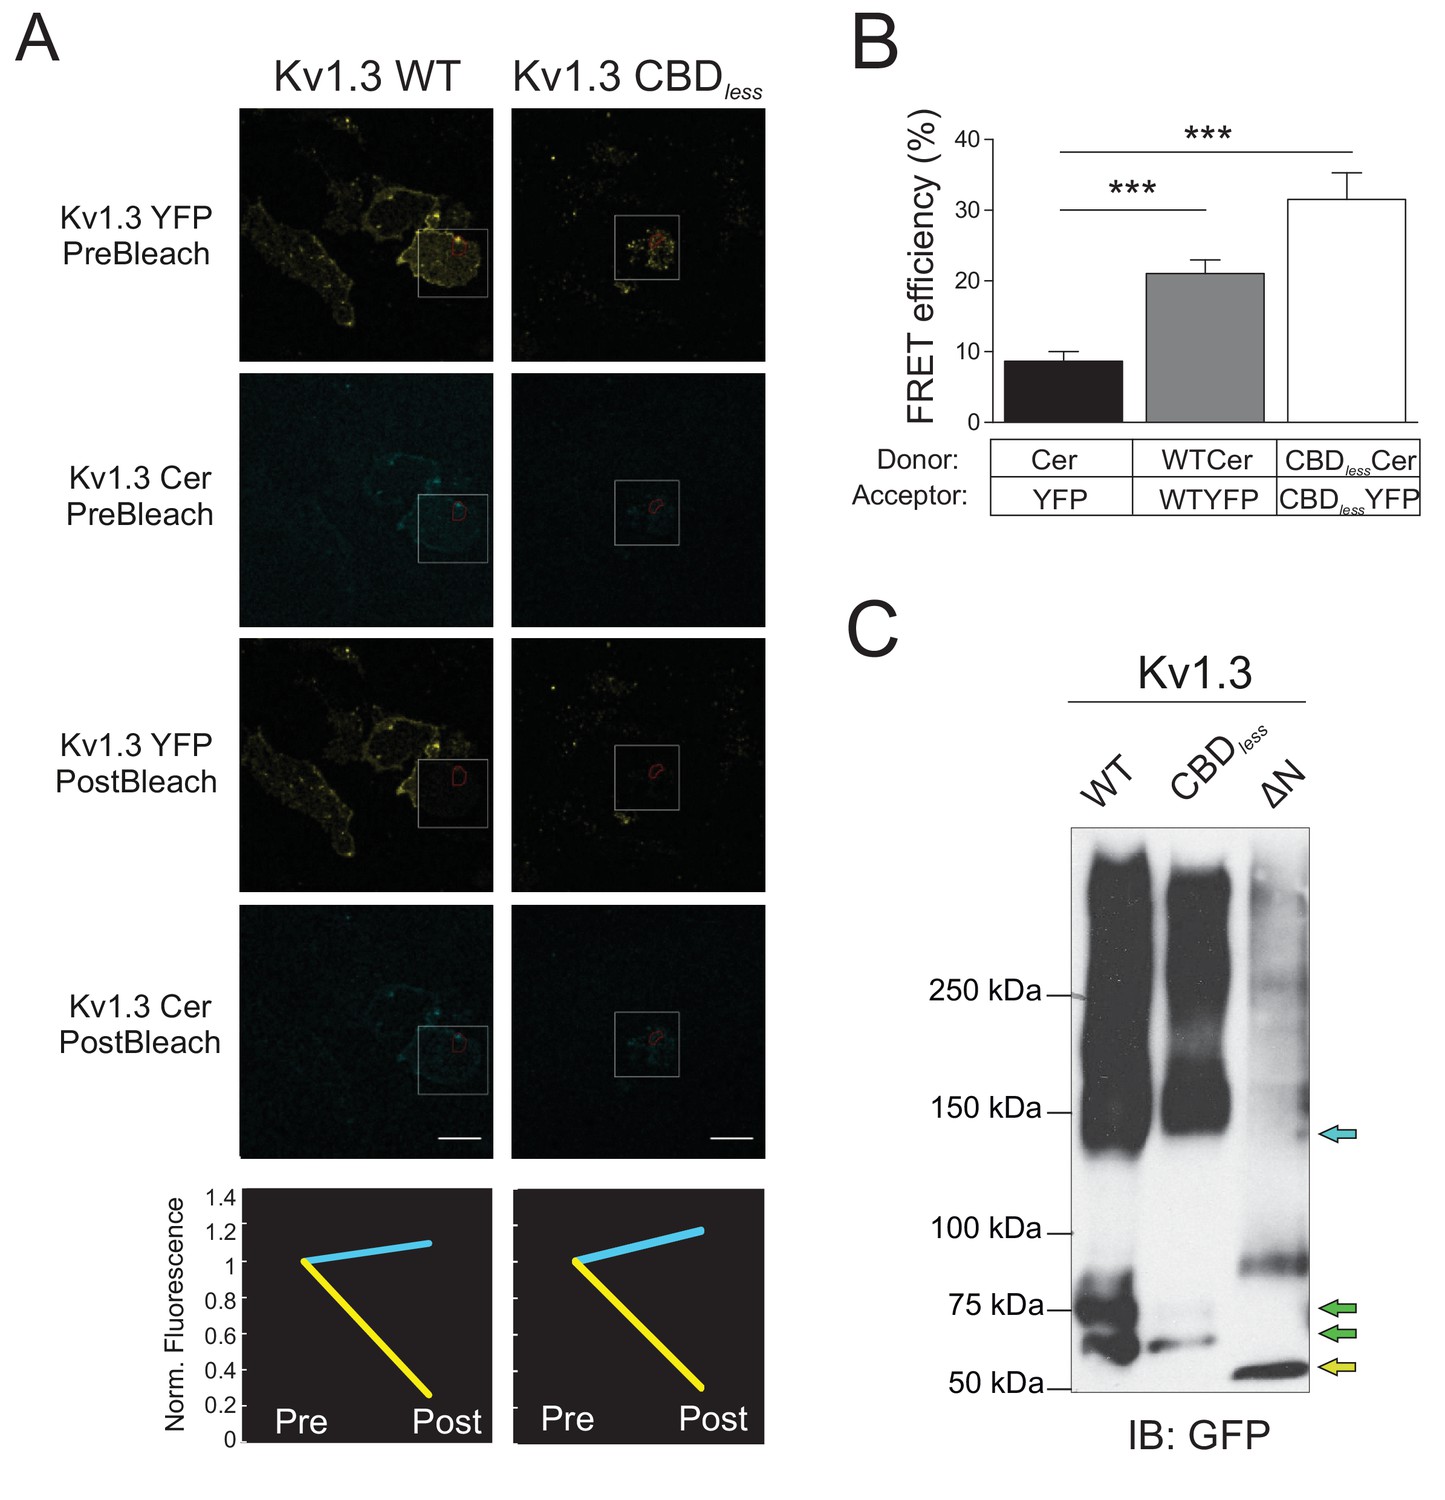
Kv1.3 CBDless forms tetramers.
(A) Representative FRET experiment of CUPs from HEK 293 cells cotransfected with Kv1.3YFP WT+Kv1.3 Cer WT (left panels) or Kv1.3YFP CBDless+Kv1.3 Cer CBDless (right panels). Top to bottom: acceptor (Kv1.3-YFP) and donor (Kv1.3-Cer) prebleach and postbleach images. Square insets indicate the bleached zone, and the red area indicates the analyzed ROI. Line graphs show changes in donor (cerulean) and acceptor (yellow) fluorescence after bleaching. The scale bar represents 10 μm. (B) FRET efficiency (%) of YFP +Cer (negative control), Kv1.3YFP WT +Kv1.3 Cer WT (positive control), and Kv1.3YFP CBDless +Kv1.3 Cer CBDless. Values are mean ± SE (n > 20). ***p<0.001 (Student’s t-test). (C) Nondenaturing polyacrylamide gel electrophoresis. HEK 293 cells were transfected with Kv1.3YFP WT, Kv1.3YFP CBDless, or Kv1.3YFP ∆N (truncated N-terminus) and cell lysates immunoblotted for GFP (IB:GFP). The yellow arrow indicates the truncated form of ∆N Kv1.3. Green arrows indicate mature and immature forms of Kv1.3. Blue arrows indicate high-molecular-weight oligomers.
Figure 1—figure supplement 3
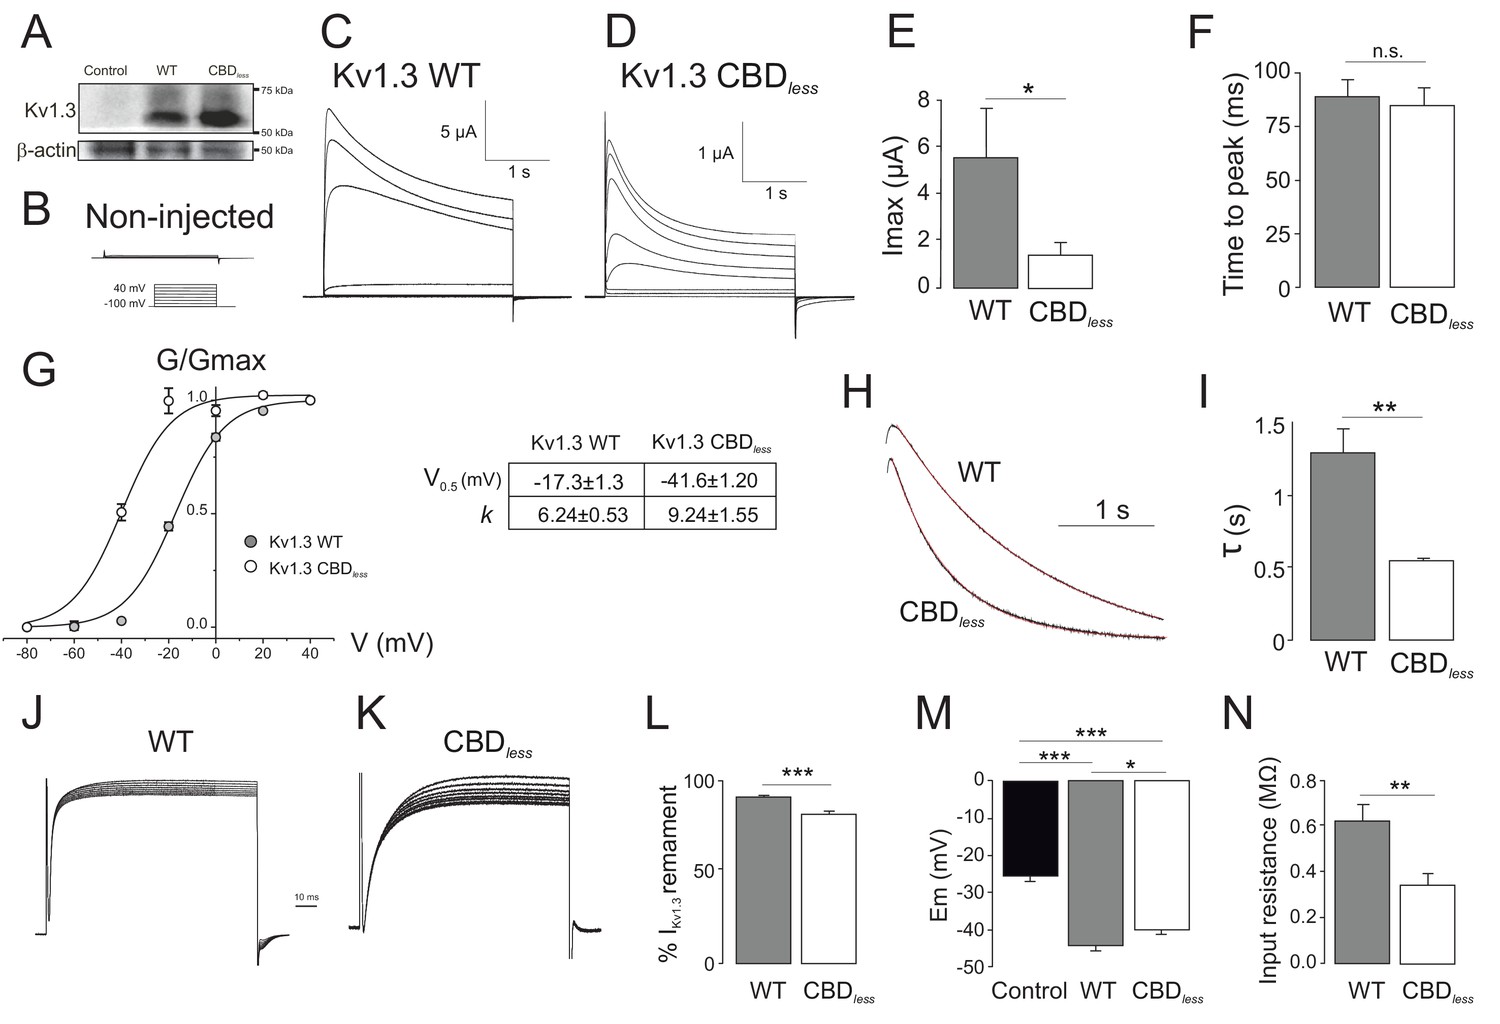
Functional Kv1.3 CBDless channels exhibit altered biophysical properties and decreased current density at the plasma membrane.
Kv1.3 WT and Kv1.3 CBDless were expressed in Xenopus oocytes to perform two-electrode voltage-clamp experiments. Cells were held at −100 mV and 2.5 s depolarizing pulses were applied in 20 mV steps to +40 mV. (A) Representative Kv1.3 protein expression of non-injected oocytes (control) and oocytes injected with Kv1.3WT (WT) and Kv1.3 CBDless (CBDless). Representative currents elicited in a noninjected control oocyte (B) and either Kv1.3 WT (C) or Kv1.3 CBDless (D) expressing oocytes. (E) Peak current amplitude at +40 mV. (F) Time to peak at +40 mV. (G) Steady-state activation (left panel) and kinetic parameters (right panel). Data were fitted to a Boltzman equation. (H) Current inactivation at +40 mV and (I) τ inactivation values. Cumulative inactivation of Kv1.3 WT (J) and Kv1.3 CBDless (K) currents. Currents were elicited by a train of 8 depolarizing voltage steps to +40 mV once every second, from a holding potential of −100 mV. (L) Percentage of remaining current (IKv1.3) at the end of the last pulse. (M) Membrane potential (Em (mV)) of non-injected (control) and injected oocytes with Kv1.3 WT or Kv1.3 CBDless. (N) Membrane input resistance (MΩ) of oocytes injected with Kv1.3 WT and Kv1.3 CBDless. Black bars, control (no injection); gray, oocytes injected with Kv1.3 WT; white bars, oocytes expressing Kv1.3 CBDless. Data are the mean ± SE (n: 20–26). *p<0.05, **p<0.01, ***p<0.001 (E, F, I, L, and N, Student’s t-test; M, one-way ANOVA [Bonferroni post hoc test]).
Figure 2
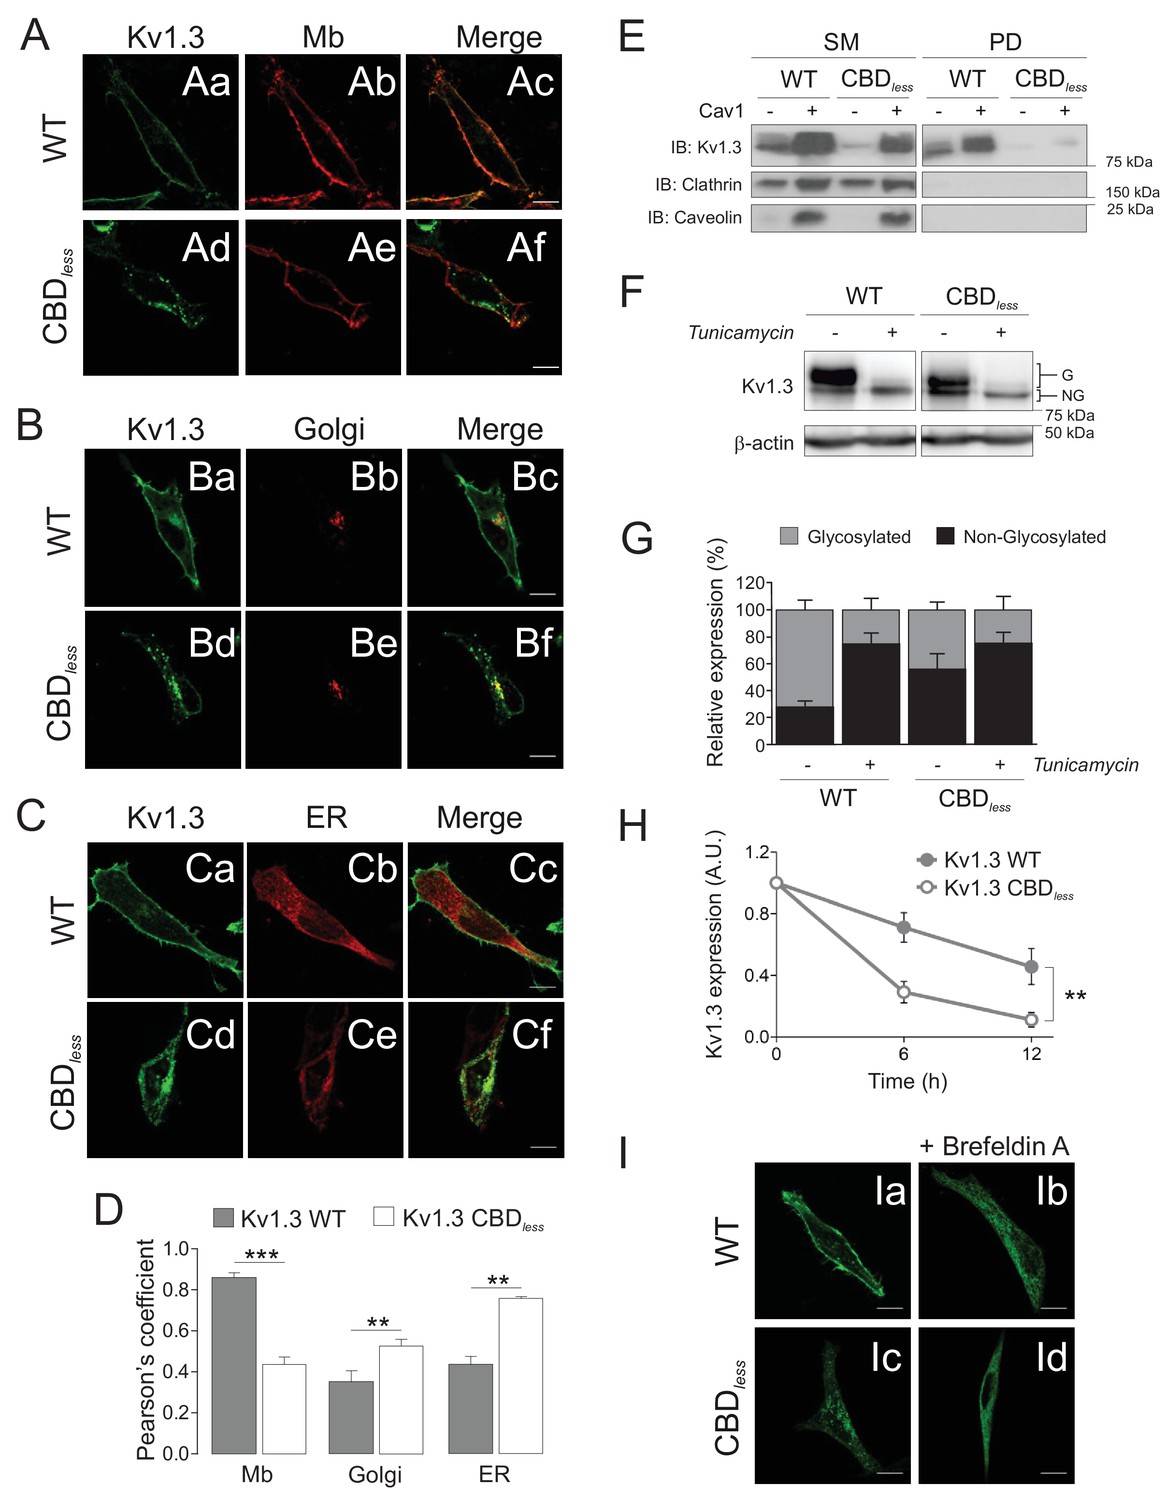
The integrity of the CBD domain is involved in the surface expression of Kv1.3.
HEK 293 cells were transfected with Kv1.3YFP WT and Kv1.3YFP CBDless. (A–C) Representative confocal images show colocalization of Kv1.3YFP WT and Kv1.3YFP CBDless with (A) plasma membrane (Mb), (B) Golgi, and (C) endoplasmic reticulum (ER). Green panels, Kv1.3; red panels, subcellular marker; merge panels show colocalization in yellow. The scale bar is 10 μm. ER (pDsRed-ER) and Mb (Akt-PH-pDsRed) were used as ER and Mb markers, respectively, and were cotransfected with the channel. Golgi was stained with an anti-cis-Golgi antibody (GM130). (D) Colocalization analysis (Pearson’s coefficient) between channel and subcellular markers. Gray bars, Kv1.3 WT. White bars, Kv1.3 CBDless. Data are the mean ± SE (n > 30 cells) **p<0.01; ***p<0.001 vs Kv1.3 WT (Student’s t-test). (E) Cell surface biotinylation analysis of the surface expression of Kv1.3. HEK 293 Cav- cells were cotransfected with Kv1.3YFP WT and Kv1.3YFP CBDless in the presence (+) or the absence (−) of Cav1. SM, starting materials. PD, pull-down (biotinylated proteins). Samples were immunoblotted (IB) for Kv1.3, clathrin (negative control), and Cav1 (caveolin). (F) Cells transfected with Kv1.3YFP WT or Kv1.3YFP CBDless were treated with (+) or without (−) 0.5 μg/ml tunicamycin for 24 hr to inhibit N-glycosylation. Total cell lysates were immunoblotted against Kv1.3 (anti-GFP) and β-actin. (G) Relative Kv1.3 glycosylation. The percentage of glycosylated (G) and nonglycosylated (NG) forms was calculated from data in (F). Data are the mean ± SE of 4 independent experiments. (H) Kv1.3 protein stability. Cells transfected with Kv1.3YFP WT and Kv1.3YFP CBDless for 24 hr were further treated for 0, 6, and 12 hr with 100 μg/ml cycloheximide. Total protein extracts were separated by SDS–PAGE and immunoblotted using Kv1.3 and β-actin antibodies. Kv1.3 expression was corrected using β-actin levels and relativized by initial values at 0 hr. A.U, arbitrary units. Data are the mean ± SE of three independent experiments. **p<0.01 (two-way ANOVA). (I) Representative confocal images of Kv1.3YFP WT (Ia, Ib) or Kv1.3YFP CBDless (Ic, Id) in the presence (Ib, Id) or in the absence (Ia, Ic) of 5 μg/ml brefeldin A (+Befeldrin A) for 4 hr. The scale bar represents 10 μm.
Figure 3 with 1 supplement
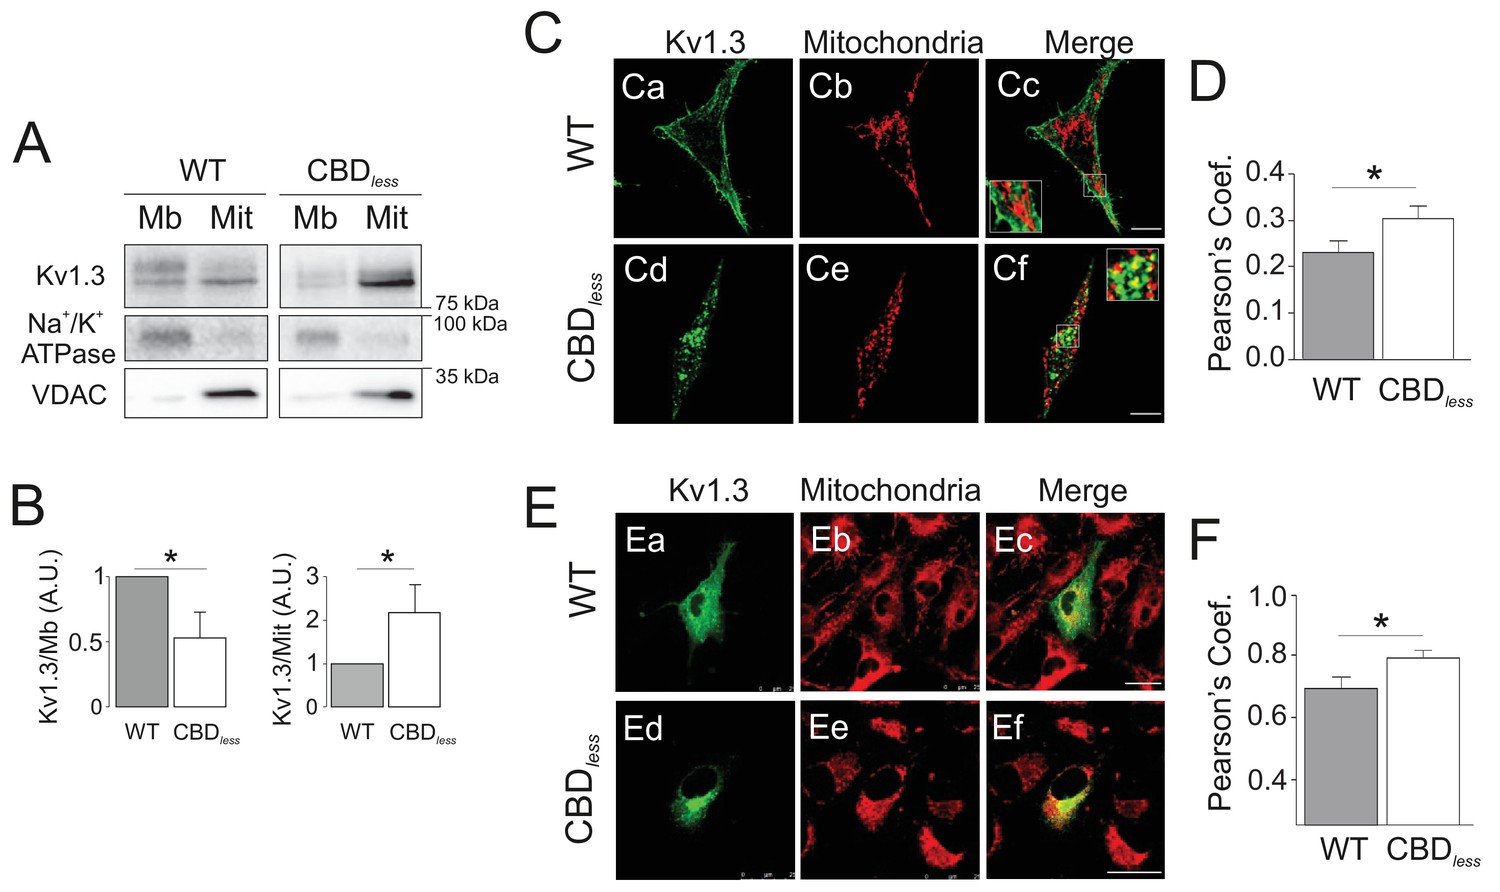
Kv1.3 CBDless targets to mitochondria.
HEK 293 and B16F10 cells were transfected with Kv1.3YFP WT or Kv1.3YFP CBDless. (A) Subcellular fractionation isolating mitochondrial (Mit) and membrane (Mb) fractions from HEK 293 cells. Samples were immunoblotted for GFP (Kv1.3), Na+/K+ ATPase (membrane marker) or VDAC (mitochondrial marker). (B) Relative membrane (Mb) mitochondrial (Mit) Kv1.3 expression. Kv1.3 abundance in (A) was normalized to Na+/K+ ATPase (Mb) and VDAC (Mit) expression and relativized to the Kv1.3 WT. Data are the mean ± SE (n = 4). *p<0.05 (Student’s t-test). (C) Representative confocal images of (Ca-Cc) Kv1.3YFP WT and (Cd-Cf) Kv1.3YFP CBDless (green) and mitochondria (pmitoRFP in red) from HEK 293 cells. (Cc, Cf) Merge shows colocalization in yellow. Insets magnify white squares for detail. (D) Quantification of colocalization was performed by Pearson’s coefficient. Data are the mean ± SE (n > 30). *p<0.05 (Student’s t-test). (E) Representative confocal images of (Ea–Ec) Kv1.3YFP WT and (Ed-Ef) Kv1.3YFP CBDless (green) and mitochondria (mitotracker in red) in B16F10 melanoma cells. (Ec, Ef) Merge shows colocalization in yellow. (F) Quantification of colocalization was performed by Pearson’s coefficient. Data are the mean ± SE (n = 12). *p<0.05 (Student’s t-test). Scale bar represents 10 μm.
Figure 3—figure supplement 1
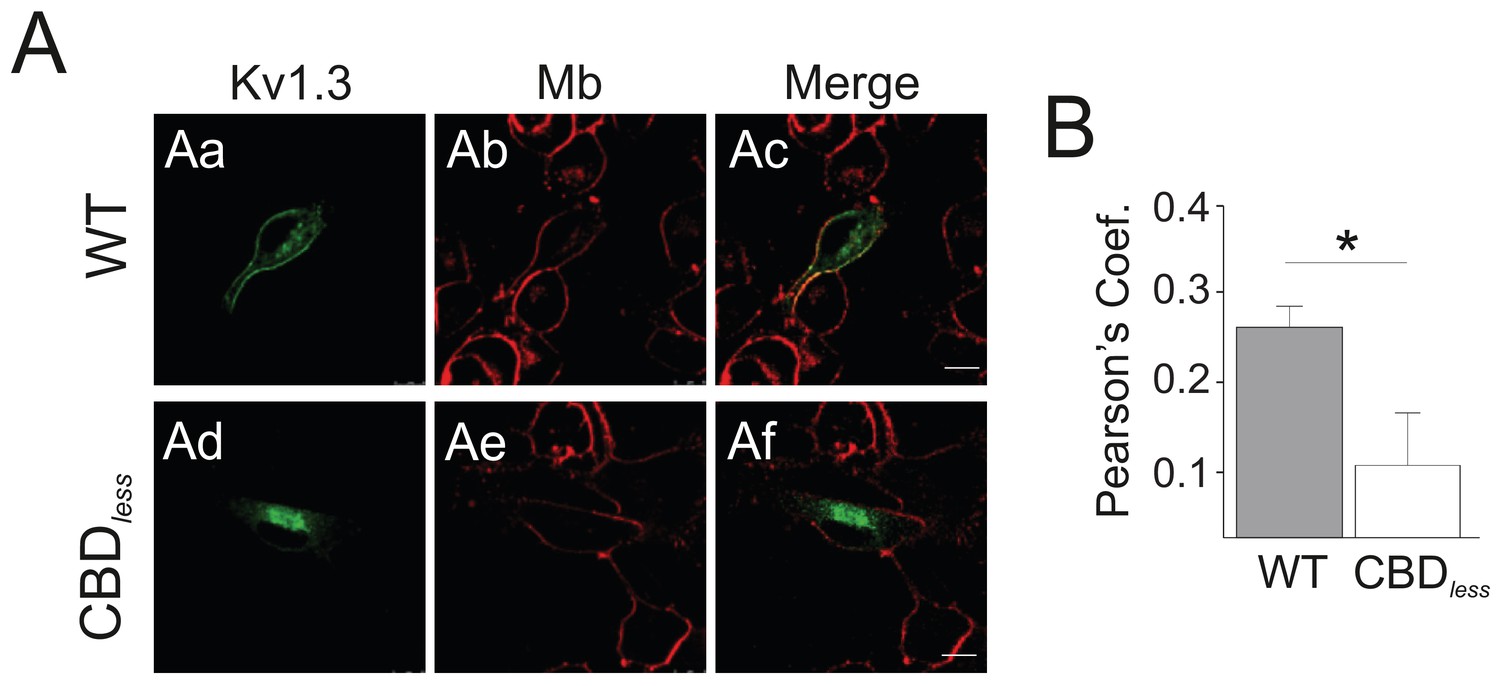
Kv1.3 CBDless does not localize to the plasma membrane in B16F10 melanoma cells.
B16F10 melanoma cells were transfected with Kv1.3YFP WT and Kv1.3YFP CBDless. (A) Colocalization of Kv1.3YFP WT (Aa-Ac) and Kv1.3YFP CBDless (Ad-Af) at the plasma membrane. (Aa, Ad) Kv1.3YFP in green. (Ab, Ae) Plasma membrane staining with FM-464 dye in red. (Ac, Af) Merge shows colocalization in yellow. The scale bar represents 10 μm. (B) Quantification of colocalization was performed by Pearson’s coefficient. Data are the mean ± SE (n = 18). *p<0.05 (Student’s t-test).
Figure 4
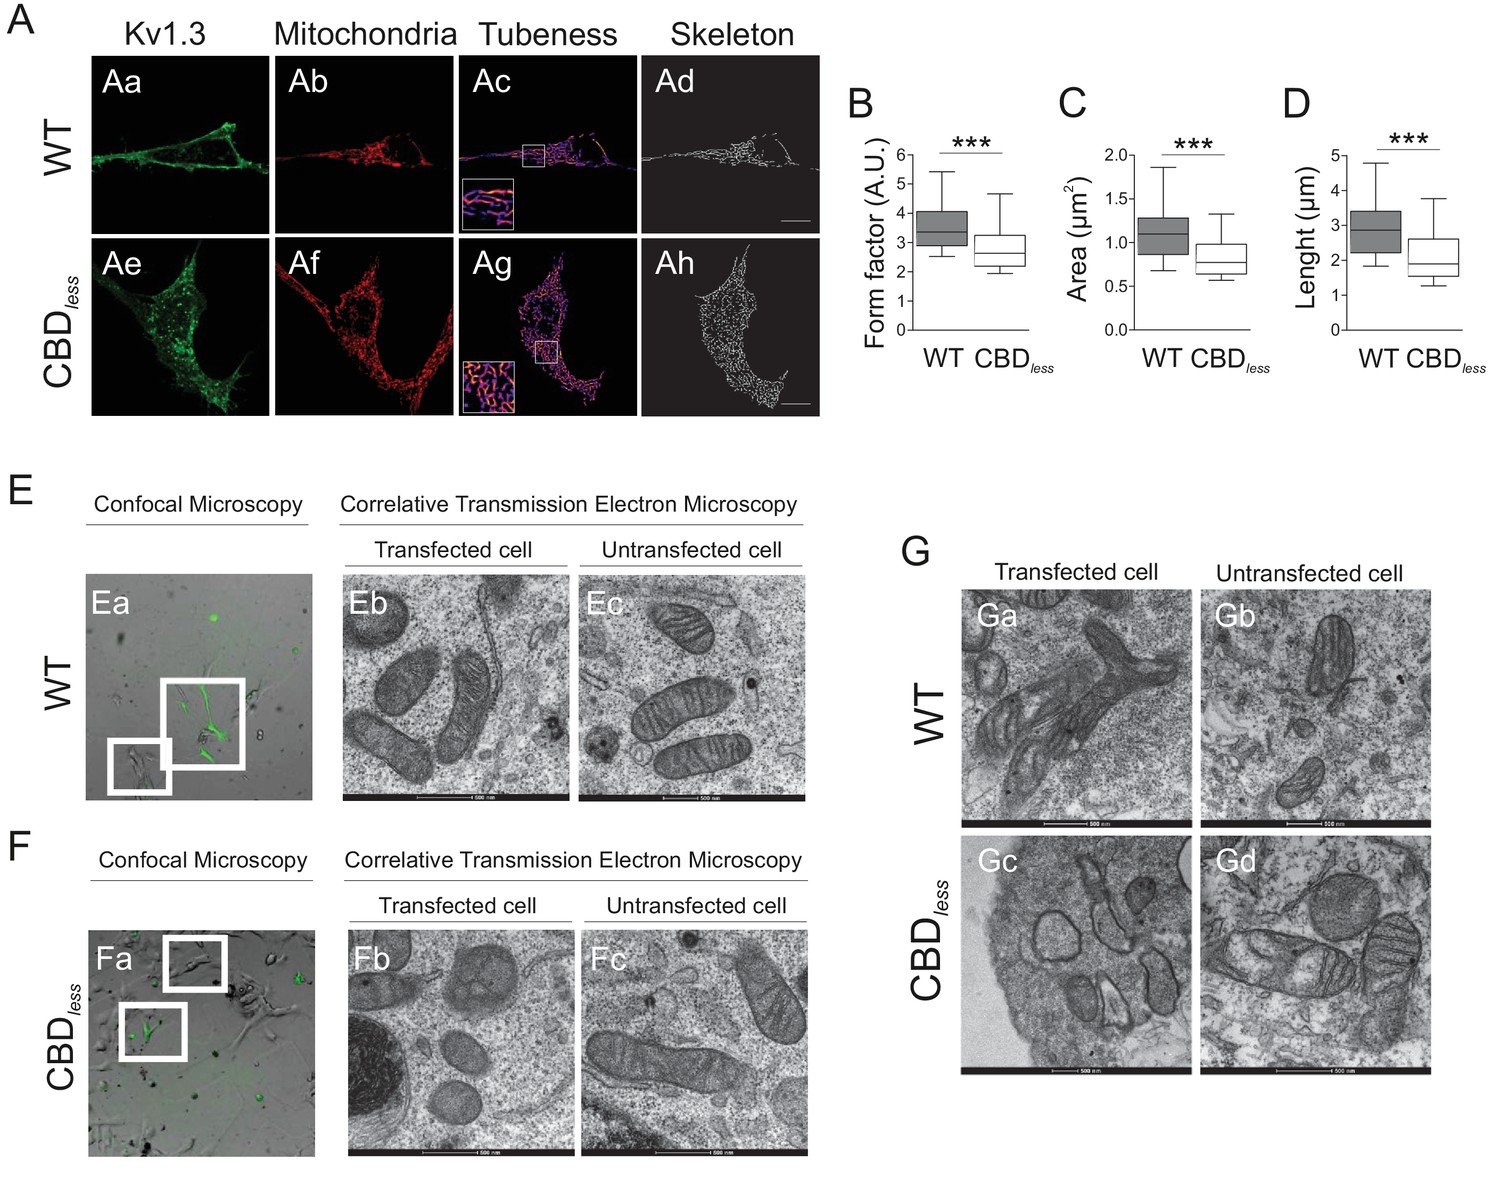
Kv1.3 CBDless targets mitochondria altering mitochondrial morphology.
HEK 293 and B16F10 cells were transfected with Kv1.3YFP WT or Kv1.3YFP CBDless. (A) Representative confocal images of HEK-293 cells cotransfected with (Aa–Ad) Kv1.3YFP WT, (Ae–Ah) Kv1.3YFP CBDless (green) and pmitoRFP (red). Images were processed (tubeness (Ac, Ag) and skeleton (Ad, Ah)) to perform morphometric analysis (B–D) of mitochondria in Kv1.3 positive cells. Scale bar represents 10 μm. (B) The form factor (arbitrary units, A.U.) describes the particle shape complexity and is computed as the average (perimeter)2/(4π·area). A circle corresponds to a minimum value of 1. (C) Average area of particles detected on the binary image. (D) The length of mitochondrial networks was measured as the average area of the skeletonized binary image. Data are the mean ± SE (n > 30). ***p<0.001 (Student’s t-test). (E, F) Electron micrograph of B16F10 melanoma cells transfected with (Ea–Ec) Kv1.3YFP WT or (Fa–Fc) Kv1.3YFP CBDless. Cells were observed via confocal microscopy 3 days after transfection (Ea, Fa). Scale bar represents 40 μm. Next, cells were fixed and analyzed by correlative electron microscopy (Eb–Ec, Fb–Fc). (Eb, Fb) Transfected cells positive for Kv1.3 YFP (in green) from white squares in Ea and Fa. (Ec, Fc) Untransfected cells negative for Kv1.3 YFP from white squares in Ea and Fa. (G) Correlative electron micrograph of HEK 293 cells transfected with (Ga, Gb) Kv1.3YFP WT or (Gc, Gd) Kv1.3YFP CBDless. (Ga, Gc) Transfected cells positive for Kv1.3 YFP. (Gb, Gd) Untransfected cells negative for Kv1.3 YFP. Note the lack of mitochondrial cristae and the presence of swollen mitochondria in Kv1.3YFP CBDless transfected cells (Gc). Images are representative of three independent experiments. Scale bar represents 500 nm.
Figure 5

Kv1.3 CBDless severely impairs mitochondrial function.
HEK-293 cells were transfected with Kv1.3YFP WT and Kv1.3YFP CBDless. Non-transfected cells were used as a control. (A) Mitochondrial membrane potential was determined by tetramethyl rhodamine methyl ester (TMRM) fluorescence. Positive transfected cells (separated by sorting) were incubated with TMRM and analyzed by confocal microscopy. Data are the mean ± SE (n = 3). ***p<0.001 (one-way ANOVA). A.U, arbitrary units. (B) The oxygen consumption rate (OCR) of HEK293 cells transfected with Kv1.3YFP WT or Kv1.3YFP CBDless in the presence of 2 μg/ml oligomycin (ATPase synthase inhibitor), 200 nM FCCP (respiratory chain uncoupler), 1 μM antimycin (complex III blocker). (C) Normalized OCR parameters (%) extracted from (B). Data are the mean ± SE (n = 3). *p<0.05; **p<0.01; ***p<0.001 (one-way ANOVA). Black bar/circle, non-transfected control cells; Gray bar/circle, Kv1.3 WT; white bar/circle, Kv1.3 CBDless.
Figure 6 with 3 supplements
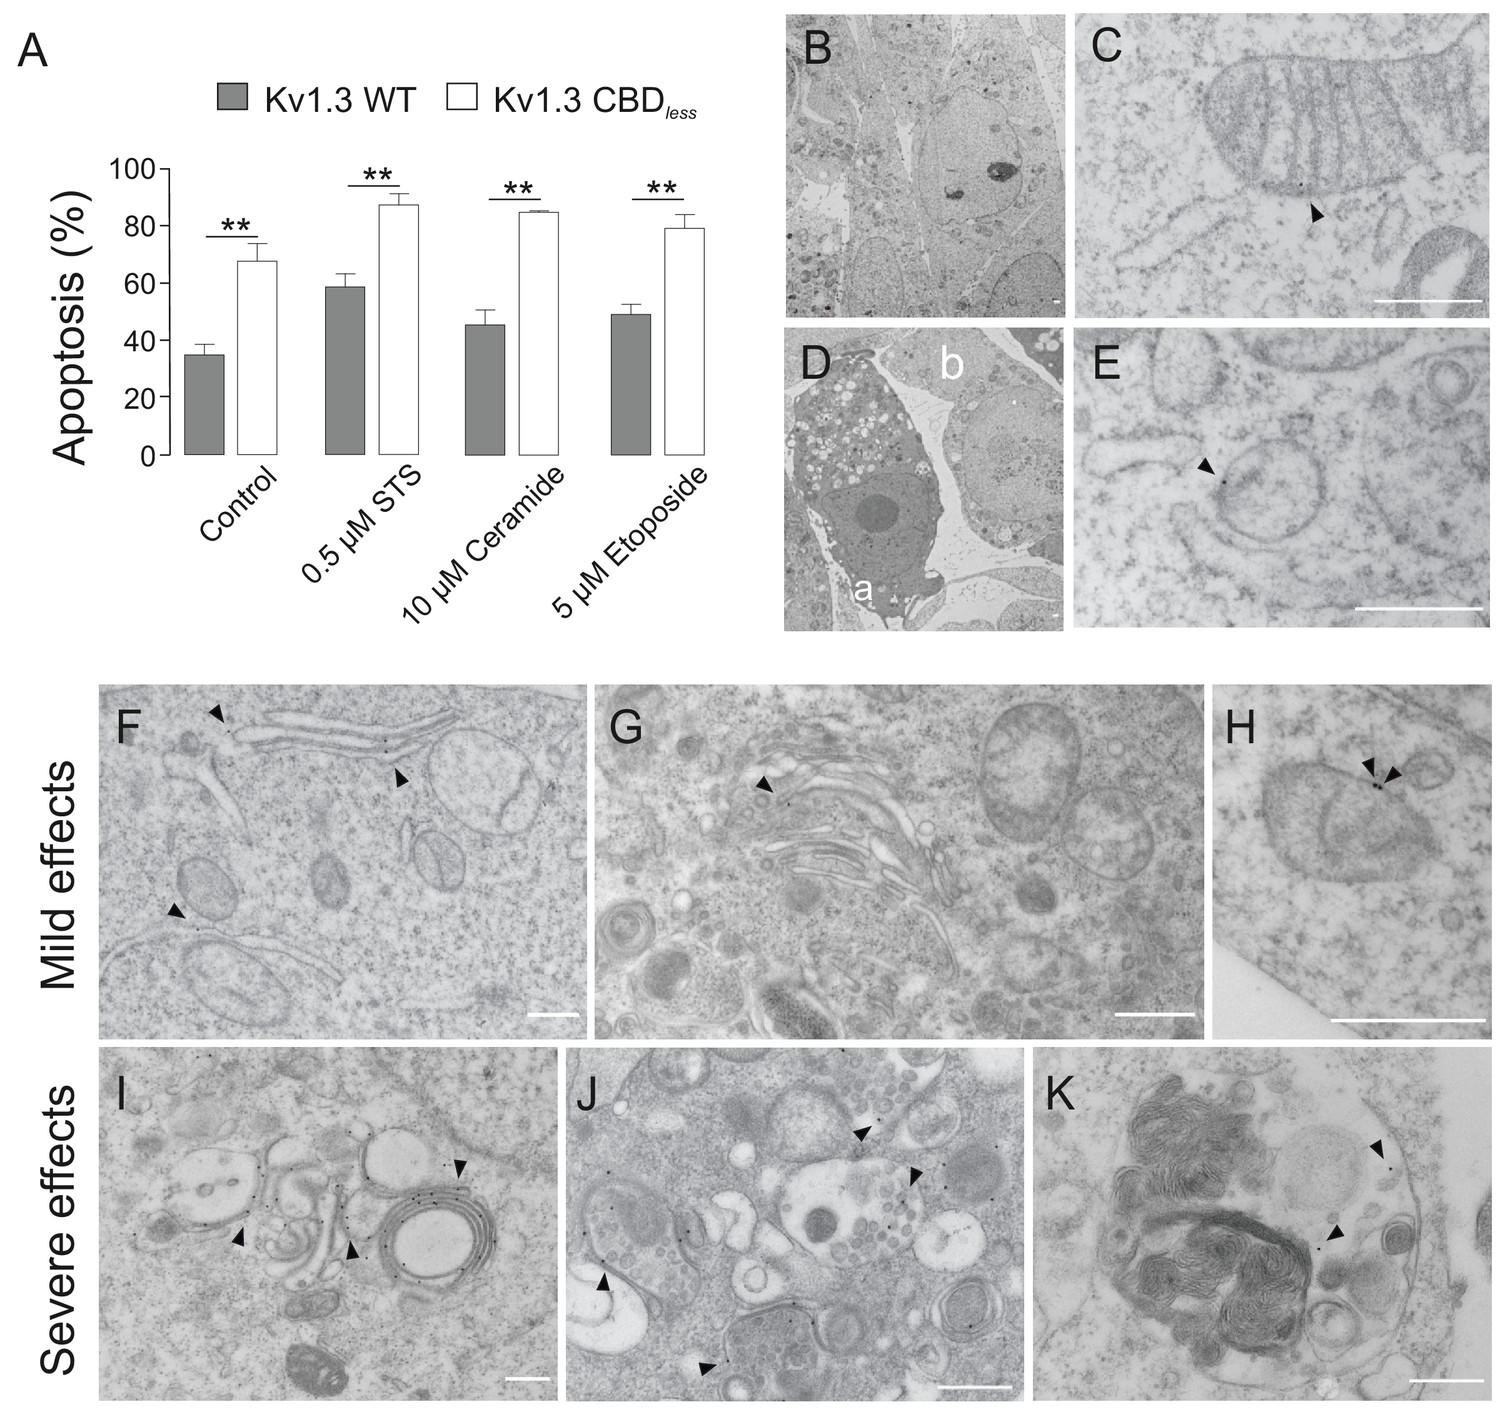
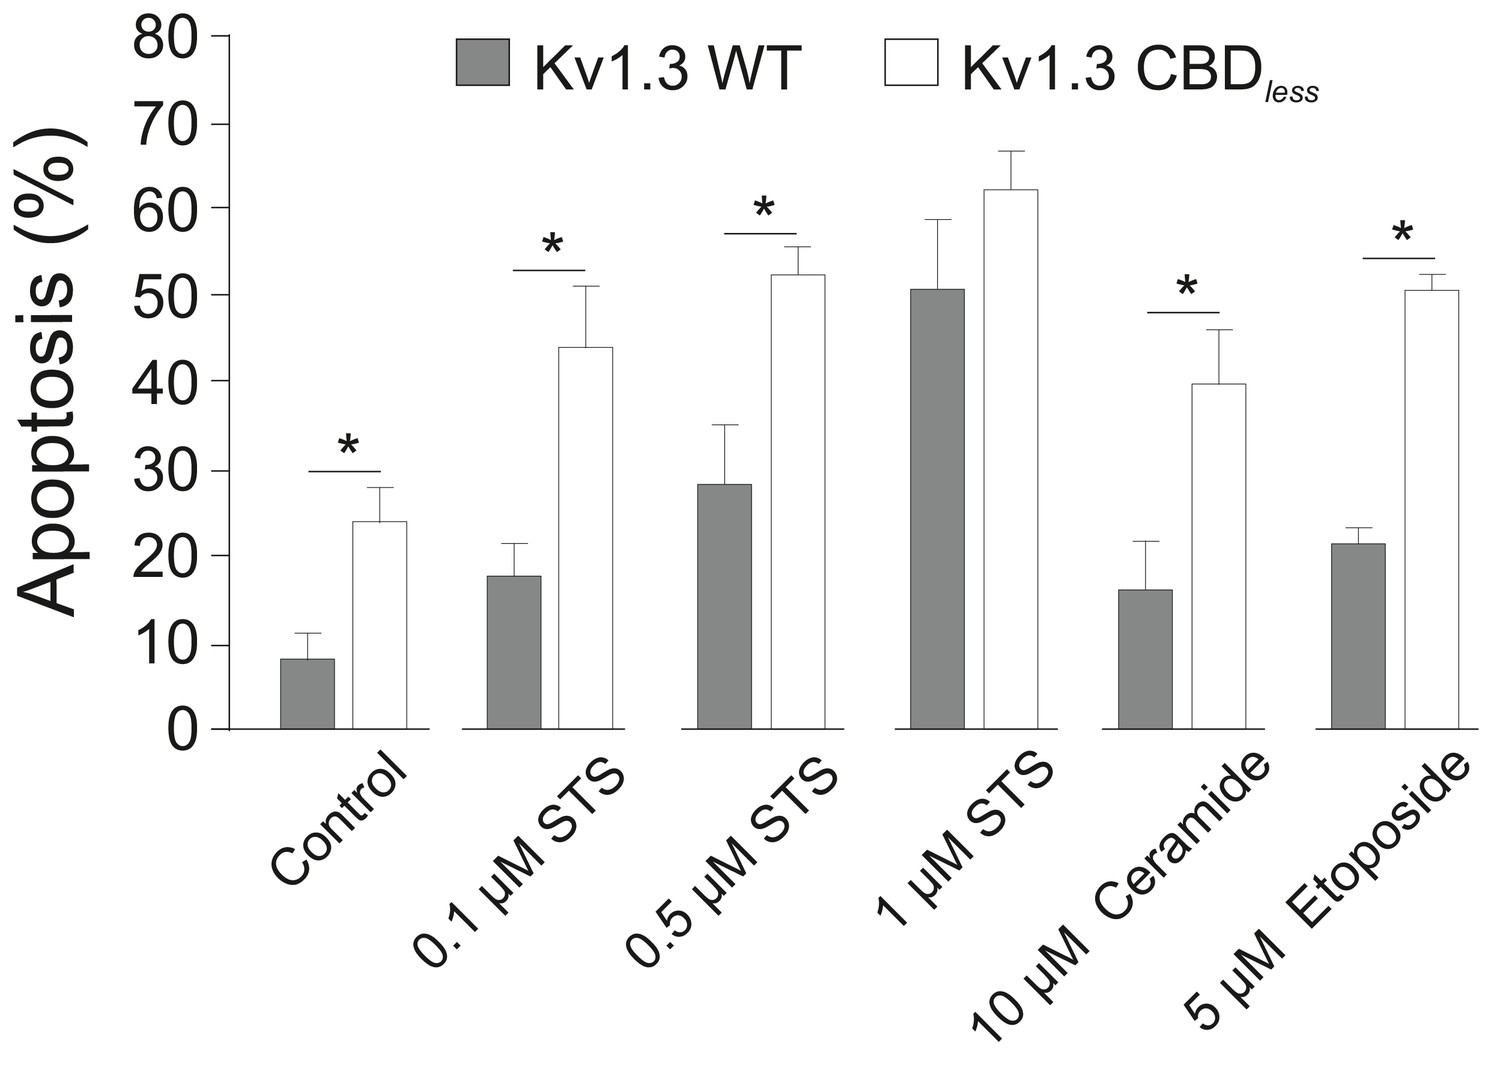
Kv1.3 CBDless sensitizes cells to apoptosis.
HEK-293 cells were transfected with Kv1.3YFP WT or Kv1.3YFP CBDless. (A) Flow cytometry analysis evaluating apoptosis by Annexin V staining. Cells were cultured for 24 hr in the absence (control) or the presence of different pro-apoptotic compounds (0.5 μM staurosporine [STS], 10 μM ceramide, and 5 μM etoposide). Transfected cells were sorted and the % of Annexin V-positive cells was calculated. Gray bars, Kv1.3 WT. White bars, Kv1.3 CBDless. Data are the mean ± SE (n = 3). **p<0.01 (Student’s t-test). (B–K) Electron micrographs showing ultrastructural features of HEK-293 cells transfected with Kv1.3YFP WT (B, C) or Kv1.3YFP CBDless (D–K). Kv1.3 was immunolabeled with 18 nm diameter gold particles. Arrowheads show Kv1.3. (B) Normal appearance of organelles in a Kv1.3YFP WT-transfected cell. (C) Expression of Kv1.3YFP WT at the inner mitochondrial membrane. (D) Kv1.3YFP CBDless triggered either severe (a) or mild (b) apoptotic cell phenotypes in cells. (E) Kv1.3 CBDless at the mitochondrial membrane. Note the absence of mitochondrial cristae. (F–H) Localization of Kv1.3 CBDless in cells affected with a mild apoptotic phenotype. (F) Kv1.3 CBDless at the ER. (G) Kv1.3 CBDless at the Golgi apparatus. (H) Kv1.3 CBDless at the mitochondrial membrane. (I–K) Localization of Kv1.3 CBDless in cells affected with a severe apoptotic phenotype. (I) Notable accumulation of Kv1.3 CBDless in membranes surrounding lysosomes or autolysosomes. (J) Intense staining of Kv1.3 CBDless at multivesicular bodies. (K) Kv1.3 CBDless in vacuole containing membrane whorls. Bars represent 500 nm.
Figure 6—figure supplement 1
Flow cytometry evaluates apoptosis by Annexin V staining.
Mouse melanoma B16F10 cells were transfected with Kv1.3YFP WT or Kv1.3YFP CBDless and treated for an additional 24 hr with different pro-apoptotic agents. Transfected cells were sorted and % of Annexin V-positive cells was obtained. Gray bars, Kv1.3 WT. White bars, Kv1.3 CBDless. Data are the mean ± SE (n = 3). *p<0.05 (Student’s t-test).
Figure 6—figure supplement 2
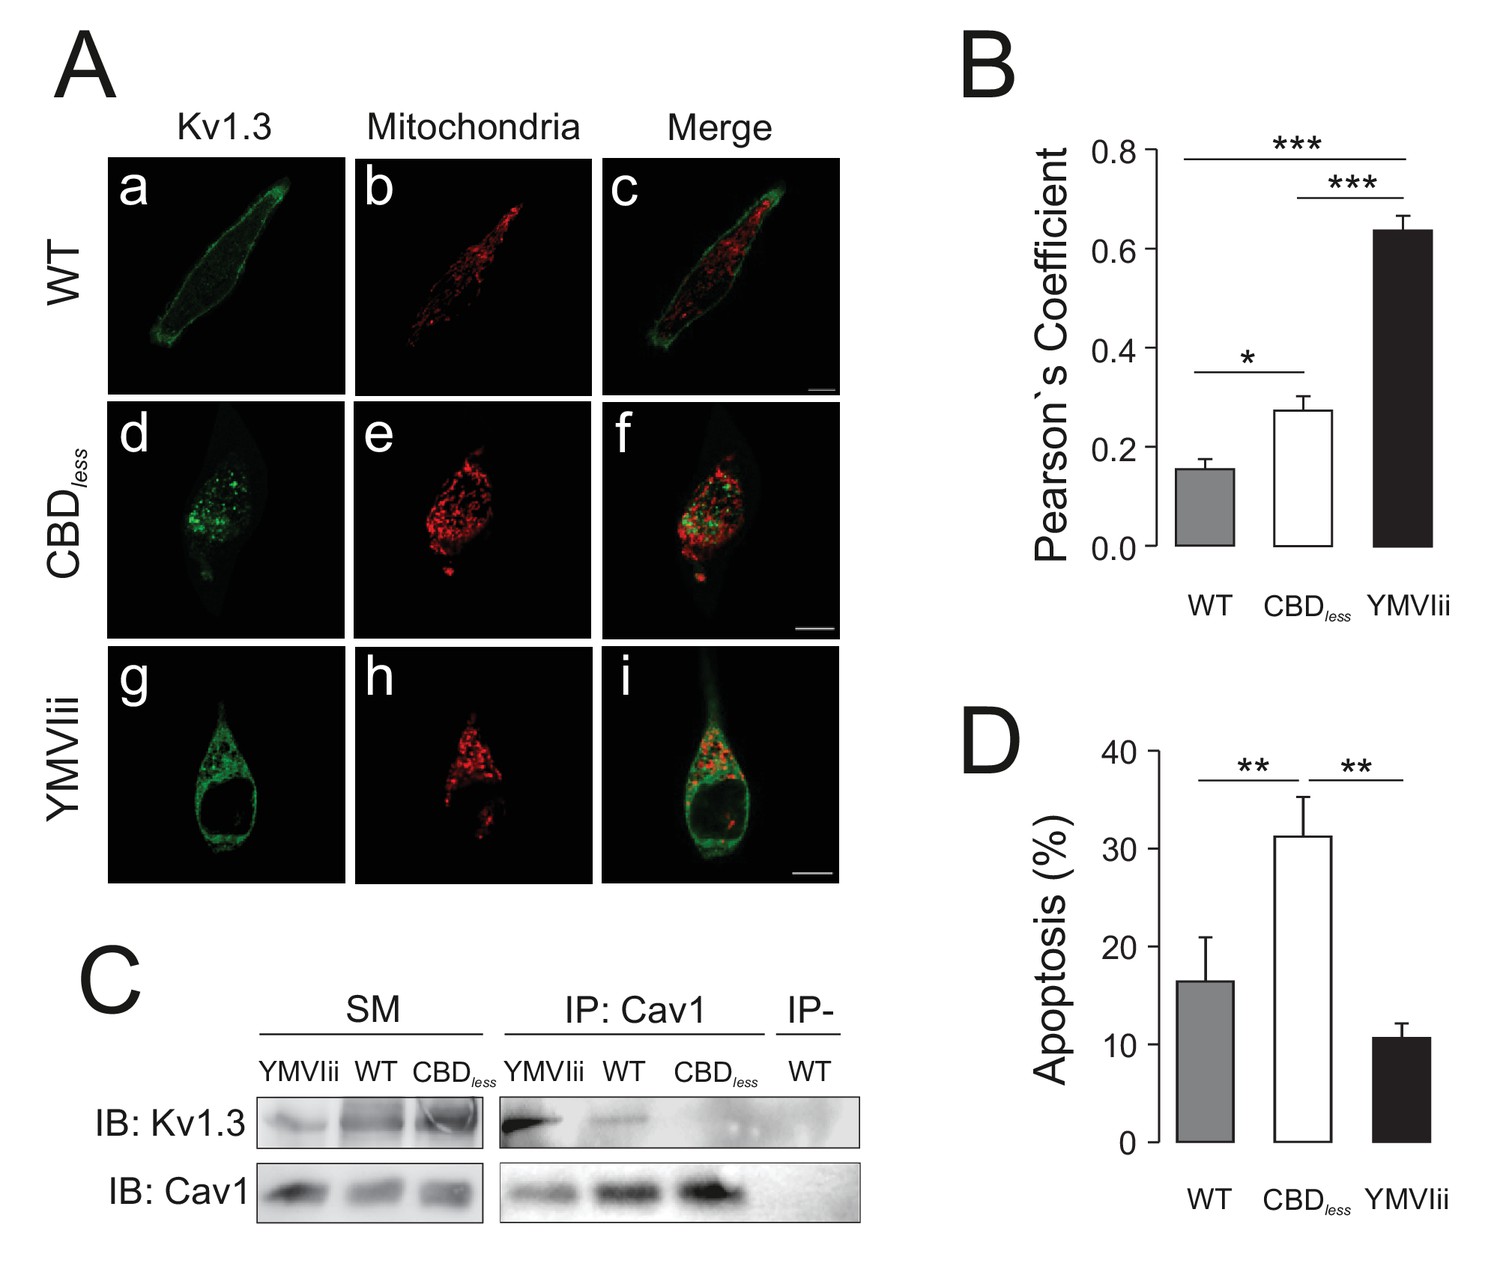
The accumulation of Kv1.3 in mitochondria is not responsible for the increase in apoptosis.
HEK 293 cells were transfected with Kv1.3 WT, Kv1.3 CBDless, or the Kv1.3 YMVIii mutant. See Materials and methods for details. The pmitoRFP mitochondrial marker was also cotransfected to stain mitochondria. (A) Representative confocal images from WT (Aa–Ac), CBDless (Ad–Af), and YMVIii (Ag–Ai) channels. Green, Kv1.3 channels; red, mitochondria; merge, colocalization of channel and mitochondria in yellow. Bars represent 20 μm. (B) Quantification of Kv1.3/mitochondria colocalization was performed by Pearson’s coefficient. Data are the mean ± SE (n > 20 cells). (C) Coimmunoprecipitation of Kv1.3 channels and Cav1. HEK 293 lysates were immunoprecipitated against Cav1 (IP: Cav1) and blots were immunoblotted against YFP-tagged channels (IB: Kv1.3) and Cav1 (IB: Cav1). IP−, absence of anti-Cav1 antibody. SM, starting material. (D) Kv1.3-transfected cells were sorted and % of Annexin V-positive cells was obtained. Gray bars, Kv1.3 WT. White bars, Kv1.3 CBDless. Black bars, Kv1.3 YMVIii. Data are the mean ± SE (n > 4). *p<0.05; **p<0.01; ***p<0.001 (one-way ANOVA, Bonferroni post hoc test).
Figure 6—figure supplement 3
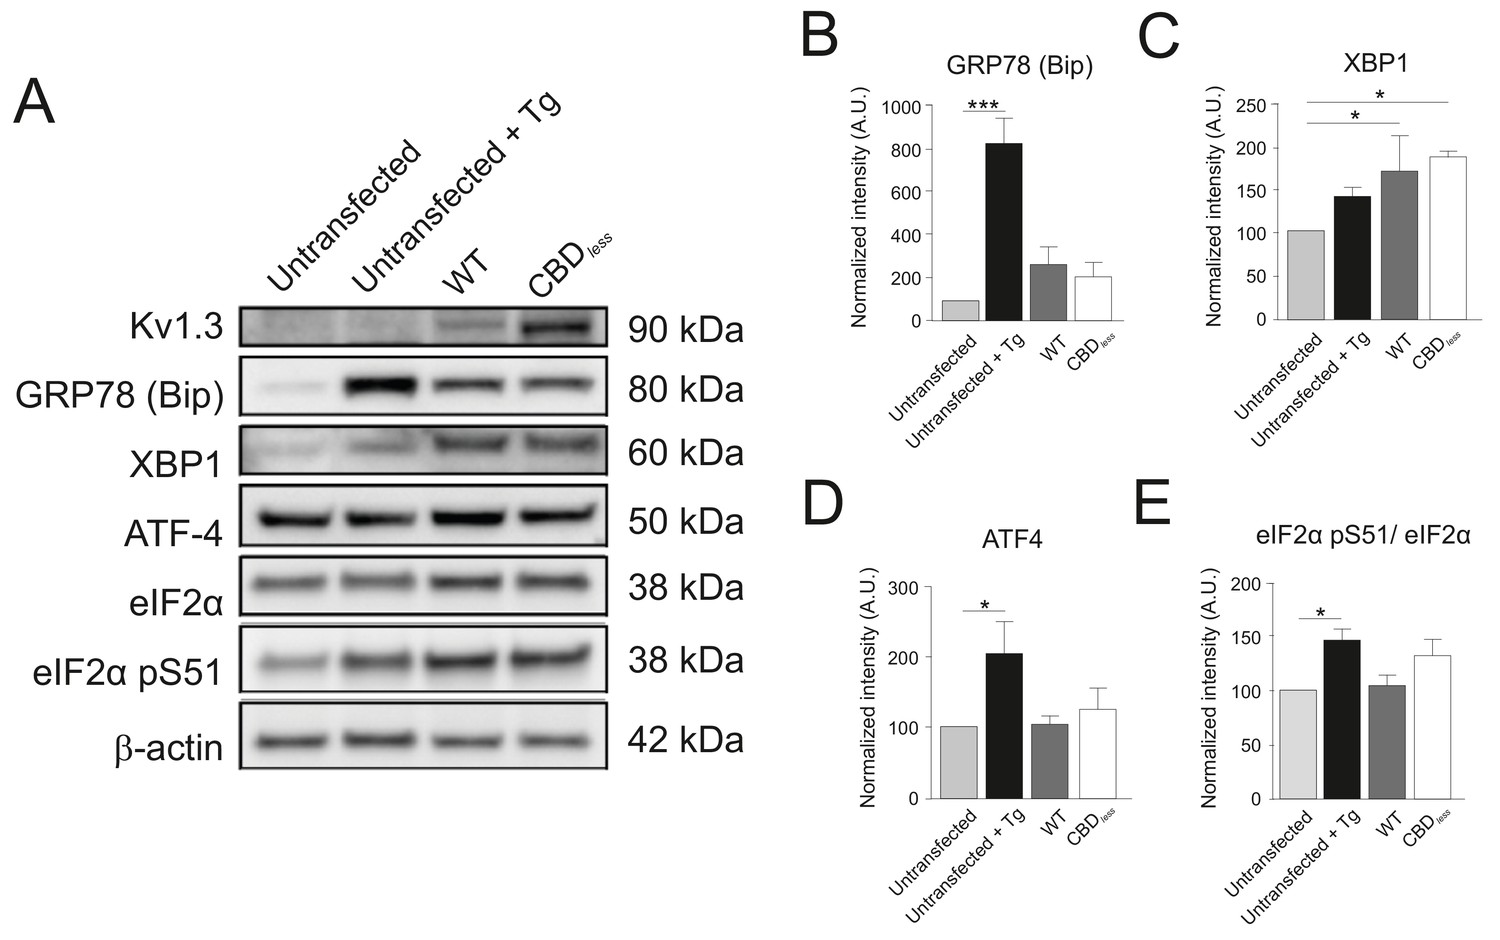
Kv1.3 CBDless triggered no ER-stress.
HEK-293 cells were transfected with Kv1.3YFP WT and Kv1.3YFP CBDless. (A) Representative immunoblots showing the expression of ER-stress markers. Untransfected cells treated or not with 2 µM Thapsigargin (Tg) were used as positive and negative controls of ER-stress, respectively. Total protein extracts were separated by SDS-PAGE and immunoblotted for YFP (Kv1.3), GRP78 (Bip), XBP1, ATF-4, eIF2α, eIF2α pS51, and β-actin (loading control). (B–E) Relative expression (arbitrary units, A.U.) of different ER-stress markers. Data are the mean ± SE (n = 3–6). *p<0.05, ***p<0.001 (one-way ANOVA). Light gray bars, untransfected cells; black bars, untransfected cells treated with Tg; drak gray bars, cells transfected with Kv1.3YFP; white bars, cells transfected with Kv1.3YFP CBDless.
Figure 7
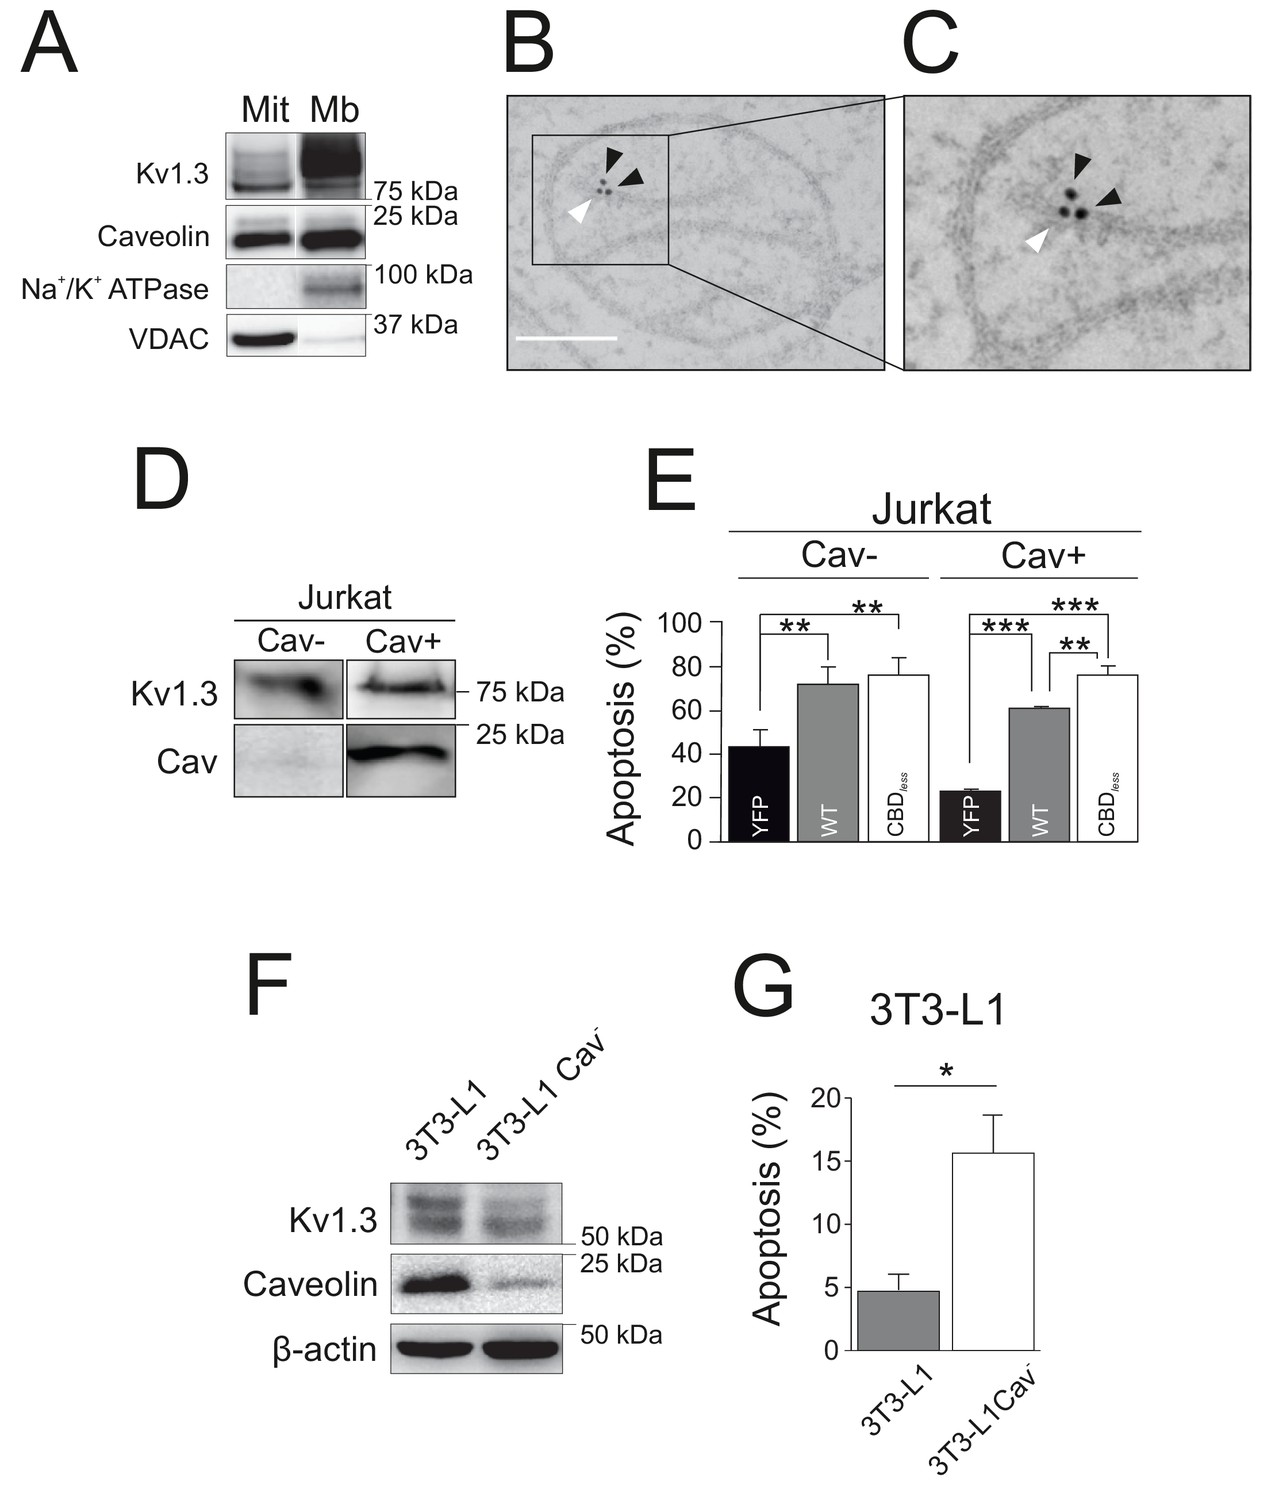
Caveolin modulates the pro-apoptotic activity of Kv1.3.
(A) Subcellular fractionation was used to isolate mitochondrial (Mit) and plasma membrane (Mb) fractions in HEK-293 cells transfected with Kv1.3YFP WT. Samples were immunoblotted for GFP (Kv1.3), Caveolin, Na+/K+ ATPase, and VDAC. (B, C) Electron micrographs showing HEK-293 cells transfected with Kv1.3YFP WT. Kv1.3 was immunolabeled with 18 nm gold particles (black arrowheads) and Cav1 with 12 nm gold particles (white arrowhead). The square inset in (B) indicates the zoomed in region in (C). Scale bars represent 500 nm. (D) Regular human Jurkat T lymphocytes express Kv1.3 and a negligible amount of endogenous Cav1 (Cav−). In addition, a Jurkat cell line with notable expression of Cav1 was selected (Cav+). (E) Jurkat cells (Cav− and Cav+) were electroporated with Kv1.3YFP WT or Kv1.3YFP CBDless. After 24 hr, apoptosis was assessed by Annexin V staining with flow cytometry. Black bar, cells electroporated with YFP; gray bar, Kv1.3 YFP WT; white bar, Kv1.3YFP CBDless. (F) Mouse 3T3-L1 and 3T3-L1 Cav- preadipocytes were analyzed for the expression of endogenous Cav1 and Kv1.3. β-actin was used as a loading control. (G) Flow cytometric analysis quantifying apoptosis by Annexin V on 3T3-L1 (gray bar) and 3T3-L1 Cav- (white bar) preadipocytes. Note that the amount of Cav1 exerted notable effects on the Kv1.3-related apoptosis in native 3T3-L1 cells. Values are the mean ± SE of 3–6 independent experiments. *p<0.05; **p<0.01; ***p<0.01 (one-way ANOVA).
Figure 8
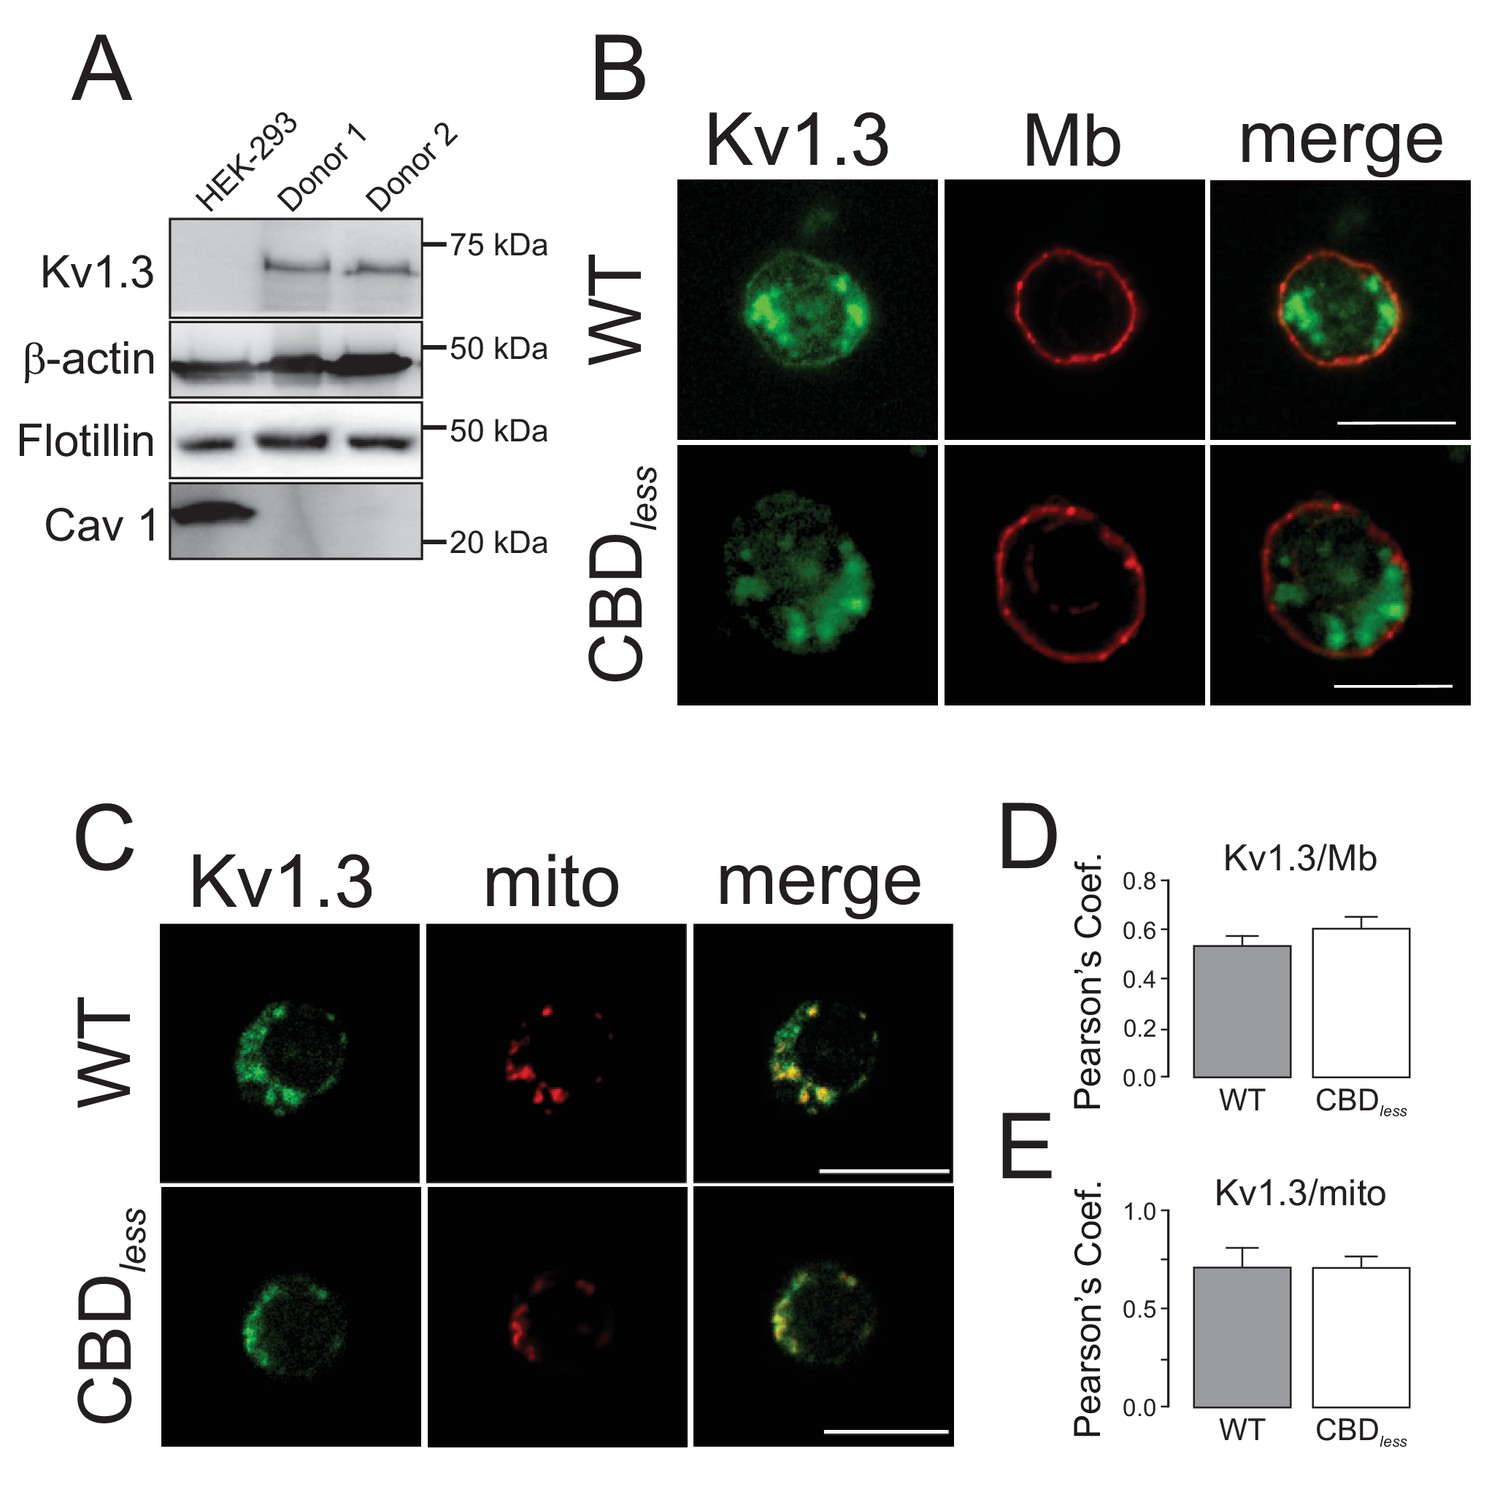
Kv1.3 colocalizes with plasma membrane and mitochondria in primary human T lymphocytes.
CD4+ lymphocytes were isolated from human blood as indicated in Materials and methods. (A) Representative western blot from HEK 293 cells and T lymphocytes samples from two independent human donors showing differential protein expression of Kv1.3, Flotillin, and Cav1. β-Actin was a loading control. (B) Representative confocal images of Kv1.3 colocalization in plasma membrane (Mb) from Kv1.3YFP WT and Kv1.3YFP CBDless-transfected cells. WGA stained plasma membrane. (C) Representative confocal images of Kv1.3 colocalization in mitochondria (mito) from Kv1.3YFP WT and Kv1.3YFP CBDless expressing cells. MitoTracker was used for mitochondrial staining. Scale bar represents 10 μm. Quantification of Kv1.3/Mb (D) and Kv1.3/mito (E) colocalization was performed by Pearson’s coefficient. Data are the mean ± SE (n > 20), Student’s t-test. Gray bars, Kv1.3YFP WT cells; white bars, Kv1.3YFP CBDless cells.
Figure 9
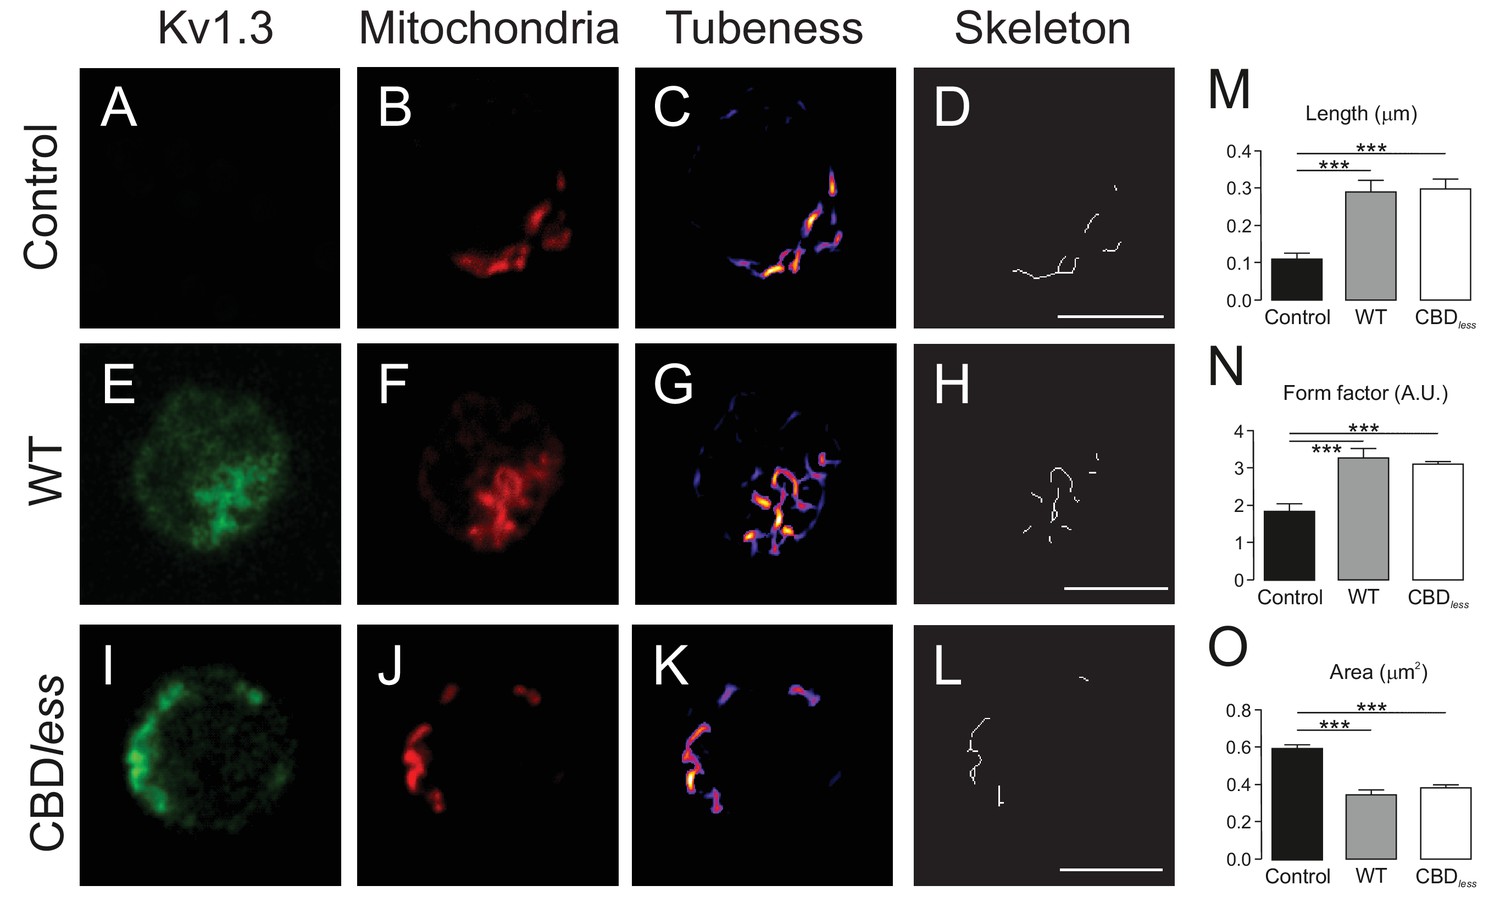
The expression of Kv1.3YFP WT and Kv1.3YFP CBDless in T lymphocytes alters the mitochondrial morphology.
Human CD4+ T lymphocytes were transfected with Kv1.3YFP WT or Kv1.3YFP CBDless. (A–D) Representative confocal images of non- transfected T cells. (E–H) T lymphocytes transfected with Kv1.3YFP WT. (I–L) T lymphocytes transfected with Kv1.3YFP CBDless. (A, E, and I) Kv1.3YFP (green); (B, F, and J) MitoTracker (red). Images were processed (tubeness (C, G, and K) and skeleton (D, H, and L)) to perform morphometric analysis (M, N, and O) of mitochondria. Scale bar represents 10 μm. (M) The length of mitochondrial networks was measured as the average area of the skeletonized binary image. (N) The form factor (arbitrary units, A.U.) describes the particle shape complexity and is computed as the average (perimeter)2/(4π·area). A circle corresponds to a minimum value of 1. (O) Average area of particles detected on the binary image. Data are the mean ± SE (n > 20). ***p<0.001 (Student’s t-test).
Figure 10
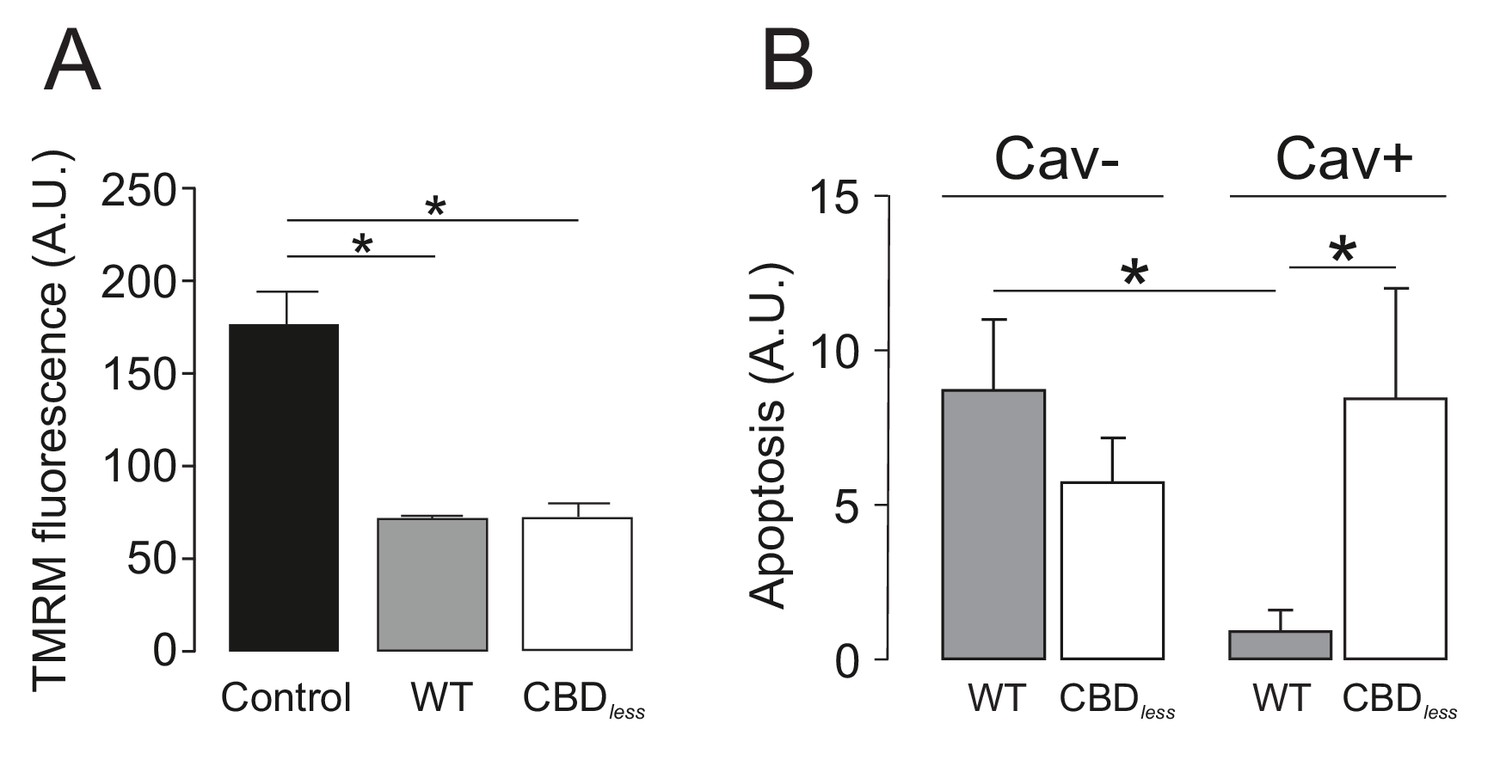
Caveolin-1 protects from apoptosis when associated with Kv1.3 in primary human T lymphocytes.
Human CD4+ T lymphocytes were transfected with Kv1.3YFP WT or Kv1.3YFP CBDless and the mitochondrial membrane potential (TMRM) and apoptosis were measured. YFP-transfected cells were used as a control. (A) Mitochondrial membrane potential was determined by tetramethyl rhodamine methyl ester (TMRM) fluorescence. Cells were incubated with TMRM and analyzed by flow cytometry. A.U, arbitrary units. (B) T cells were electroporated with Kv1.3YFP WT or Kv1.3YFP CBDless with (Cav+) or without (Cav−) Cav1 Cerulean. After 24 hr, transfected cells were sorted and apoptosis was assessed by Annexin V staining with flow cytometry. The level of apoptosis in arbitrary units (A.U.) was measured in each group by resting the value of basal apoptosis in cells transfected with YFP in the presence (Cav−) or the absence (Cav−) of Cav1. Black bar, cells electroporated with YFP; gray bar, Kv1.3 YFP WT; white bar, Kv1.3YFP CBDless. Cav−, regular CD4+ cells without Cav 1; Cav+, T cells transfected with Cav1 Cer. Data are the mean ± SE (n = 5–7). *p<0.05 (one-way ANOVA).
Author response image 1
Author response image 2
Additional files
Download links
A two-part list of links to download the article, or parts of the article, in various formats.
Downloads (link to download the article as PDF)
Open citations (links to open the citations from this article in various online reference manager services)
Cite this article (links to download the citations from this article in formats compatible with various reference manager tools)
A novel mitochondrial Kv1.3–caveolin axis controls cell survival and apoptosis
eLife 10:e69099.
https://doi.org/10.7554/eLife.69099


