Cavefish cope with environmental hypoxia by developing more erythrocytes and overexpression of hypoxia-inducible genes
- Department of Biology, University of Maryland, United States
Figures
Figure 1
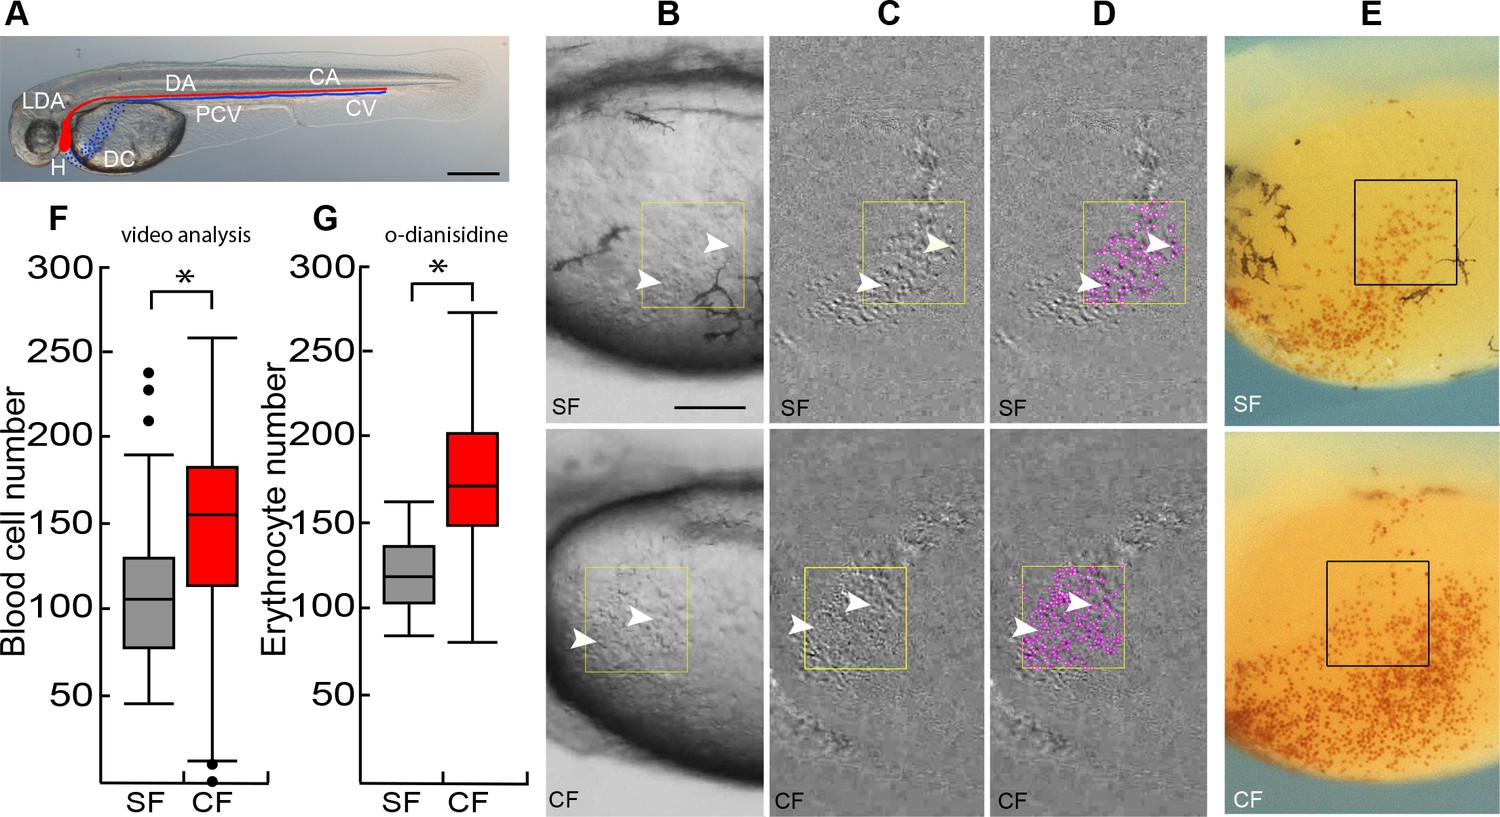
Cavefish have more erythrocytes than surface fish.
(A) At 36 hpf blood circulates from the heart (H) through the lateral dorsal aorta (LDA), the dorsal aorta (DA) and caudal artery (CA) (blood flow shown in red), and back to the heart through the caudal vein (CV), the posterior cardinal vein (PCV), and the Duct of Cuvier (DC) (blood flow shown in blue). Scale bar is 200 µm. (B–D). Video analysis of circulating blood cells (arrowheads) in a region of interest (ROI, boxes) in the DC of surface fish (SF) and cavefish (CF) larvae at 36 hpf visualized by subtraction of two video frames 0.15 s apart (C, D) and quantified using the plugin TrackMate (ImageJ) (D, purple dots). (E) o-dianisidine staining of red blood cells in the DC of surface fish (SF) and cavefish (CF) larvae at 36 hpf. Boxes: erythrocyte quantification regions. Scale bar in E is 100 µm, B-E are the same magnifications. (F, G). Quantification of blood cells in the DC by video analysis (F) and o-dianisidine staining. Box plots show the median, quartiles, min-max values and outliers (dots). Asterisks: p < 0.05, N = 72 (in F) and p < 0.0001, N = 36 (in G). Statistics by Wilcoxon/Kruskal-Wallis Rank Sums test.
-
Figure 1—source data 1
Cavefish have more erythrocytes than surface fish.
- https://cdn.elifesciences.org/articles/69109/elife-69109-fig1-data1-v2.xlsx
Figure 2
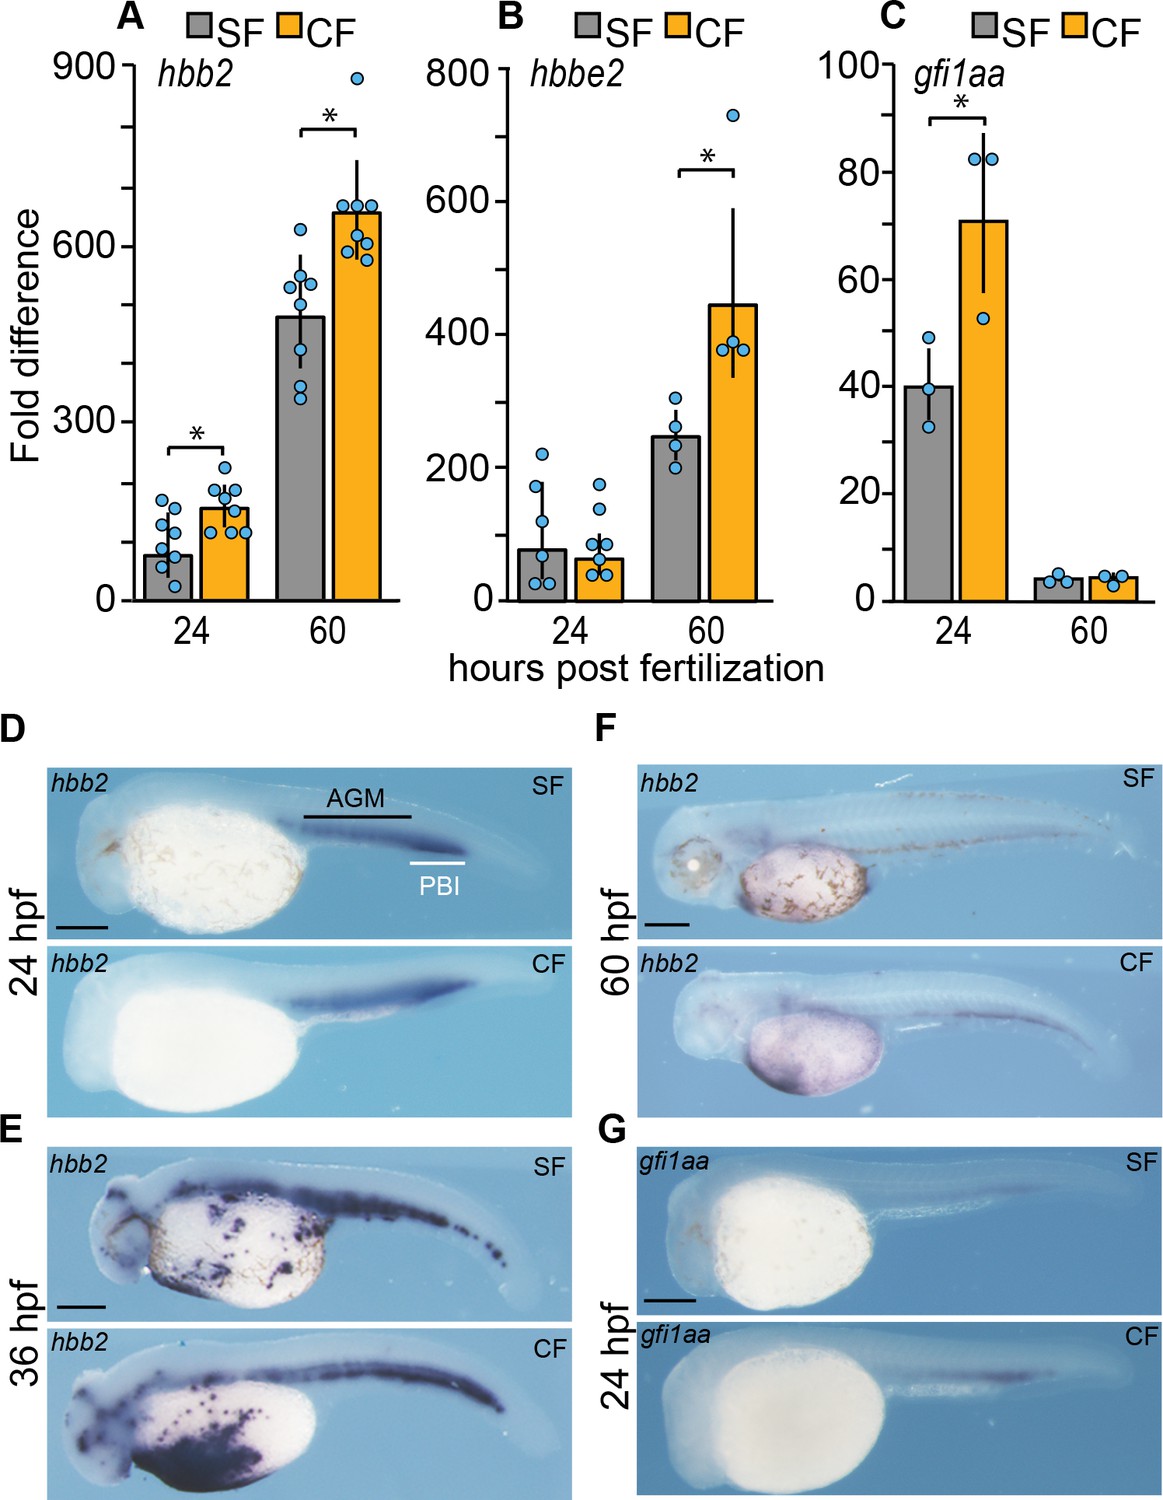
Expression of hematopoietic genes during surface fish and cavefish development.
(A–C). qPCR quantification of hhb2, hbbe2, and gfi1aa transcripts in surface fish (SF) and cavefish (CF) larvae at 24 hpf and 60 hpf. Error bars: range of fold change. Asterisks: (A) N = 8. p = 0.0045 for SF vs CF at 24 hpf and p = 0.0254 for SF vs CF at 60 hpf; (B) N = 4. p = 0.0271 for SF vs CF at 60 hpf.; (C) N = 3. p = 0.0413 for SF vs CF at 24 hpf. Statistics by two-way ANOVA followed by Student’s t test. (D–G). In situ hybridizations showing hbb2 staining at 24, 36, and 60 hpf, (D–F) and gfi1aa staining (G) at 24 hpf in CF and SF. AGM: aorta-gonad-mesonephros. PBI: posterior blood island. Scale bars are 200 µm in each frame. Magnifications are the same in SF and CF.
-
Figure 2—source data 1
Expression of hematopoeitic genes during surface fish and cavefish development.
- https://cdn.elifesciences.org/articles/69109/elife-69109-fig2-data1-v2.xlsx
Figure 3

Hematopoietic domains in 14 hpf surface fish and cavefish embryos.
(A). In situ hybridizations showing expression of the gfi1aa (top frames) and hbb2 (bottom frames) genes in the anterior lateral mesoderm (ALM, arrowheads) and posterior lateral mesoderm (PLM, arrows) in surface fish (SF) and cavefish (CF). (B) Expression of the macrophage marker gene lcp1 in SF and CF embryos. (C). Expression of the hematopoietic marker gene lmo2 in the ALM and PLM of CF and SF embryos, and expansion of expression in CF embryos. Scale bar in A is 200 µm; magnification is the same in all frames.
Figure 4
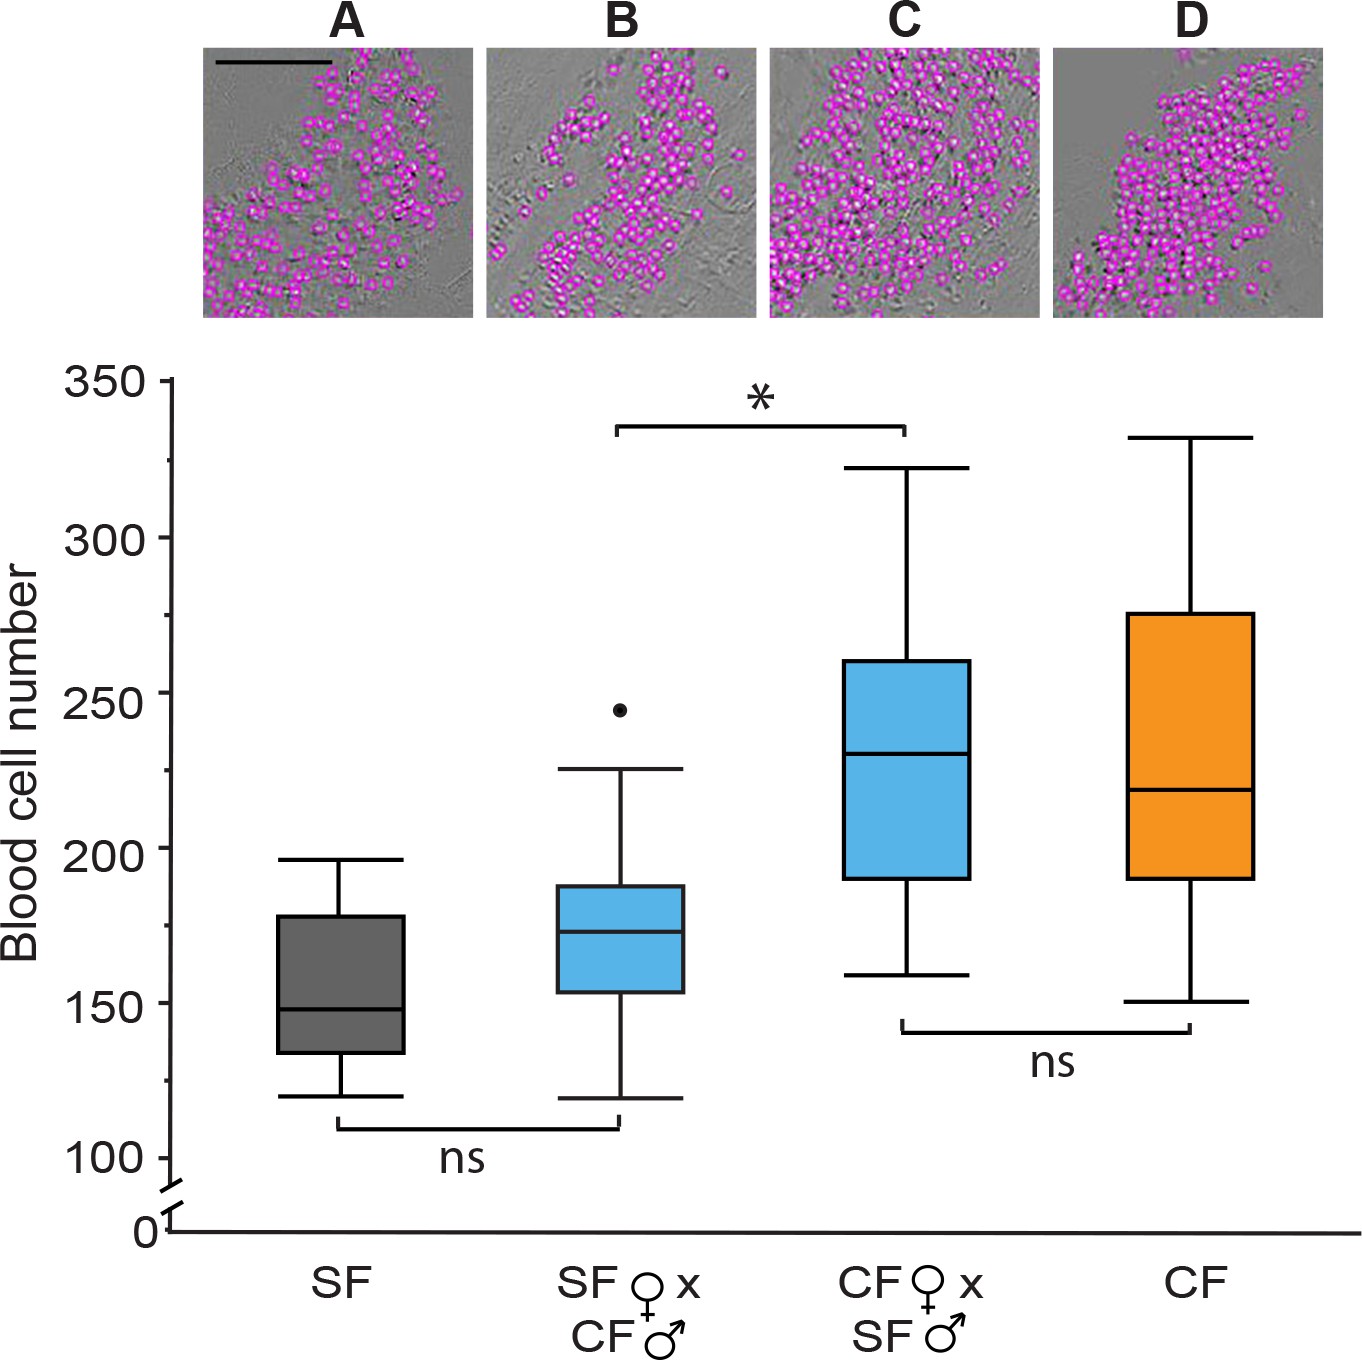
Maternal control of increased blood cells in cavefish determined by reciprocal hybridizations.
Video imaging in the Duct of Cuvier and blood cell quantification at 34 hpf in the F1 progeny of a (A) surface fish (SF) X SF control cross, (B) a SF female X cavefish (CF) male cross, (C) a CF female X SF male cross, and (D) a CF X CF control cross. (A–D) Top row. Representative images of blood cell number aligned with box plots below. Scale Bar is 100 µm; magnifications are the same in each frame. Bottom row. Boxplots of blood cell numbers showing medians, quartiles, min-max values, and outliers (dots). Asterisks: p < 0.05. ns: not significant. N = 20 for each box plot. Statistics by Wilcoxon/Kruskal-Wallis Rank Sums test followed by Wilcoxon for each pair.
-
Figure 4—source data 1
Maternal control of increased blood cells in cavefish determined by reciprocal hybridizations.
- https://cdn.elifesciences.org/articles/69109/elife-69109-fig4-data1-v2.xlsx
Figure 5
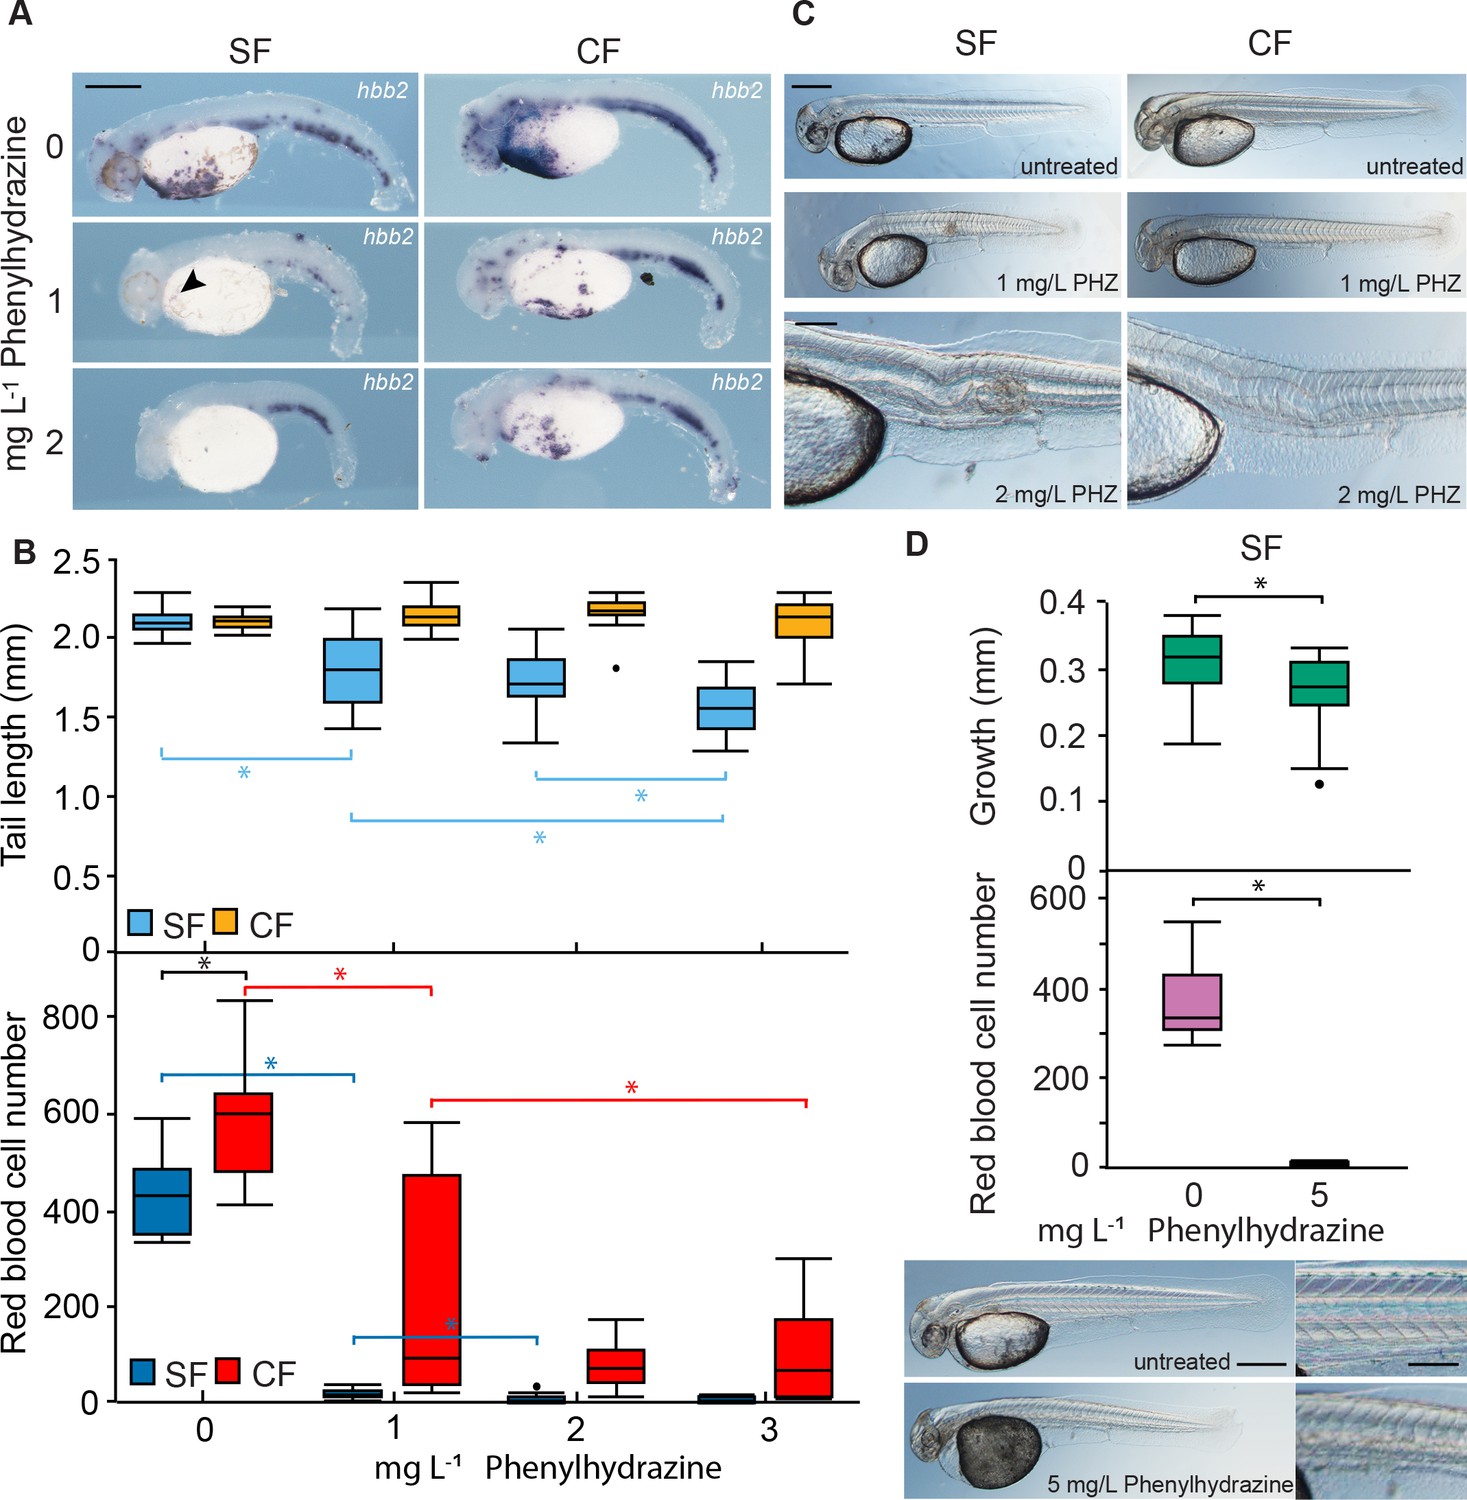
Differential effects of hemolytic anemia on surface fish and cavefish development.
(A). In situ hybridization with the hbb2 gene marker in 40 hpf larvae treated with different phenylhydrazine (PHZ) concentrations. Magnification is the same in all frames. (B). Larval tail length (top) and erythrocyte number in the Duct of Cuvier (DC) (bottom) in SF and CF embryos as a function of PHZ concentration. Asterisks in B (top) p < 0.0001. N = 23 for SF 0, 2 mg L–1 and CF 3 mg L–1. N = 24 for SF 1 and 3 mg L–1 and CF 0, 1, and 2 mg L–1. Asterisks in B (bottom) consecutively from left to right: p = 0.0197, p < 0.0001, p = 0.0002, p < 0.0001, and p 0.0102. N = 20 for SF 0, 1, 2 and CF 3 mg L–1. N = 10 for SF 3 mg L–1. N = 19 for CF 0 mg L–1. N = 21 for CF 1 mg L–1. N = 22 CF 2 mg L–1. Statistics by Wilcoxon/Kruskal-Wallis Rank Sums test followed by Wilcoxon for each pair. (C). Axial defects induced by hemolytic anemia in SF and CF embryo. Scale bars are 200 µm; magnifications are the same in top four frames and bottom two frames. Data from B and C were obtained from the same embryos. (D). Effects of a 1 hr. treatment with 5 mg/L PHZ on SF post-anal tail growth (top), erythrocyte number measured in the DC (middle), and axial development (bottom left and right). Scale bars in A, C (upper frame), and D (left frame) are 500 µm. Scale bars in C (lower frame) and D (right frame) are 200 µm. Asterisk (top): p = 0.0115, N = 20. Statistics by Student’s t test. Asterisk (middle): p = 0.0001, N = 10. Statistics by Wilcoxon/Kruskal-Wallis Rank Sums test followed by Wilcoxon for each pair. Box plots in C and D show whiskers ( = 5%), mean (line) and outlier (dot). SF: surface fish. CF: cavefish. Box plots show the median, quartiles, min-max values and outliers (dots).
-
Figure 5—source data 1
Differential effects of hemolytic anemia on surface fish and cavefish development.
- https://cdn.elifesciences.org/articles/69109/elife-69109-fig5-data1-v2.xlsx
Figure 6
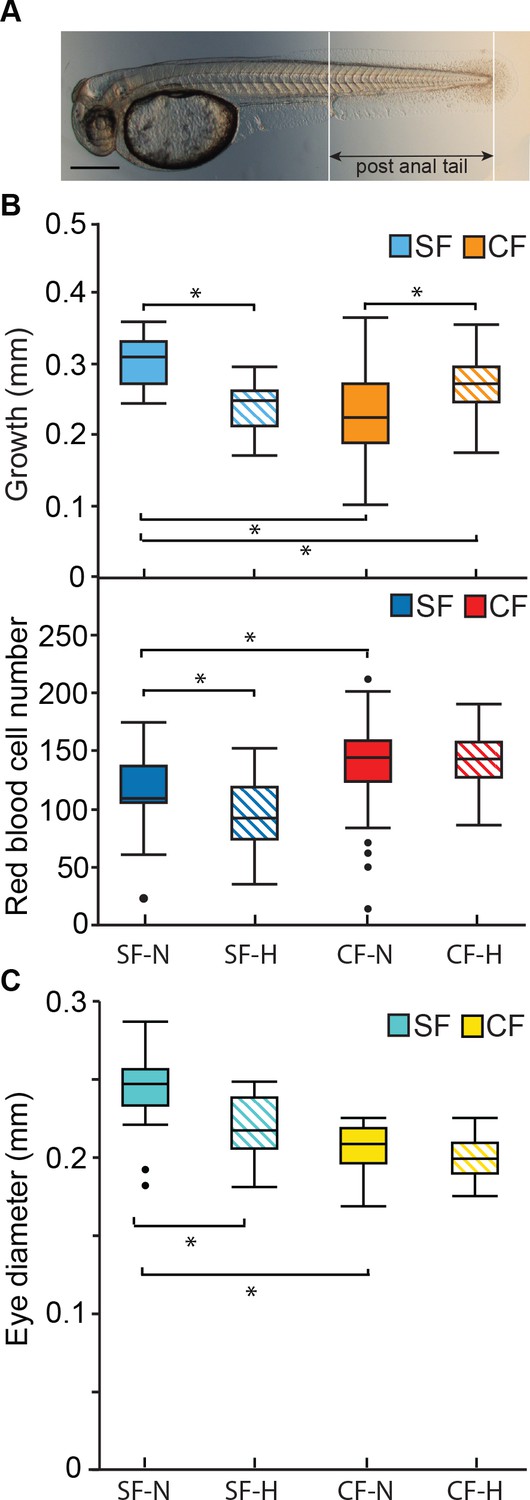
Effects of laboratory induced hypoxia on surface fish and cavefish growth.
(A). Image of a 36 hpf surface fish larval showing post-anal tail length. Scale Bar is 200 µM. (B). Relative post-anal tail growth (top) and erythrocyte numbers (bottom) of surface fish and cavefish over an 18 hr. period under normoxic and hypoxic (1 mg/L oxygen) conditions. Top frame asterisks from left to right: p < 0.0001, p = 0.002; p < 0.0001, and p = 0.0021. N = 23 for SF-N and SF-H. N = 46 for CF-N. N = 47 for CF-H. Statistics by Wilcoxon/Kruskal-Wallis Rank Sums test followed by Wilcoxon for each pair. Middle frame asterisks from left to right: p = 0.0116, and p = 0.0078. N = 22 for SF-N. N = 21 for SF-H. N = 47 for CF-N, and N = 45 for CF-H. Statistics by one-way ANOVA followed by Student’s t-test. (C) Difference in eye diameters in surface fish and cavefish after 18 hr. of hypoxia or normoxia. Bottom frame asterisks: p = 0.0002 and p < 0.0001. N = 18 for SF-N. N = 14 for SF-H. N = 30 for CF-N. N = 28 for CF-H. Statistics by one-way ANOVA followed by Student’s t-test. Box plots show median, quartiles and min-max values.
-
Figure 6—source data 1
Effects of laboratory induced hypoxia on surface fish and cavefish growth.
- https://cdn.elifesciences.org/articles/69109/elife-69109-fig6-data1-v2.xlsx
Figure 7
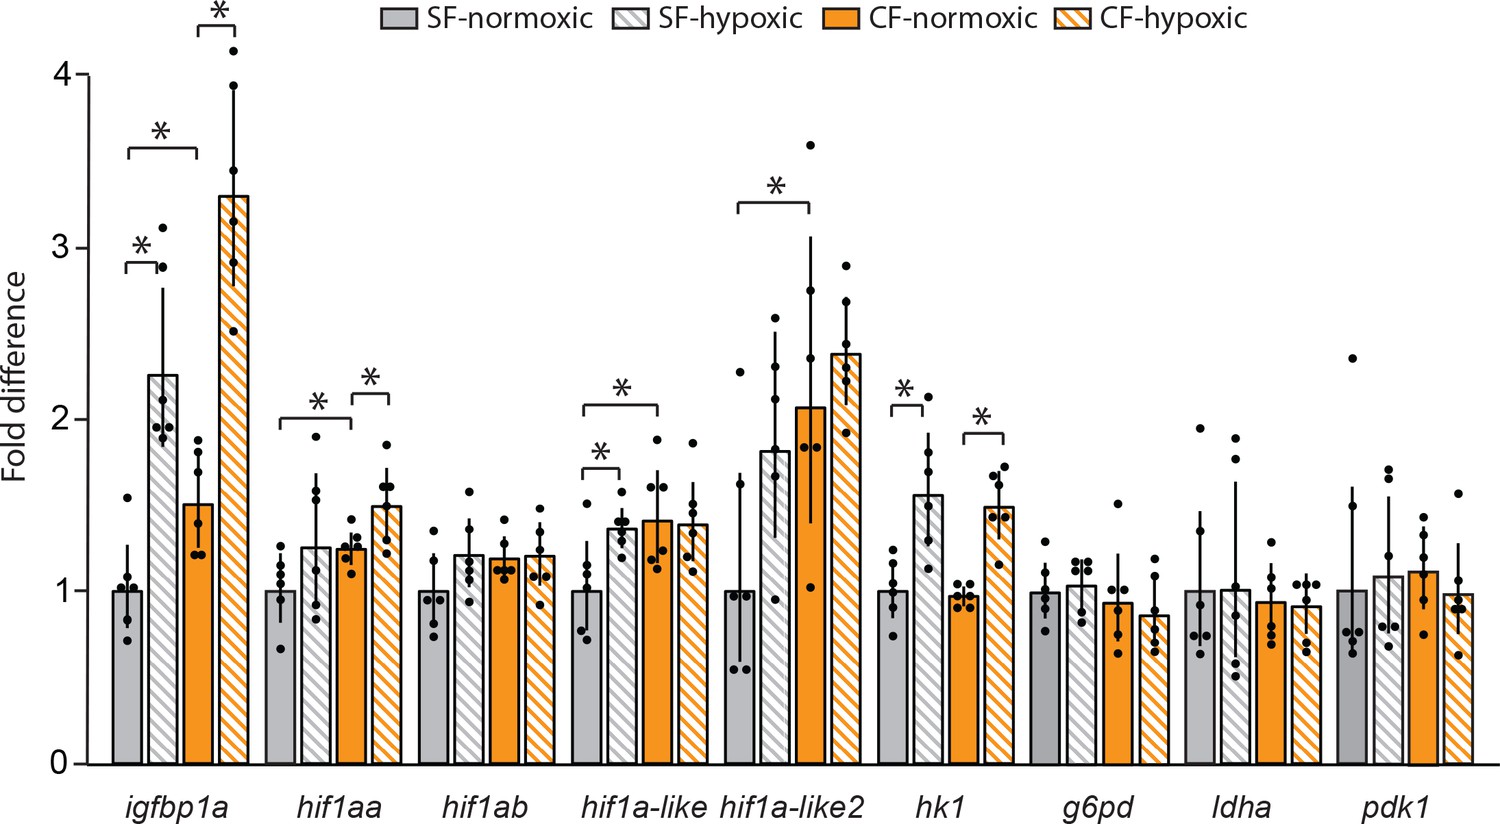
Changes in expression of some of the key HIF pathway genes in surface fish and cavefish exposed to hypoxia (1 mg/L oxygen) or normoxia.
Bars indicate qPCR fold difference over surface fish in normoxic condition. Error bars: range of fold change. Asterisks from left to right: p < 0.0001, p < 0.0001, p = 0.0044, p = 0.0306, p = 0.453, p = 0.0155, p = 0.0083, p = 0.0306, p = 0.0002, and p = 0.0003. N = 6 for each determination. Statistics by one-way ANOVA followed by Student’s t-test (igfbp1a, hif1ab, hif1a-like, hif1a-like2, hk1, g6pd, ldha, pdk1) or with unequal variance by Wilcoxon/Kruskal-Wallis Rank Sums test followed by Wilcoxon for each pair (hif1aa).
-
Figure 7—source data 1
Changes in expression of some of the key HIF pathway genes in surface fish and cavefish exposed to hypoxia (1 mg/L oxygen) or normoxia.
- https://cdn.elifesciences.org/articles/69109/elife-69109-fig7-data1-v2.xlsx
Videos
Video 1
Blood cells flowing from the cardinal vein through the Duct of Cuvier to the heart in surface fish.
Video 2
Blood cells flowing from the cardinal vein through the Duct of Cuvier to the heart in cavefish.
Tables
Table 1
Penetrance of abnormalities in phenylhydrazine-treated surface fish and cavefish embryos.
| Morph | PHZ concentration | % edema | % defective notochord |
|---|---|---|---|
| SF | 0 | 0 | 0 |
| CF | 0 | 0 | 0 |
| SF | 1 | 4.1 | 87.5 |
| CF | 1 | 0 | 41.7 |
| SF | 2 | 75.0 | 100 |
| CF | 2 | 8.3 | 87.5 |
| SF | 3 | 95.8 | 100 |
| CF | 3 | 25.0 | 100 |
-
PHZ: phenylhydrazine. SF: surface fish. CF: cavefish. N = 24 for each morph treatment.
-
Table 1—source data 1
Penetrance of abnormalities in phenylhydrazine-treated surface fish and cavefish embryos.
- https://cdn.elifesciences.org/articles/69109/elife-69109-table1-data1-v2.xlsx
Key resources table
| Reagent type (species) or resource | Designation | Source or reference | Identifiers | Additional information |
|---|---|---|---|---|
| Gene (Astyanax mexicanus surface fish) | Hemoglobin subunit beta-2-like, hbb2 | NCBI:GeneID 111196758, Ensembl:ENSAMXG00000031275 | ||
| Gene (Astyanax mexicanus surface fish) | Growth factor independent 1 A transcription repressor a, gfi1aa | NCBI:GeneID103029320Ensembl:ENSAMXG00000006669 | ||
| Gene (Astyanax mexicanus surface fish) | LIM domain only 2 (rhombotin-like 1), lmo2 | NCBI:GeneID111190647 Ensembl:ENSAMXG00000032986 | ||
| Gene (Astyanax mexicanus surface fish) | Lymphocyte cytosolic protein, lcp1 | NCBI:GeneID103042114Ensembl:ENSAMXG00000012855 | ||
| Gene (Astyanax mexicanus surface fish) | hbbe2 | Ensembl:ENSAMXG00005017210 | ||
| Gene (Astyanax mexicanus surface fish) | Ribosomal protein L13a, rpl13a | NCBI:geneID:103025160Ensembl:ENSAMXG00000033532 | ||
| Gene (Astyanax mexicanus surface fish) | Guanine nucleotide binding protein (G protein) beta polypeptide 1b, gnb1b | NCBI:GeneID103023031 Ensembl:ENSAMXG00000040710 | ||
| Gene (Astyanax mexicanus surface fish) | Hypoxia-inducible factor one subunit alpha a, hif1aa | NCBI:GeneID103022448 Ensembl:ENSAMXG00000039550 | ||
| Gene (Astyanax mexicanus surface fish) | Hypoxia-inducible factor one subunit alpha b, hif1ab | NCBI:GeneID103033873 Ensembl:ENSAMXG00000019342 | ||
| Gene (Astyanax mexicanus surface fish) | Hypoxia-inducible factor one subunit alpha like, hif1alike, hif1al | NCBI:GeneID103027586 Ensembl:ENSAMXG00000008564 | ||
| Gene (Astyanax mexicanus surface fish) | Hypoxia-inducible factor one subunit alpha like 2, hif1alike2, hif1al2 | NCBI:GeneID103041845 Ensembl:ENSAMXG00000007272 | ||
| Gene (Astyanax mexicanus surface fish) | Hexokinase 1, hk1 | NCBI:GeneID103028521 Ensembl:ENSAMXG00000012670 | ||
| Gene (Astyanax mexicanus surface fish) | Glucose-6-phosphate dehydrogenase, g6pd | NCBI:GeneID103035433 Ensembl:ENSAMXG00000017509 | ||
| Gene (Astyanax mexicanus surface fish) | Lactate dehydrogenase A4, ldha | NCBI:GeneID103047177 Ensembl:ENSAMXG00000032467 | ||
| Gene (Astyanax mexicanus surface fish) | Pyruvate dehydrogenase kinase 1, pdk1 | NCBI:GeneID103033744 Ensembl:ENSAMXG00000039808 | ||
| Gene (Astyanax mexicanus surface fish) | Insulin-like growth factor binding protein 1 a, igfbp1a | NCBI:GeneID103033920 Ensembl:ENSAMXG00000009512 | ||
| Strain, strain background (Escherichia coli) | One Shot Top10 chemically competent cells, E. coli | Invitrogen | Cat# 404,003 | |
| Biological sample (Astyanax mexicanus surface fish) | Surface fish, SF, Texas | Jeffery lab | ||
| Biological sample (Astyanax mexicanus cave fish) | Cavefish, CF, Pachón, | Jeffery lab | ||
| Antibody | Anti-Digoxigenin-AP Fab fragments (sheep, polyclonal) | Roche | Cat# 11093274910 | 1:5,000 |
| Recombinant DNA reagent | pCRII-TOPO dual promotor vector | Invitrogen | Cat# 45–0640 | |
| Peptide, recombinant protein | Proteinase K | Roche | Cat# 03115887001 | |
| Peptide, recombinant protein | DNaseI I, RNase-free | Thermo-Scientific | Cat# EN0521 | |
| Commercial assay or kit | SYBR Premix Ex Taq (Tli RNaseH Plus) | Takara | Cat# RR420L | |
| Commercial assay or kit | T7 RNA polymerase | Roche | Cat#10881767001 | |
| Commercial assay or kit | SP6 RNA polymerase | Roche | Cat#10810274001 | |
| Commercial assay or kit | ReadyMix Taq PCR Reaction Mix | Sigma | Cat# P4600 | |
| Commercial assay or kit | Dig RNA labelling Mix | Roche | Cat#11277073910 | |
| Commercial assay or kit | Blocking reagent | Roche | Cat# 11096176001 | |
| Commercial assay or kit | BM Purple AP Substrate, precipitating | Roche | Cat# 11442074001 | |
| Commercial assay or kit | SuperScript III First strand synthesis supermix | Invitrogen | Cat#18080–400 | |
| Commercial assay or kit | SuperScript IV VILO mastermix with ezDNase | Invitrogen | Cat# 11766050 | |
| Chemical compound, drug | Paraformaldehyde | Electron Microscopy Sciences | Cat# 15,710 | |
| Chemical compound, drug | o-Dianisidine | Sigma | Cat# D9143 | |
| Chemical compound, drug | Phenylhydrazine hydrochloride | Sigma | Cat#114,715 | |
| Chemical compound, drug | Trizol | Life Technologies | Cat# 15596018 | |
| Software, algorithm | Image-J | https://imagej.nih.gov/ij/ | RRID:SCR_003070 | |
| Software, algorithm | JMP Pro 14 | SAS Institute Inc | ||
| Other | CytoOne 24 well plate | USA Scientific | Cat# CC76727424 | |
| Other | Cellstar 12 well cell culture plate | Greiner | Cat# 665,180 | |
| Other | Netwell inserts | Corning | Cat# 3,478 | |
| Other | Hypoxia chamber, ProOx Model P110 | BioSpherix |
Table 2
Primer sequences used for gene expression analysis with qPCR.
| rpl13a | GeneID:103025160 | ENSAMXG00000033532 | caagtactgctgggccacaaag | aggaaagccaggtacttcaatttgtt |
| gfi1aa | GeneID:103029320 | ENSAMXG00000006669 | agtgtgtgtgatcgaccttcaga | ggacattcttcattgtctggtgacg |
| hbbe2 | ENSAMXG00005017210* | taaatccctctgcagggctctgat | cctgatcacctccggattagccataata | |
| hbb2 | GeneID:111196758 | ENSAMXG00000031275 | gctcacggtgtagttgttctc | ggatccacgtgcagtttctc |
| gnb1b | GeneID:103023031 | ENSAMXG00000040710 | ctctgctaaactgtgggatgtg | ccgttagggaagaaacagatgg |
| hif1aa | GeneID:103022448 | ENSAMXG00000039550 | cagcaccaacacacacactcaa | gtcactgaccaccagtcctaca |
| hif1ab | GeneID:103033873 | ENSAMXG00000019342 | gcatgggccttacacagttt | gcaccagcatttccctcatt |
| hif1alike | GeneID:103027586 | ENSAMXG00000008564 | tgcctcacctgcttctaactct | agctgtattctcctctggcttga |
| hif1alike2 | GeneID:103041845 | ENSAMXG00000007272 | cattctaagttccagcccatcc | cattggctgcaccatctctc |
| hk1 | GeneID:103028521 | ENSAMXG00000012670 | ctcaatcggctgaaggacaacaa | agccgtcgagaatactgtggat |
| g6pd | GeneID:103035433 | ENSAMXG00000017509 | tcctactctgtggtggttgtt | gagacggtctgcttcagtatct |
| ldha | GeneID:103047177 | ENSAMXG00000032467 | tgtggtgtccaacccagttgata | agcgagctgagtccaagttagt |
| pdk1 | GeneID:103033744 | ENSAMXG00000039808 | tcctcaaccagcacactcttct | agtgacacgacagtgaggatcaa |
| igfbp1a | GeneID:103033920 | ENSAMXG00000009512 | cccaacagaagctggaagataag | ctgcccatccagagttgattc |
-
*
blasts to the cavefish genome but also cloned from surface fish in this study.
Additional files
Download links
A two-part list of links to download the article, or parts of the article, in various formats.
Downloads (link to download the article as PDF)
Open citations (links to open the citations from this article in various online reference manager services)
Cite this article (links to download the citations from this article in formats compatible with various reference manager tools)
Cavefish cope with environmental hypoxia by developing more erythrocytes and overexpression of hypoxia-inducible genes
eLife 11:e69109.
https://doi.org/10.7554/eLife.69109


