Interneuron-specific gamma synchronization indexes cue uncertainty and prediction errors in lateral prefrontal and anterior cingulate cortex
- Department of Psychology, Vanderbilt University, United States
- Donders Institute for Brain, Cognition and Behaviour, Radboud University Nijmegen, Netherlands
- Department of Biology, Centre for Vision Research, York University, Canada
Figures
Figure 1 with 2 supplements
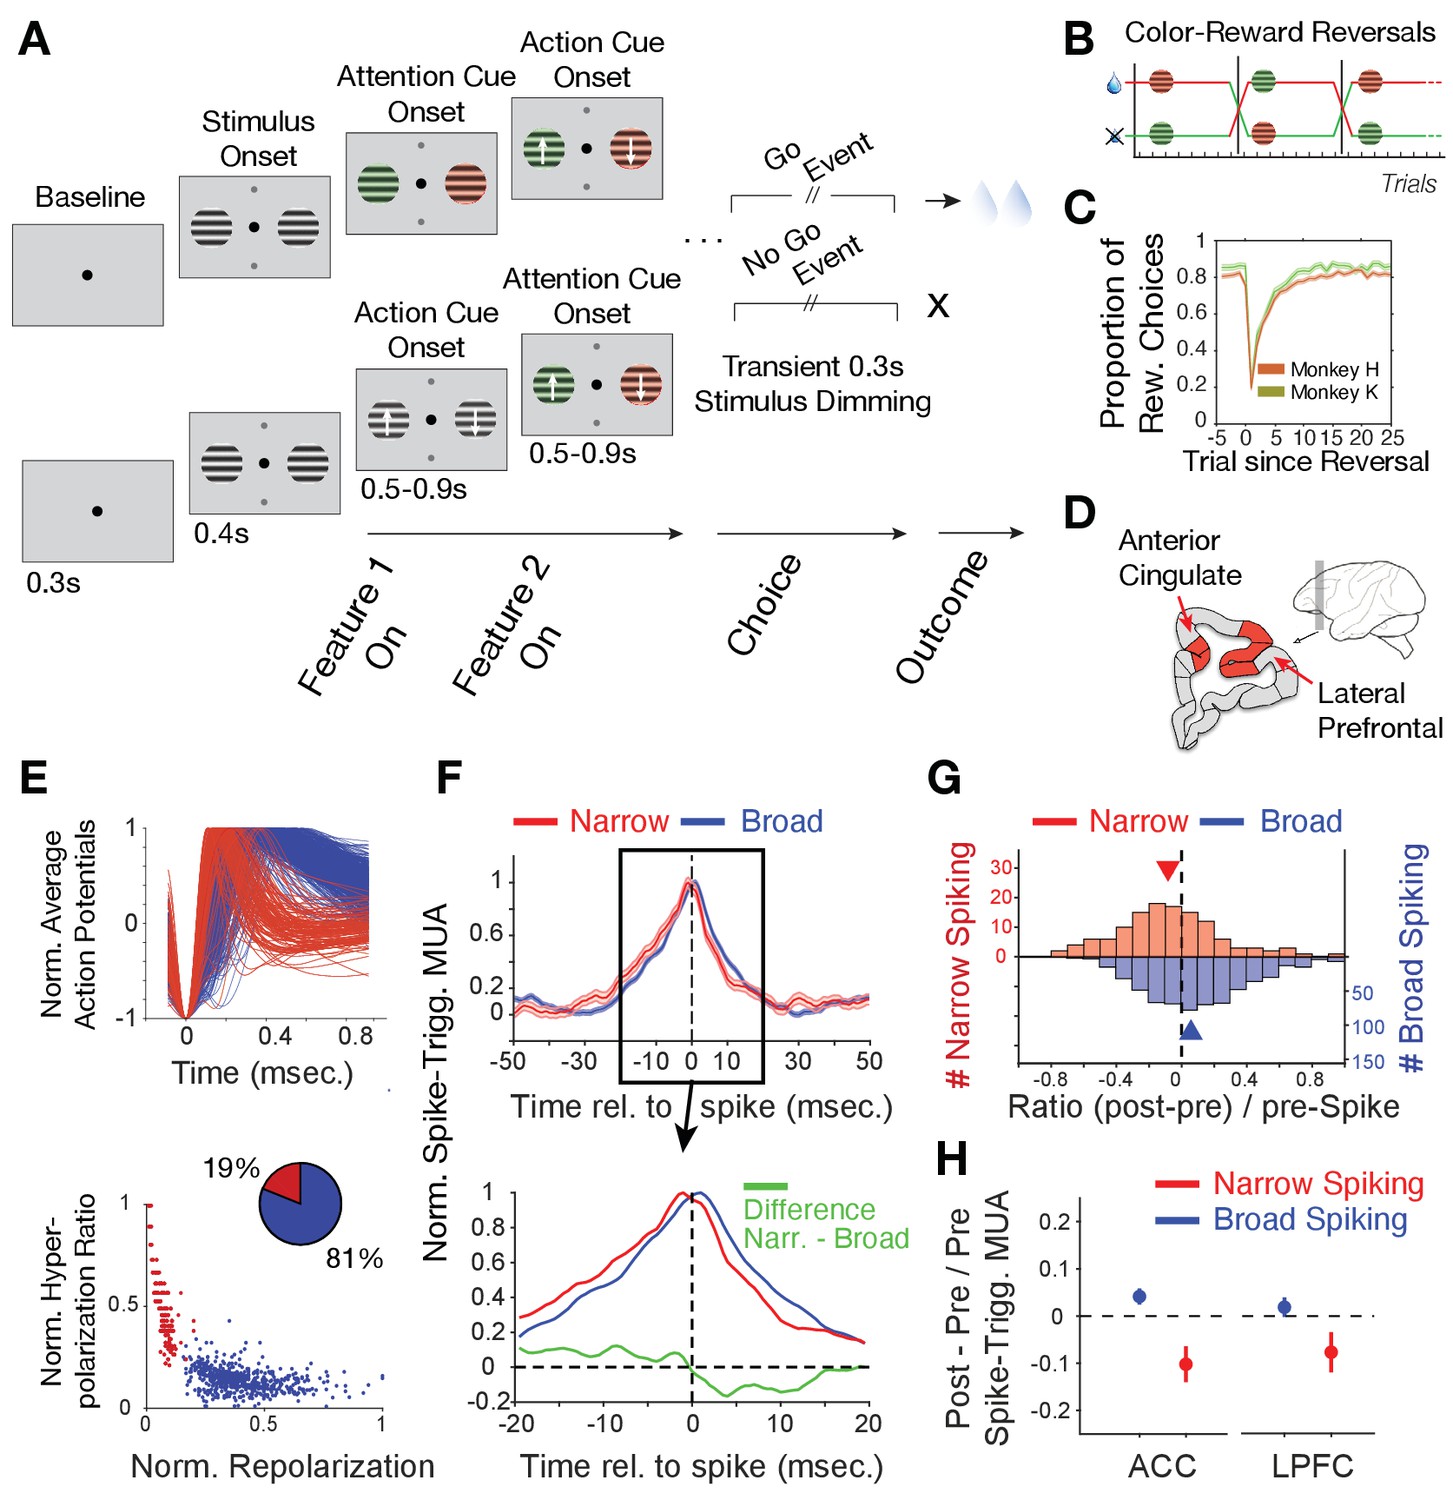
Task paradigm and cell classification.
(A) Trials required animals to covertly attend one of two peripheral stimuli until a dimming (Go-event) instructed to make a saccade in the direction of the motion of the attended stimulus. During the trial, the two stimuli were initially static black/white and then either were colored first or started motion first. Following this feature 1 Onset the other feature (Feature two on) was added 0.5–0.9 s later. (B) The task reversed the color (red or green) that was rewarded over at least 30 trials. (C) Two monkeys learned through trial-and-error the reward-associated color as evident in increased accuracy choosing the rewarded stimulus (y-axis) over trials since reversal (x-axis). (D) Recorded areas (details in Figure 1—figure supplement 1). (E) Top: Average normalized action potential waveforms of recorded neurons were narrow (red) or broad (blue). Bottom: Inferred hyperpolarization ratio and repolarization duration distinguishes neurons. (F) Average spike-triggered multiunit modulation for narrow and broad spiking neurons (Errors are SE’s). Spiking neuron and MUA were from different electrodes. The bottom panel zooms into the ±20 ms around the spike time and shows the difference between neuron classes (in green). (G) The histogram of post-to-pre spike AUC ratios for narrow (red) and broad (blue) spiking neurons. (H) Average ratio of post- to pre-spike triggered MUA for narrow and broad cell classes in ACC (left) and in LPFC (right). Values < 0 indicate reduced post- versus pre-spike MUA modulation. Error bars are SE.
Figure 1—figure supplement 1
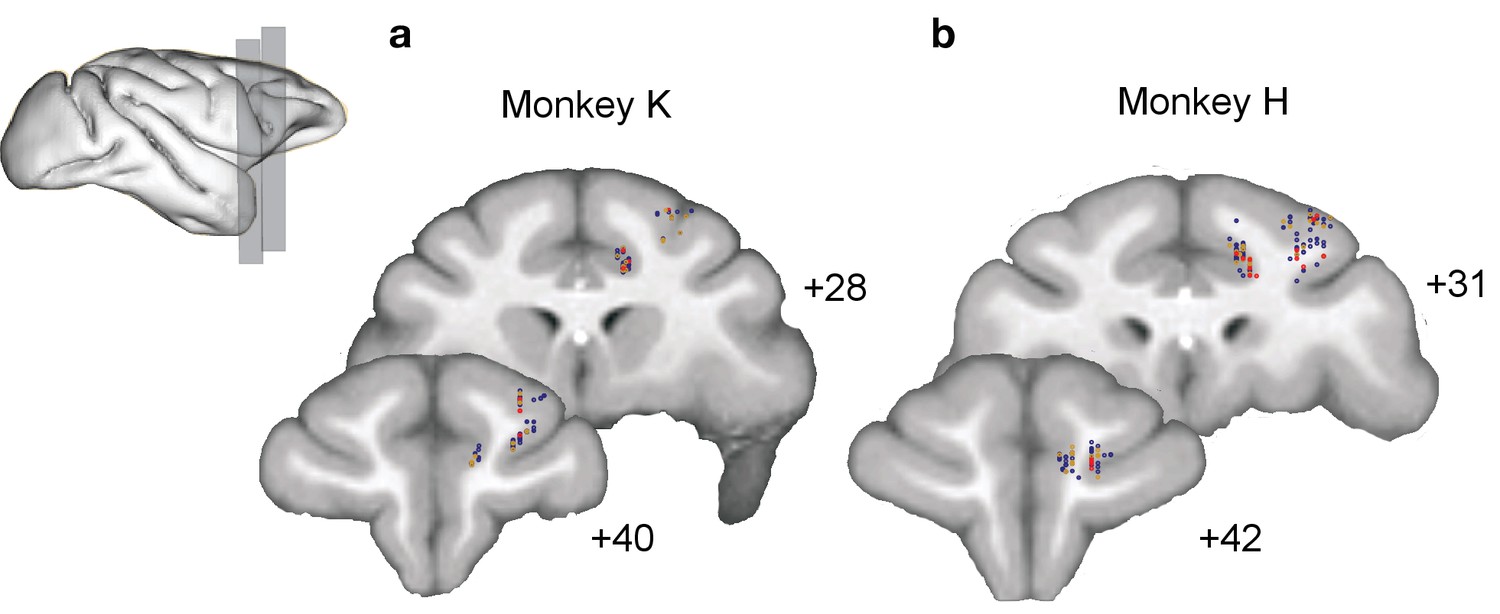
Anatomical locations of recording sites.
(a,b) Reconstructed locations of the broad (blue) and narrow (red) spiking neurons in the anterior cingulate cortex and lateral prefrontal cortex of monkey K (a) and monkey H (b).
Figure 1—figure supplement 2
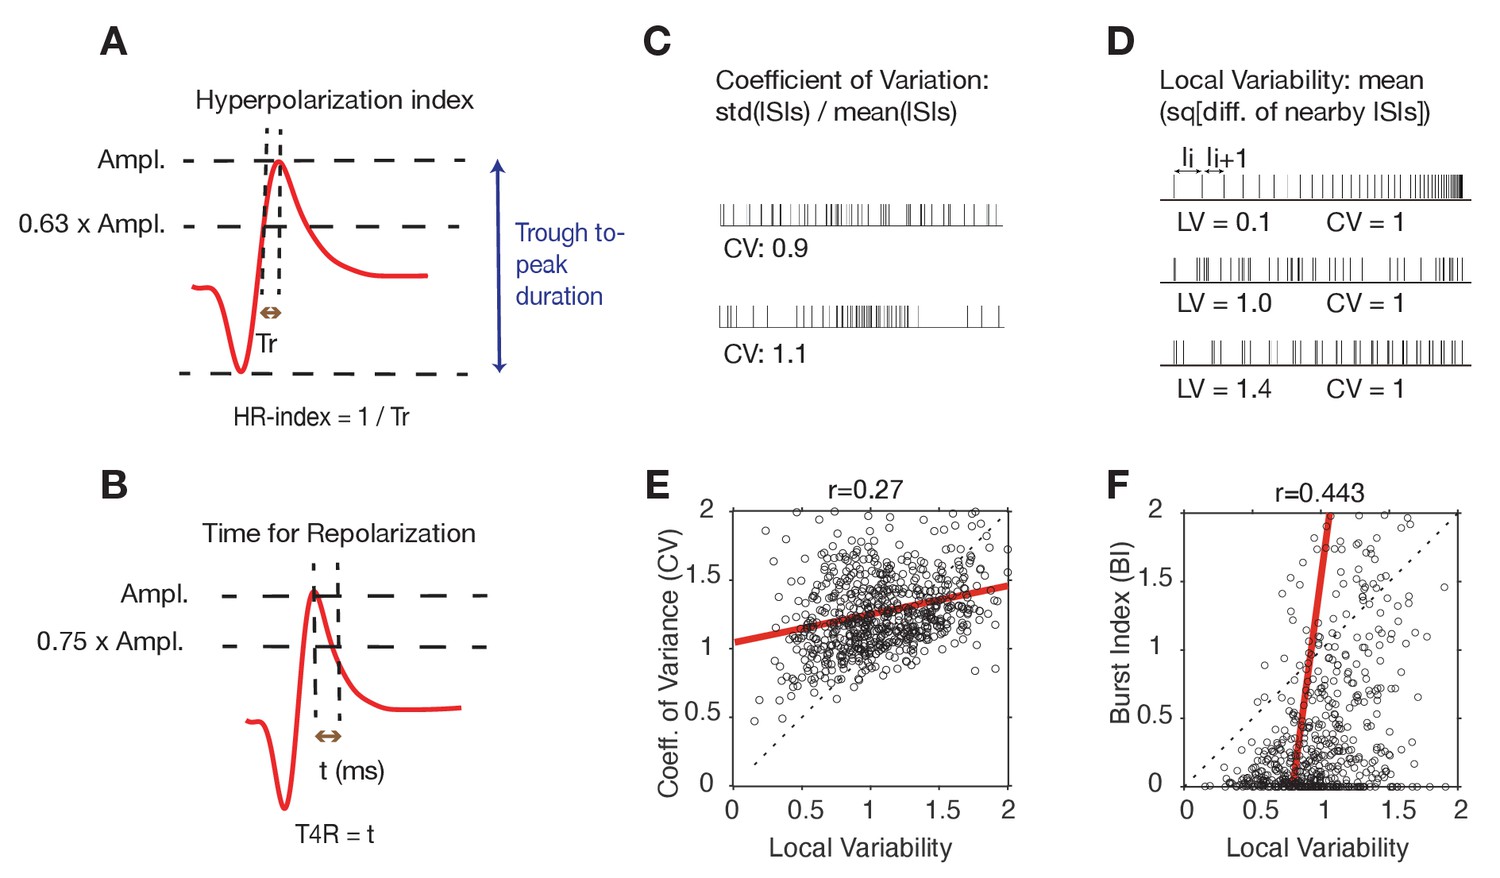
Action potential waveform parameters and spike variability measures used for clustering cells.
(A) The Hyperpolarization Rate Index (HR-Index) is defined as the inverse of the required time for an action potential between 63% of the peak to reach the peak. (B) The Time for Repolarization (T4R) quantifies the duration between spike peak to 75% of the peak in the after-hyperpolarization domain. (C) The Coefficient of Variation (CV) indexes the global variability of firing by normalizing the standard deviation across all ISI’s by the mean ISI. (D) The Local Variability (LV) measures the variability of adjacent interspike intervals (ISI’s). LV is proportional to the squared difference of ISI’s divided by their sum. LV’s around one indicate that spikes are generated by a near Poisson process, while LV’s < 1 reflect similar (regular) ISI’s from neurons with a peak in their autospectra. Spike trains with LV’s > 1 reflect bursty spiking with periods of short ISIs alternating with periods of silence or long ISI’s. (E) Regression plot of the LV and the CV. (F) Regression plot of the LV and the burst-index (BI, see Materials and methods).
Figure 2 with 4 supplements
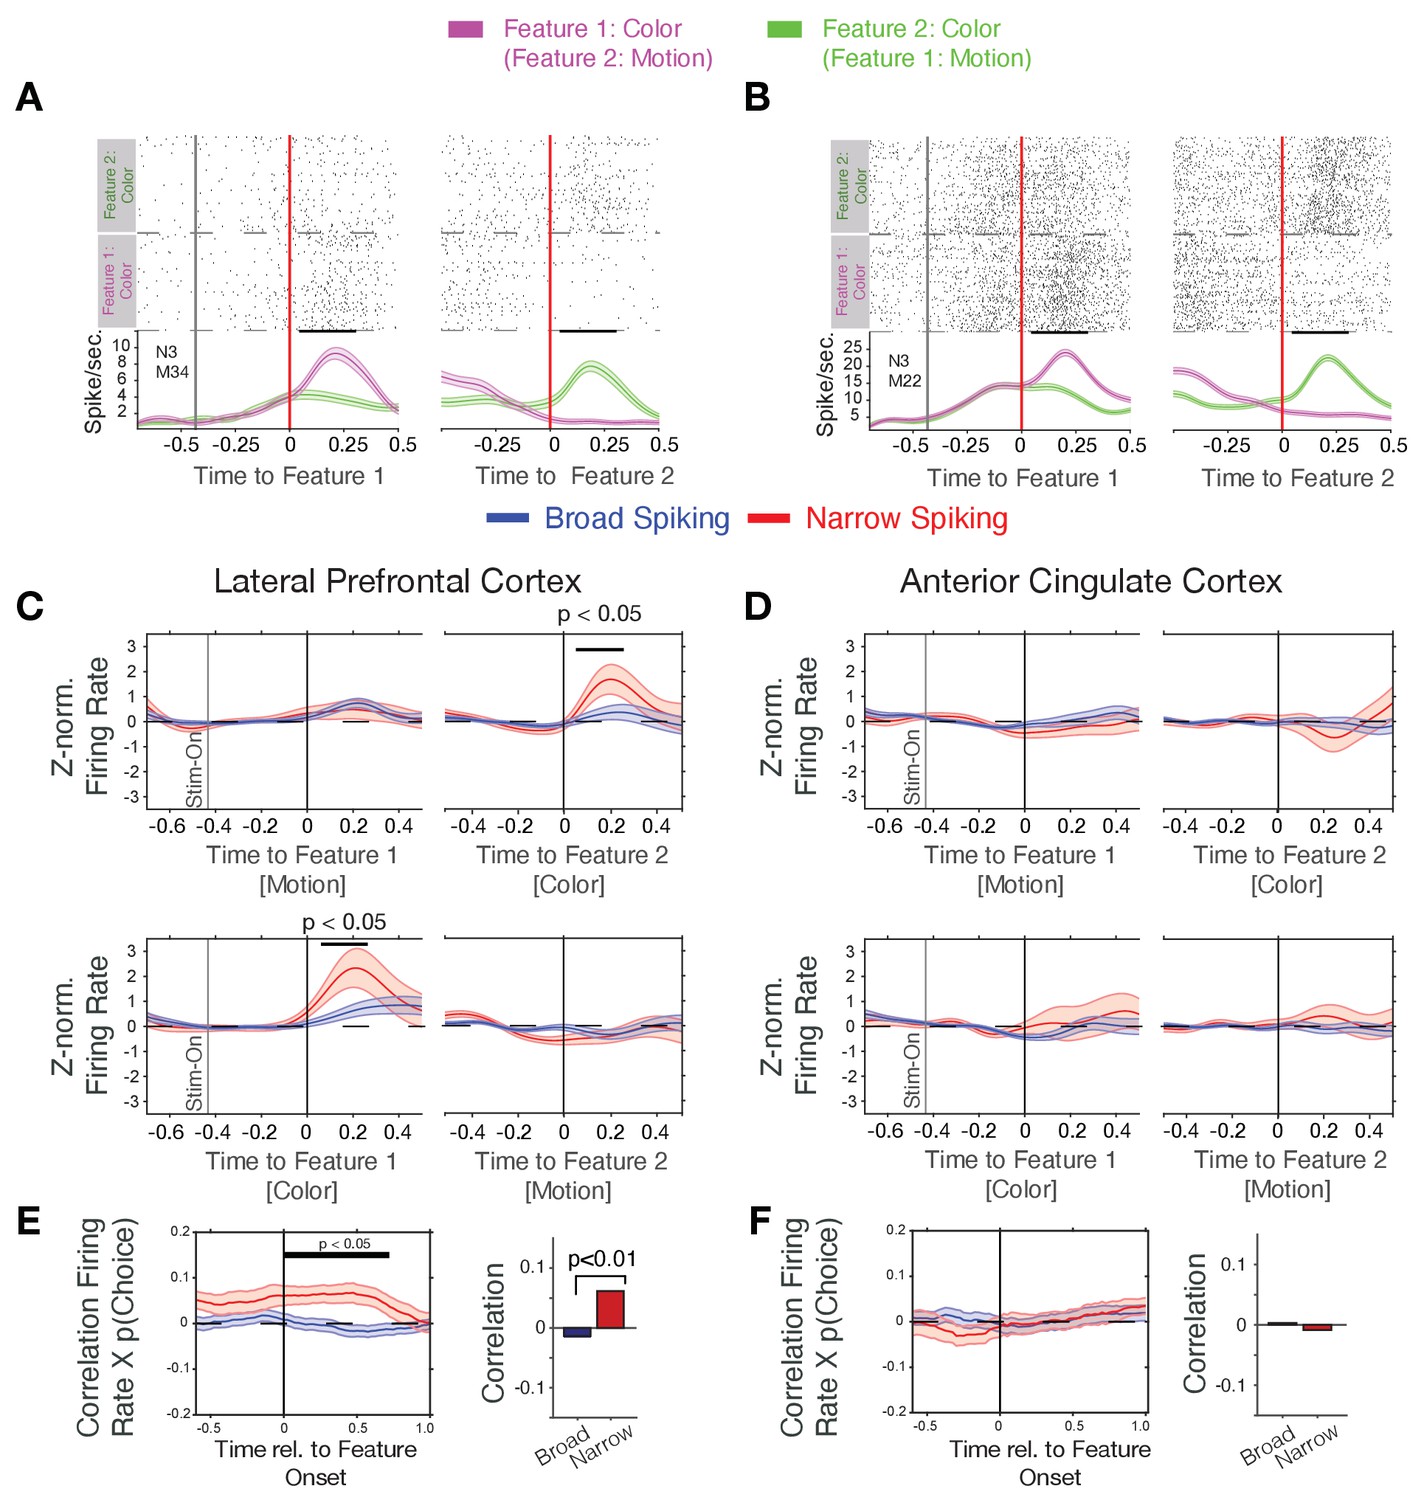
Firing rate modulation of narrow and broad spiking neurons to the color cue correlate with choice probability.
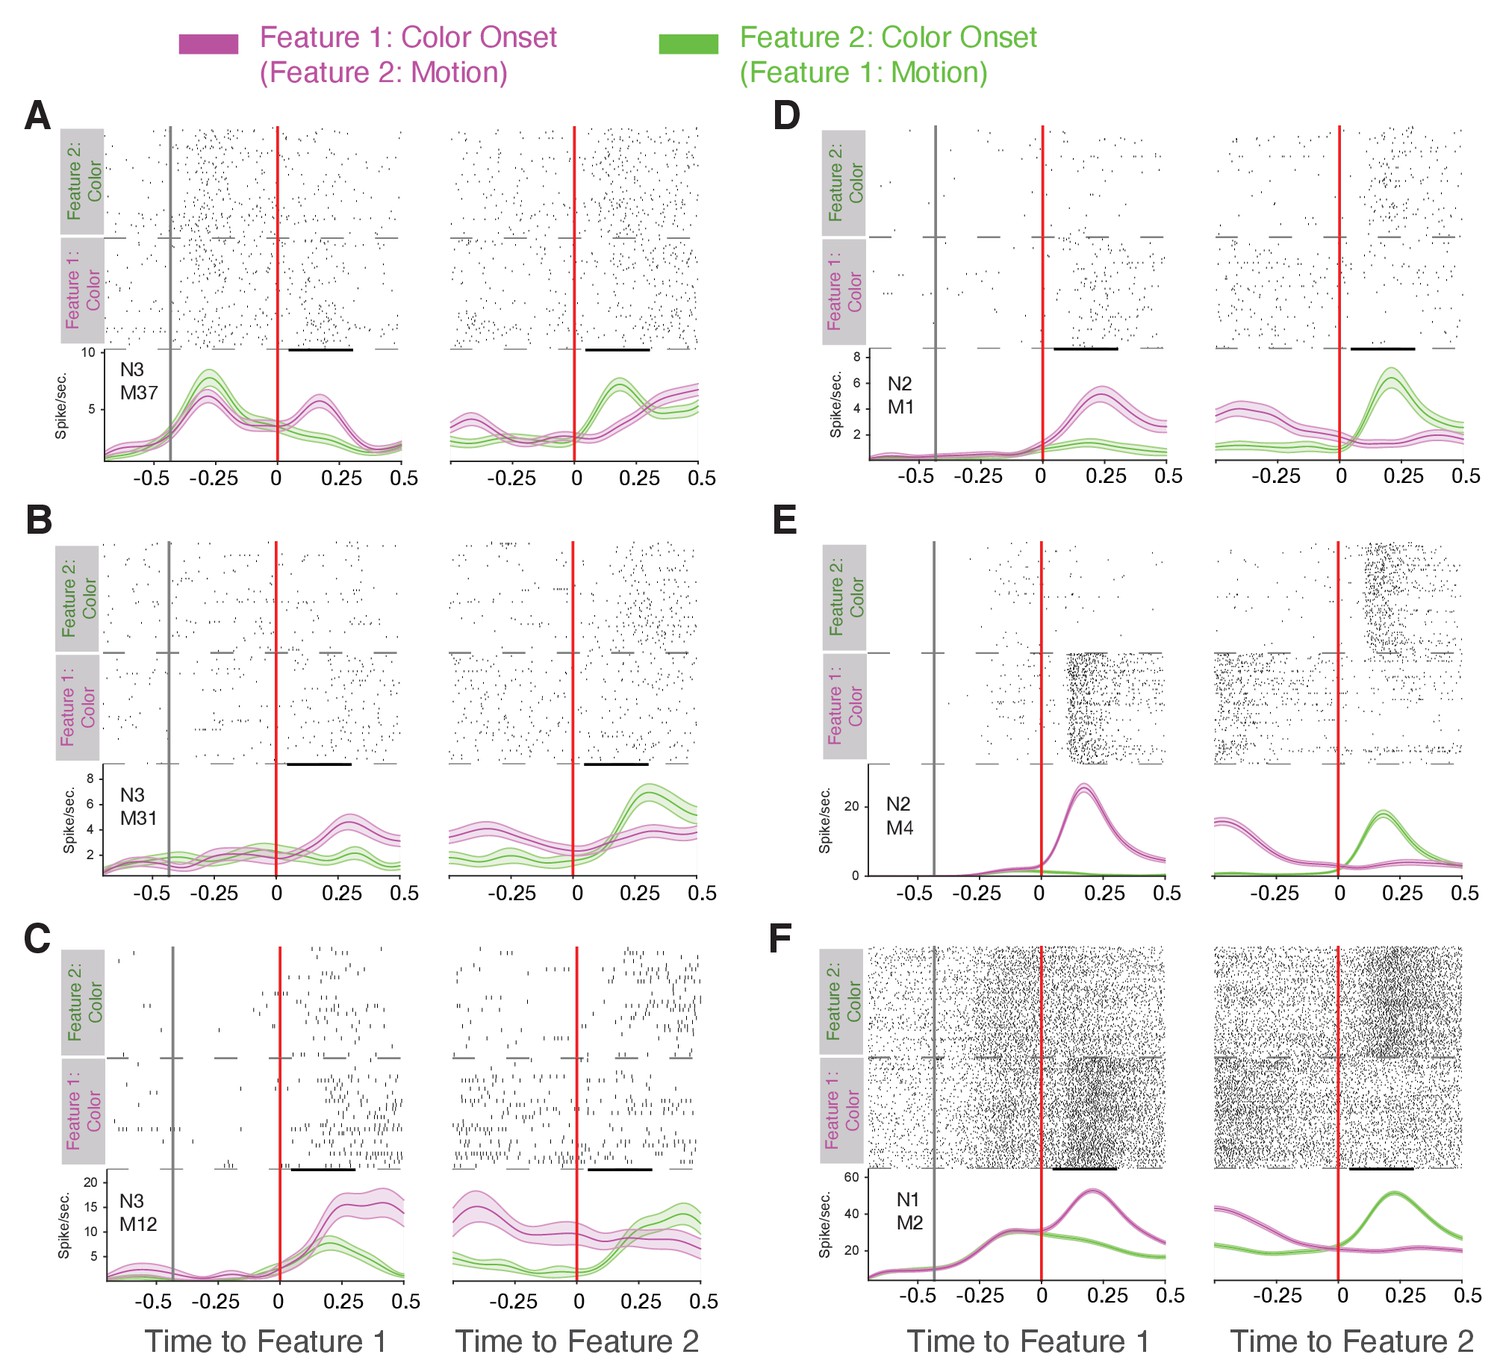
(A, B) Spike rasters for example neurons around the onset of feature-1 and feature-2 when feature-1 was color (magenta) or motion (green). Both neurons responded stronger to the color than the motion onset irrespective of whether it was shown as first or as second feature during a trial. (C) Narrow spiking neurons (red) in LPFC respond to the color onset when it occurred as feature-2 (upper panel), or as feature-1 (bottom panel). (D) Same as c for the ACC shows no or weak feature onset responses. (E) Firing rates of narrow spiking neurons (red) in LPFC correlate with the choice probability of the to be chosen stimulus (left). The average Rate x Choice Probability correlation in LPFC was significantly larger in narrow than in broad spiking neurons (right). (F) Same as e for ACC shows no significant correlations with choice probability. Source data 1 Correlation data and script for ploting panels E, and F.
Figure 2—figure supplement 1
Narrow spiking neuron examples responding to the color but not motion cue.
(A) Spike rasters and spike densities for an example neuron (N3 e-type, see inset) around the onset of feature-1 and feature-2 when feature-1 was color (magenta) or motion (green). Note that 400 ms prior to the feature 1 onset the black/and white stimuli were presented on the screen (first vertical black line). The neuron responded stronger to the color than the motion onset irrespective of whether it was shown as first or as second feature during a trial. (B-F) Examples of other narrow spiking neurons showing the same color-specific cue onset responses. Insets denote the specific e-type the neuron belongs to.
Figure 2—figure supplement 2
Proportion of neurons encoding the rewarded color and location.
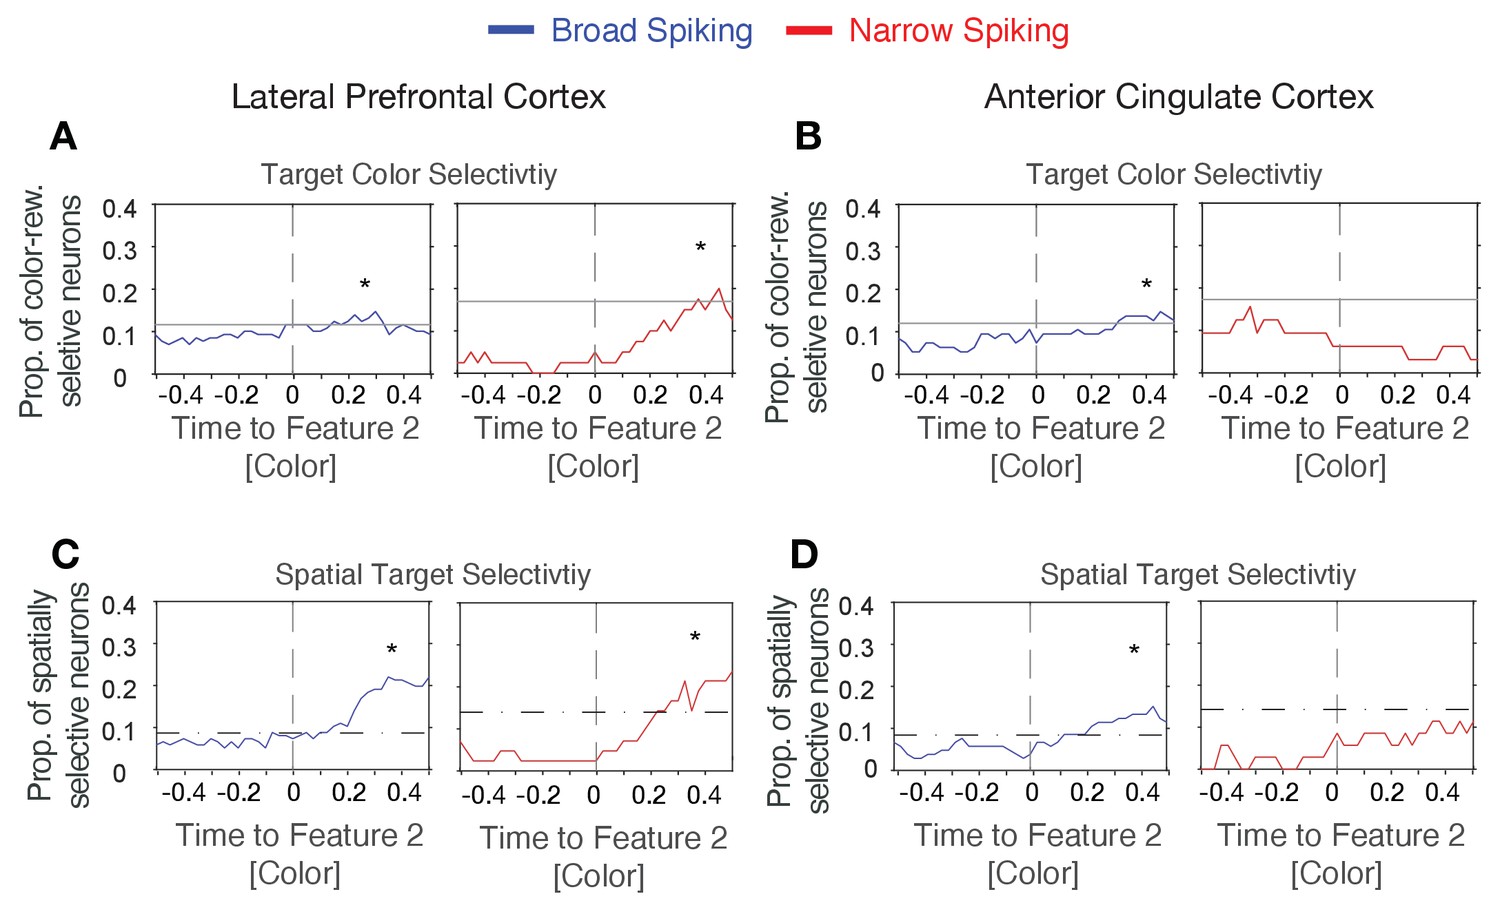
(A) Proportion of neurons with significant encoding of rewarded color (responding significantly stronger for one over the other color when they are reward associated) around the time of the color onset (x-axis) for broad (left) and narrow (right) spiking neurons in LPFC. Stars highlight time period with significantly increased selectively compared to pre-feature onset levels. Horizontal bars denote the upper confidence level of pre-feature onset selectivity. (B) Same format as A for ACC neurons. (C,D) Same format as (A,B) showing the proportion of neurons firing significantly different when the rewarded stimulus is on the left versus right side from the central fixation point for broad (left) and narrow (right) spiking neurons in LPFC (C) and ACC (D).
Figure 2—figure supplement 3
Distribution of choice probabilities (p(Choice)) and reward prediction errors (RPEs) estimated by the reinforcement learning model (see Materials and methods).
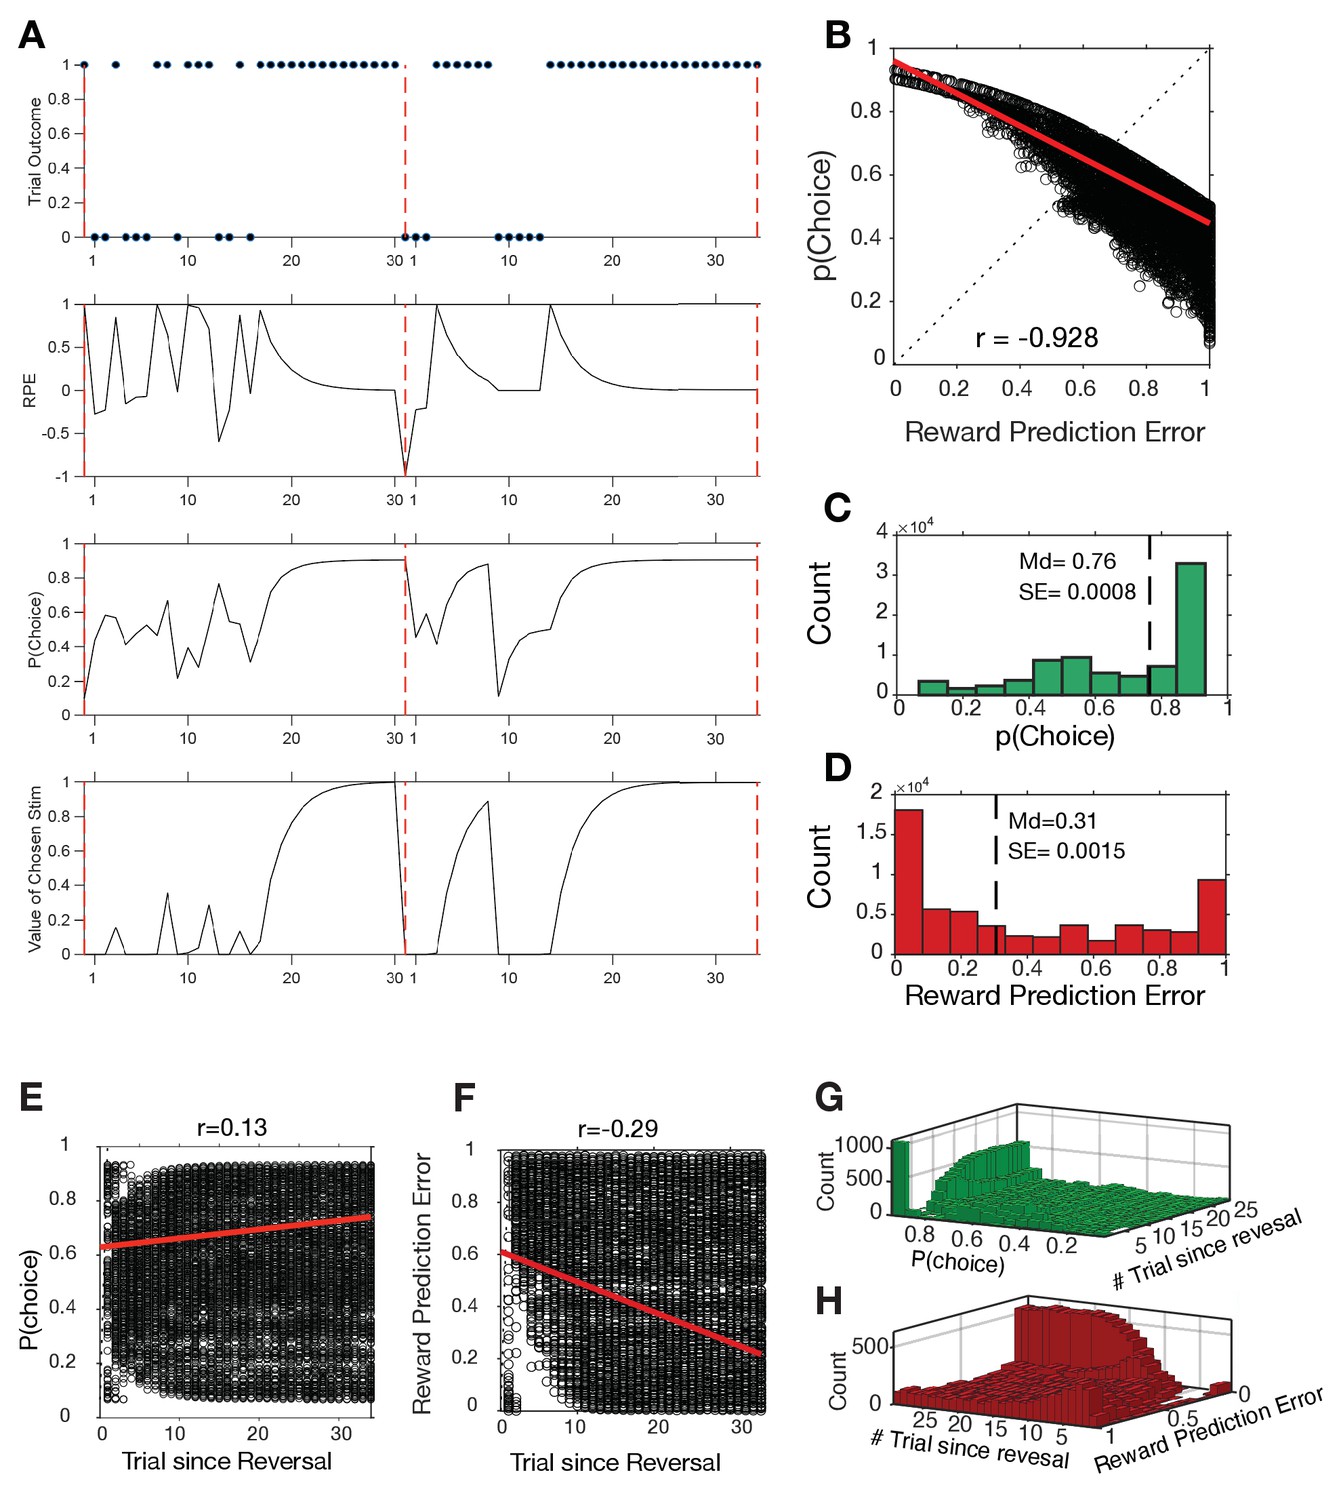
(A) Two example learning blocks showing the trial outcomes (correct = 1, error = 0) in the top row, and the RPE, p(Choice) and the values of chosen stimuli in different rows. (B) Correlation of p(Choice) and (RPE). (C,D) Distribution of choice probabilities (C) and reward prediction errors (D). Median and SE are shown as vertical dashed lines. The negative correlation signifies that when reward outcomes are unexpected (high RPEs) than choices tend to be uncertain as reflected in low (near ~0.5) choice probabilities. (E) Correlation of choice probabilities with trial since reversal. (F) Correlation of reward prediction errors with trial since reversal. (G, H) 2D histogram corresponding to E and F, respectively, showing the distribution of trials P(choice) (G) and RPE (H) and trial since reversal.
Figure 2—figure supplement 4
Cell-type-specific responses and correlations with p(choice) and reward prediction errors for each monkey separately.
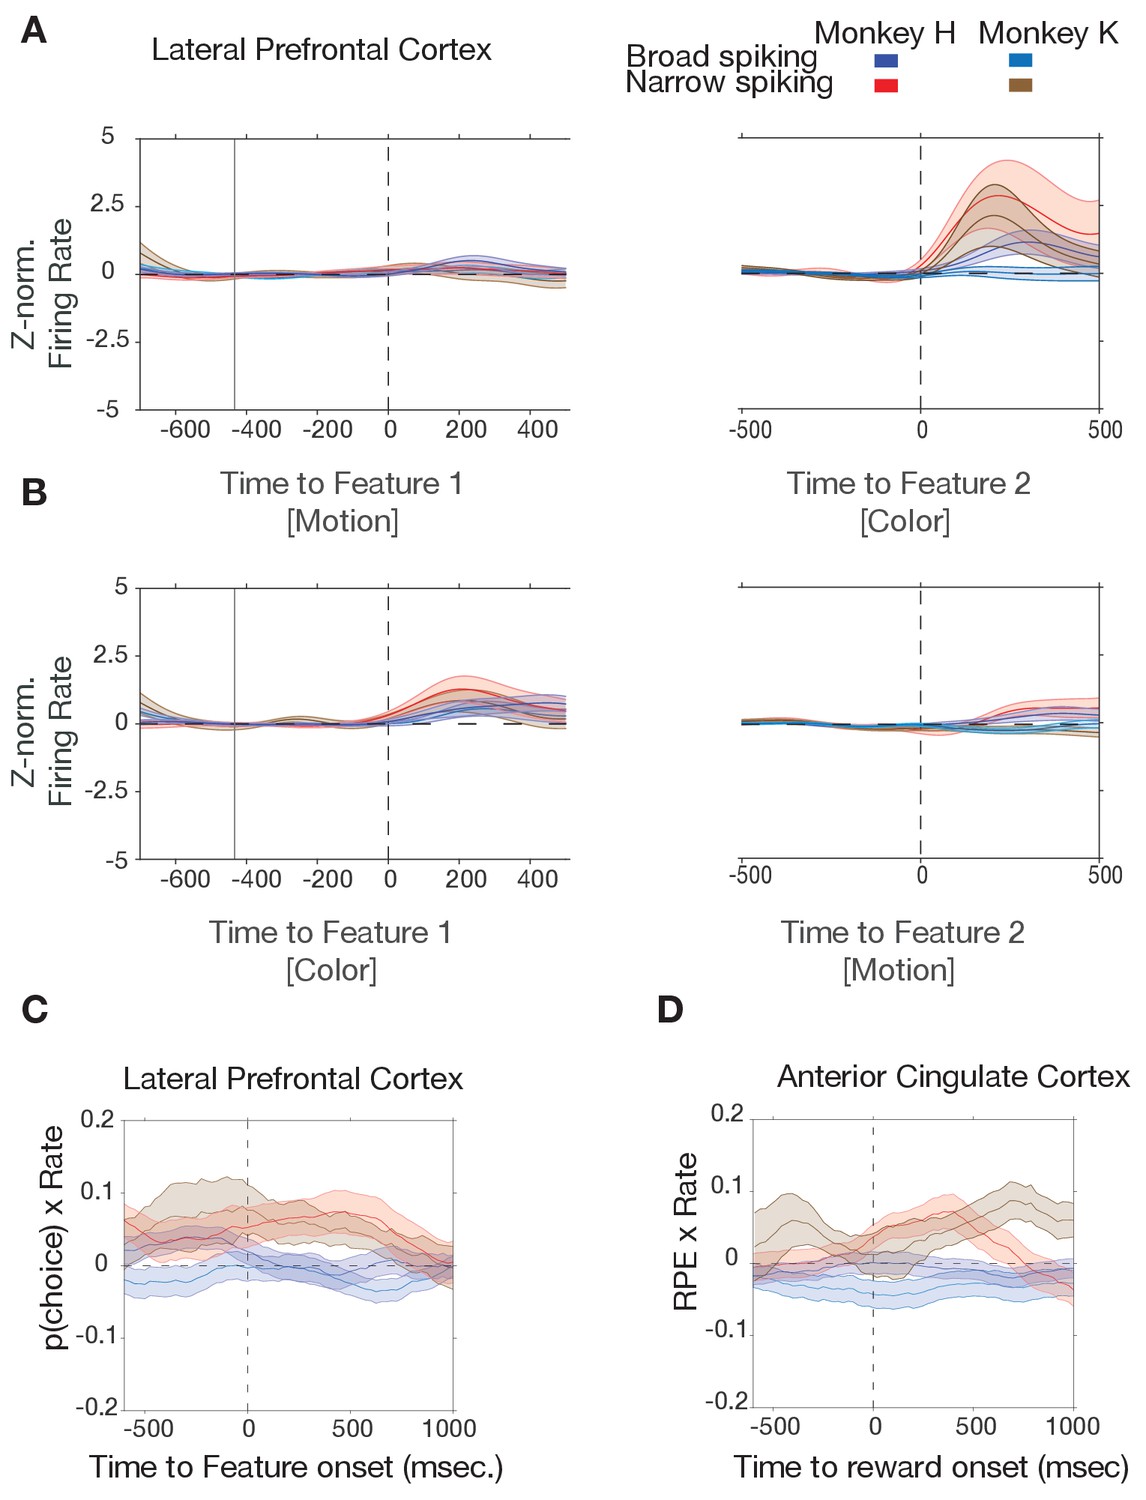
(A, B) In both monkeys, narrow spiking neurons in LPFC activate to the color cue onset when the color cue is the second feature after motion was switched on (A), or when the color cue was the first feature before motion was switched on (B). (C) In LPFC of both monkeys, firing rate of narrow spiking neurons correlates positively with p(choice) during color cue period. (D) In ACC of both monkeys, firing rate of narrow spiking neurons correlates positively with reward prediction error after the reward onset.
Figure 3
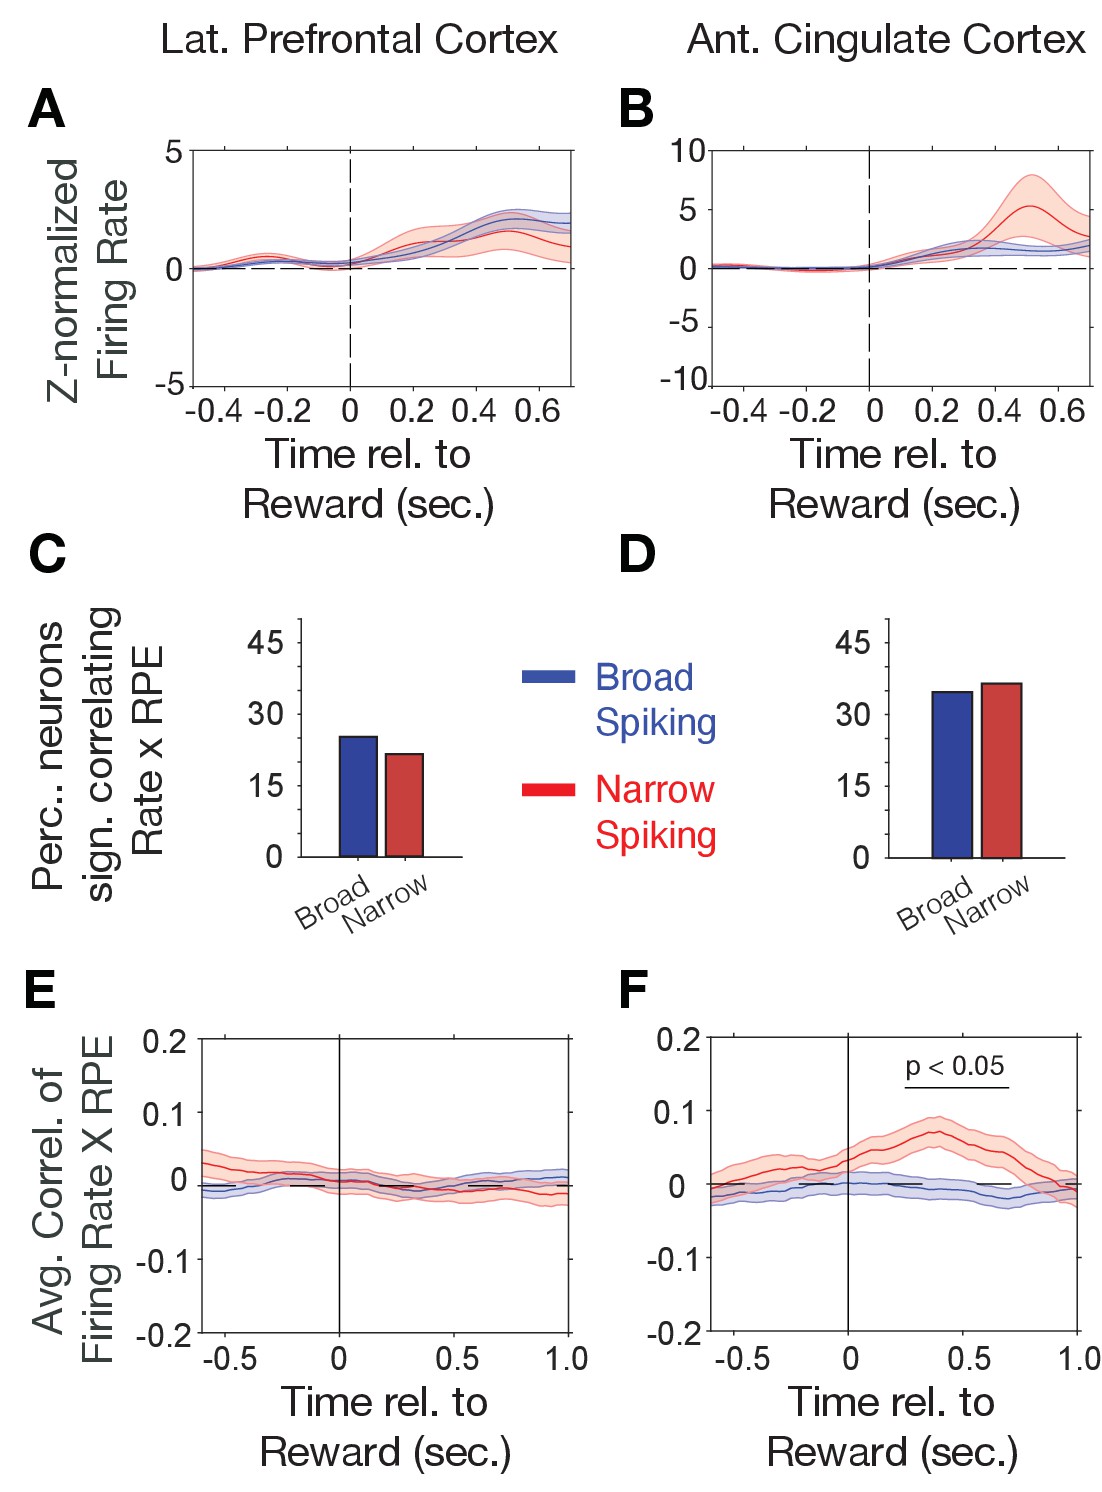
Firing rate modulation to trial outcomes correlate with reward prediction errors.
(A, B) Narrow (red) and broad spiking neurons (blue) in LPFC (A) and ACC (B) on average activate to the reward outcome. (C, D) Proportion of narrow and broad spiking neurons in LPFC (C) and ACC (D) with significant firing rate X reward prediction error correlations in the [0 0.75] s after trial outcomes were received. (E, F) Time course of firing rate X reward prediction error correlations for narrow and broad spiking neurons in LPFC (E) and ACC (F) around the time of reward onset. Horizontal bar denotes time with significant correlations. Source data 1 Correlation data and script for ploting panels E, and F.
Figure 4 with 2 supplements
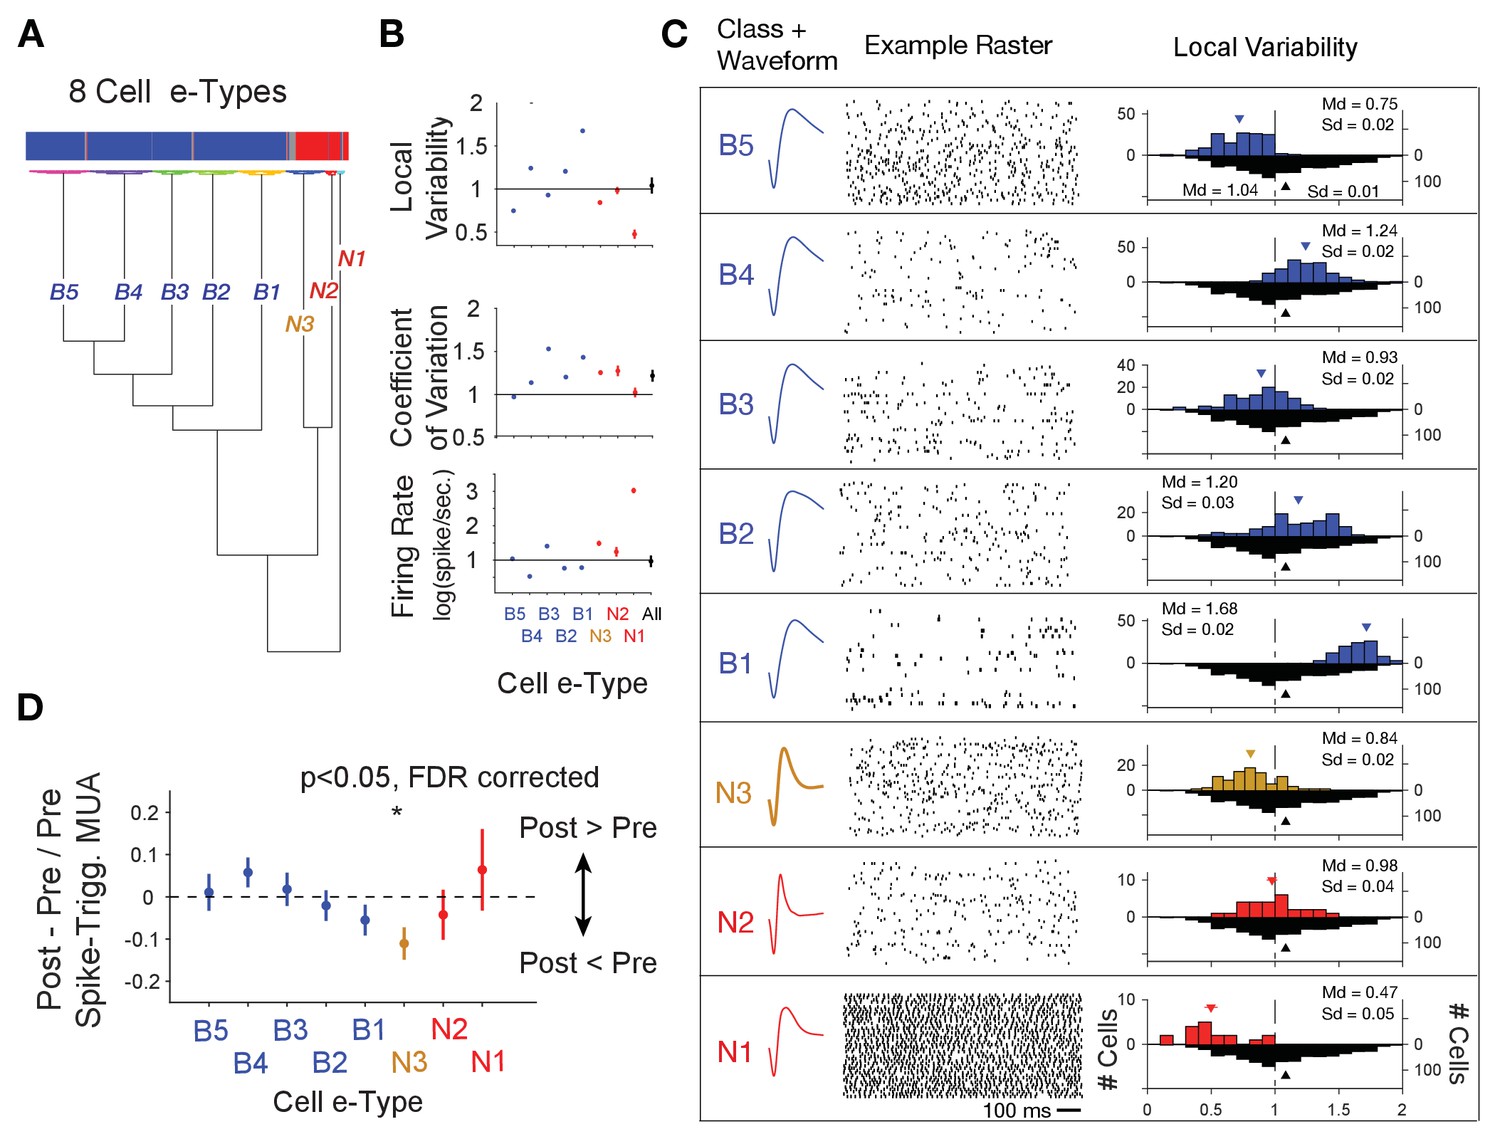
Clustering of e-type sub-classes of cells using their spike width, firing variability and rate.
(A) Dendrogram of cluster distances for neuron classes with broad spikes (five subclasses, blue), and narrower spikes (three subclasses, orange and red). (B) For each e-type (x-axis) the average LV, CV and firing rate. The rightmost point shows the average for all e-types combined. (C) Illustration of the average spike waveform, spiketrain raster example, and Local Variability (LV, upper histograms) for each clustered e-type. The bottom grey LV histogram includes all recorded cells to allow comparison of e-type specific distribution. (D) The average post- to pre- spike MUA modulation (y-axis) for neurons of the different e-types. Values below 0 reflect reduced multiunit firing after the neuron fires a spike compared to before the spike, indicating a relative suppressive relationship. Only the N3 etype showed a systematically reduced post-spike MUA modulation. MUA were always recorded from other electrodes nearby the spiking neuron. Source data 2 Data and script used for clustering (panel A) and data used for plotting panels B, and C.
Figure 4—figure supplement 1
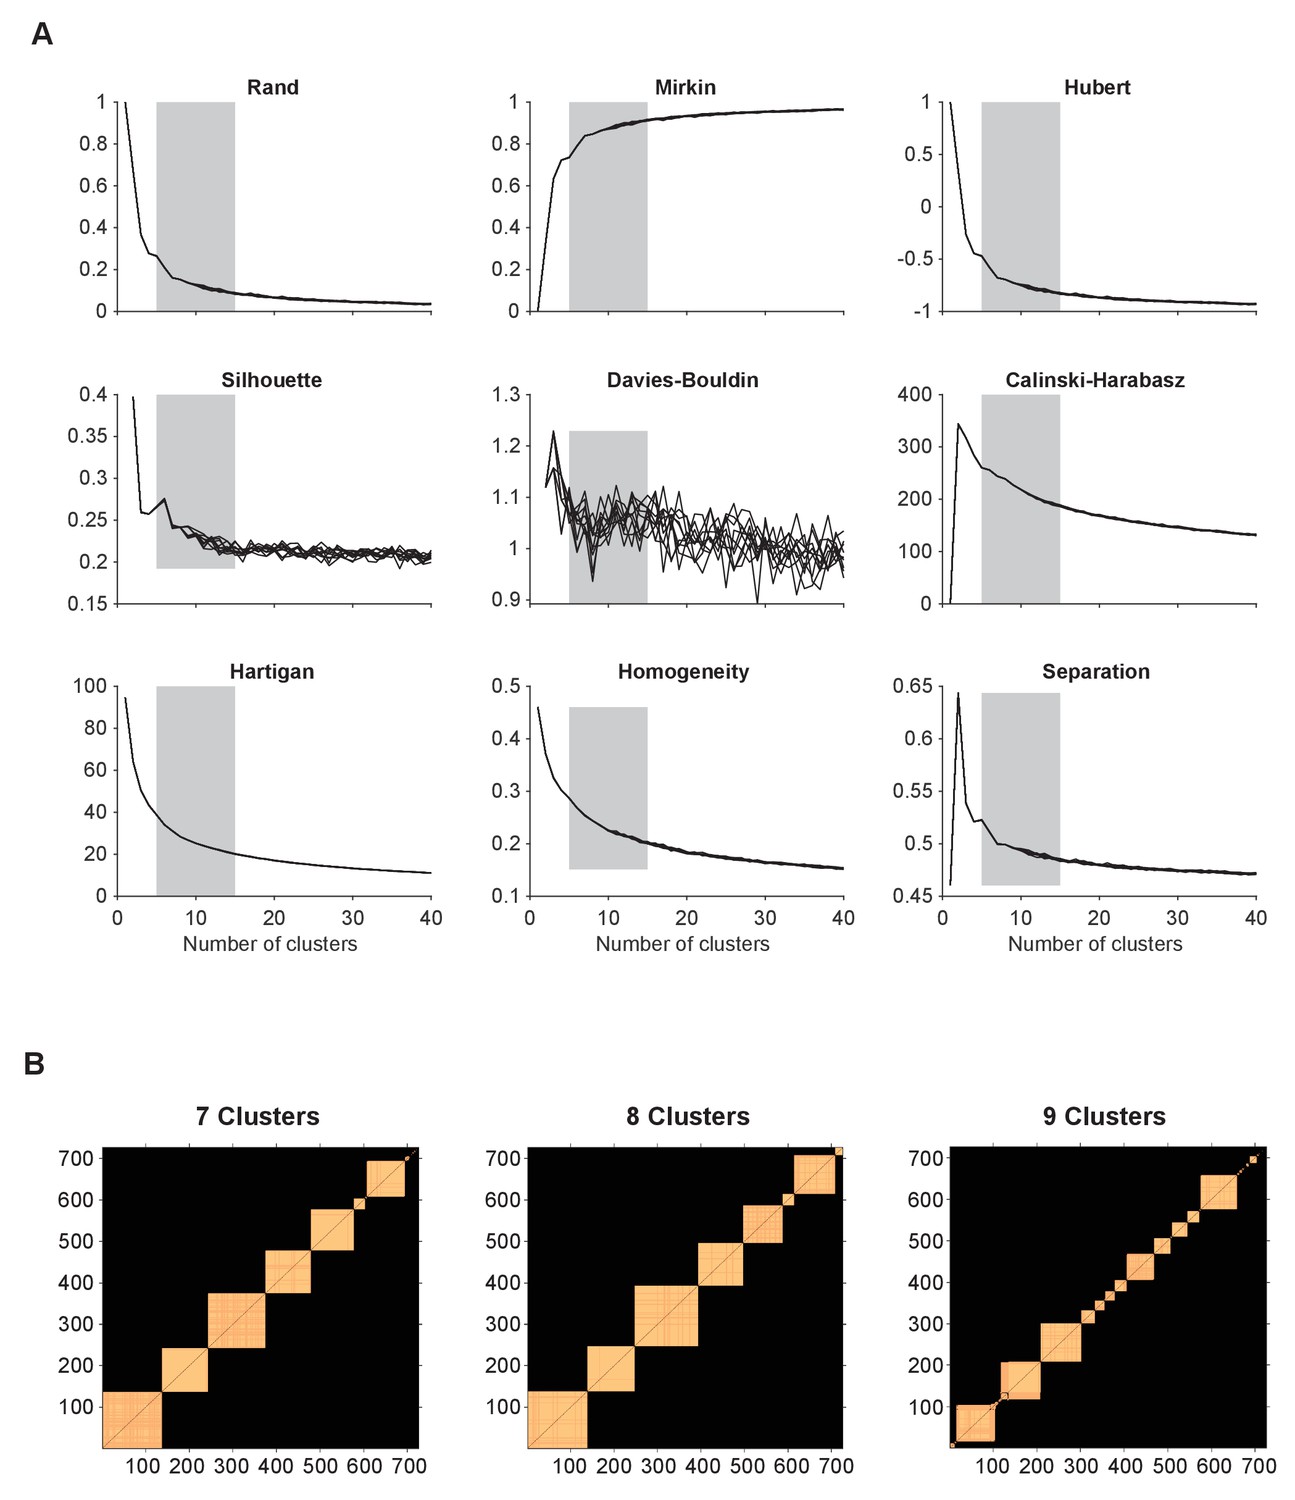
Determining number of clusters.
(A) A set of statistical indices to determine a range of number of clusters that best explains the data. These indices evaluate the quality of the k-means clustering: Rand, Mirkin, Hubert, Silhouette, Davies-Bouldin, Calinski-Harabasz, Hartigan, Homogeneity, and Separation indexes. (B) Block diagonal matrices of elements in each clustering with number of clusters k = 7-9, that were paired together more than 90% over 500 realizations. Source data 2 Data and script used for estimating number clusters, panels A and B.
Figure 4—figure supplement 2
Clustering of neurons.
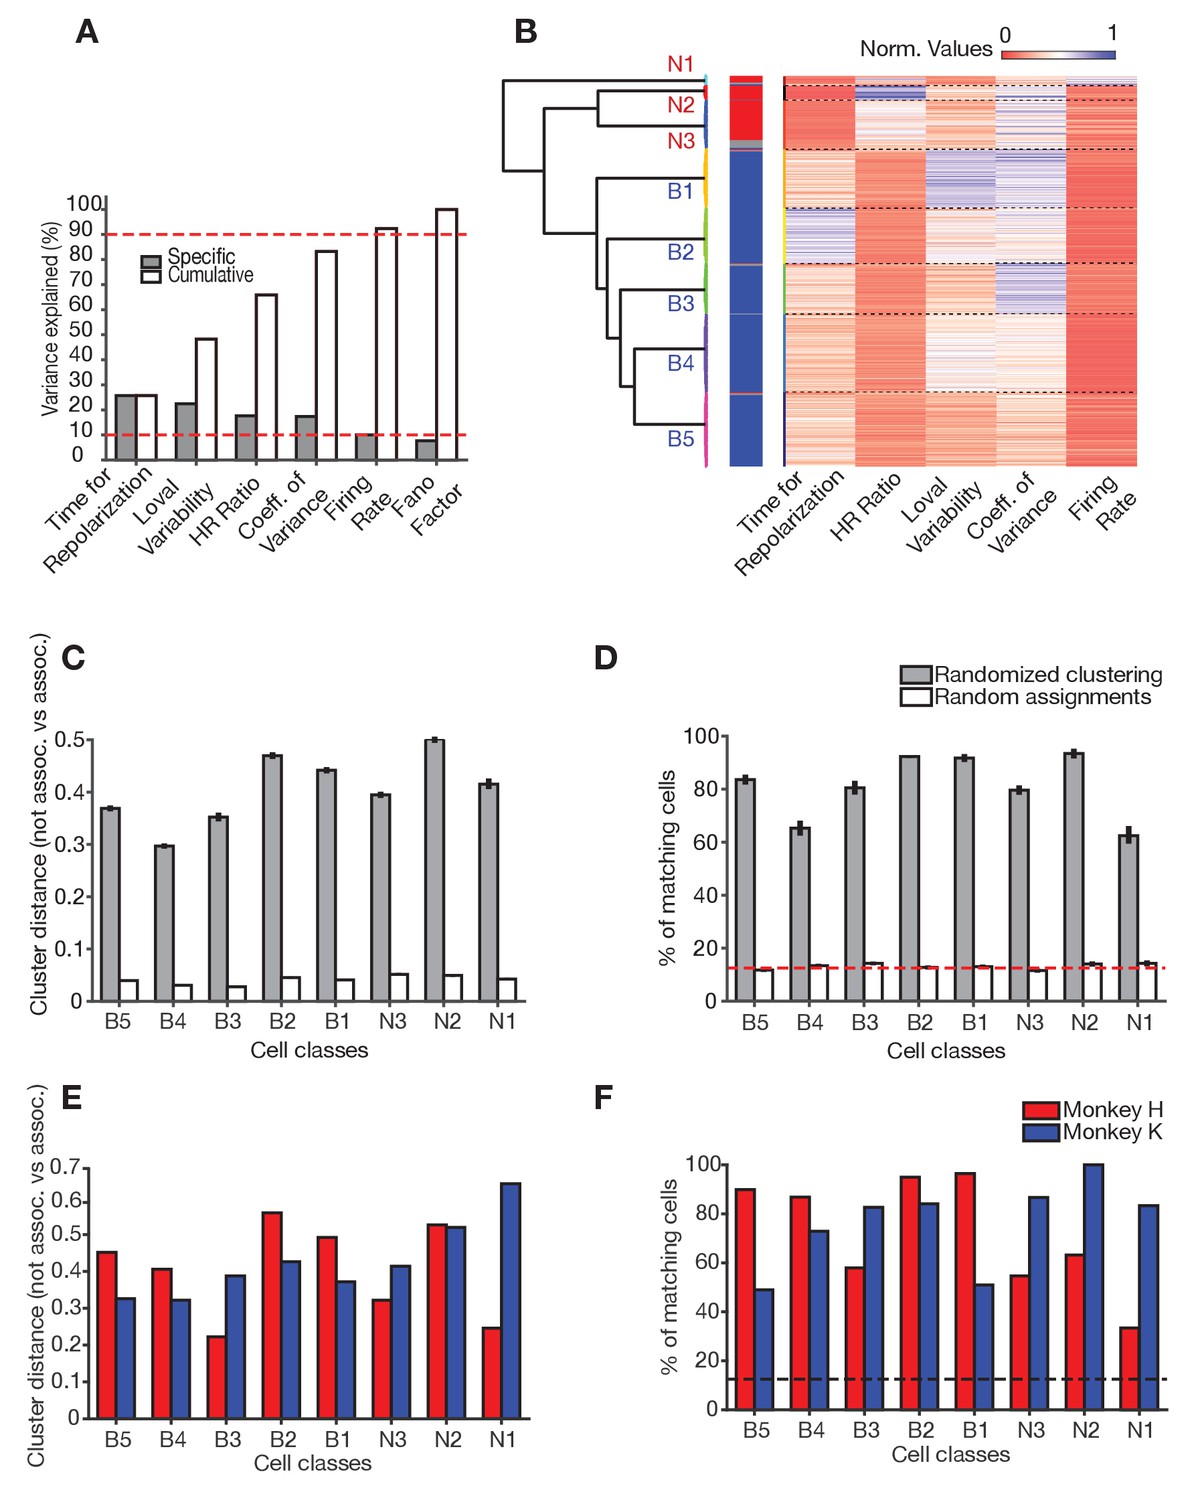
(A) Amount of variance explained by individual cell features. Cell features are rank-orderd according to their specific contribution to explain variance in the dataset. Cell features were considered for the clustering when they contributed to reach 90% of cumulative total variance explained (red dashed line). (B) Normalized values (heat map) for each cell feature (x-axis) across all cells (y-axis). Horizontal dashed lines denote cell class borders. The dendrogram to the left shows the square Euclidean distances between clusters’ centroids. (C) Validation of clustering using the cluster distance. In each of n = 200 realizations, each cluster was associated to the closest cell class. The difference between the mean of the intradistances (i.e. all clusters that were associated to the same cell class) with respect to the extradistances (i.e. all clusters that were not associated to that cell class) is plotted (gray bars). The white bars show the results from random assignation. (D) Validation of cluster assignments. In each realization of the randomization procedure, the proportion of cells consistently associated to a class relative to the total number of cells in the class. Gray bars refer to dataset randomization (mean and SE) and white bars to random assignment (mean and SE). The red dashed line represents the proportion of cells as if cells would evenly distribute among the seven reliable cell classes. (E, F) validation of clustering across monkeys. (E) Validation according to the distances of clusters for each monkey (analogous to C). (F) Validation according to the percent number of cells matches for each monkey (analogous to D).
Figure 5 with 3 supplements
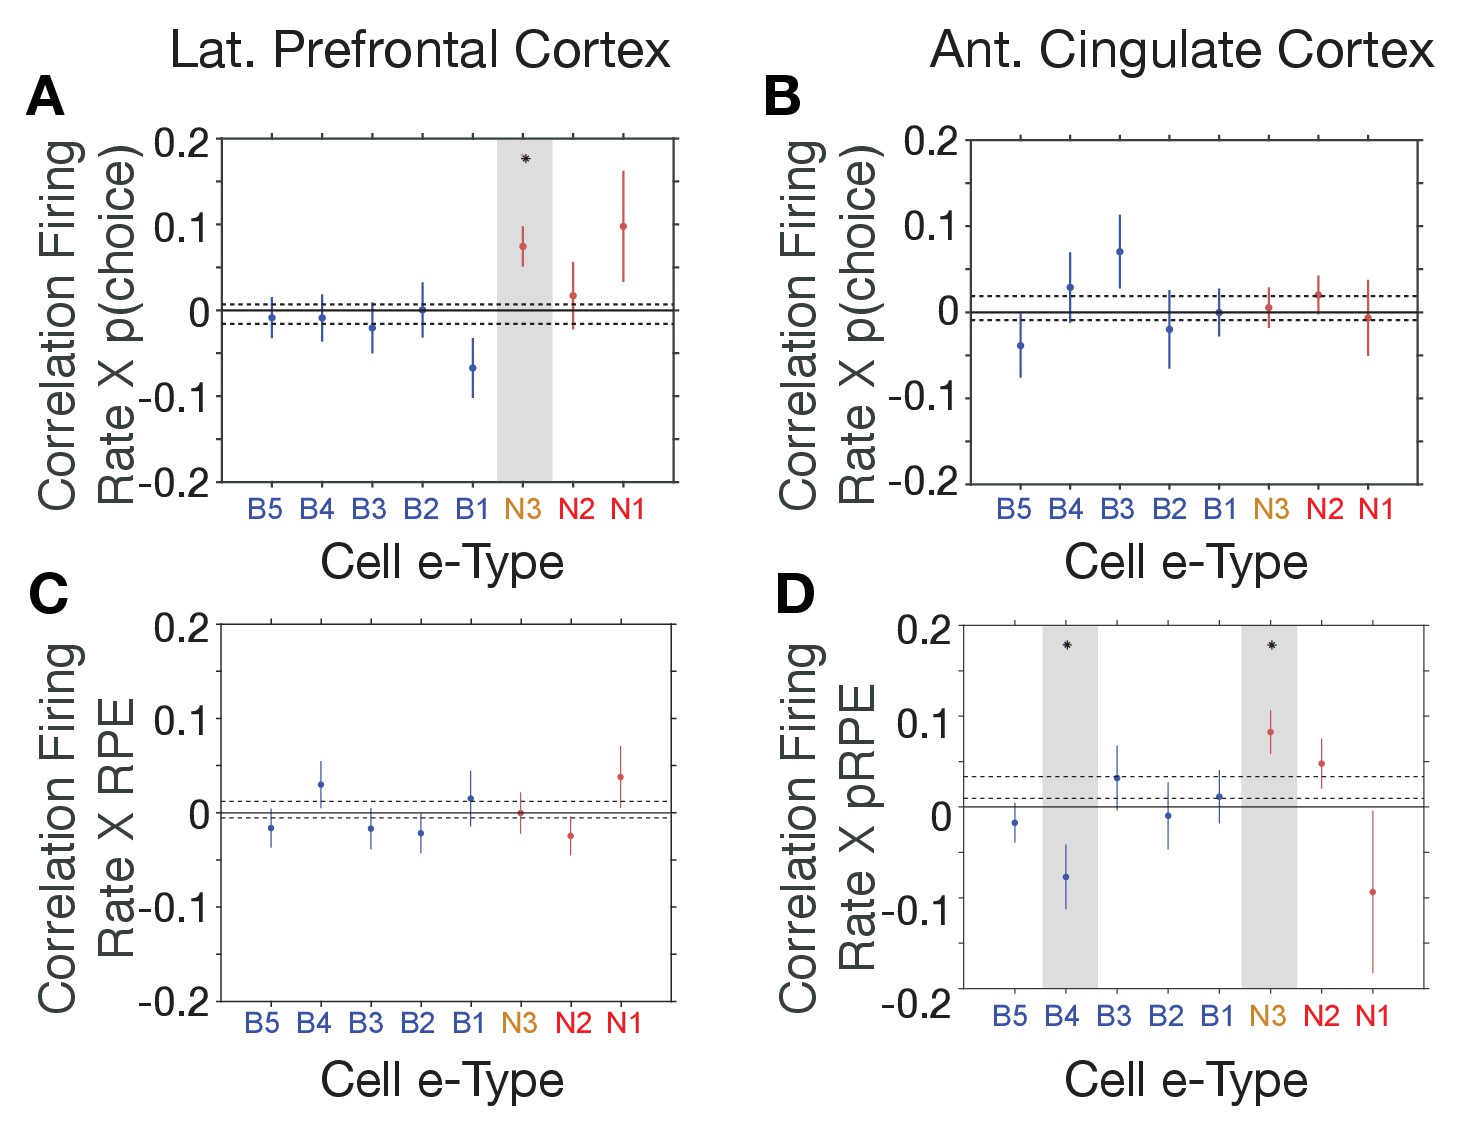
E-type-specific correlations with choice probability and reward prediction error in LPFC and ACC.
(A, B) Firing Rate X Choice Probability correlations for neurons of each e-type subclass in LPFC (A) and ACC (B). Only the N3 e-type neurons in LPFC show significant correlations. (C, D) Firing Rate X Reward Prediction Error correlations for neurons of each e-type subclass in LPFC (C) and ACC (D). The N3 e-type neurons in ACC show significant positive correlations, and the B3 e-type shows negative firing rate x RPE correlations. Grey shading denotes significance at p<0.05 (multiple comparison corrected). Error bars are SE’s. Source data 1 Correlation data and script for ploting panels A-D.
Figure 5—figure supplement 1
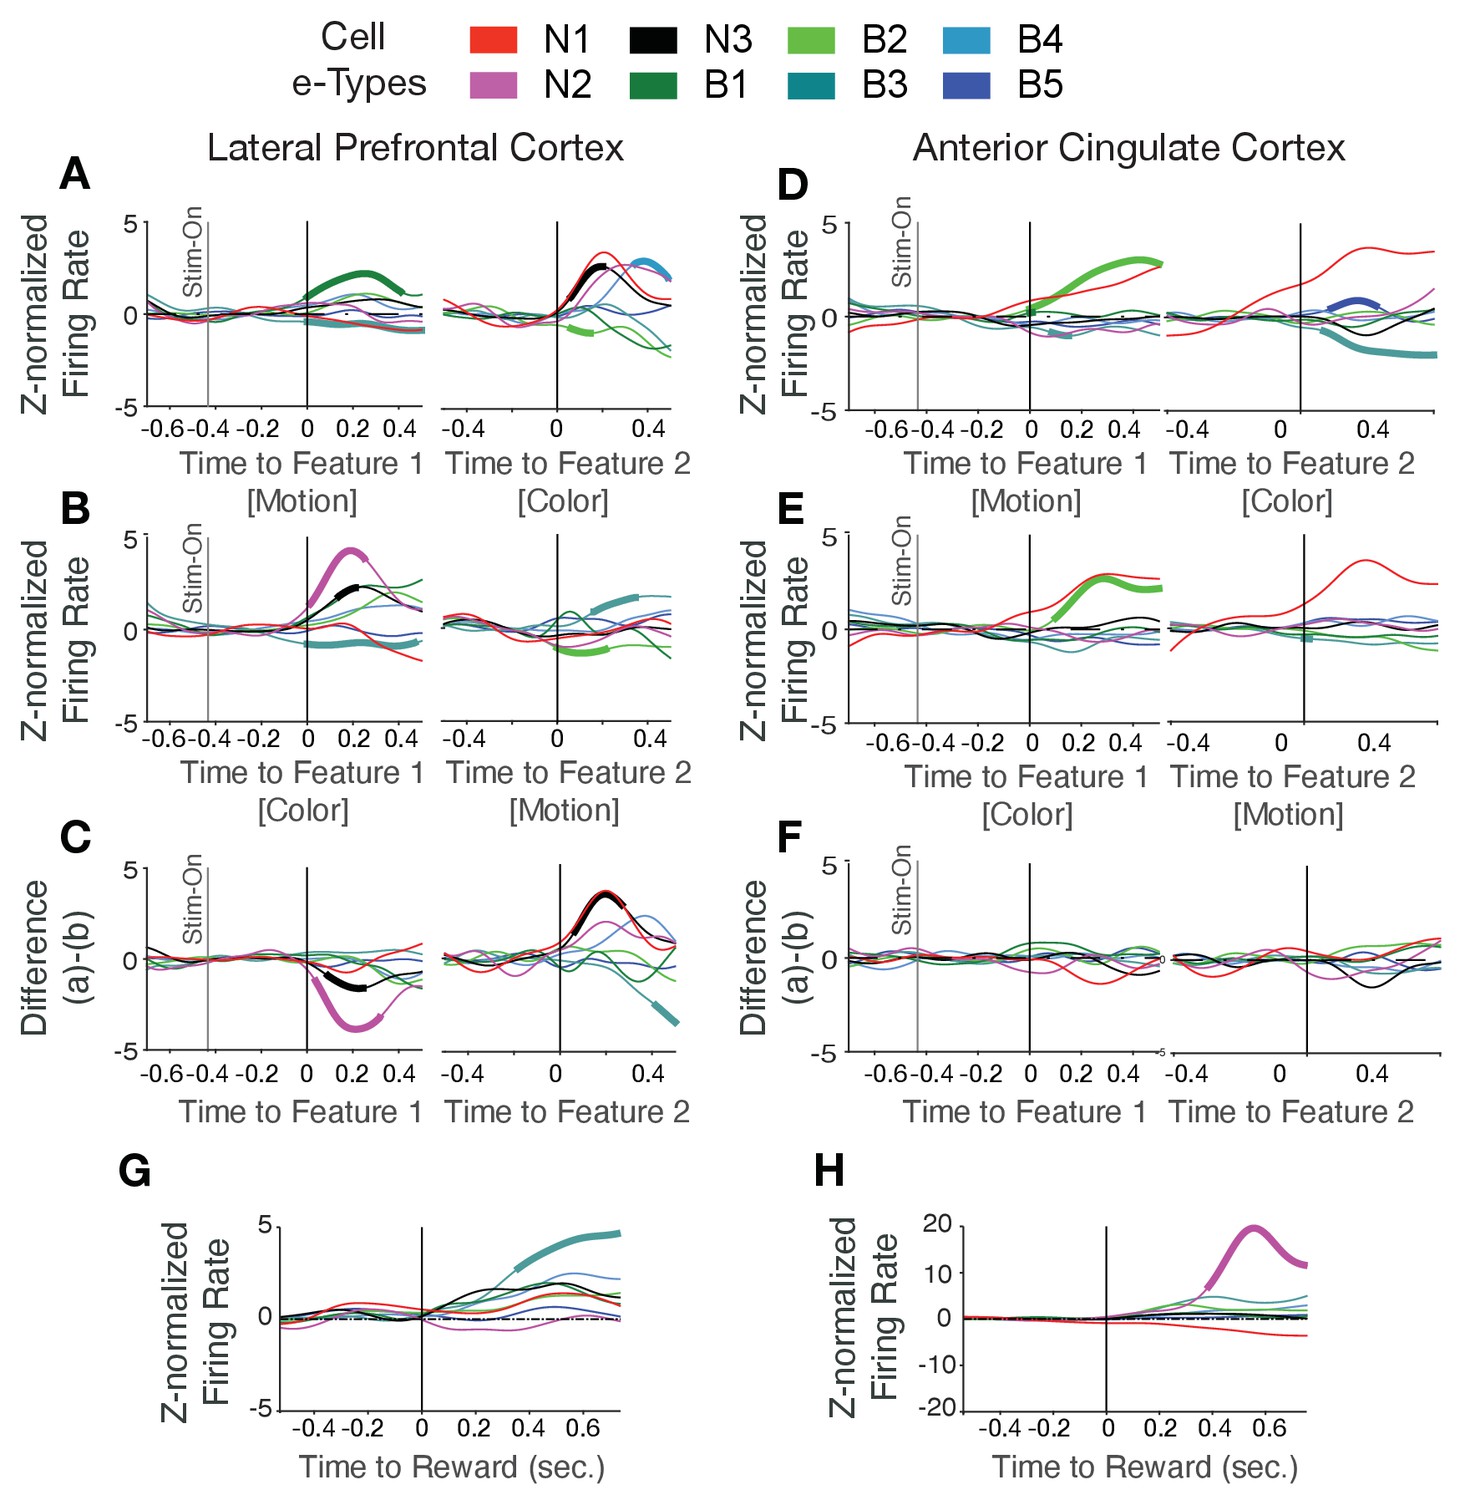
Color-, motion-, and reward- onset firing rate modulation for each cell e-type in LPFC and ACC.
Cohen’s d effect size in ACC Color selective responses in neurons of different e-types in LPFC and ACC. (A, B) For LPFC neurons the average normalized firing of each e-type (in color) when motion was feature-1 and color was feature-2 (A) and when color was feature-1 and motion was feature-2 (B). Thickened line segments denote significant modulation over pre-feature firing levels at p<0.05. (C) Difference of firing aligned to feature-1 (left) and feature-2 (right) shows that e-types N2 and N3 responded significantly stronger to color onsets than motion onsets irrespective of whether color was shown first or second. (D-F) Same as a-c for neurons and e-types in ACC. The only consistent effect was for e-type B2 neurons showing a transient onset response to the first feature irrespective of whether it was color or motion. See Supplementary file 1 for Cohen’s d effect size measures for each cell type to rule out that we overlooked significant effects because of low number of cells in a cell class. For example, in LPFC, the firing rates of the N2 and N3 e-type increased significantly to the color cue (p<0.05; effect size values for N2, N3 are −0.491,–0.300). (G, H) Reward-activated neurons of different e-types in LPFC and ACC. For LPFC, the average normalized firing of each e-type to the reward onset (G) show moderately increased firing rate in most e-types. B1 e-type neurons showed stronger activation compared with other e-types (p<0.05, randomization test). In ACC (H), the N2 e-type neurons showed stronger activation to the reward onset compared with other e-types (p<0.05, effect size values for B1, N2 are −0.311,–0.367 in LPFC and ACC, respectively).
Figure 5—figure supplement 2
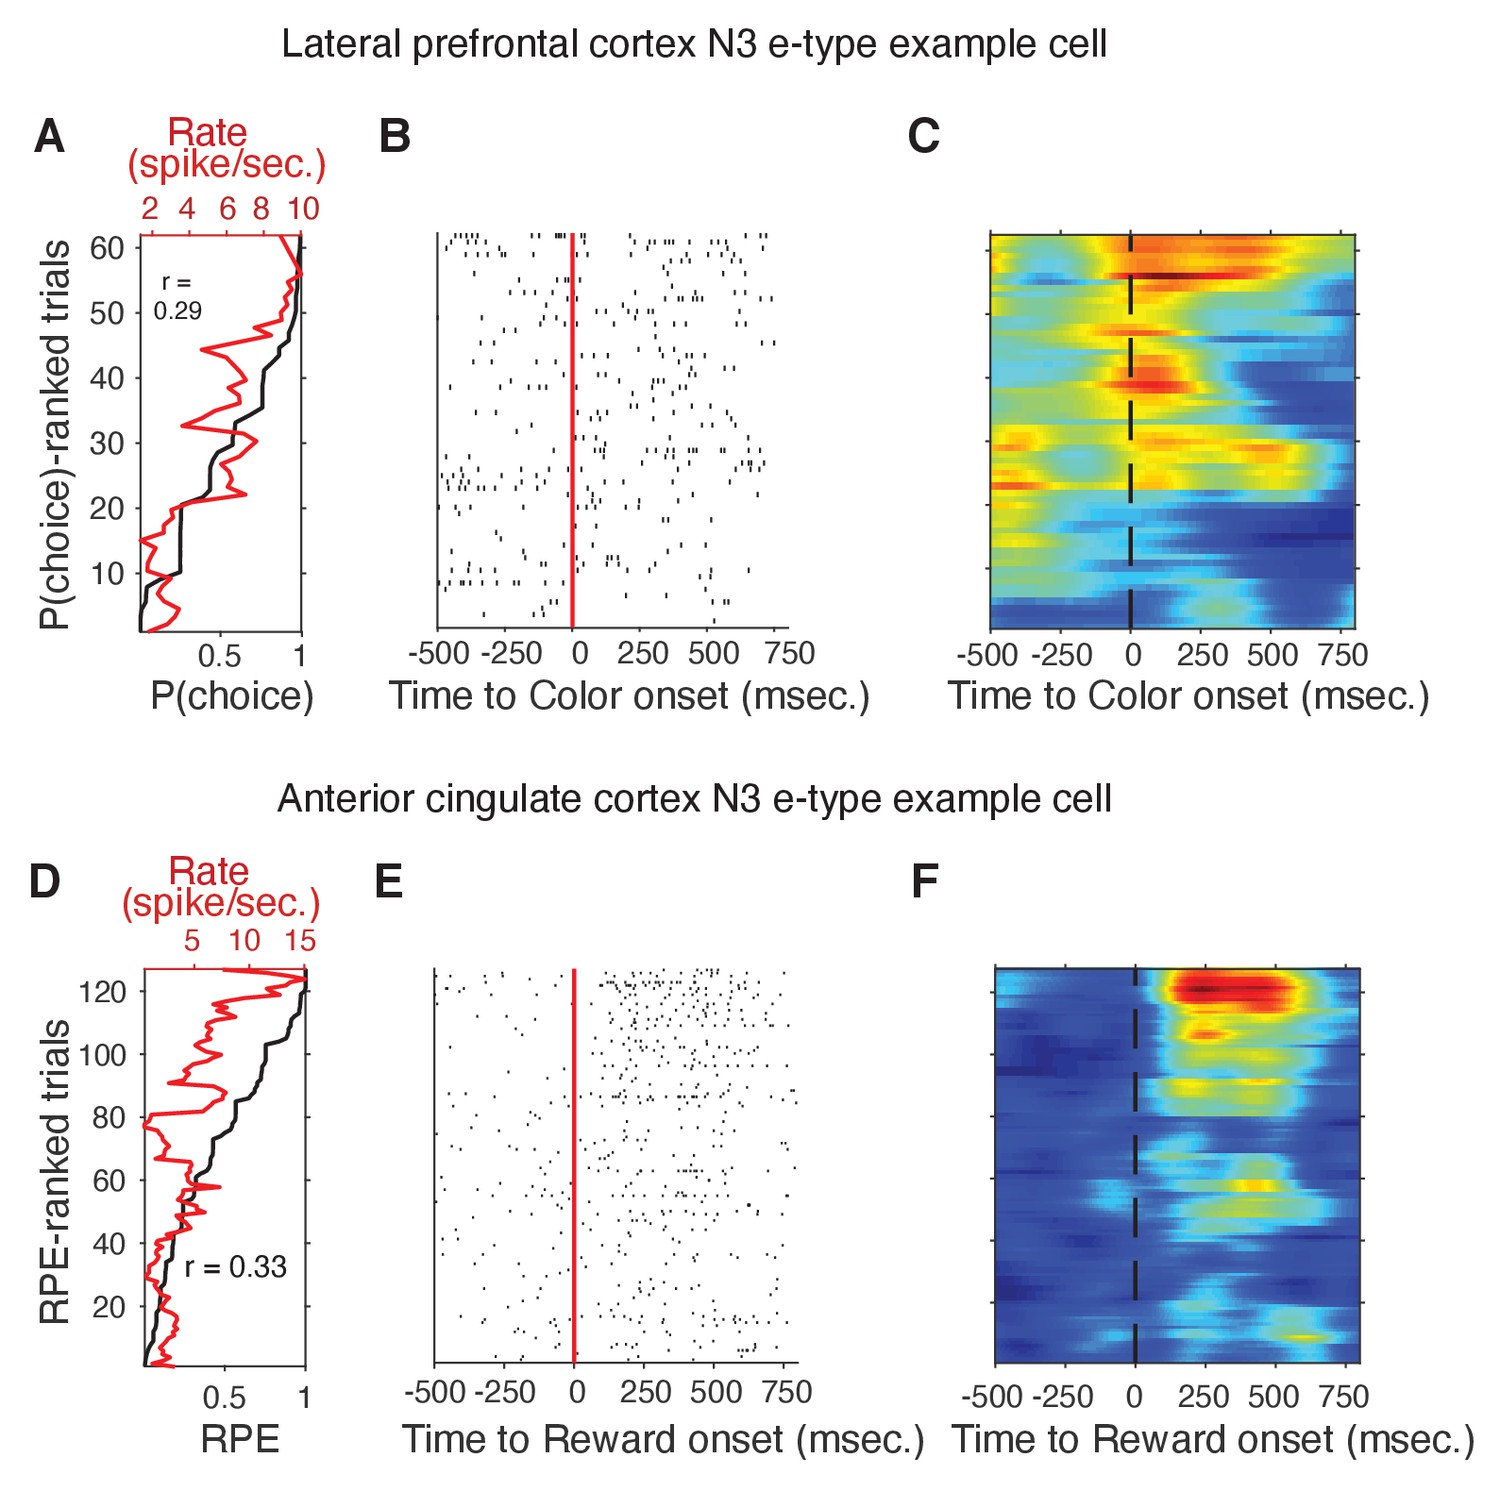
N3 e-type single cell example of firing rate and p(choice) in LPFC, and of firing rate and RPE in ACC.
(A) Trials (y-axis) are sorted by p(choice). The black line shows the ascending order of trials. The red line shows the mean firing rate of p(choice)-ranked trials in a window of 500 ms. after the color cue onset for an example cell in LPFC. (B) For the same cell the raster plot of the p(choice)-ranked trials aligned to the cue onset. (C) Cell activity heatmap corresponding to the raster plot in B. (D-F) Same format as A-C but for an example N3 e-type cell in ACC around the reward onset. Trials are rank-ordered according to the RPE value of the trial.
Figure 5—figure supplement 3
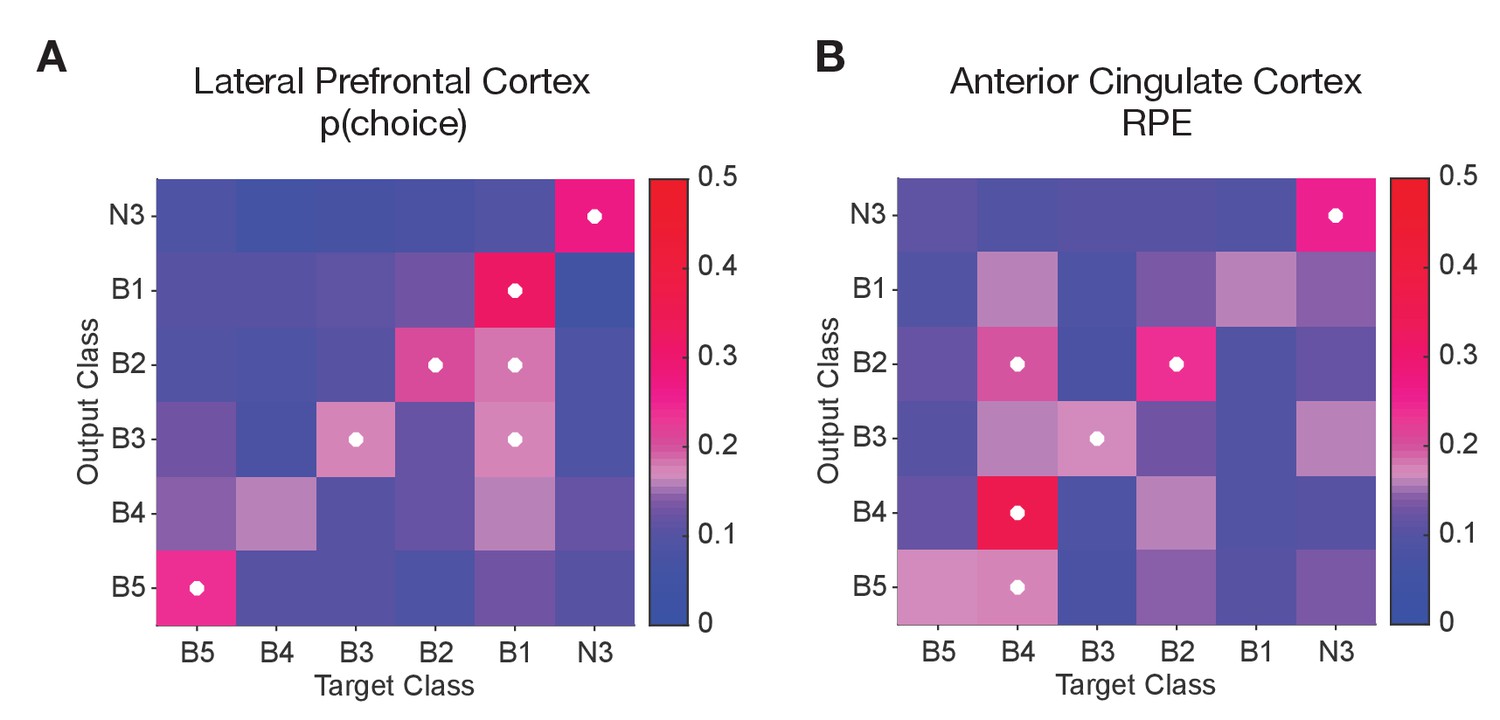
Predicting cluster label of cells from their functional correlation values.
(A) Confusion matrices from support vector machine (SVM) classification shows how accurate LPFC cells are classified into their true cell class (diagonal band) given the correlation value of their firing rate with p(choice). (B) Confusion matrices from support vector machine (SVM) classification shows how accurate ACC cells are classified into their true cell class (diagonal band) given the correlation value of their firing rate in reward period with RPE (In both panels, classes N1 and N2 are not shown as these two classes did not meet the criteria for training the classifier, for details see Materials and methods).
Figure 6 with 1 supplement
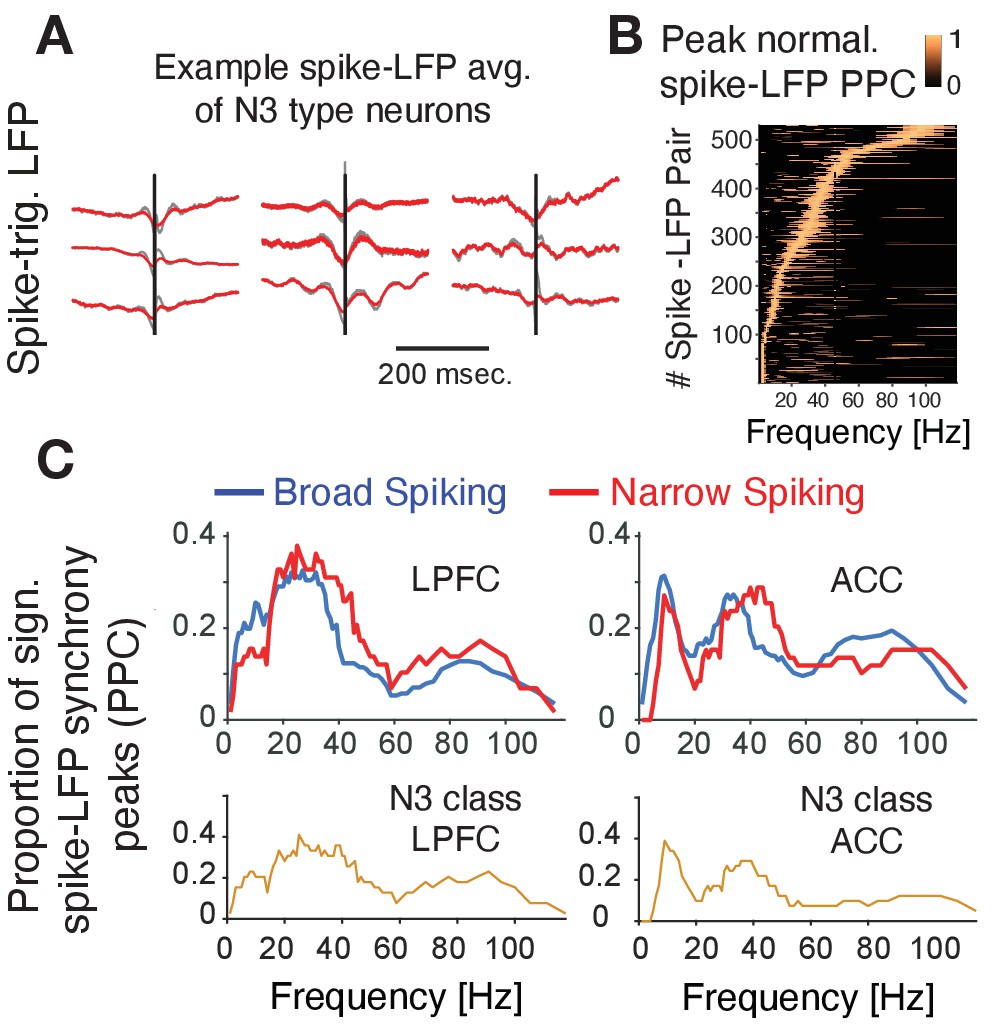
Spike-LFP phase synchronization.
(A) Average spike-triggered local field potential fluctuations of nine N3 e-type neurons showing a transient LFP oscillations from 5 Hz up to ~30 Hz. Black vertical line is the time of the spike. The red lines denote the LFP after adaptive spike artifact removal (raw traces in gray). (B) Peak normalized pairwise phase consistency for each spike-LFP pair (y-axis) rank ordered according to the frequency (x-axis) with peak PPC. (C) Proportion of sign. peaks of spike-LFP synchronization for neurons in LPFC (left) and ACC (right) for narrow and broad spiking neurons (upper rows) and for the N3 e-type neurons (bottom row).
Figure 6—figure supplement 1
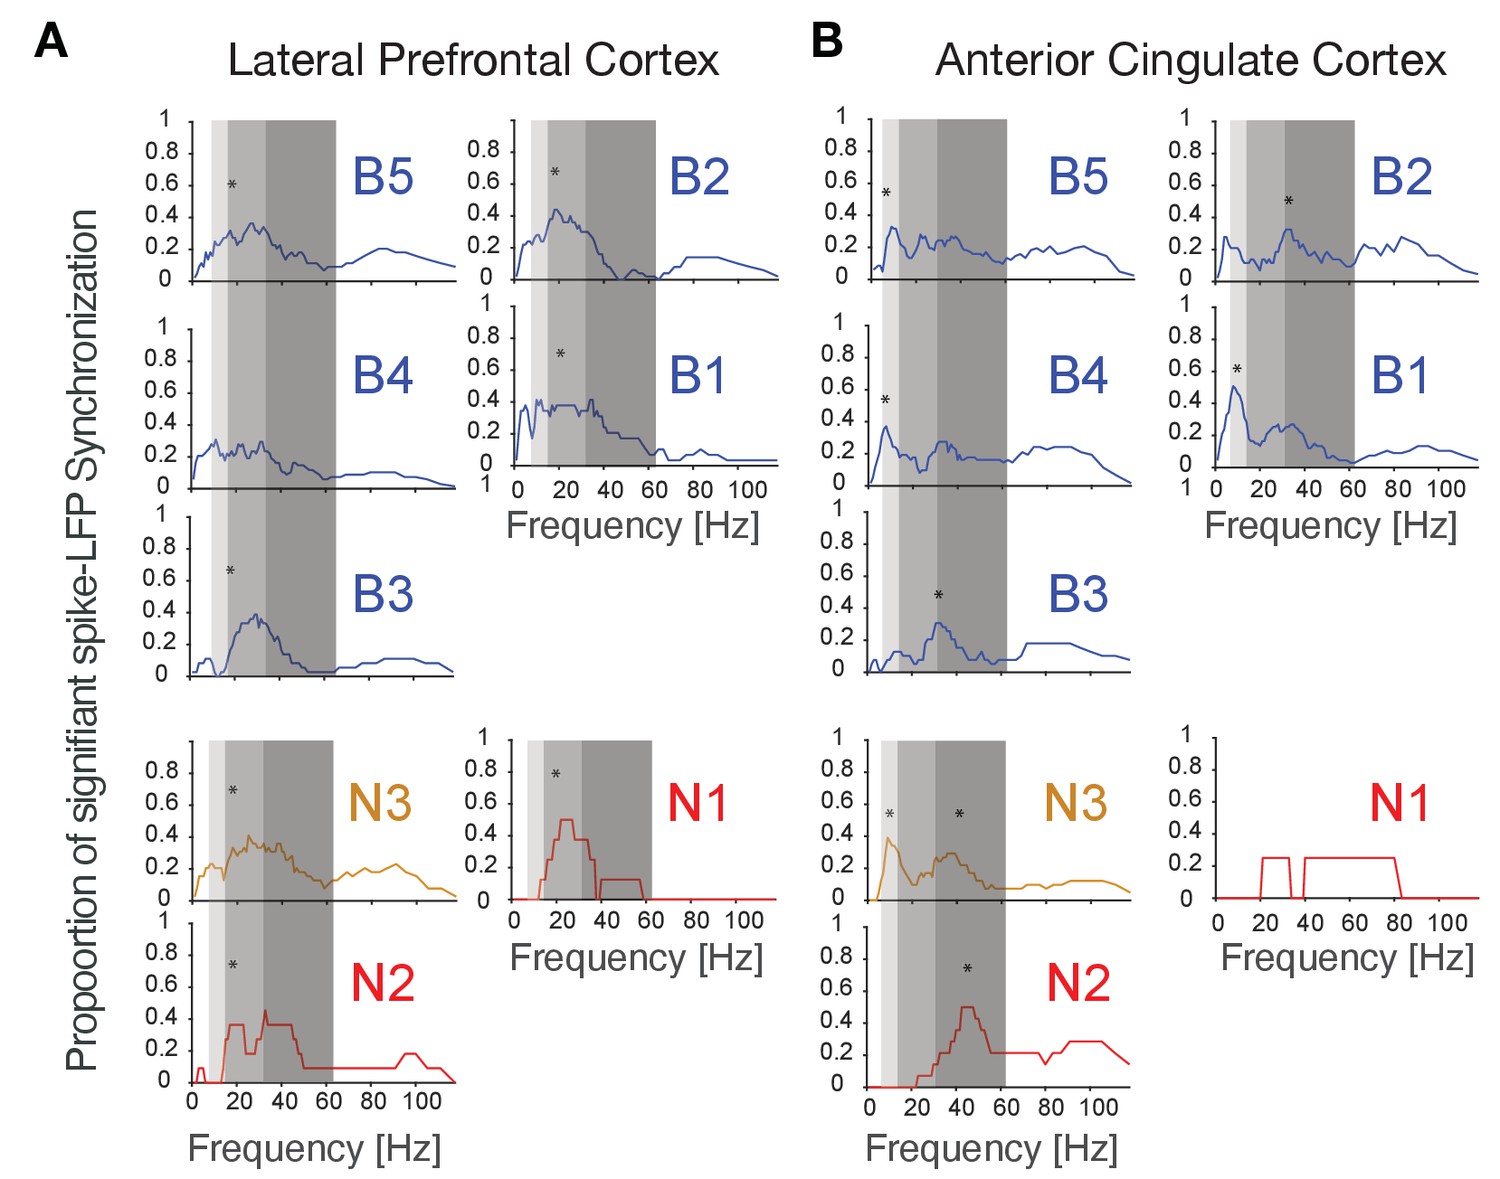
Spike-LFP synchronization for cell e-types in LPFC (A) and ACC (B).
Each panel shows the density of significant spike-LFP synchronization peaks across frequencies. Synchrony was calculated as pairwise phase consistency. Light, medium, and dark gray shading visualizes different alpha/theta, beta, and gamma frequency bands.
Figure 7 with 4 supplements

Spike-LFP phase synchronization in LPFC around the color onset for trials with low and high choice probability.
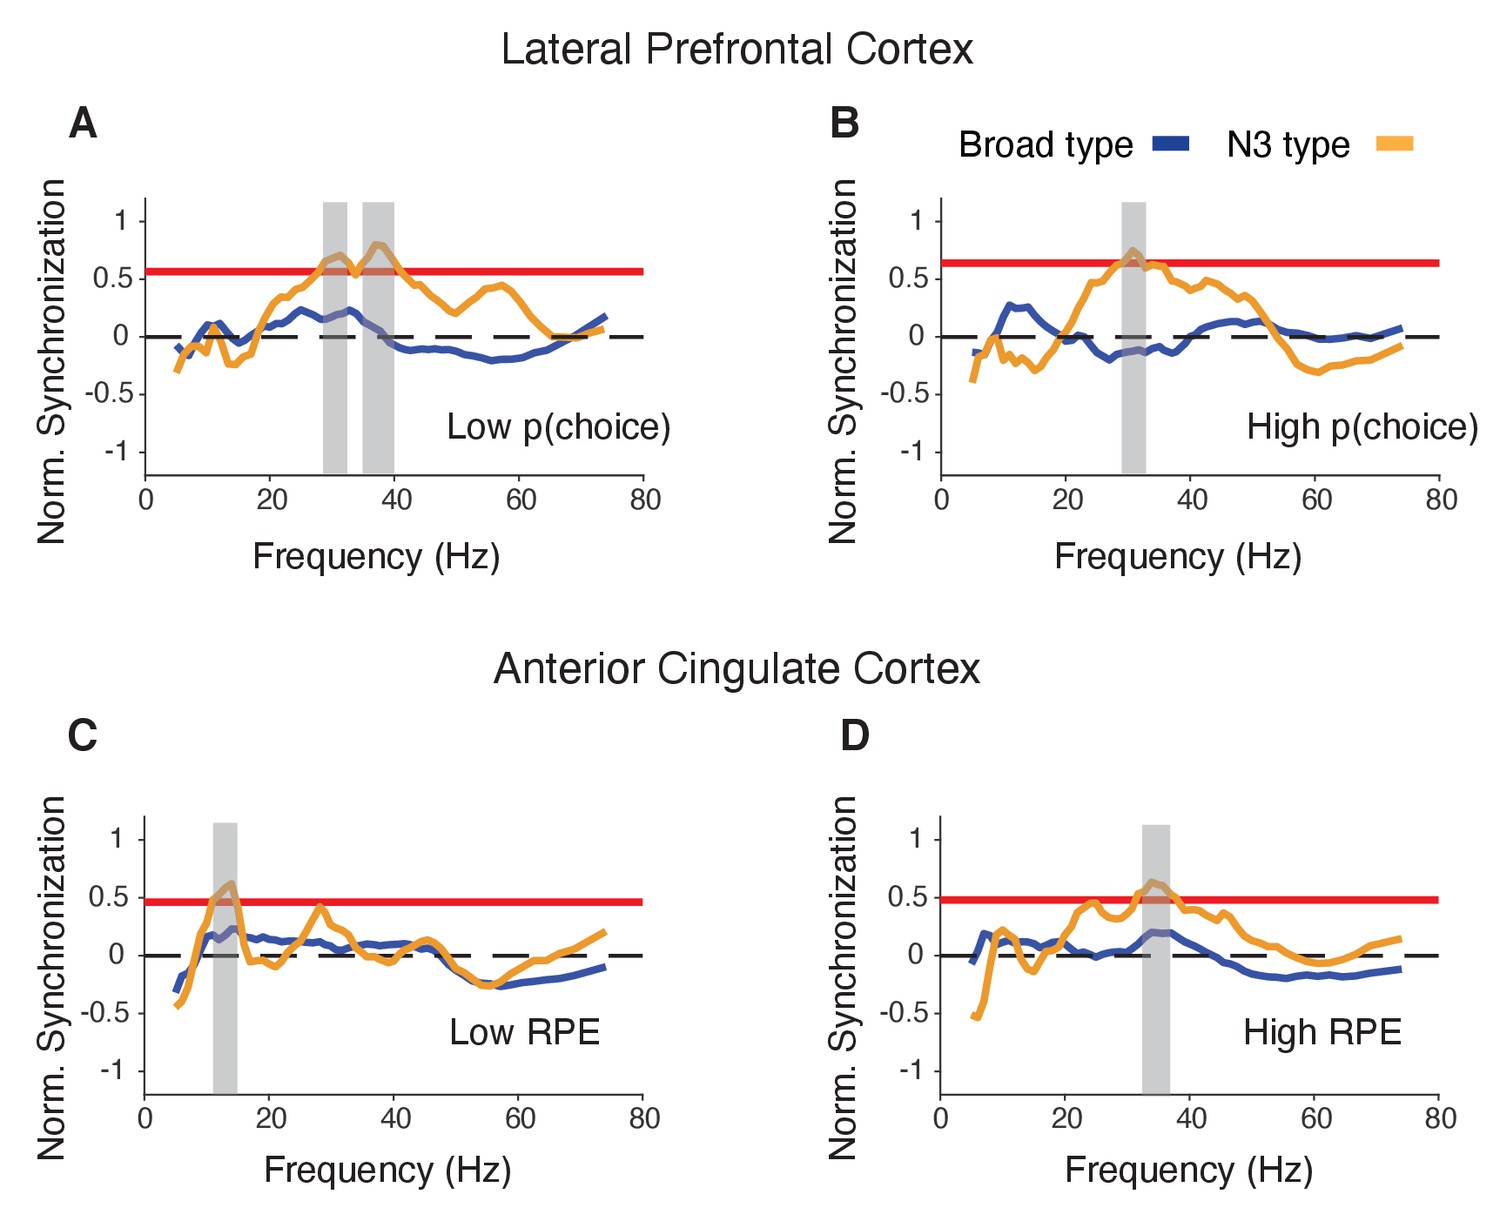
(A) Spike-LFP pairwise phase consistency for broad spiking neurons in LPFC around the time of the color onset (x-axis) for trials with the 50% lowest choice probabilities. (B) Same as (A) for neurons of the N3 e-type. Black contour line denotes statistically significant increased phase synchrony relative to the pre-color onset period. (C) Statistical comparison of spike-LFP synchrony for N3 e-type neurons (orange) versus broad spiking neurons (blue) for low choice probability trials in LPFC. Synchrony is normalized by the pre-color onset synchrony. Gray shading denotes p<0.05 significant differences of broad and N3 type neurons. (D,E,F) Same format as (A,B,C) but for the 50% of trials with the highest choice probability. Source data 3 Coherence data and script for ploting panels A-F.
Figure 7—figure supplement 1
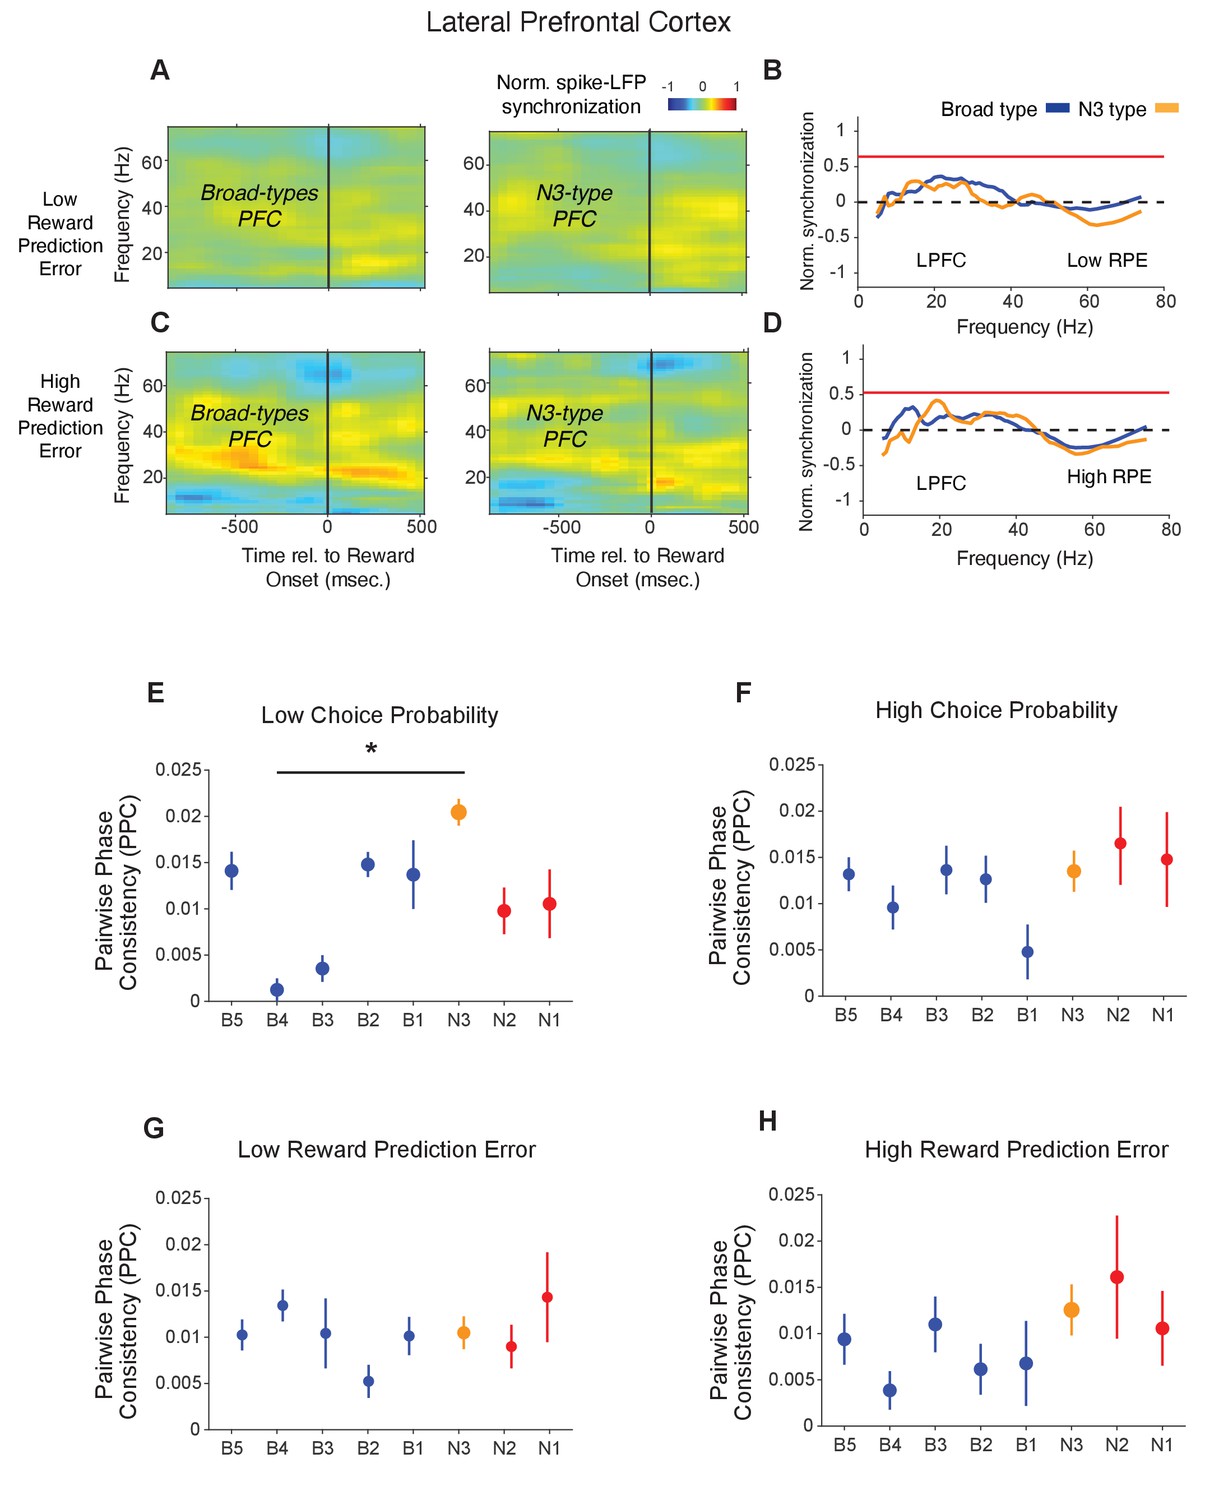
Spike-LFP phase synchronization in LPFC around the reward onset for trials with low and high reward prediction error.
(A) Spike-LFP pairwise phase consistency (PPC) for broad spiking neurons (left panel) and N3 e-type (right panel) in LPFC around the time of the reward onset (x-axis) for trials with the 50% lowest reward prediction error. (B) Statistical comparison of spike-LFP synchrony for N3 e-type neurons (orange) versus broad spiking neurons (blue) for low RPE trials in LPFC. (C and D) Same as in A and B, for trials with 50% highest reward prediction error. (E-F) PPC for synchrony of E-types in a window of 700 ms after the color cue onset for trials with (E) low and (F) high choice probability. The star denotes significance at p<0.05 (see main text). (G-H) PPC for synchrony of E-types in a window of 700 ms after the reward onset for trials with (G) low and (H) high reward prediction error. Errors are SE’s.
Figure 7—figure supplement 2
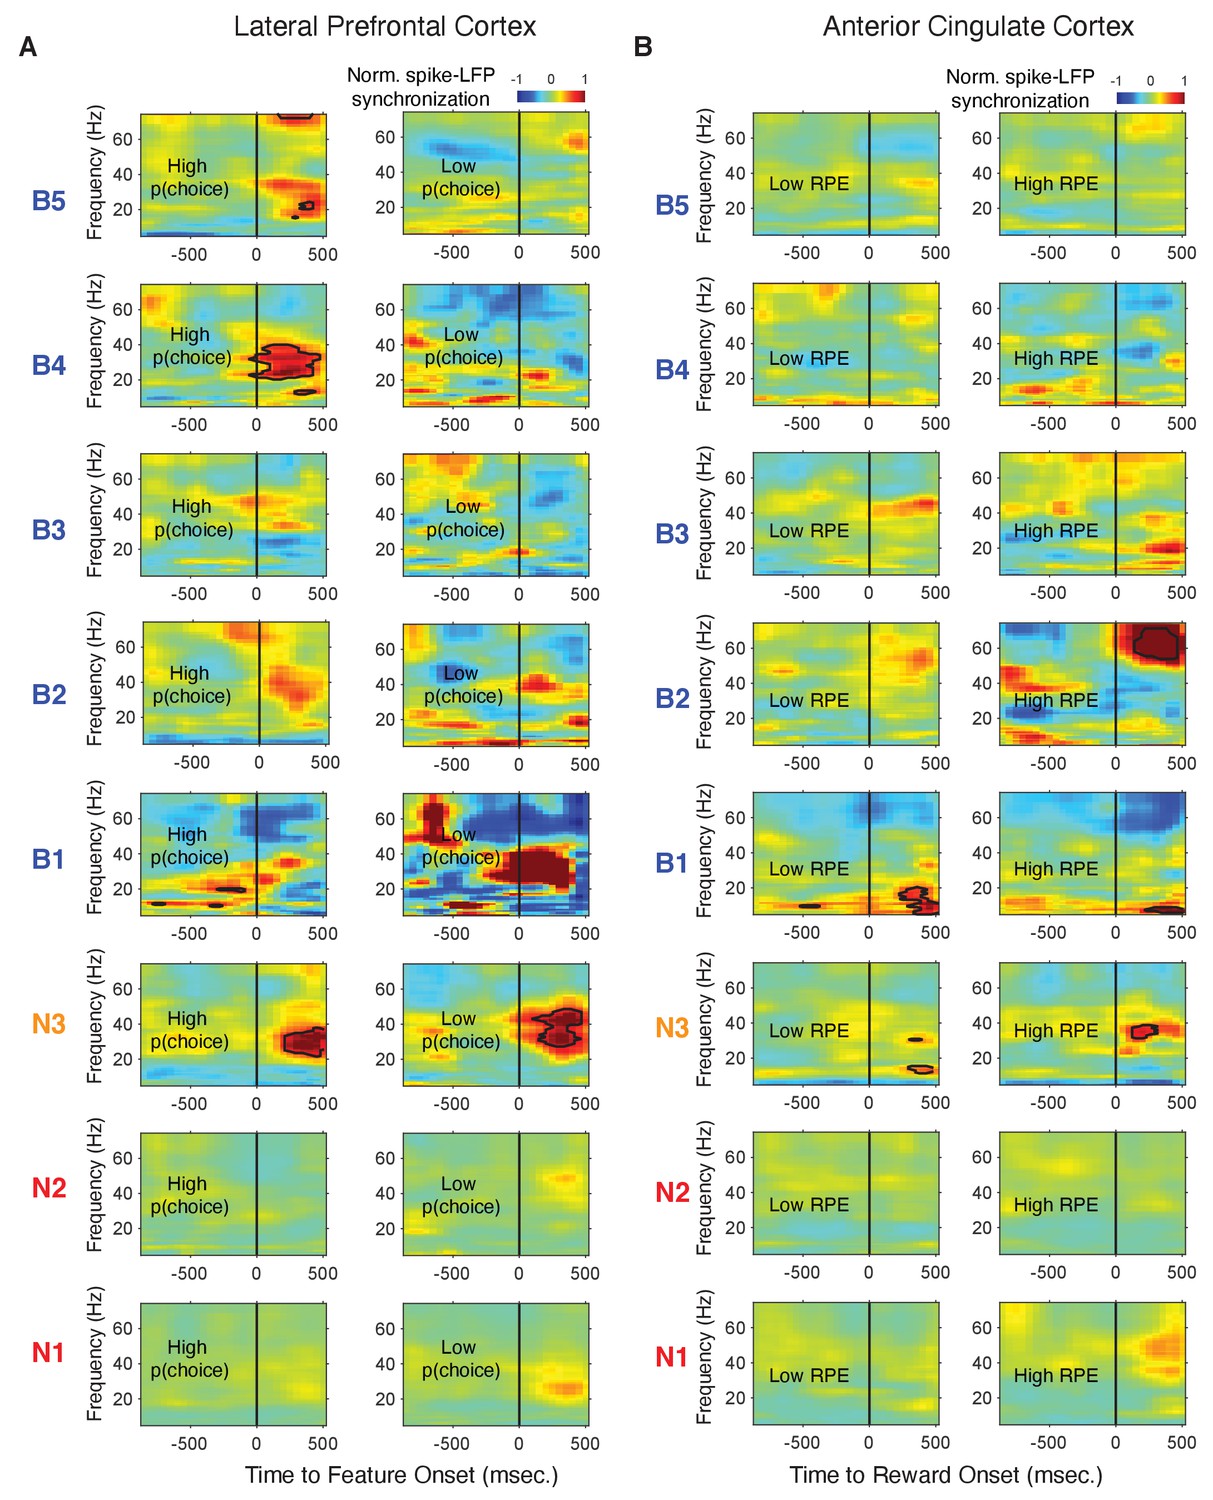
Spike-LFP phase synchronization of e-types in LPFC and ACC during outcome processing for trials with low and high choice probabilities and reward prediction error.
(A) Spike-LFP pairwise phase consistency e-types in LPFC around color cue onset (x-axis) for trials with the 50% highest (Left panels) and trials with 50% lowest (right panels) choice probabilities. (B) Spike-LFP pairwise phase consistency e-types in ACC around reward onset (x-axis) for trials with the 50% lowest (Left panels) and trials with 50% highest (right panels) reward prediction error. Black contours show class specific significant coherence (p<0.05 randomization test). Source data 3 Data and script used for class specific coherence results.
Figure 7—figure supplement 3
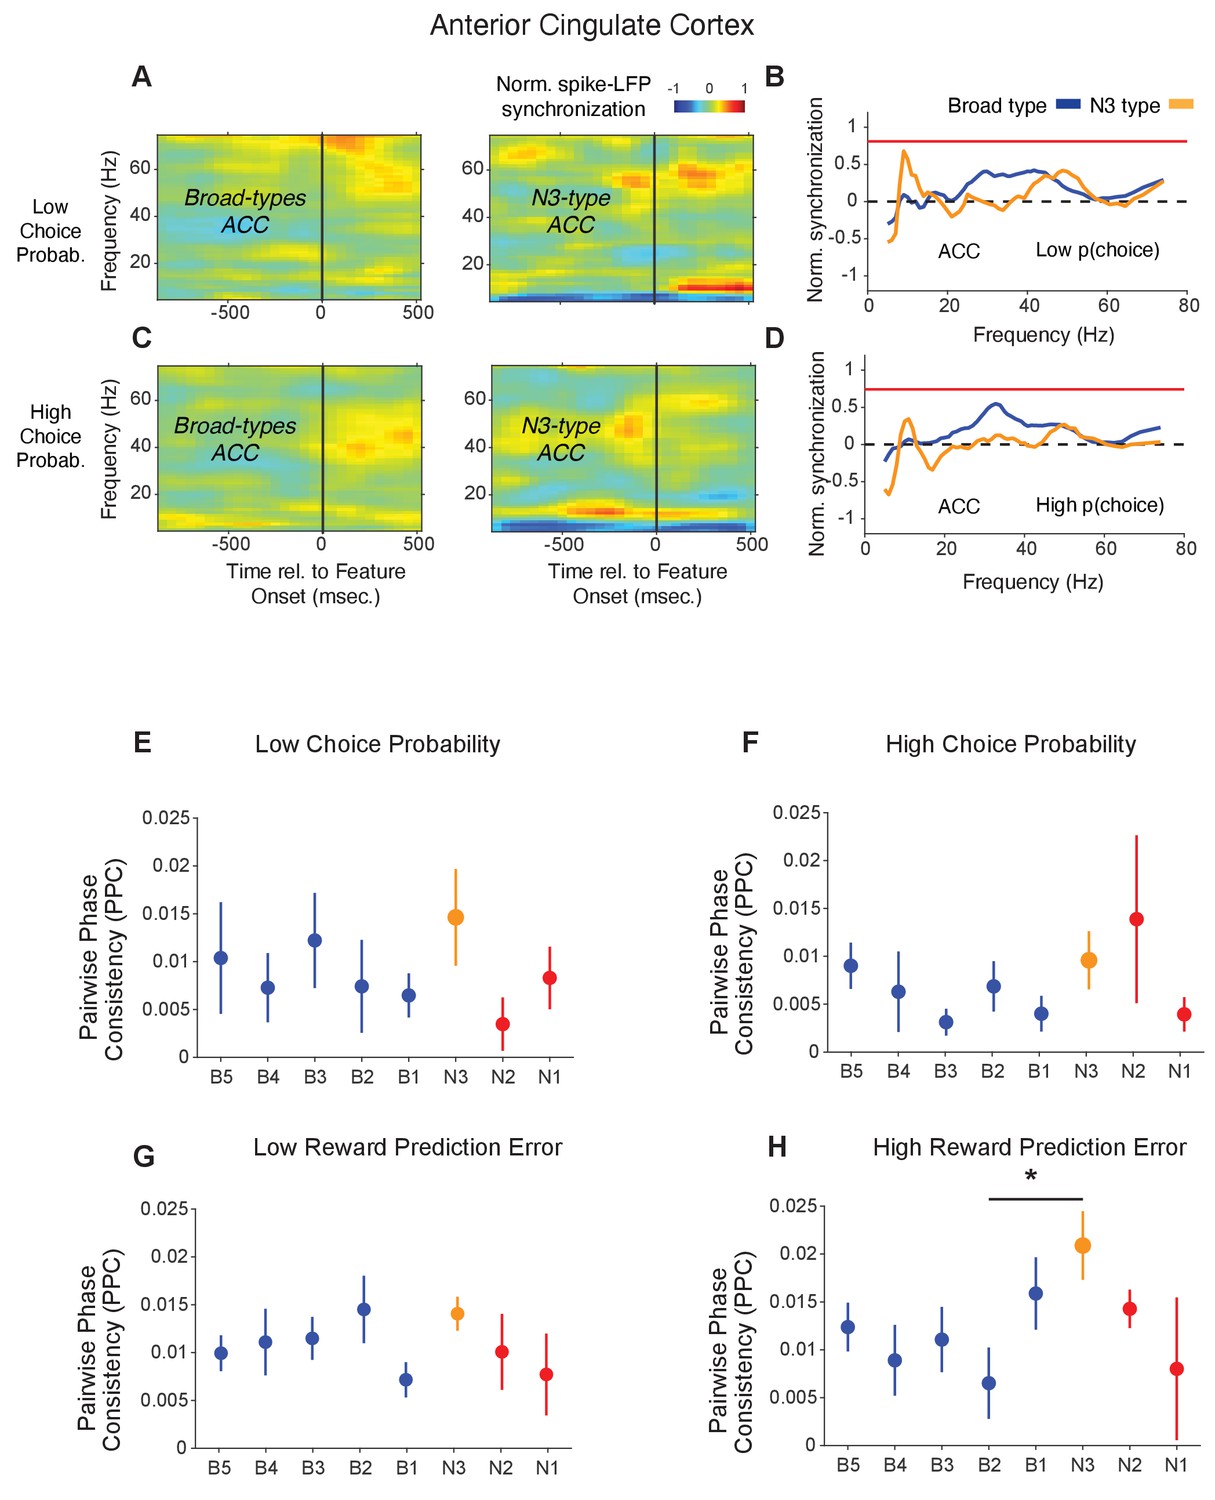
Spike-LFP phase synchronization in ACC during outcome processing for trials with low and high choice probabilities.
(A) Spike-LFP pairwise phase consistency for broad spiking neurons (left panel) and N3 e-type (right panel) in ACC around color cue onset (x-axis) for trials with the 50% lowest choice probabilities. (B) Statistical comparison of the spike-LFP synchrony (normalized by the pre-reward synchrony) for N3 e-type neurons (orange) versus broad spiking neurons (blue) in ACC for trials with low choice probability. (C and D) Same as in A and B, for trials with 50% highest choice probability. (E-F) Pairwise phase consistency for synchrony of E-types in a window of 700 ms after the color cue onset for trials with (E) low and (F) high choice probability. The star denotes significance at p<0.05 (see main text). (G-H) Pairwise phase consistency for synchrony of E-types in a window of 700 ms after the reward onset for trials with (G) low and (H) high reward prediction error. Errors are SE’s.
Figure 7—figure supplement 4
Spike-LFP synchronization of broad spiking neurons and the N3 e-type in LPFC and ACC after subtracting event evoked LFP.
The plots are in same format as Figure 7C,F and Figure 8C,F of the main text. (A) Statistical comparison of event evoked LFP subtracted spike-LFP synchrony for N3 e-type neurons (orange) versus broad spiking neurons (blue) for low choice probability trials in LPFC. Synchrony is normalized by the pre-color onset synchrony. Grey shading denotes p<0.05 significant differences of broad and N3 type neurons. (B) The same as in A but for 50% highest p(choice) trials. The same statistical comparison as in A and B was done for neurons in ACC and after subtracting reward evoked LFP for 50% lowest RPE trials (C) and 50% highest RPE trials (D).
Figure 8
Spike-LFP phase synchronization in ACC during outcome processing for trials with low and high reward prediction errors.
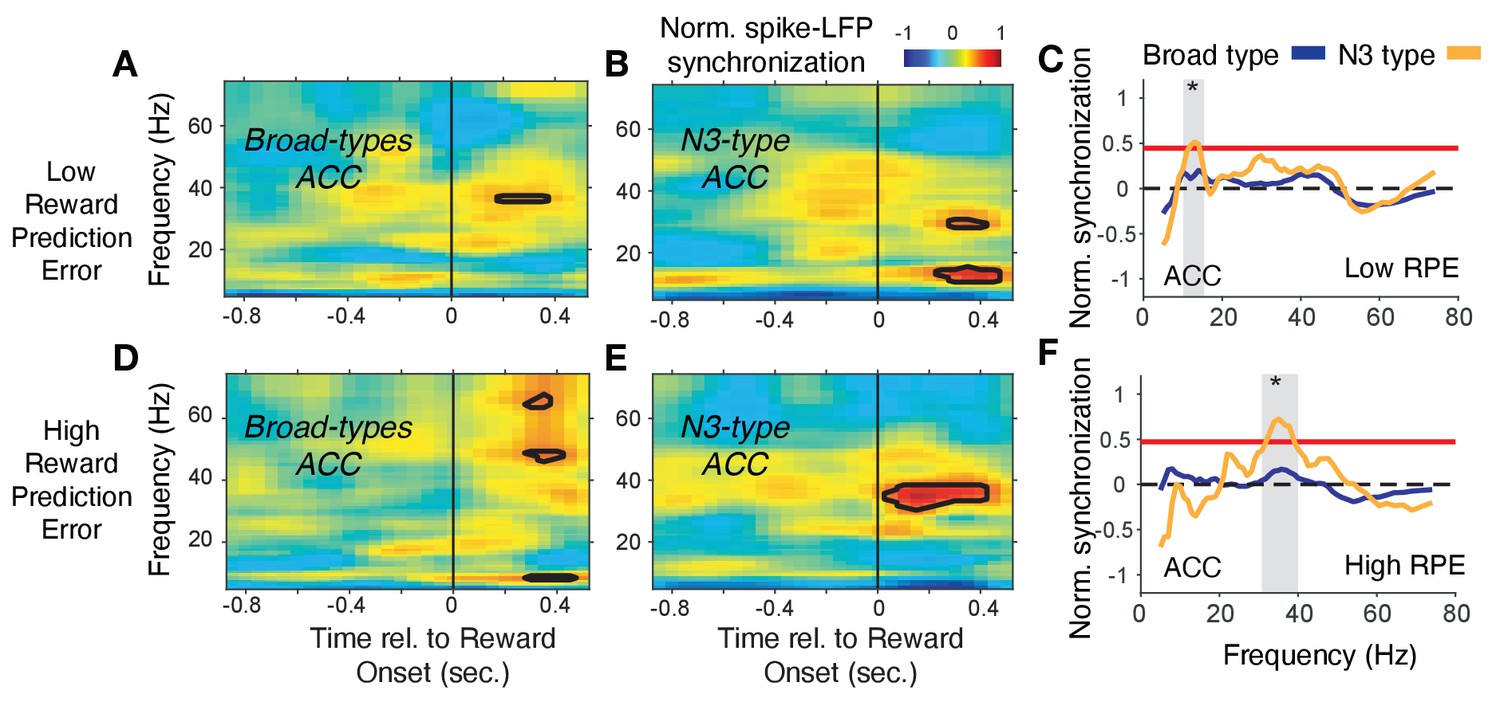
(A) Spike-LFP pairwise phase consistency for broad spiking neurons in ACC around reward onset (x-axis) for trials with the 50% lowest reward prediction errors. (B) Same as (A) for neurons of the N3 e-type. Black contour line denotes statistically significant increased phase synchrony relative to the pre-reward period. (C) Statistical comparison of the spike-LFP synchrony (normalized by the pre-reward synchrony) for N3 e-type neurons (orange) versus broad spiking neurons (blue) in ACC for trials ending in low reward prediction errors. Gray shading denotes frequencies with p<0.05 significant differences of broad spiking versus N3 e-type neurons. (D,E,F) Same format as (A,B,C) but for the 50% of trials with the highest high reward prediction error outcomes. Source data 3 Coherence data and script for ploting panels A-F.
Figure 9 with 2 supplements
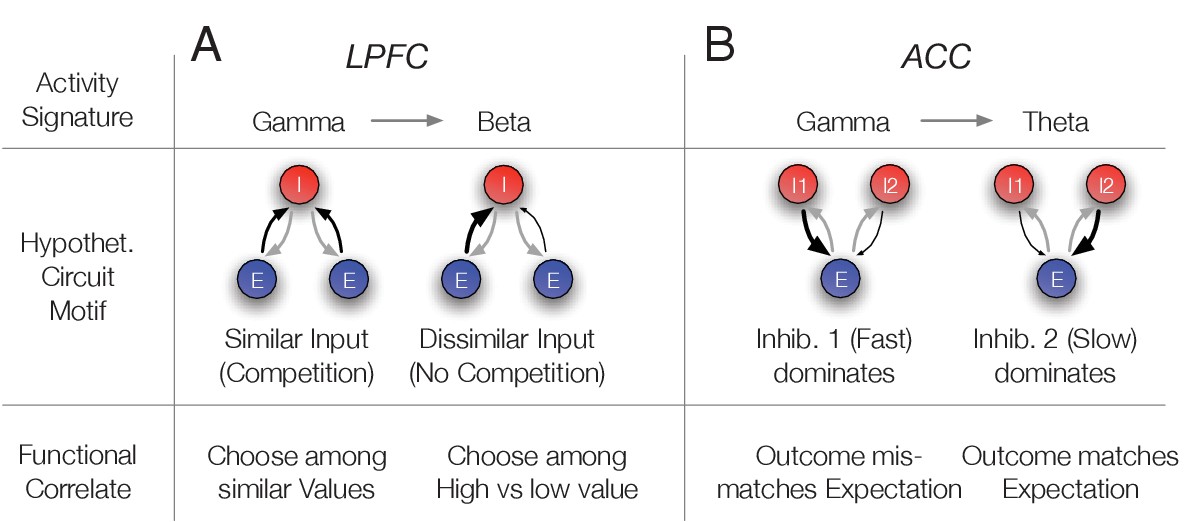
Hypothetical link of the observed gamma band synchronization of the N3 e-type to circuit motifs and their putative functional correlate.
(A) The N3 e-type in LPFC synchronized at gamma when p(choice) was relatively low and at beta frequencies otherwise. The switch from gamma to beta synchronization can be parsimoniously reproduced in a circuit model with an interneuron (I) population receiving inputs from two excitatory (E) populations. When the input is diverse (similar p(choice)) a simulated circuit shows gamma activity (left) while when one excitatory population dominates it engages in beta synchronization (simulation details in Appendix 1). This activity signature could correspond at the functional level to choosing among similar valued stimuli (left) versus choosing stimuli with different values (bottom row). (B) In ACC the N3 e-type synchronized at gamma when the prediction error was large and at theta frequencies otherwise. The switch from gamma to theta synchronization can parsimoniously be reproduced in a circuit model with two I populations having different time constants and reciprocally connected to an E population. When the faster spiking I1 population is activated stronger, either directly from an external source, putatively by disinhibition of another interneuron population, the network synchronizes at gamma while otherwise the I2 neurons population imposes slower theta rhythmic synchrony to the network (simulation details in Appendix 1). Bottom: The activity states were functionally linked to those trials when outcomes mismatched expectations (high RPE) or matched the expected outcomes (low RPE).
Figure 9—figure supplement 1
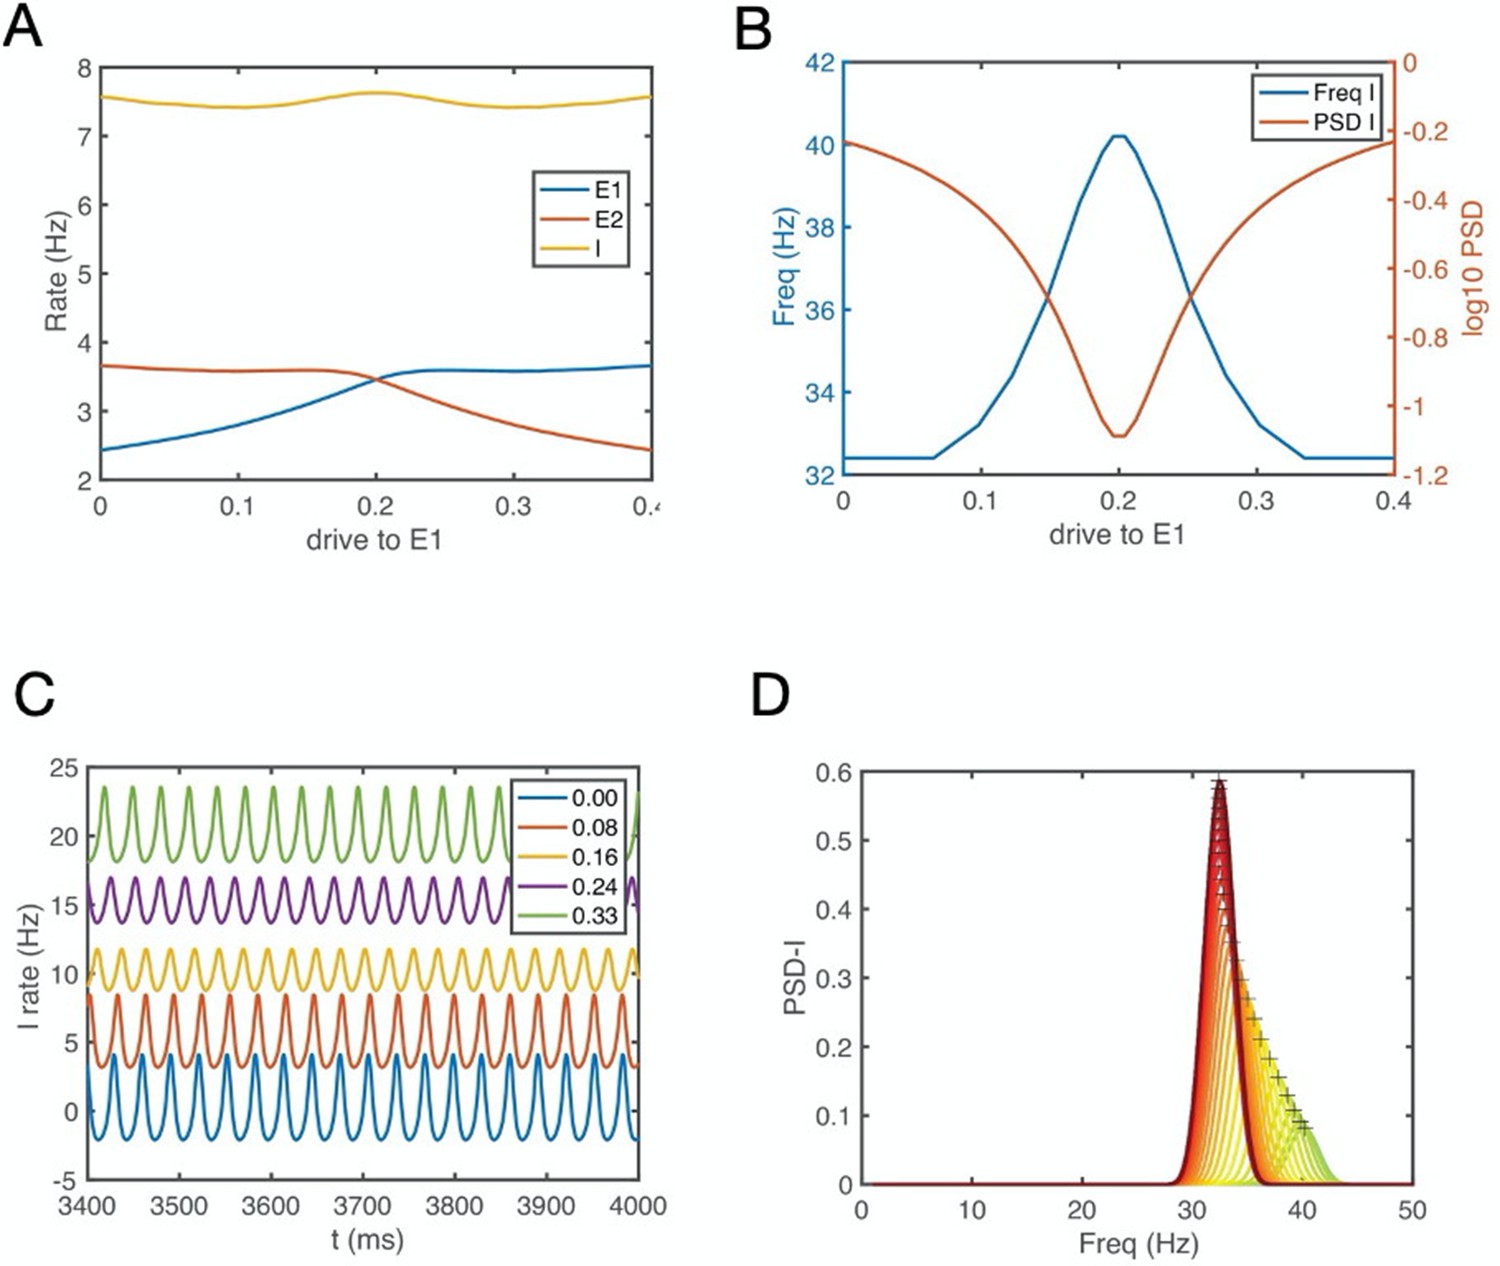
E-E-I circuit simulation results: Gamma oscillations index similar excitatory input strength from two excitatory neuron populations to a fast spiking inhibitory neuron, whereas beta oscillations index diverse input strength (see also Figure 9A).
(A) Firing rate of the E1, E2 and I population as a function of the drive to E1. The drive to E1 increase while concomitantly the drive the E2 decreases, see Appendix 1. These activity changes could correspond to E1 and E2 representing the values of the two objects, and a change of these values from E1 (object 1) to E2 (object 2) during reversal learning. (B) The oscillation frequency and power of the I1 population versus E1 drive. Gamma synchronization (y-axis) emerges when there is similar activity in E1 and E2. For details, see Appendix 1.
Figure 9—figure supplement 2
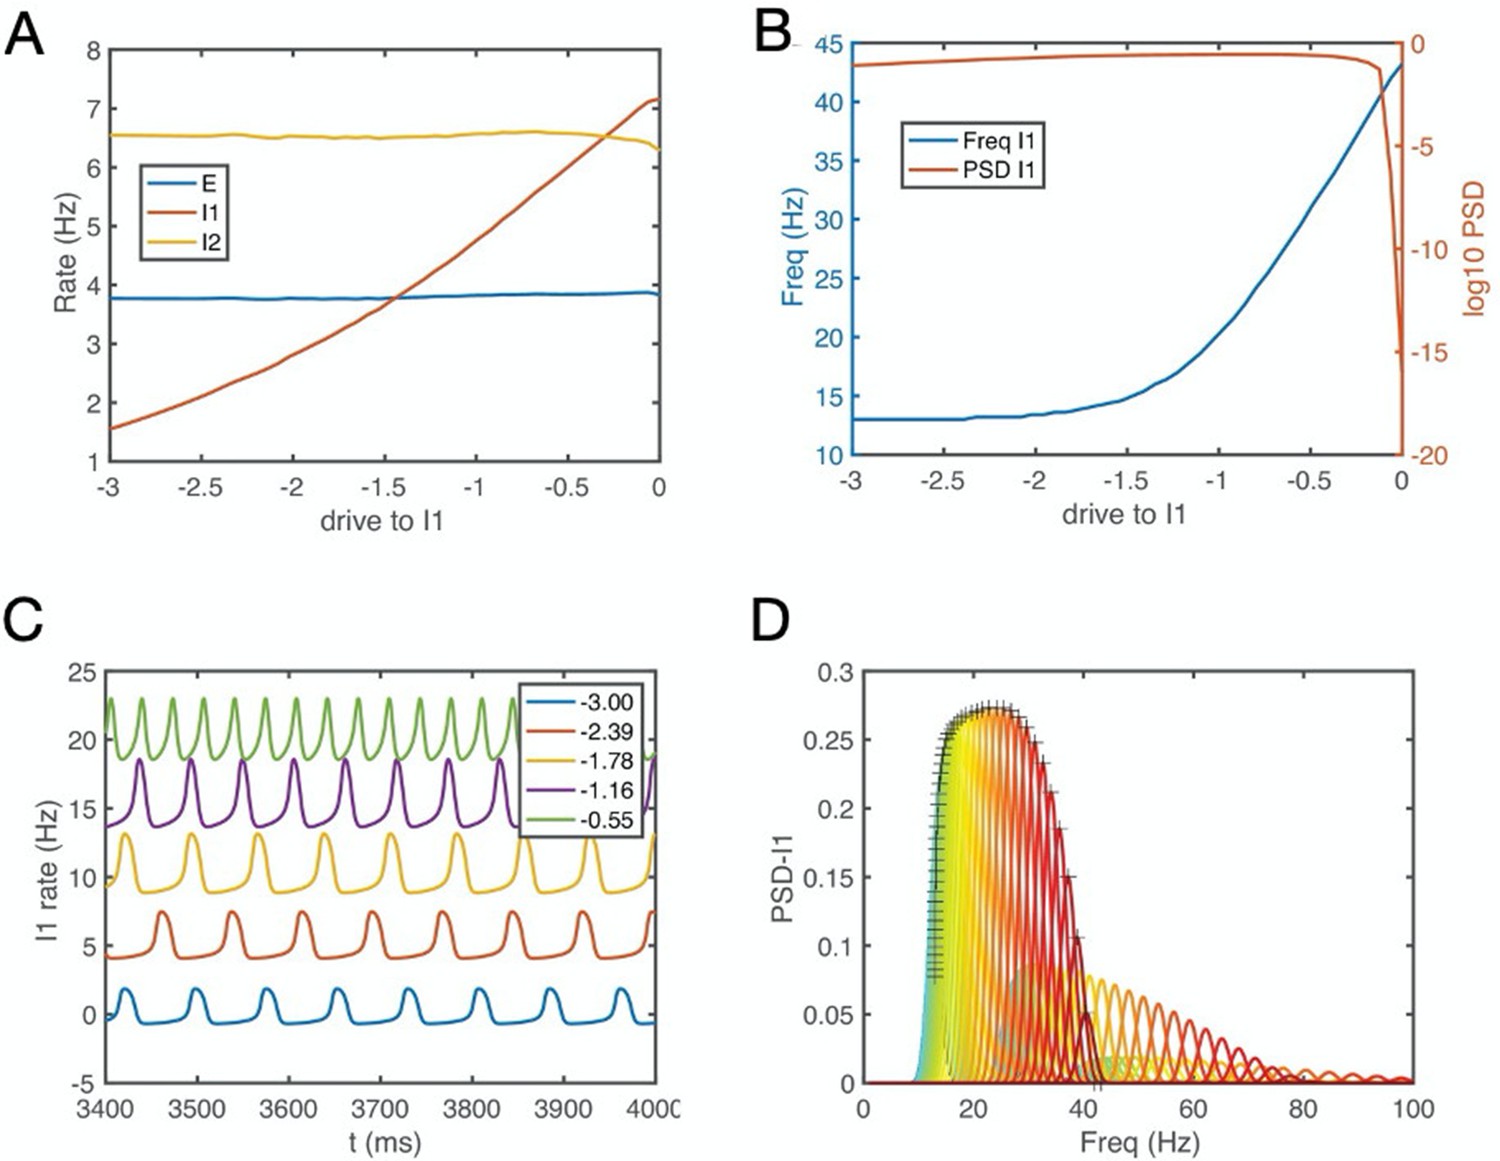
E-I-I circuit simulation results: The circuit synchronizes at low or high frequencies depending on whether I1 interneurons are inhibited or released from inhibition (see also Figure 9B).
(A) Firing rate of the E, I1 and I2 population as a function of the drive to I1. (B) The oscillation frequency and power of the I1 population versus I1 drive show that gamma emerges when the I1 population receives more excitatory drive. Empirically, the I1 interneurons could correspond to the N3 e-type cells and the situation with lager drive corresponds to periods with large reward prediction errors. For details, see Appendix 1.
Additional files
-
Supplementary file 1
Cohen’s d effect sizes for firing rate modulation of each of eight e-types during the trial epochs Feature-1, Feature-2, and Reward for lateral prefrontal cortex (PFC) and anterior cingulate cortex (ACC).
- https://cdn.elifesciences.org/articles/69111/elife-69111-supp1-v2.docx
-
Source data 1
Correlation Analysis.
- https://cdn.elifesciences.org/articles/69111/elife-69111-data1-v2.zip
-
Source data 2
Cluster Analysis.
- https://cdn.elifesciences.org/articles/69111/elife-69111-data2-v2.zip
-
Source data 3
Synchronization Analysis.
- https://cdn.elifesciences.org/articles/69111/elife-69111-data3-v2.zip
-
Transparent reporting form
- https://cdn.elifesciences.org/articles/69111/elife-69111-transrepform-v2.docx
Download links
A two-part list of links to download the article, or parts of the article, in various formats.
Downloads (link to download the article as PDF)
Open citations (links to open the citations from this article in various online reference manager services)
Cite this article (links to download the citations from this article in formats compatible with various reference manager tools)
Interneuron-specific gamma synchronization indexes cue uncertainty and prediction errors in lateral prefrontal and anterior cingulate cortex
eLife 10:e69111.
https://doi.org/10.7554/eLife.69111


