The use of non-functional clonotypes as a natural calibrator for quantitative bias correction in adaptive immune receptor repertoire profiling
- Skolkovo Institute of Science and Technology, Russian Federation
- Department of Genomics of Adaptive Immunity, Shemyakin-Ovchinnikov Institute of Bioorganic Chemistry, Russian Federation
- Dmitry Rogachev National Medical Research Center of Pediatric Hematology, Oncology and Immunology, Russian Federation
- Pirogov Russian National Research Medical University, Russian Federation
- Central European Institute of Technology, Masaryk University, Czech Republic
- Abu Dhabi Stem Cells Center, United Arab Emirates
Figures
Figure 1
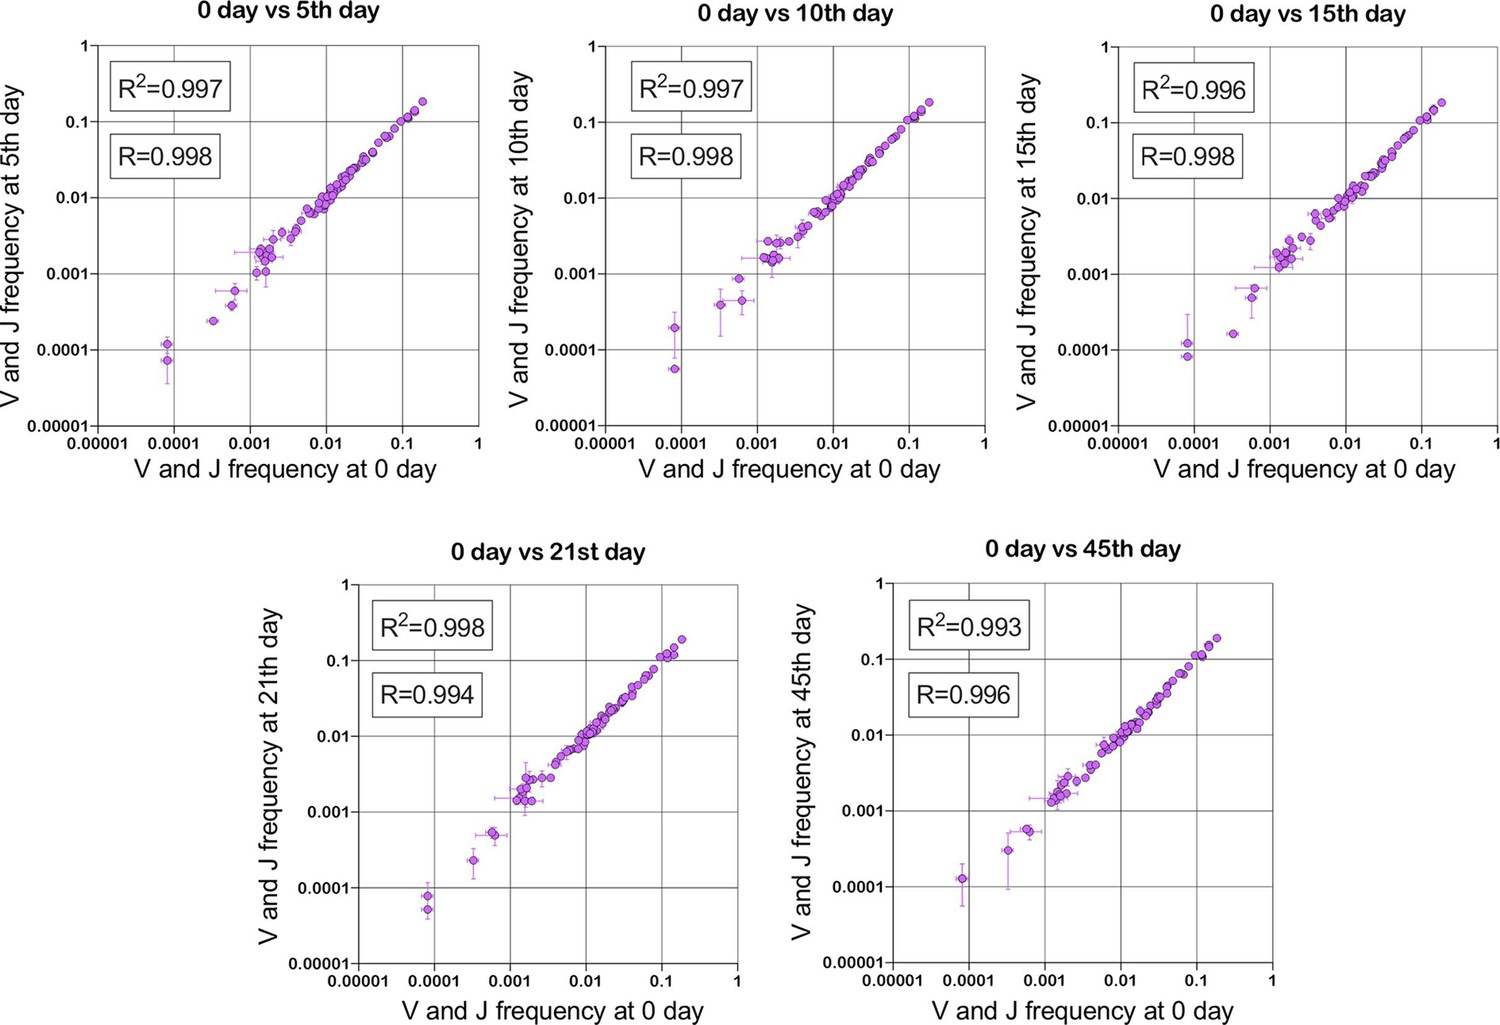
Stability of TRBV and TRBJ genes frequencies calculated based on unique out-of-frame rearrangements after Yellow fever vaccination (model of acute viral infection).
Out-of-frame clonotypes for frequencies calculation were extracted from low-biased 5’ Rapid Amplification of cDNA Ends (RACE) TRB repertoires of PBMC (peripheral blood mononuclear cells) samples obtained in two replicates for six time points: 0, 5, 10, 15, 21, and 45 d after YFV (Yellow Fever Vaccine) injection (donor M1, SRA accession number PRJNA577794 Minervina et al., 2020).
-
Figure 1—source data 1
XLSX table.
TRB V and J frequencies for plots in Figure 1.
- https://cdn.elifesciences.org/articles/69157/elife-69157-fig1-data1-v3.xlsx
Figure 2 with 1 supplement
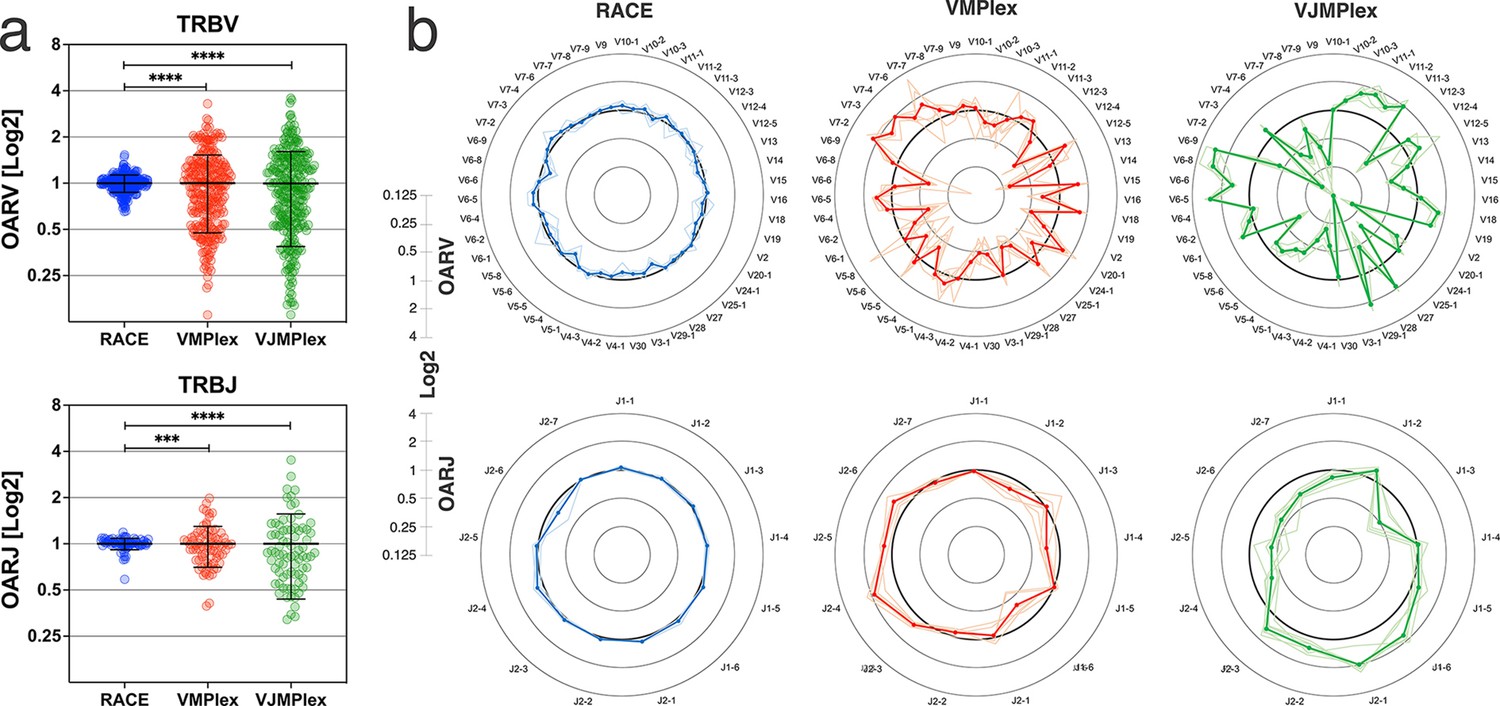
Dependence of the Over Amplification Rate on the TCR repertoire profiling method.
(a) Comparison of Over Amplification Rate (OAR) values variances for TRB repertoires obtained with 5’-Rapid Amplification of cDNA Ends (RACE), one-side multiplex (VMPlex), and two-side multiplex (VJMPlex) PCR. The Levene’s test was performed to compare OAR variances: ****p<0.0001 and ***p<0.001. The bar and whiskers indicate a mean and SD. (b) Average (bold lines) OAR values for TRBV and TRBJ genes in repertoires obtained with 5’-RACE, one-side multiplex (VMPlex), and two-side multiplex (VJMPlex) PCR. Pale lines illustrate OARs of individual repertoires. Datasets: six repertoires for RACE from PRJNA847436 (Sycheva et al., 2022), six repertoires for VMPlex from PRJNA427746 (Ma et al., 2018), and six repertoires for VJMPlex from 27483#.XpCuQ1MzZQI (zenodo.org; Weinberger et al., 2015).
-
Figure 2—source data 1
XLSX table.
Over Amplification Rate (OAR) values used for the plots in Figure 2.
- https://cdn.elifesciences.org/articles/69157/elife-69157-fig2-data1-v3.xlsx
Figure 2—figure supplement 1
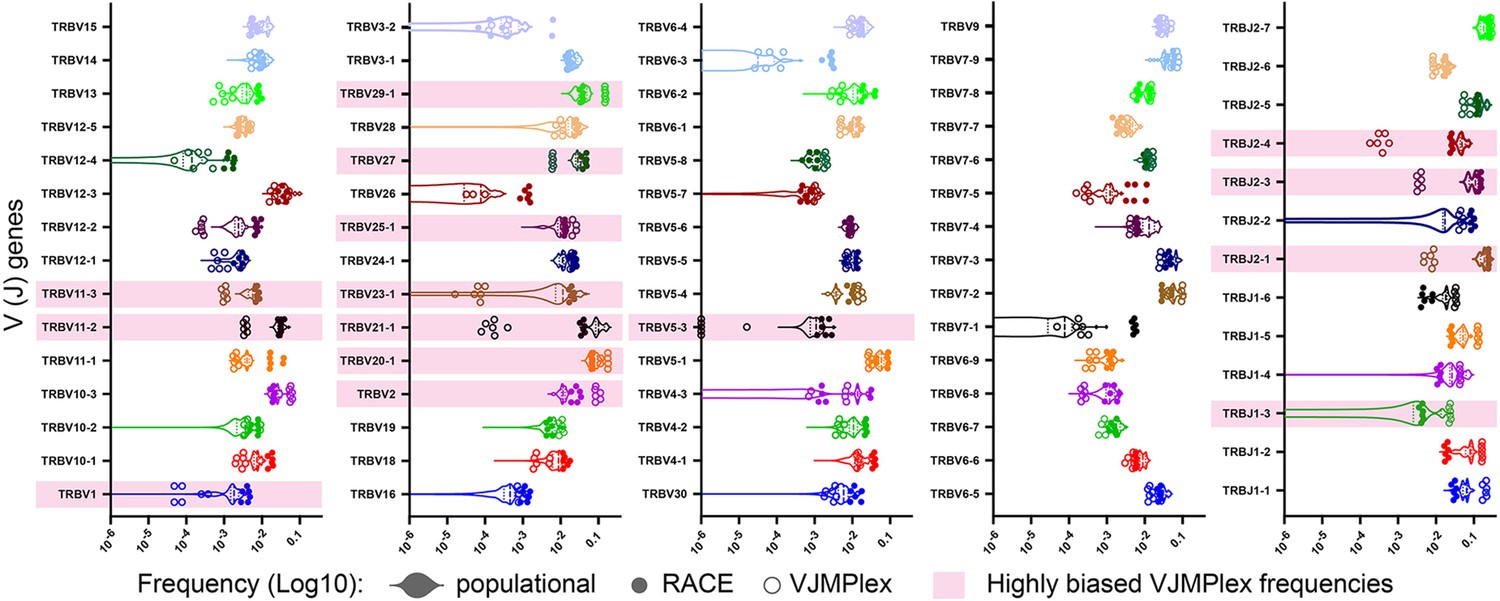
Comparison of population V/J segment frequencies with individual frequencies obtained using different TCR repertoire profiling methods.
V- and J-gene frequencies among unique out-of-frame rearrangements calculated using biased (two-side multiplex, empty circles) and low-biased (Rapid Amplification of cDNA Ends [RACE], filled circles) are compared to average population frequencies (violin plot). Significantly biased V- and J-genes are highlighted pink. Paired (the same starting RNA samples) two-side multiplex and RACE data: SRA accession number PRJNA309577, population frequencies were calculated using a series of RACE TCR and single-cell TCRseq data (see Supplementary file 1).
Figure 3
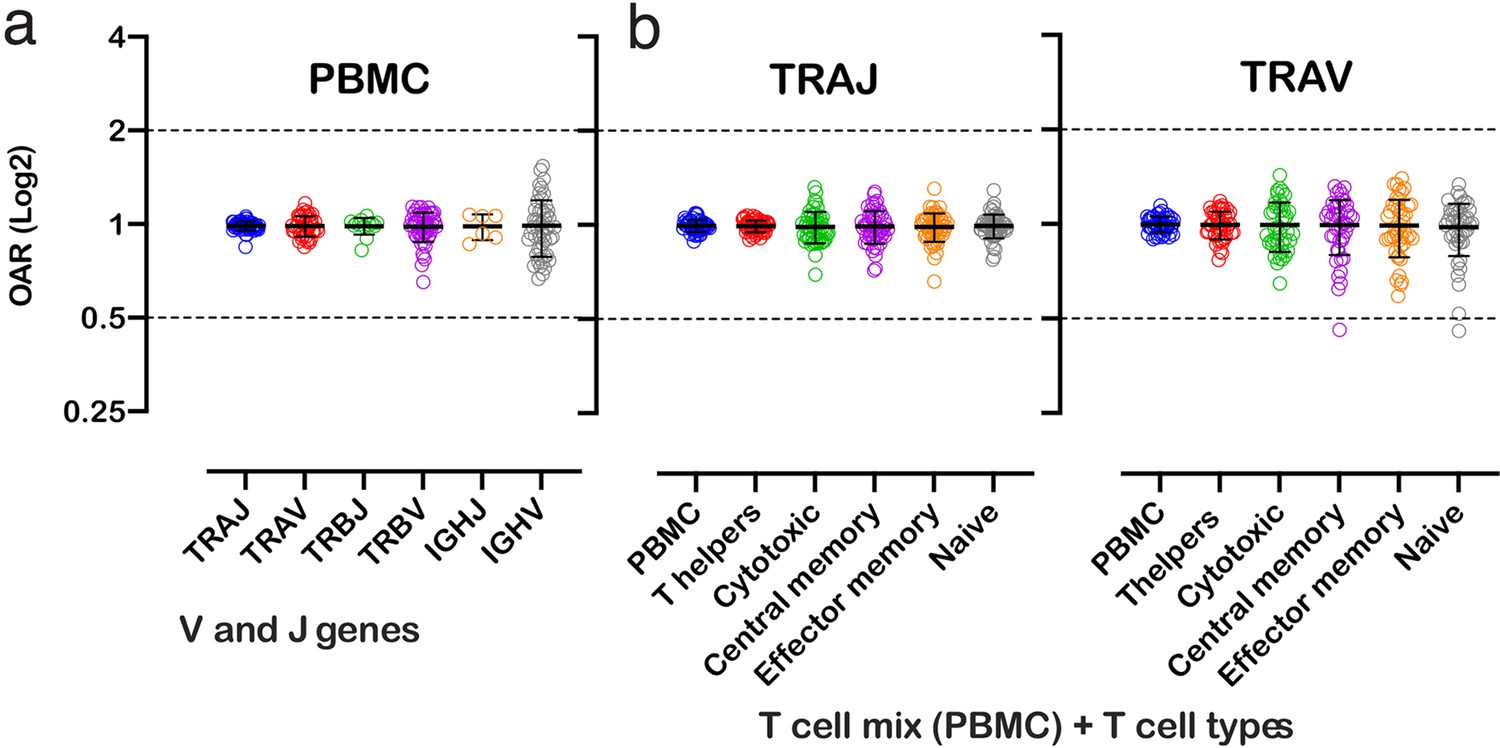
Over Amplification Rate of low-biased TCR and BCR repertoires in different lymphocyte subsets.
(a) Distribution of Over Amplification Rates of V- and J-genes in Rapid Amplification of cDNA Ends (RACE)-based repertoires of TCR and BCR (the empty dots represent average OARs among TCR repertoires: SRA accession numbers: PRJNA577794, PRJNA316572, PRJEB27352, and BCR repertoires: SRA accession number: PRJNA297771 and PRJNA494572). (b) Over Amplification Rates of V- and J-genes of TCR alpha chains in RACE-based repertoires of different types of T-cells (donors M1 and P30, 45 d after booster vaccination, SRA accession number PRJNA577794; Minervina et al., 2020). The bar and whiskers indicate a mean and SD.
-
Figure 3—source data 1
XLSX table.
Over Amplification Rate (OAR) values used for the plots in Figure 3.
- https://cdn.elifesciences.org/articles/69157/elife-69157-fig3-data1-v3.xlsx
Figure 4
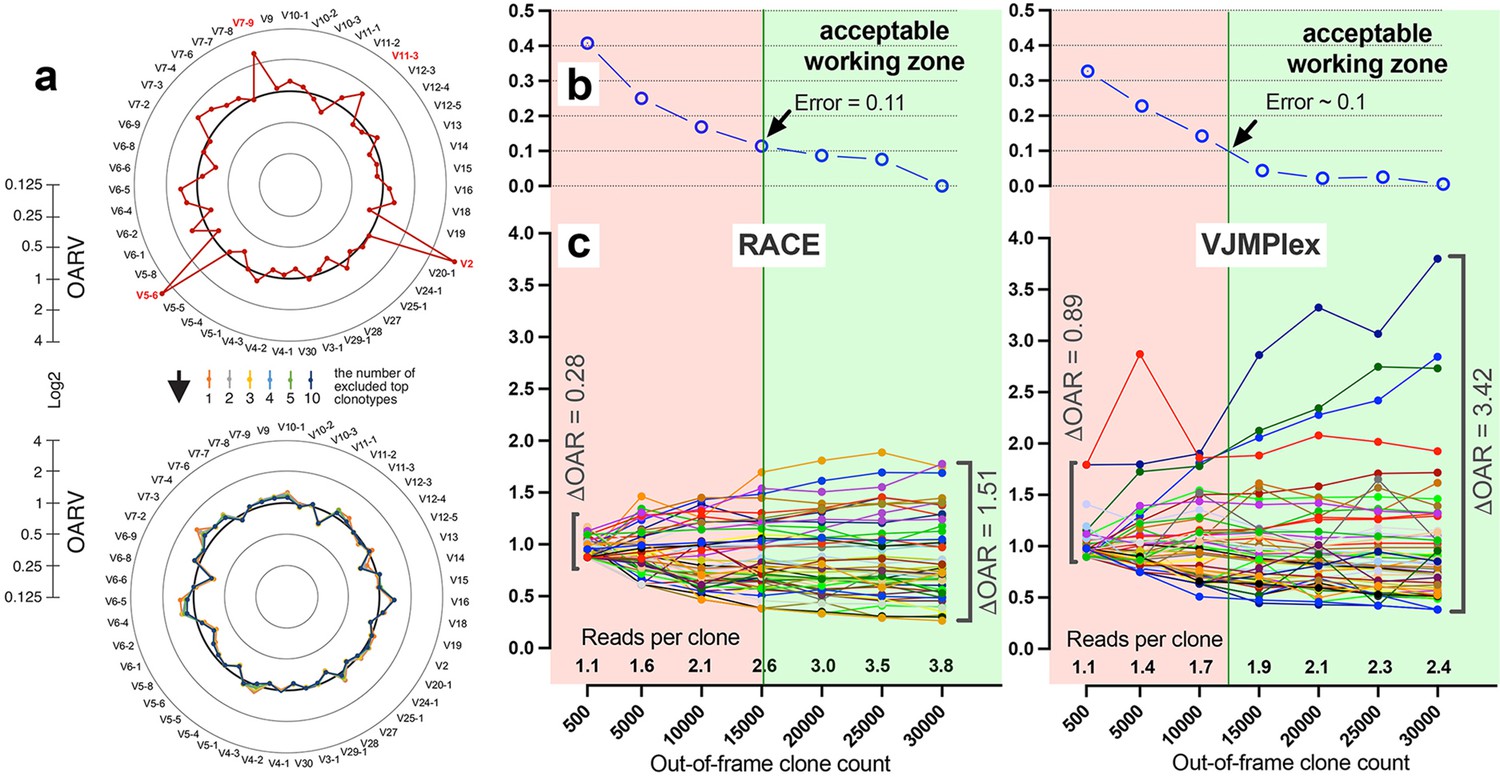
Factors impacting Over Amplification Rate (OAR) calculation accuracy.
(a) Impact of highly proliferated top non-functional clonotype on OAR calculation accuracy in low-biased Rapid Amplification of cDNA Ends (RACE)-based TRB repertoire (Data: SRR19594184). (b) Impact of sequencing depth on OARs calculation error. (c) PCR bias independent changes of TRB V-genes OARs as a function of sequencing depth. Data: two-sided multiplex-based TRB repertoire (Data: RACE - SRR3129976, VJMPlex – SRR3129972).
-
Figure 4—source data 1
XLSX table.
Over Amplification Rate (OAR) values used for the plots in Figure 4.
- https://cdn.elifesciences.org/articles/69157/elife-69157-fig4-data1-v3.xlsx
Figure 5
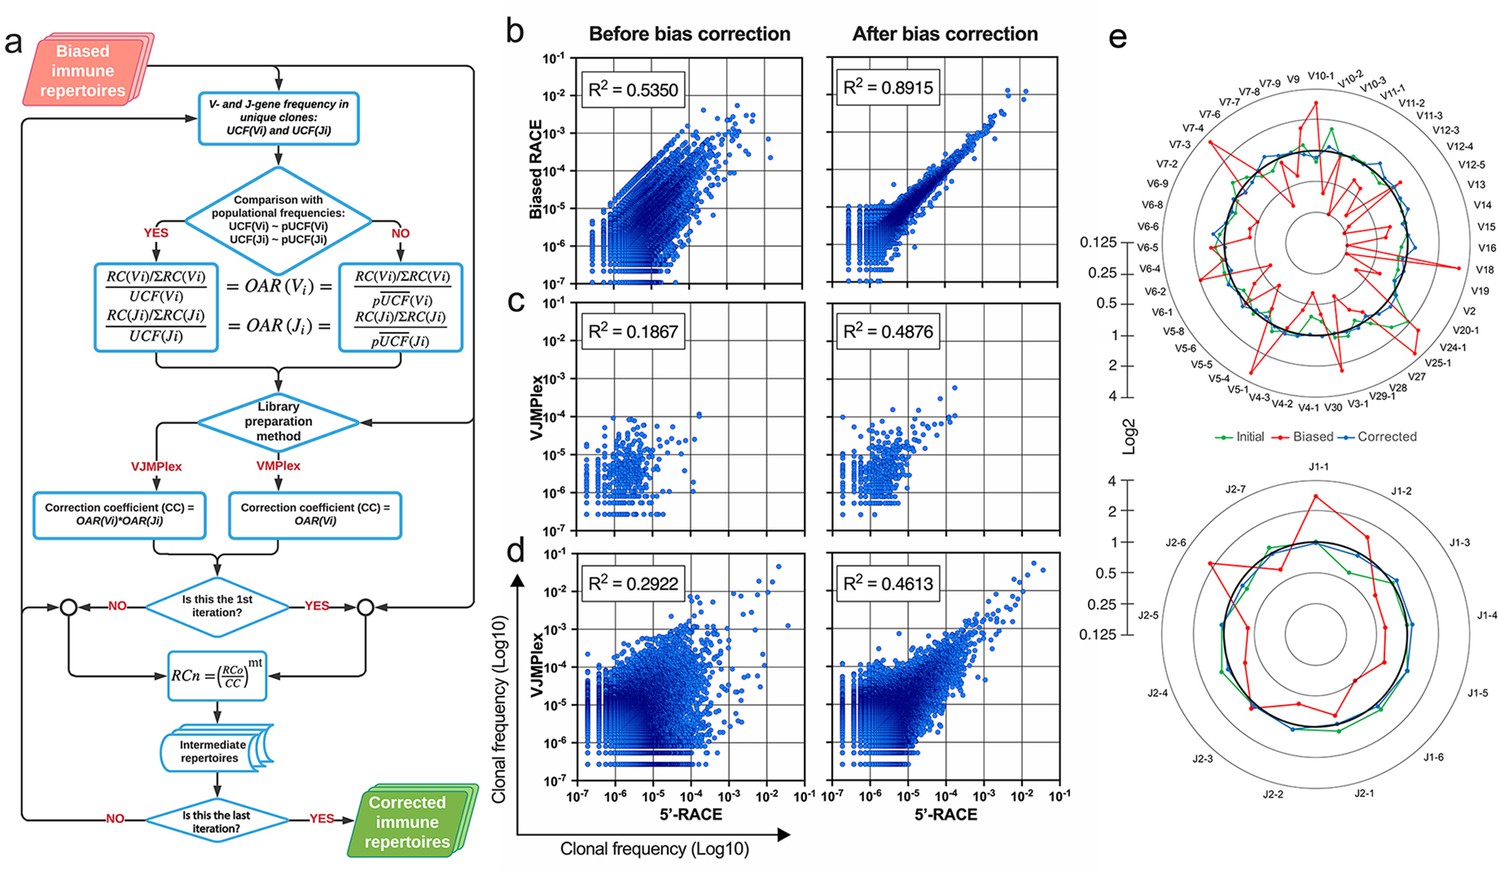
Implementation of OAR-based correction of quantitative bias in TCR repertoire.
(a) Flowchart of iROAR (immune Repertoire Over Amplification Removal) algorithm. UCF – Frequency calculated using unique clones counts (denominator of Over Amplification Rate [OAR]), pUCF – population UCF, RC – read count, RCn – normalized RC, RCo – observed RC, and mt – the number in the range from 0 to 1 for the iterative procedure. (b) Clone frequencies in the low biased 5’-Rapid Amplification of cDNA Ends (RACE)-based repertoire (ENA database, accession number ERR2869430) vs. the same repertoire with introduced artificial bias: before and after iROAR processing. (c) Out-of-frame (non-functional) clone frequencies in low biased 5’-RACE-based repertoire vs. two-side multiplex (VJMPlex)-based repertoire obtained for the same RNA sample (SRA database, accession numbers SRR3129976 and SRR3129972): before and after iROAR processing. (d) In-frame (functional) clone frequencies in low biased 5’-RACE-based repertoire vs. two-side multiplex (VJMPlex)-based repertoire obtained for the same RNA sample: before and after iROAR processing. SRA database, accession numbers SRR3129976 and SRR3129970. R2 is the squared Pearson correlation coefficient. iROAR was applied only for biased repertoires: artificially biased RACE and VJMPlex. (e) OARV and OARJ of test 5’-RACE-based TRB repertoire (b) before artificial bias introduction (green dots and line), biased one (red dots and line) and corrected one by iROAR (blue dots and line).
-
Figure 5—source data 1
XLSX table.
Clonal frequencies used for the plots in Figure 5.
- https://cdn.elifesciences.org/articles/69157/elife-69157-fig5-data1-v3.xlsx
Figure 6
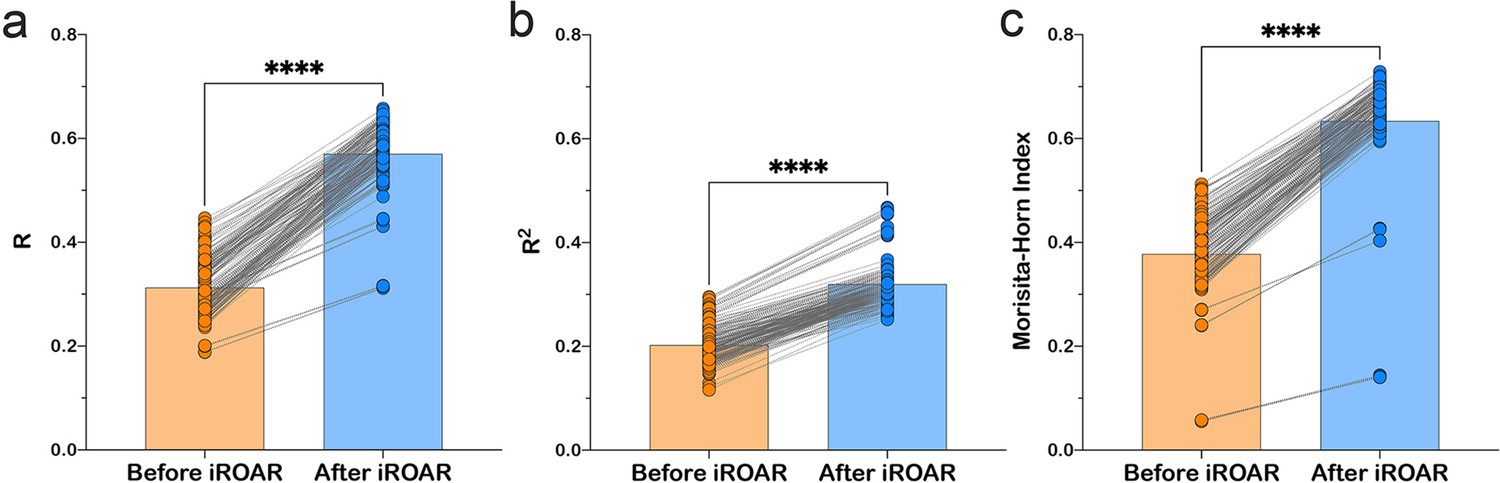
Effect of iROAR (immune Repertoire Over Amplification Removal)-based PCR bias correction in MPlex repertoire on similarity with low-biased Rapid Amplification of cDNA Ends (RACE)-based repertoire obtained from the same RNA sample.
(a) Pearson correlation coefficient; (b) R2 measure; (c) Morisita-Horn similarity index. **** p<0.0001 (two-tailed Wilcoxon matched-pairs signed rank test, CI = 0.95). Dataset: PRJNA548335 three different RACE (RACE-2, RACE-3, and RACE-4 in six replicates each) protocols vs. RNA-based MPlex (Multiplex-3) protocol for Donor1 and Donor2 (100 ng RNA input): total 36 points; PRJNA309577 (one RACE protocol vs. one MPlex protocol) for Donors S01 (four MPlex replicates vs. two RACE replicates), S02 (two MPlex replicates vs. four RACE replicates), and donor S03 (one MPlex replicate vs. one RACE replicate): total 17 points.
-
Figure 6—source data 1
XLSX table.
Pearson R, R2, and Morisita-Horn index values used for the plots in Figure 6.
- https://cdn.elifesciences.org/articles/69157/elife-69157-fig6-data1-v3.xlsx
Figure 7
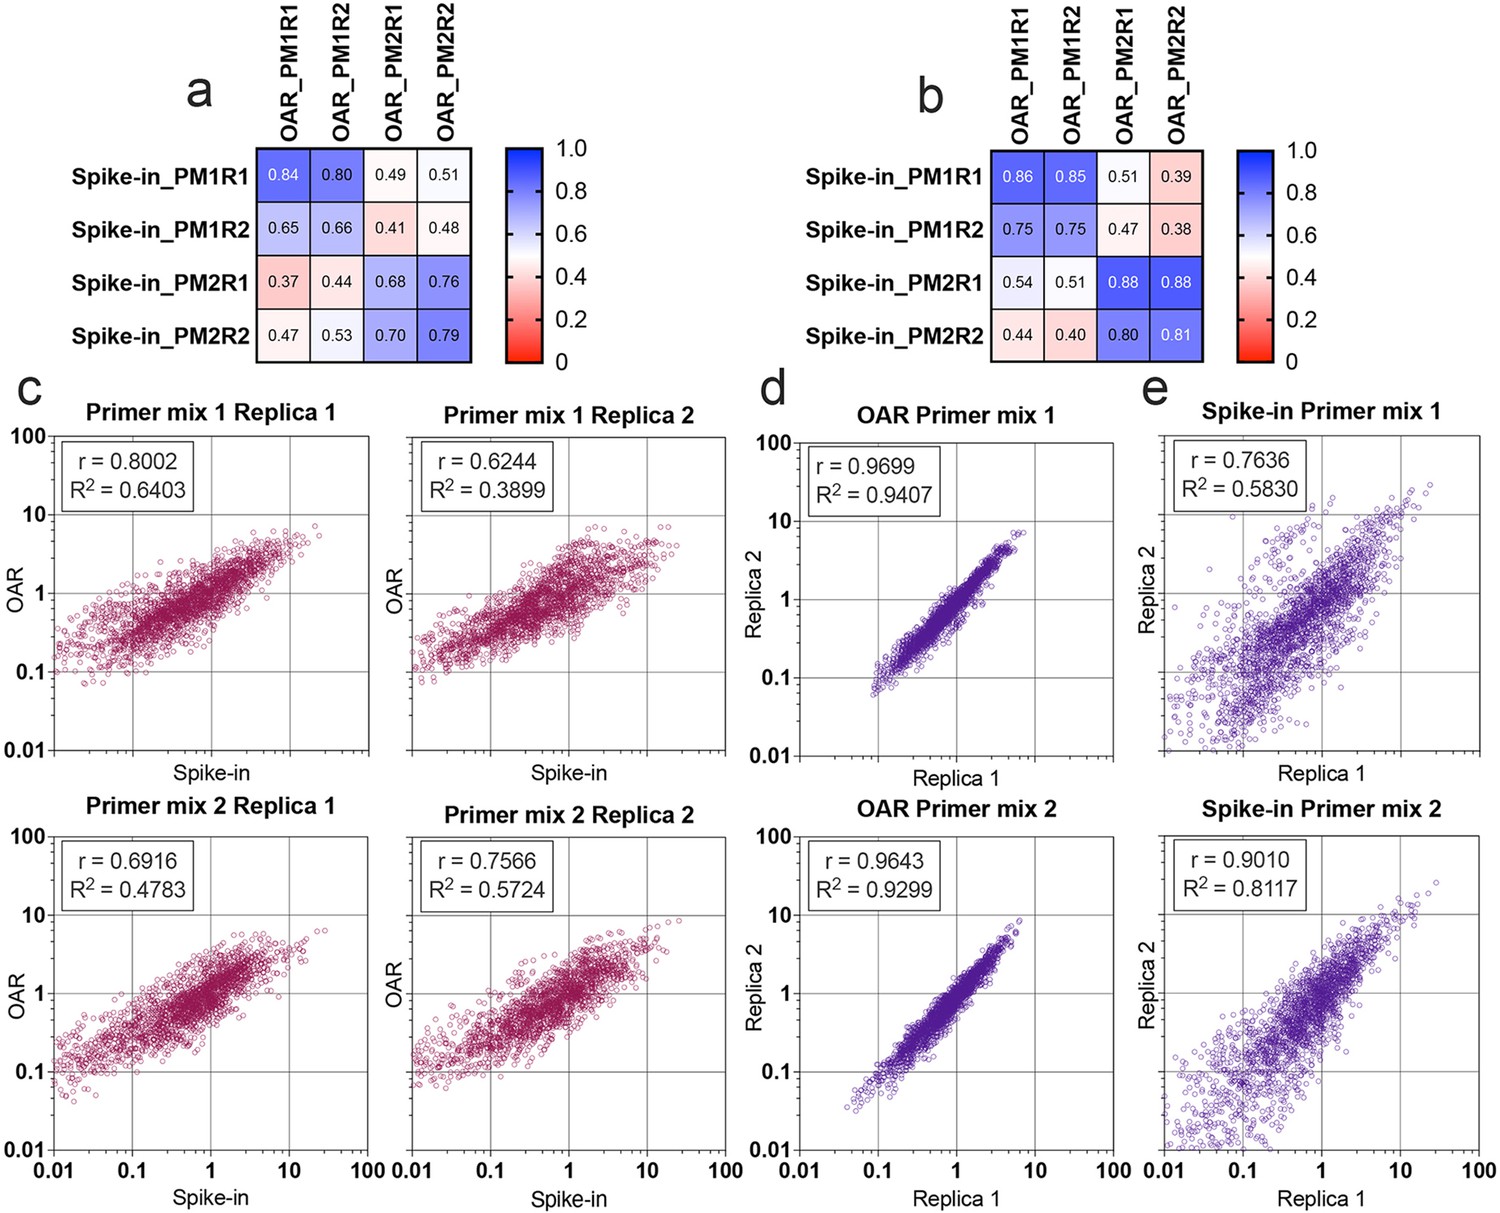
Comparison of Over Amplification Rate (OAR)-based and biological spike-in-based approaches for multiplex PCR bias detection.
Pearson’s correlation coefficient for V-segments bias measure (a) and J-segments bias measure (b). Column and row titles: PM = Primer mix, R=replica. (c) Correlation of VJ combination bias calculated by iROAR (immune Repertoire Over Amplification Removal) and biological spike-ins. (d) Reproducibility of iROAR-based VJ combination bias detection. (e) Reproducibility of spike-in-based VJ combination bias detection. Data: PRJNA825832.
-
Figure 7—source data 1
XLSX table.
iROAR (immune Repertoire Over Amplification Removal)-based and spike-in-based PCR bias measures used for the plots in Figure 7.
- https://cdn.elifesciences.org/articles/69157/elife-69157-fig7-data1-v3.xlsx
Figure 8
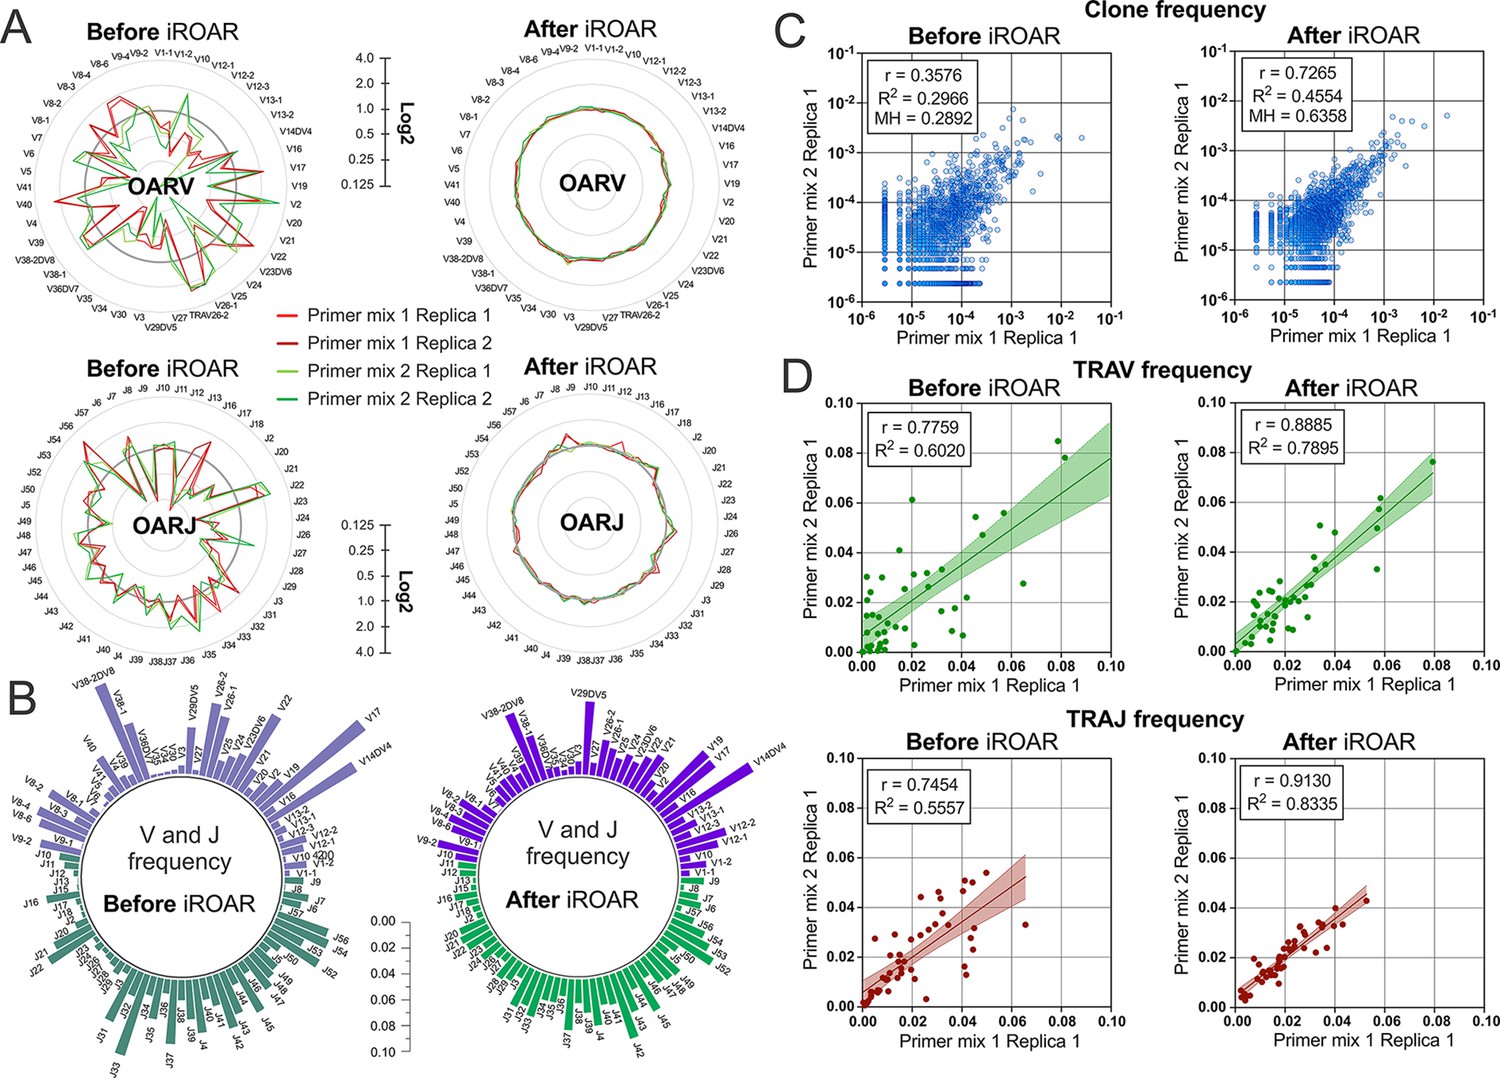
Convergence of Over Amplification Rate (OAR), clonotype, and V/J frequencies between two TRA repertoire before and after iROAR (immune Repertoire Over Amplification Removal) based bias correction.
(a) OAR values changes in four test TRA libraries after PCR bias correction using iROAR. (b) TRAV and TRAJ frequency changes after PCR bias correction using iROAR (Sample: Primer mix 1 Replica 1). (c) Correlation of clonal frequencies of two different types of test TRA repertoires before and after iROAR-based PCR bias correction. (d) Correlation of V- and J-gene frequencies of test TRA repertoires before and after iROAR-based PCR bias correction.
-
Figure 8—source data 1
XLSX table.
Clonal frequencies, TRB V and J frequencies and Over Amplification Rate (OAR) values used for the plots in Figure 8.
- https://cdn.elifesciences.org/articles/69157/elife-69157-fig8-data1-v3.xlsx
Tables
Table 1
The number of spike-in and target clonotypes in test TRA libraries.
| Sample | Spike-in clonotypes | Target clonotypes | ||||
|---|---|---|---|---|---|---|
| Number | Read count | Coverage | Number | Read count | Coverage | |
| Primer mix 1 Replica 1 | 3571 | 30,474 | 8.53 | 39,911 | 348,792 | 8.74 |
| Primer mix 1 Replica 2 | 2698 | 19,420 | 7.20 | 35,818 | 303,494 | 8.47 |
| Primer mix 2 Replica 1 | 3439 | 34,717 | 10.10 | 40,209 | 425,508 | 10.58 |
| Primer mix 2 Replica 2 | 2298 | 24,823 | 10.80 | 33,406 | 383,615 | 11.48 |
Additional files
-
Supplementary file 1
XLSX table.
Dataset accession numbers and references to the original studies generated it.
- https://cdn.elifesciences.org/articles/69157/elife-69157-supp1-v3.xlsx
-
Supplementary file 2
XLSX table.
Comparison of iROAR (immune Repertoire Over Amplification Removal) algorithm with the existing approaches for PCR bias removal in human adaptive immune receptor repertoires.
- https://cdn.elifesciences.org/articles/69157/elife-69157-supp2-v3.xlsx
-
Transparent reporting form
- https://cdn.elifesciences.org/articles/69157/elife-69157-transrepform1-v3.docx
Download links
A two-part list of links to download the article, or parts of the article, in various formats.
Downloads (link to download the article as PDF)
Open citations (links to open the citations from this article in various online reference manager services)
Cite this article (links to download the citations from this article in formats compatible with various reference manager tools)
The use of non-functional clonotypes as a natural calibrator for quantitative bias correction in adaptive immune receptor repertoire profiling
eLife 12:e69157.
https://doi.org/10.7554/eLife.69157


