Identification of neural progenitor cells and their progeny reveals long distance migration in the developing octopus brain
- Laboratory of Developmental Neurobiology, Department of Biology, KU Leuven, Belgium
- Department of Biology and Evolution of Marine Organisms, Stazione Zoologica Anton Dohrn, Italy
- Center for Human Genetics, Genomics Core, UZ-KU Leuven, Belgium
- Centre for Sustainable Tropical Fisheries and Aquaculture, College of Science and Engineering, James Cook University, Australia
- Laboratory of Biodiversity and Evolutionary Genomics, Department of Biology, KU Leuven, Belgium
Figures
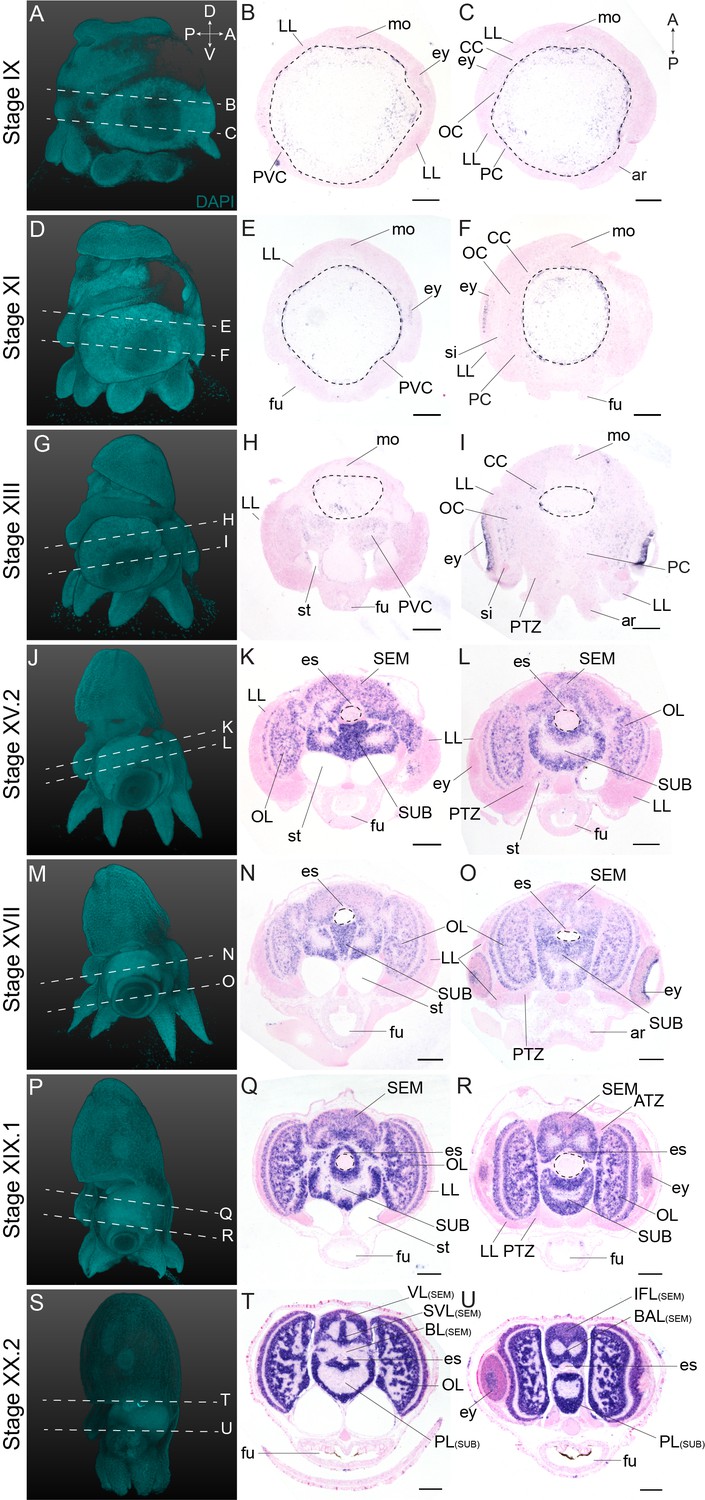
Figure 1
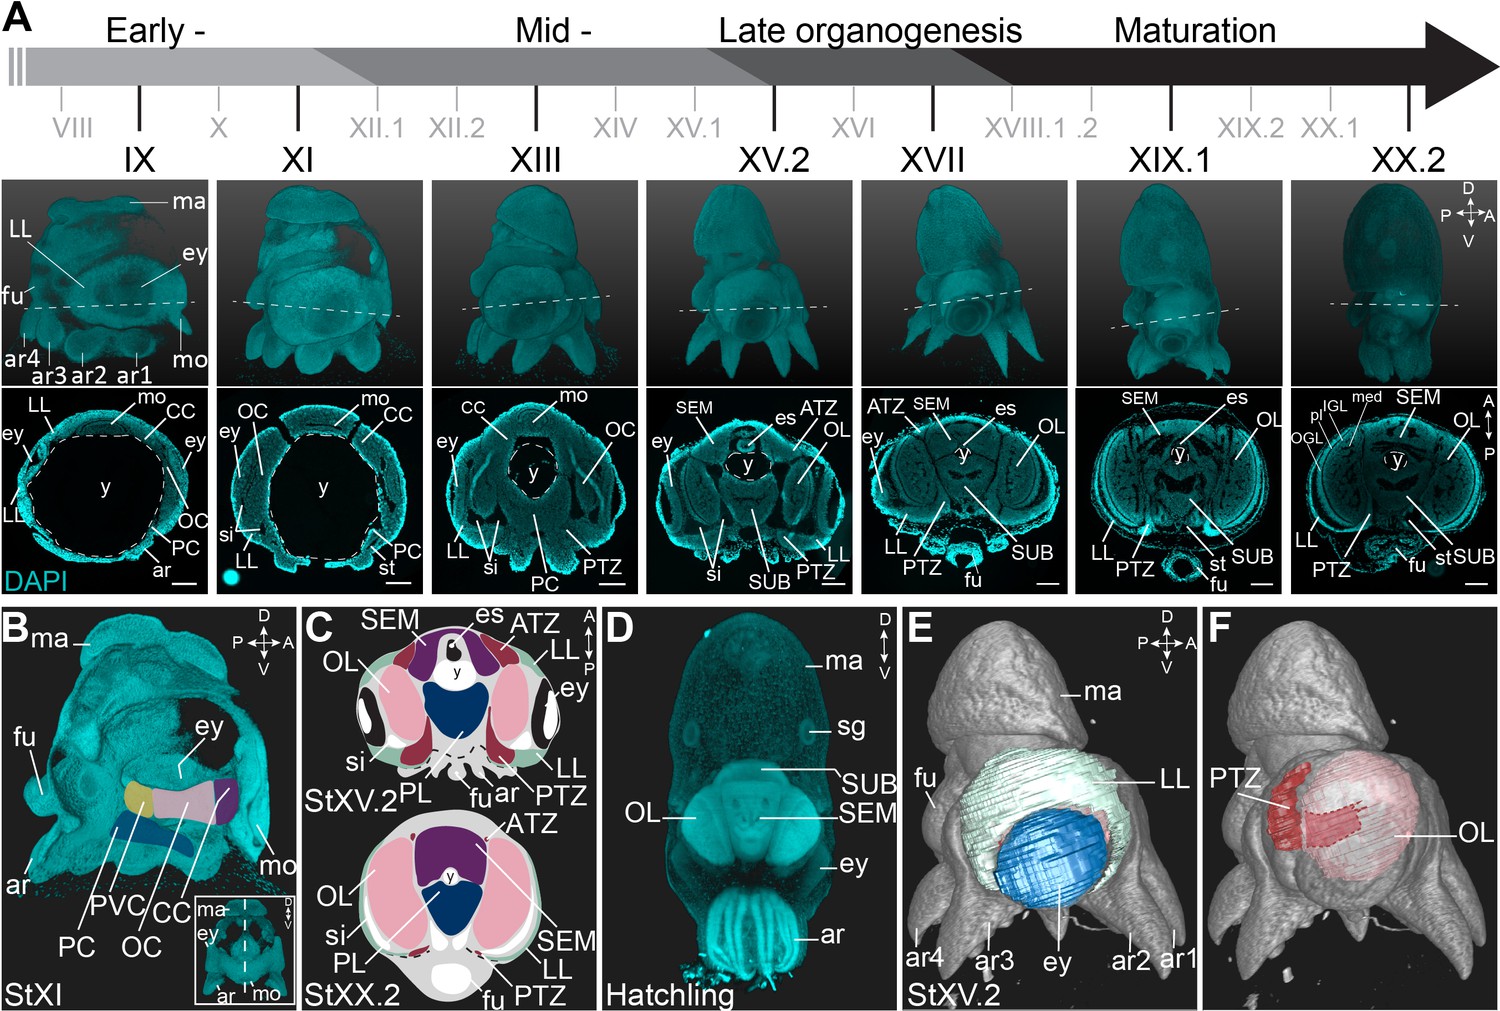
Overview of the developing O. vulgaris embryo and its nervous system.
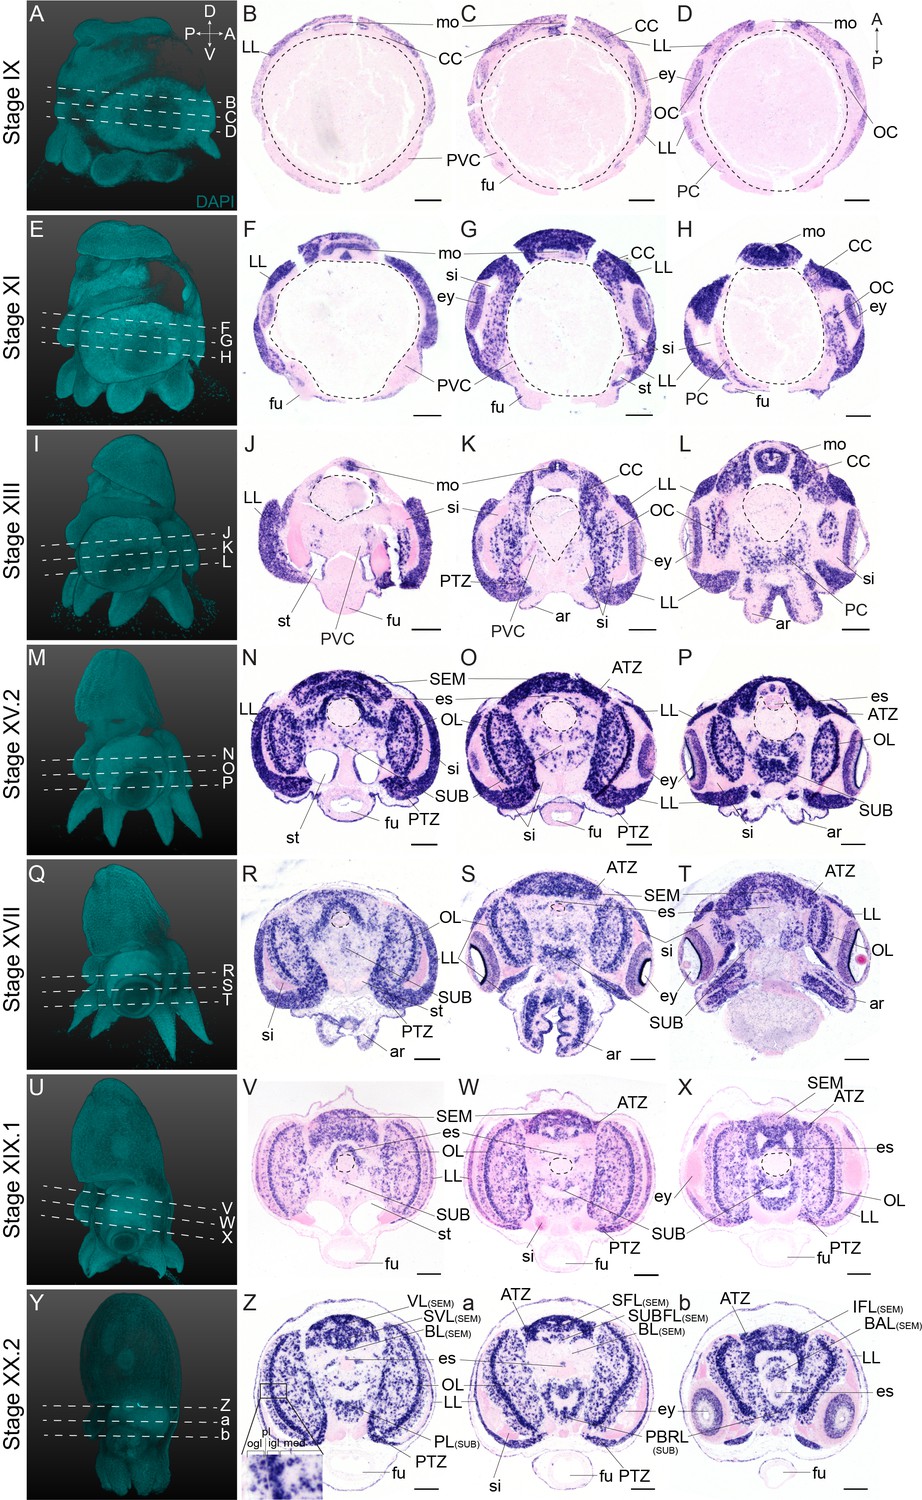
(A) Overview of O. vulgaris embryonic development from Stage IX to Stage XX.2, covering early-, mid-, and late- organogenesis events and maturation. Surface renderings after DAPI staining are shown in the upper panels (lateral view, dorsal side up) and representative transversal sections in the lower panels (anterior side up). The OCs that give rise to the OLs develop medially from the eye primordia. The CC that generates the SEM develops next to the external mouth and the PC and PVC that give rise to the SUB develop on the posterior side. The dashed lines on the surface renderings indicate the sectioning plane of the transversal sections. Scale bars represent 100 μm. (B) Surface rendering after DAPI staining at Stage XI, showing that the central brain cords are connected and encircle the yolk. Prospective cords are pseudo-colored: CC in purple, OC in pink, PVC in yellow and PC in blue. (C) Schematic of the octopus head region late-organogenesis and at hatching (ATZ and PTZ in red, LL in mint green, OL in pink, SEM in purple, PL of the SUB in blue). (D) Maximum projection after DAPI staining of a hatchling showing the densely nucleated central brain from the anterior side. (E-F) 3D reconstruction of the eye (blue), LL (mint green), OL (pink), and the PTZ (red) in a Stage XV.2 embryo (DAPI in gray). A, anterior; ar, arm; ATZ, anterior transition zone; CC, cerebral cord; D, dorsal; es, esophagus; ey, eye; fu, funnel; IGL, inner granular layer; LL, lateral lips; ma, mantle; med, medulla; mo, mouth; OC, optic cord; OGL, outer granular layer; OL, optic lobe; P, posterior; PC, pedal cord; pl, plexiform layer; PL, pedal lobe; PTZ, posterior transition zone; PVC, palliovisceral cord; PVL, palliovisceral lobe; SEM, supraesophageal mass; sg, stellate ganglion; si, sinus ophthalmicus; st, statocyst; SUB, subesophageal mass; V, ventral; y, yolk.
Figure 2 with 3 supplements
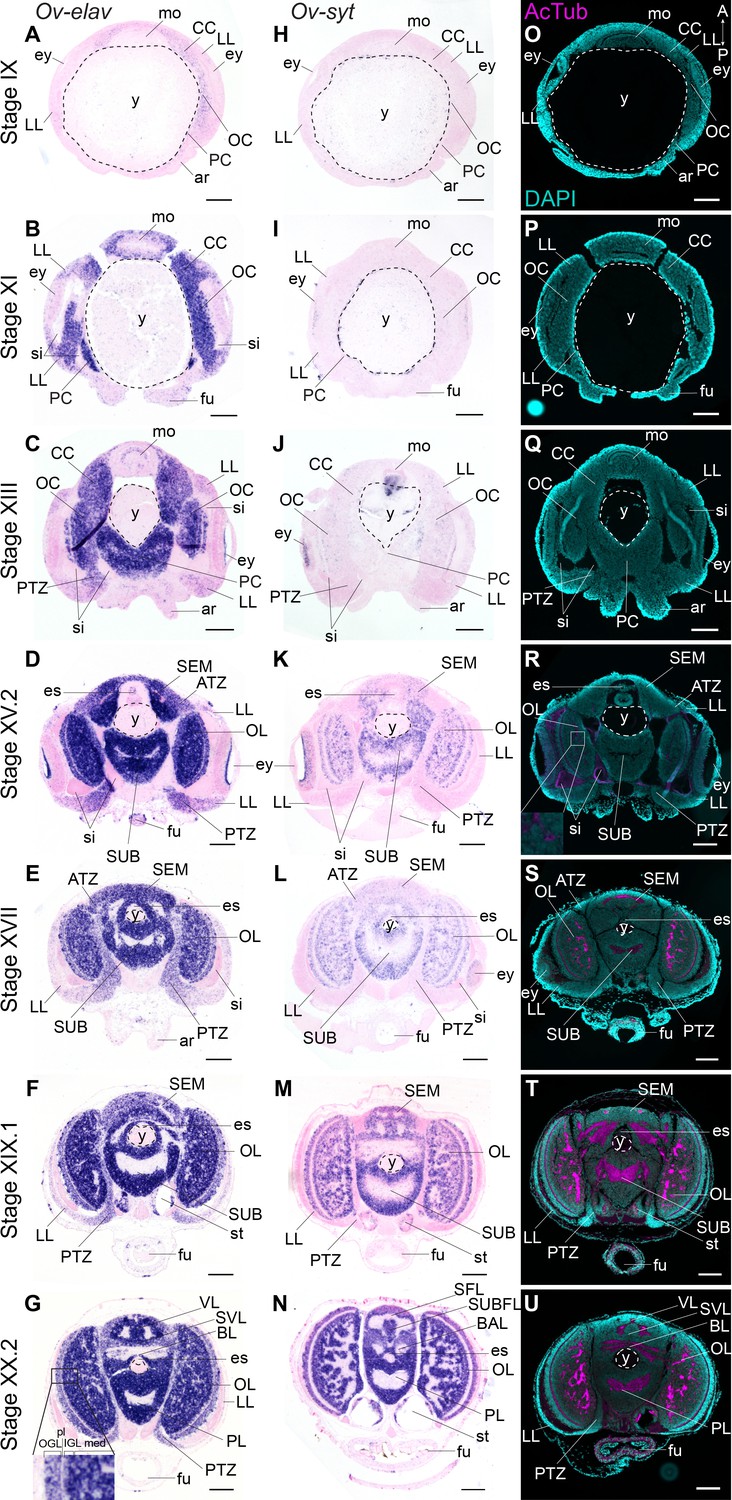
Formation of the O. vulgaris brain.
In situ hybridization of Ov-elav (left column) and Ov-syt (middle column) and immunoreactivity against acetylated alpha tubulin (right column) on transversal sections of embryos at Stage IX, XI, XIII, XV.2, XVII, XIX.1, and XX.2 with anterior up and posterior down. (A-G) Ov-elav expression levels are clearly elevated from Stage XI onwards and are generally highest in the developing brain cords and central brain masses, intermediate in the transition zones and low in the lateral lips. (H-N) Ov-syt can be detected first in the retina at Stage XI and in the outer layers of the optic cord at Stage XIII. From Stage XV.2 onwards, transcripts are present in all brain masses. (O-U) Acetylated alpha-tubulin is present in the optic lobes from Stage XV.2 onwards (low level, magnified box) and in the supra- and subesophageal masses from Stage XVII onwards. See Figure 2—figure supplement 1 for phylogenetic reconstruction of Ov-elav and Figure 2—figure supplements 2 and 3 for complementary panels of Ov-elav and Ov-syt expression. Scale bars represent 100 μm. A, anterior; ar, arm; ATZ, anterior transition zone; BAL, buccal lobe; BL, basal lobe; CC, cerebral cord; es, esophagus; ey, eye; fu, funnel; IFL, inferior frontal lobe; igl, inner granular layer; LL, lateral lips; med, medulla; mo, mouth; OC, optic cord; ogl, outer granular layer; OL, optic lobe; P, posterior; PC, pedal cord; pl, plexiform layer; PL, pedal lobe; PTZ, posterior transition zone; SEM, supraesophageal mass; SFL, superior frontal lobe; sg, stellate ganglion; si, sinus ophthalmicus; st, statocyst; SUB, subesophageal mass; SUBFL, subfrontal lobe; SVL, subvertical lobe; VL, vertical lobe; y, yolk.
Figure 2—figure supplement 1
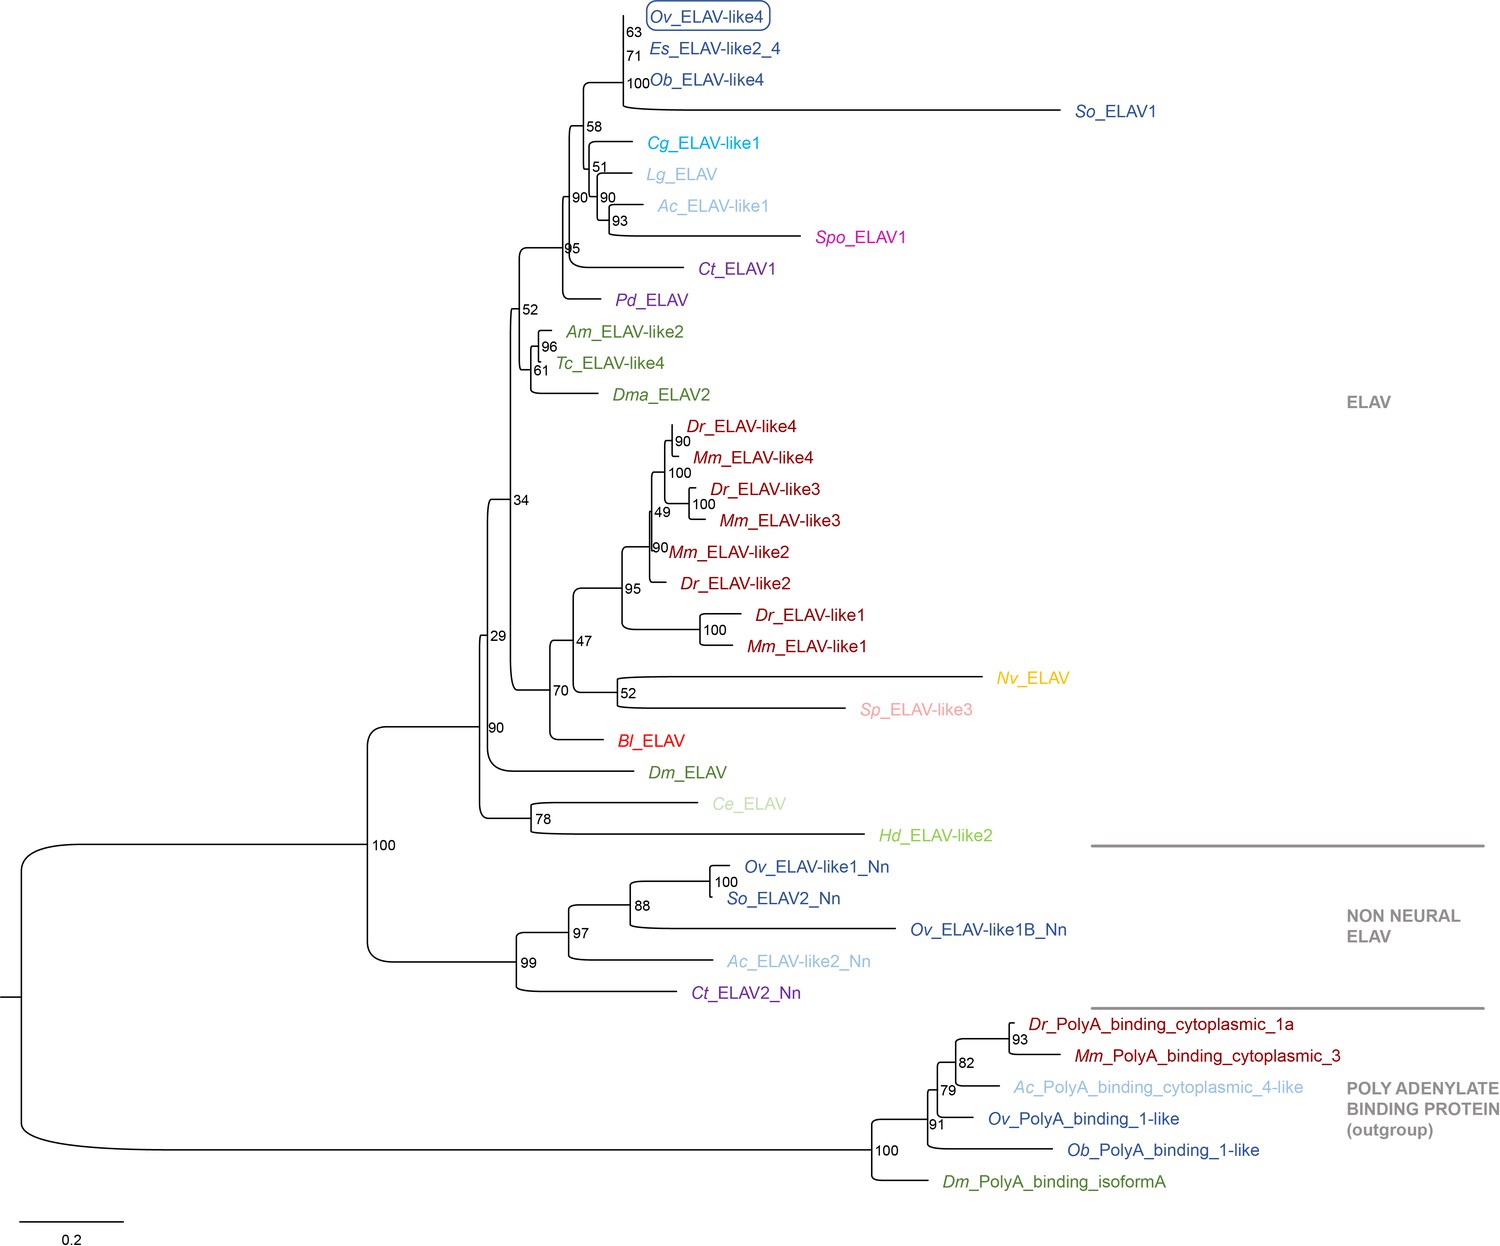
Phylogeny Ov-ELAV.
Phylogenetic analysis of ELAV and ELAV-like proteins shown in a maximum likelihood tree. Numbers at each branch represent bootstrap support values. The tree has been rooted using the RNA binding protein Poly(A)-binding protein as outgroup. While vertebrates have four (or more) neural ELAV genes, invertebrates have only a single one. Lophotrochozoa and cnidaria, but not deuterostomia possess additional non-neural ELAV-like genes (Nn). The O. vulgaris ID used for subsequent ISH probe design is framed in blue. The scale bar represents the number of amino acid substitutes per site. Deuterostomes are in red, mollusks in blue, other Lophotrochozoa in purple, Ecdysozoa in green and Cnidaria in yellow. See Supplementary file 5 for accession numbers and Supplementary file 6 for O. vulgaris protein sequences. Ac, Aplysia californica; Am, Apis mellifera; Bl, Branchiostoma lanceolatum; Ce, Caenorhabditis elegans; Cg, Crassostrea gigas; Ct, Capitella teleta; Dm, Drosophila melanogaster; Dma, Daphnia magna; Dr, Danio rerio; Es, Euprymna scolopes; Hd, Hybsibius dujardini; Lg, Lottia gigantea; Mm, Mus musculus; Nv, Nematostella vectensis; Ob, Octopus bimaculoides; Ov, Octopus vulgaris; Pd, Platynereis dumerilii; So, Sepia officinalis; Sp, Strongylocentrotus purpuratus; Spo, Schmidtea polychroa; Tc, Tribolium castaneum.
Figure 2—figure supplement 2
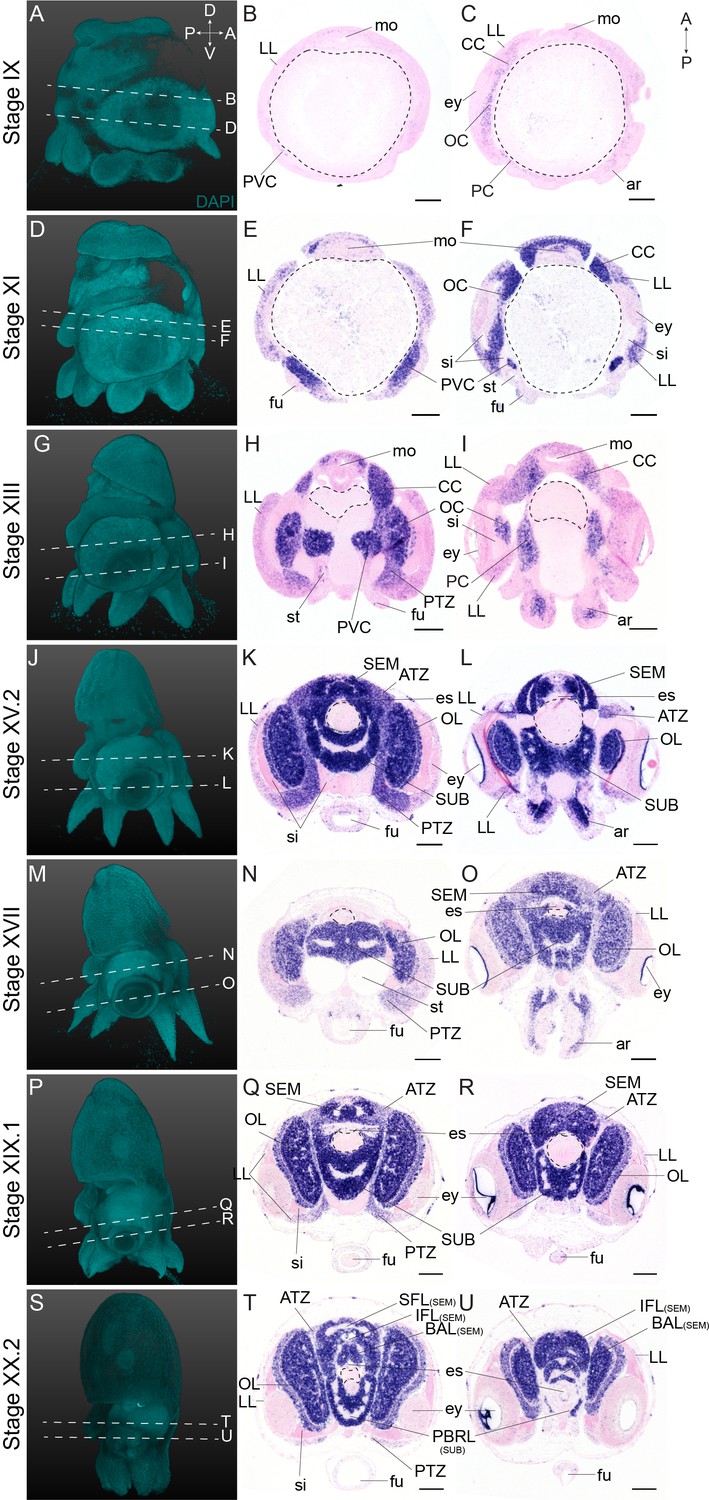
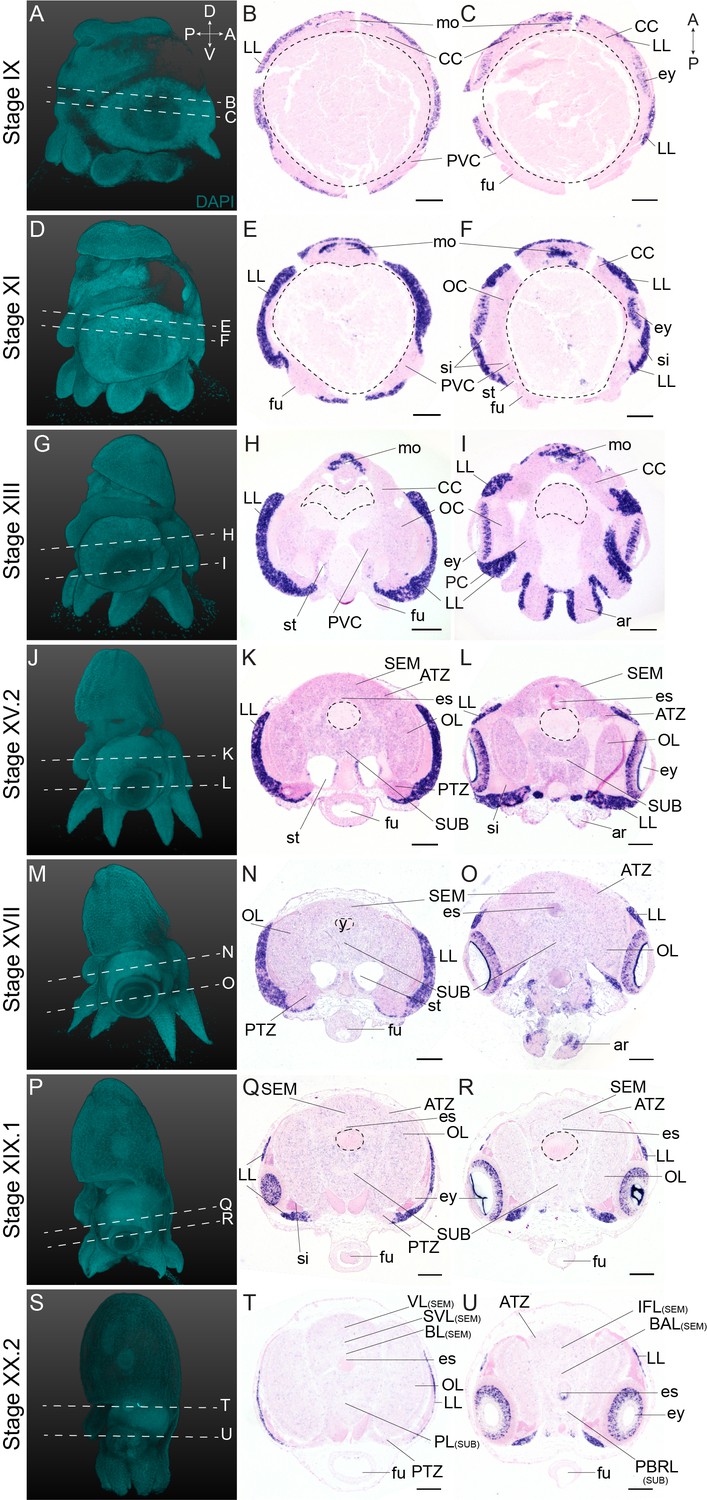
Complementary panels to Figure 2 of Ov-elav expression in the head region of developing O. vulgaris embryos.
Panels on the left show representative 3D reconstructions of embryos seen from the lateral side, stained with DAPI. White dashed lines indicate the sectioning plane in respect to the dorsoventral axis. Panels in the two right columns show in situ hybridization of Ov-elav on paraffin sections in embryos at Stage IX, XI, XIII, XV.2, XVII, XIX.1, and XX.2, with anterior up and posterior down. Abbreviations as in Figure 2.
Figure 2—figure supplement 3
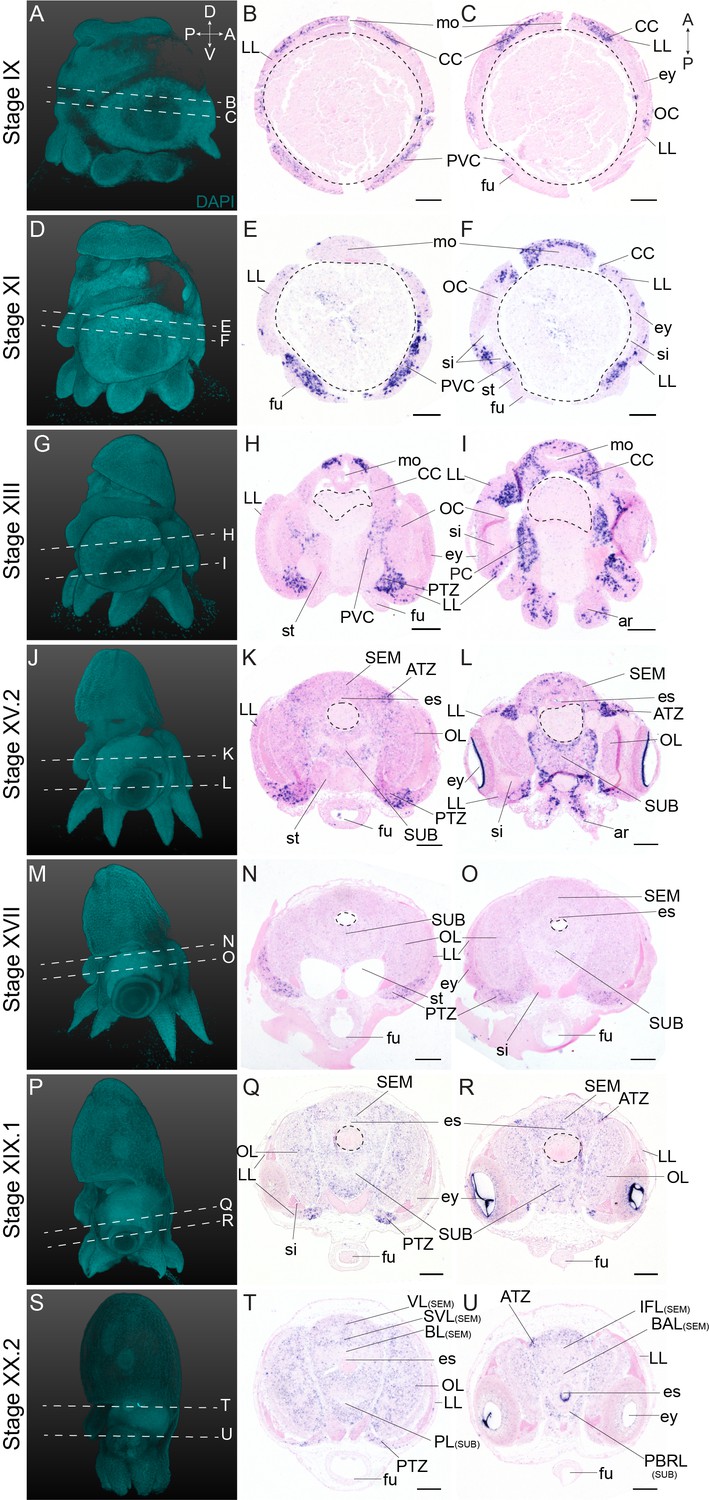
Complementary panels to Figure 2 of Ov-syt expression in the head region of developing O. vulgaris embryos.
Panels on the left show representative 3D reconstructions of embryos seen from the lateral side, stained with DAPI. White dashed lines indicate the sectioning plane in respect to the dorsoventral axis. Panels in the two right columns show in situ hybridization of Ov-syt on paraffin sections in embryos at Stage IX, XI, XIII, XV.2, XVII, XIX.1, and XX.2, with anterior up and posterior down. Abbreviations as in Figure 2.
Figure 3
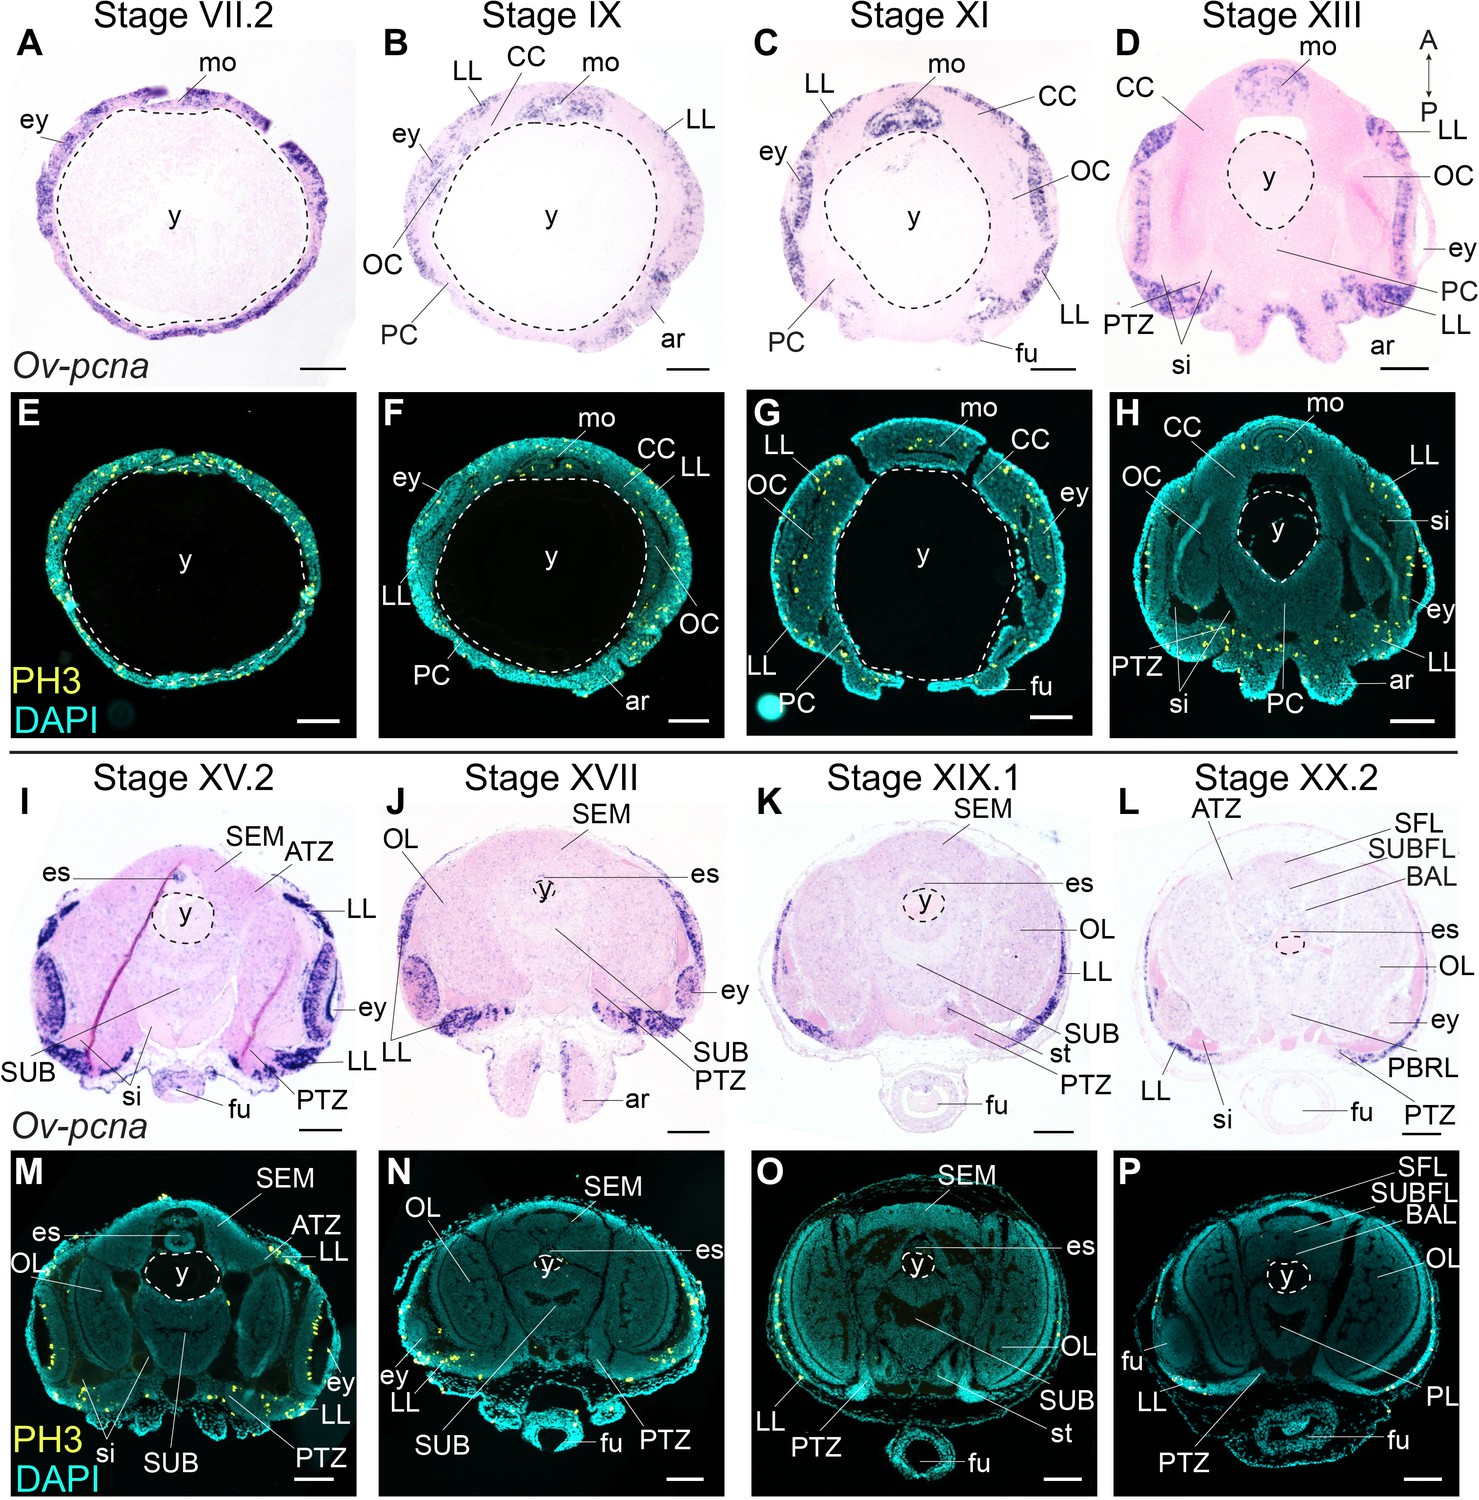
Cell division in the developing O. vulgaris embryo.
Expression of Ov-pcna (upper panels) and immunoreactivity against PH3 (lower panels) from Stage VII.2 to Stage XX.2. (A-D, I-L) Ov-pcna expression is broad at Stages VII.2 and IX and gets restricted to the lateral lips, mouth region and retina at subsequent stages. (E-H, M-P) Similarly, PH3-positive cells are abundant in the lateral lips, in the mouth region and on apical side in the retina. Very few cells in the developing central brain are PH3 positive or express Ov-pcna. Scale bars represent 100 μm. Abbreviations as in Figure 2; PBRL, prebrachial lobe.
Figure 4 with 7 supplements
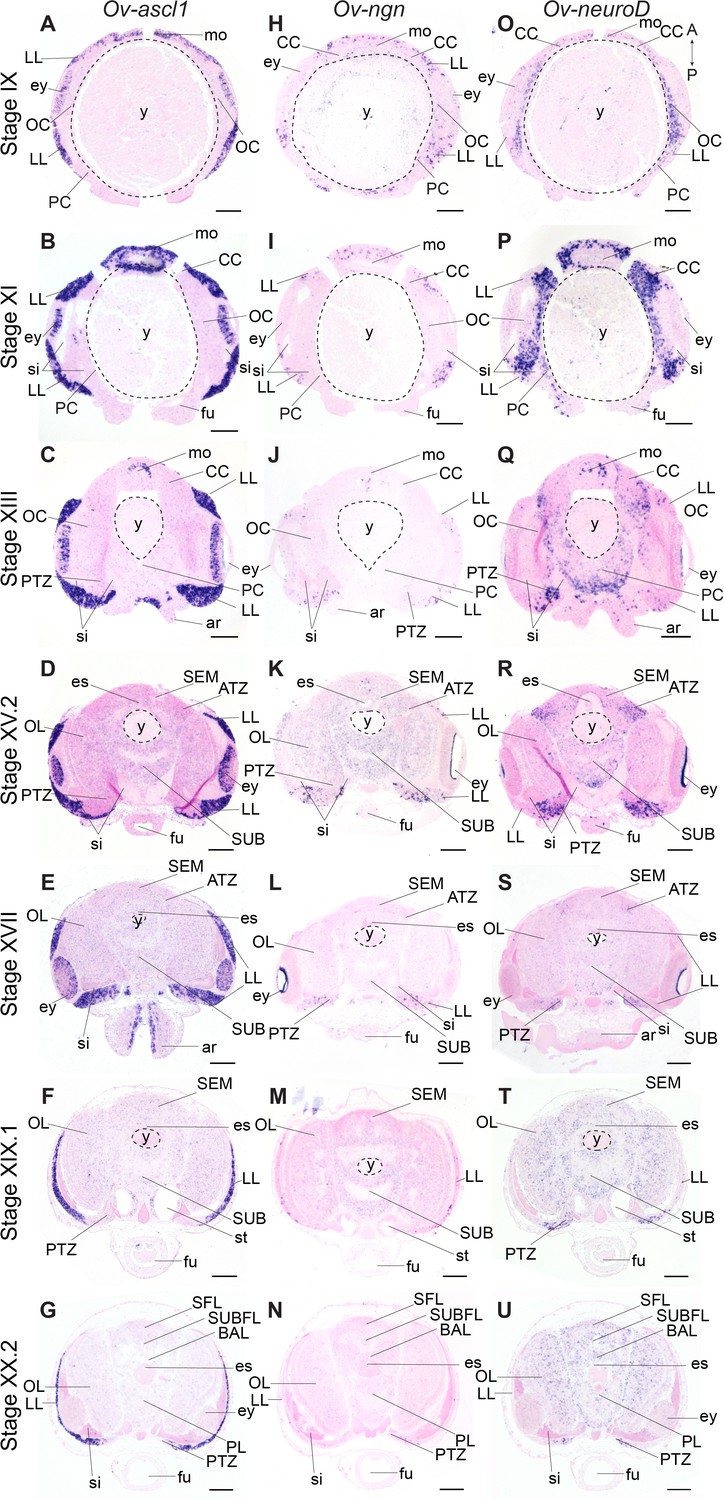
Expression of O. vulgaris proneuronal and neuronal differentiation bHLH genes during embryonic development.
Expression of Ov-ascl1, Ov-ngn, and Ov-neuroD on paraffin sections from Stage IX to Stage XX.2. (A-G) Ov-ascl1 is highly expressed in the lateral lips and retina at all stages. Overall, the number of Ov-ascl1 positive cells increases during organogenesis, reaching a peak at Stage XV.2. (H-N) Expression of Ov-ngn is restricted to cells in the lateral lips and a limited number of cells in the transition zones at all stages. (O-U) Ov-neuroD is expressed at low level in the lateral lips at Stage IX and XI, but not in its most outer cell layers. At subsequent stages, Ov-neuroD is highly expressed in the transition zones. In the central brain, Ov-neuroD transcripts are present in the cerebral, optic, and palliovisceral (Figure 4—figure supplement 5) cords at Stage IX and also in the pedal cord from Stage XI onwards. Expression in the cords decreases over the course of development. See Figure 4—figure supplements 1 and 2 for phylogenetic reconstruction and expression pattern of Ov-soxB1, Figure 4—figure supplements 3 and 4 for phylogenetic reconstruction of Ov-ngn, Ov-neuroD, and Ov-ascl1 and Figure 4—figure supplements 5, 6 and 7 for complementary panels of Ov-ascl1, Ov-ngn, and Ov-neuroD expression. Scale bars represent 100 μm. Abbreviations as in Figure 2.
Figure 4—figure supplement 1
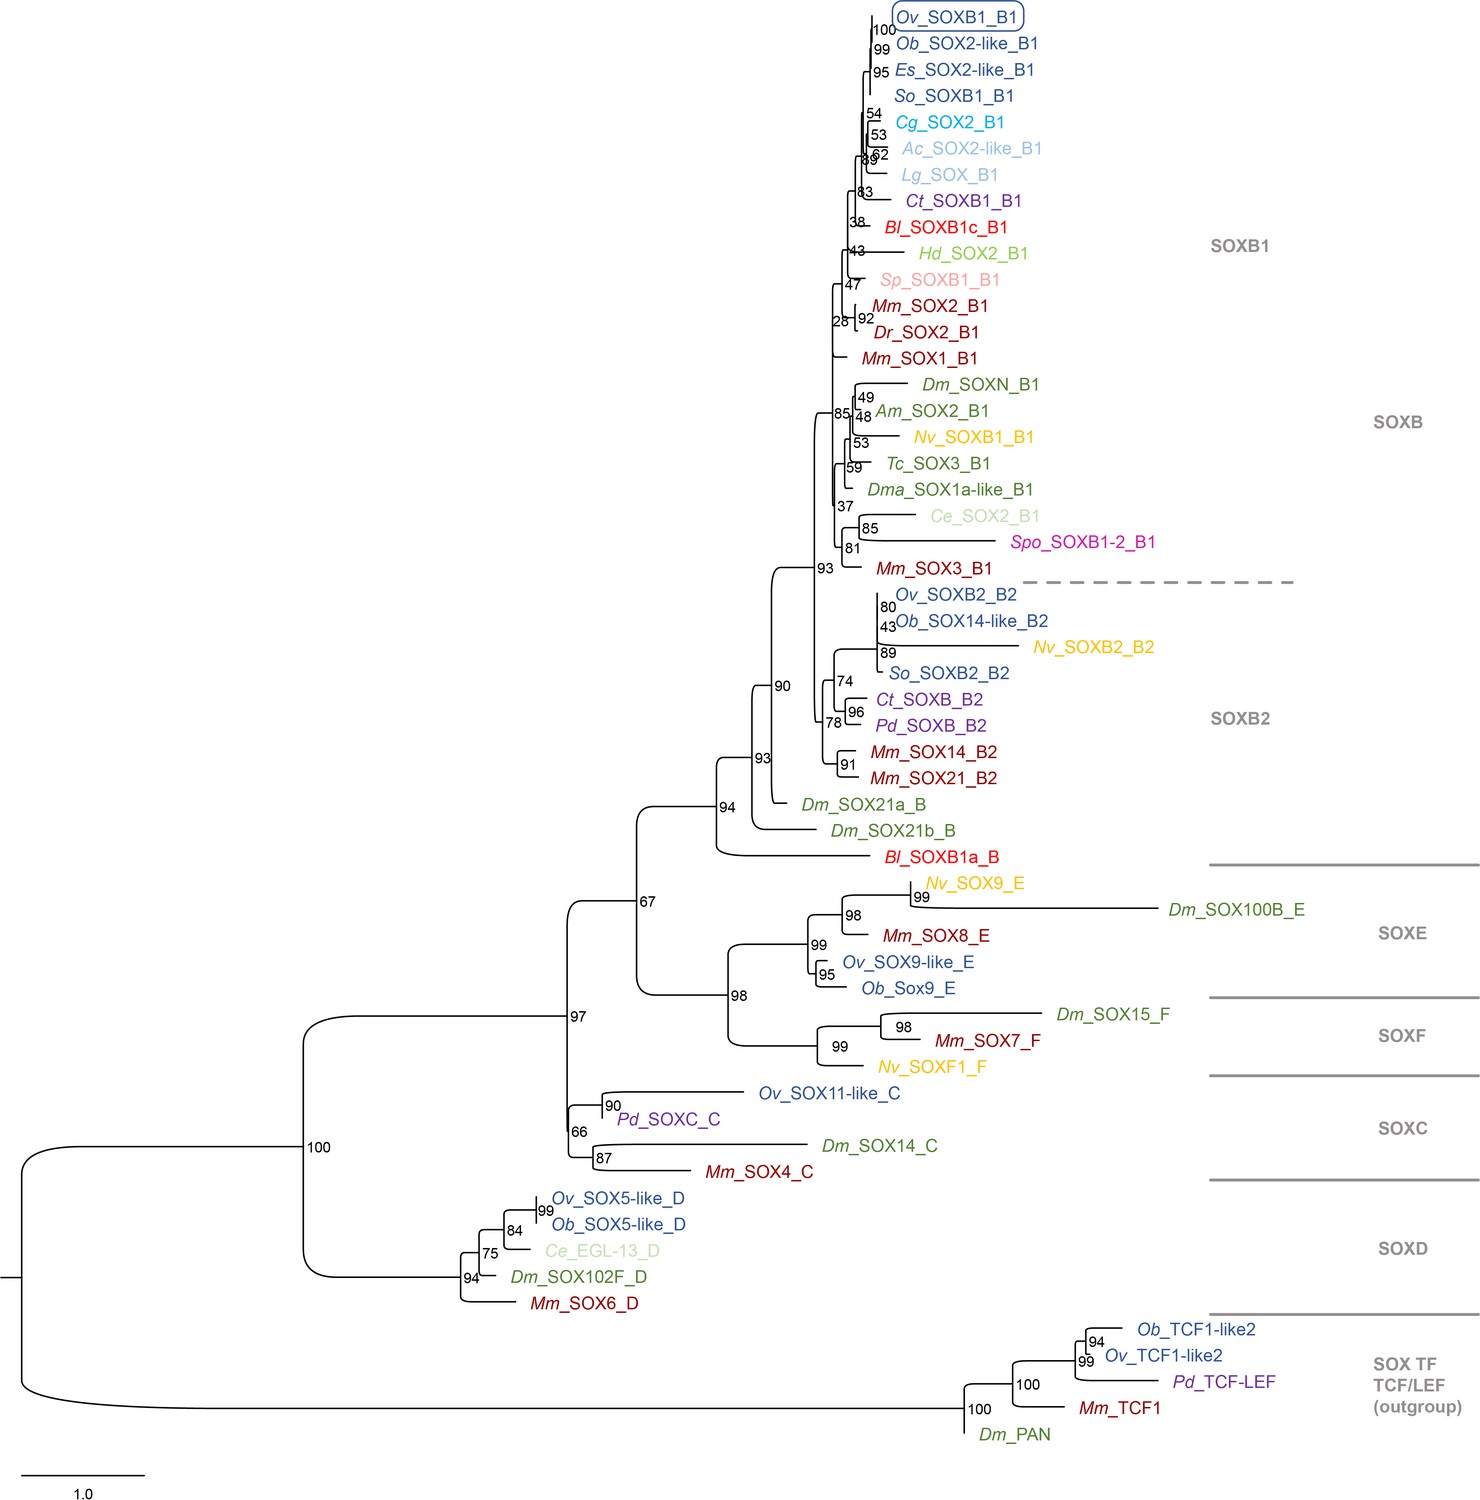
Phylogeny Ov-SOXB1.
Phylogenetic analysis of SOX family proteins shown in a maximum likelihood tree. Numbers at each branch represent bootstrap support values. The tree has been rooted using the SOX transcription factor family TCF/LEF as outgroup. Sox proteins are divided into six families (A–F) with SOXA proteins only present in mammalians and thus excluded from this analysis. Homologs of each group except SOXF could be identified in the available O. vulgaris transcriptomes and in other available cephalopod databases. The O. vulgaris ID used for subsequent ISH probe design is framed in blue. The scale bar represents the number of amino acid substitutes per site. Deuterostomes are in red, mollusks in blue, other Lophotrochozoa in purple, Ecdysozoa in green, and Cnidaria in yellow. See Supplementary file 5 for accession numbers and Supplementary file 6 for O. vulgaris protein sequences. Ac, Aplysia californica; Am, Apis mellifera; Bl, Branchiostoma lanceolatum; Ce, Caenorhabditis elegans; Cg, Crassostrea gigas; Ct, Capitella teleta; Dm, Drosophila melanogaster; Dma, Daphnia magna; Dr, Danio rerio; Es, Euprymna scolopes; Hd, Hybsibius dujardini; Lg, Lottia gigantea; Mm, Mus musculus; Nv, Nematostella vectensis; Ob, Octopus bimaculoides; Ov, Octopus vulgaris; Pd, Platynereis dumerilii; So, Sepia officinalis; Sp, Strongylocentrotus purpuratus; Spo, Schmidtea polychroa; Tc, Tribolium castaneum.
Figure 4—figure supplement 2
Expression of Ov-soxB1 during O. vulgaris embryonic development.
(A-b) Panels on the left show representative 3D reconstructions of embryos seen from the lateral side, stained with DAPI. White dashed lines indicate the sectioning plane in respect to the dorsoventral axis. Panels in the three right columns show in situ hybridization of Ov-soxB1 on paraffin sections in embryos at Stage IX, XI, XIII, XV.2, XVII, XIX.1, and XX.2, with anterior up and posterior down. Ov-soxB1 is expressed in the lateral lips and retina at all stages. In the central brain cords, it is first expressed in the cerebral cord at Stage IX (A–D), is present in the optic and pedal cords from Stage XI onwards (E–H) and appears in the palliovisceral cord at Stage XIII (I–L). Ov-soxB1 patterns the optic lobes from Stage XV.2 onwards (M–b). Ov-soxB1 transcripts are also present in the arms, surrounding the nerve cord, and pattern the developing mouth apparatus. Scale bars represent 100 μm. Abbreviations as in Figure 2.
Figure 4—figure supplement 3

Phylogeny of Ov-NEUROD and Ov-NGN.
Phylogenetic analysis of the atonal-related NEUROD, NEUROD-like proteins, NEUROGENIN and TAP proteins shown in a maximum likelihood tree. Numbers at each branch represent bootstrap support values. Arthropods only have a Neurogenin homolog Tap, but not a NeuroD homolog. The O. vulgaris IDs used for subsequent ISH probe design are framed in blue. The scale bar represents the number of amino acid substitutes per site. Deuterostomes are in red, mollusks in blue, other Lophotrochozoa in purple, Ecdysozoa in green, and Cnidaria in yellow. See Supplementary file 5 for accession numbers and Supplementary file 6 for O. vulgaris protein sequences. Ac, Aplysia californica; Am, Apis mellifera; Bl, Branchiostoma lanceolatum; Ce, Caenorhabditis elegans; Cg, Crassostrea gigas; Ct, Capitella teleta; Dm, Drosophila melanogaster; Dma, Daphnia magna; Dr, Danio rerio; Es, Euprymna scolopes; Hd, Hybsibius dujardini; Lg, Lottia gigantea; Mm, Mus musculus; Nv, Nematostella vectensis; Ob, Octopus bimaculoides; Ov, Octopus vulgaris; Pd, Platynereis dumerilii; So, Sepia officinalis; Sp, Strongylocentrotus purpuratus; Spo, Schmidtea polychroa; Tc, Tribolium castaneum.
Figure 4—figure supplement 4
Phylogeny of Ov-ASCL1.
Phylogenetic analysis of ASH and ASH-like proteins shown in a maximum likelihood tree. Numbers at each branch represent bootstrap support values. The tree has been rooted using the achaete-scute ASCb subfamily. The O. vulgaris ID used for subsequent ISH probe design is framed in blue. The scale bar represents the number of amino acid substitutes per site. Deuterostomes are in red, mollusks in blue, other Lophotrochozoa in purple, Ecdysozoa in green, and Cnidaria in yellow. See Supplementary file 5 for accession numbers and Supplementary file 6 for O. vulgaris protein sequences. Ac, Aplysia californica; Am, Apis mellifera; Bl, Branchiostoma lanceolatum; Ce, Caenorhabditis elegans; Cg, Crassostrea gigas; Ct, Capitella teleta; Dm, Drosophila melanogaster; Dma, Daphnia magna; Dr, Danio rerio; Es, Euprymna scolopes; Hd, Hybsibius dujardini; Lg, Lottia gigantea; Mm, Mus musculus; Nv, Nematostella vectensis; Ob, Octopus bimaculoides; Ov, Octopus vulgaris; Pd, Platynereis dumerilii; So, Sepia officinalis; Sp, Strongylocentrotus purpuratus; Spo, Schmidtea polychroa; Tc, Tribolium castaneum.
Figure 4—figure supplement 5
Complementary panels to Figure 4 of Ov-ascl1 expression in the head region of developing O. vulgaris embryos.
Panels on the left show representative 3D reconstructions of embryos seen from the lateral side, stained with DAPI. White dashed lines indicate the sectioning plane in respect to the dorsoventral axis. Panels in the two right columns show in situ hybridization of Ov-ascl1 on paraffin sections in embryos at Stage IX, XI, XIII, XV.2, XVII, XIX.1, and XX.2, with anterior up and posterior down. Abbreviations as in Figure 2.
Figure 4—figure supplement 6

Complementary panels to Figure 4 of Ov-ngn expression in the head region of developing O. vulgaris embryos.
Panels on the left show representative 3D reconstructions of embryos seen from the lateral side, stained with DAPI. White dashed lines indicate the sectioning plane in respect to the dorsoventral axis. Panels in the two right columns show in situ hybridization of Ov-ngn on paraffin sections in embryos at Stage IX, XI, XIII, XV.2, XVII, XIX.1, and XX.2, with anterior up and posterior down. Abbreviations as in Figure 2.
Figure 4—figure supplement 7
Complementary panels to Figure 4 of Ov-neuroD expression in the head region of developing O. vulgaris embryos.
Panels on the left show representative 3D reconstructions of embryos seen from the lateral side, stained with DAPI. White dashed lines indicate the sectioning plane in respect to the dorsoventral axis. Panels in the two right columns show in situ hybridization of Ov-neuroD on paraffin sections in embryos at Stage IX, XI, XIII, XV.2, XVII, XIX.1, and XX.2, with anterior up and posterior down. Abbreviations as in Figure 2.
Figure 5
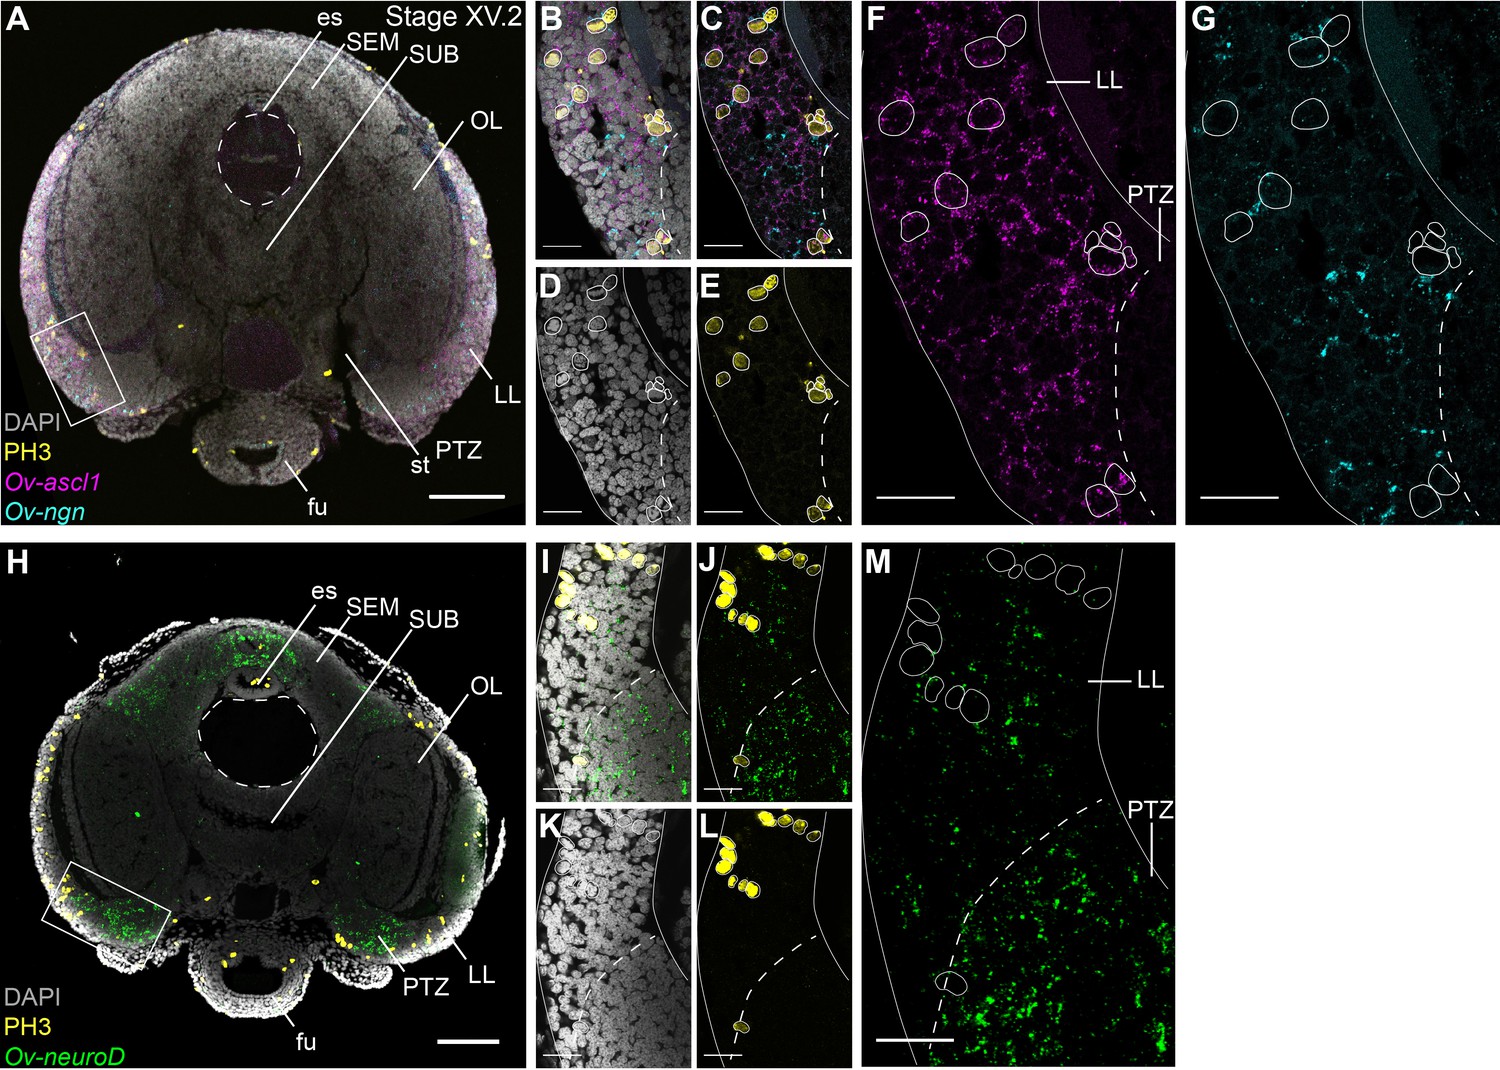
Cell proliferation profiles of the progenitor populations in the lateral lips.
Multiplex in situ hybridization (HCR v3.0) combined with immunostaining against PH3. (A) Overview image showing expression of Ov-ascl1 and Ov-ngn and presence of mitotic cells (PH3+) on a transversal section of a Stage XV.2 embryo. The boxed area covering the lateral lips and posterior transition zone indicates the magnified region in B-G. (B-G) Single- and multi-channel magnifications of a single optical section show that Ov-ascl1 and Ov-ngn are expressed in different cell types. In addition, PH3 immunoreactivity is more common in Ov-ascl1 expressing cells compared to Ov-ngn expressing cells. (H) Overview image showing expression of Ov-neuroD and presence of mitotic cells on a transversal section of a Stage XV.2 embryo. The boxed area covering the lateral lips and posterior transition zone indicates the magnified region in I-M. (I-M) Single- and multi-channel magnifications of a single optical section show that Ov-neuroD is broadly expressed in the PTZ and does not co-localize with dividing cells in the lateral lips. Scale bars represent 100 µm in A,H and 20 µm in B-G, I-M. Abbreviations as in Figure 1.
Figure 6
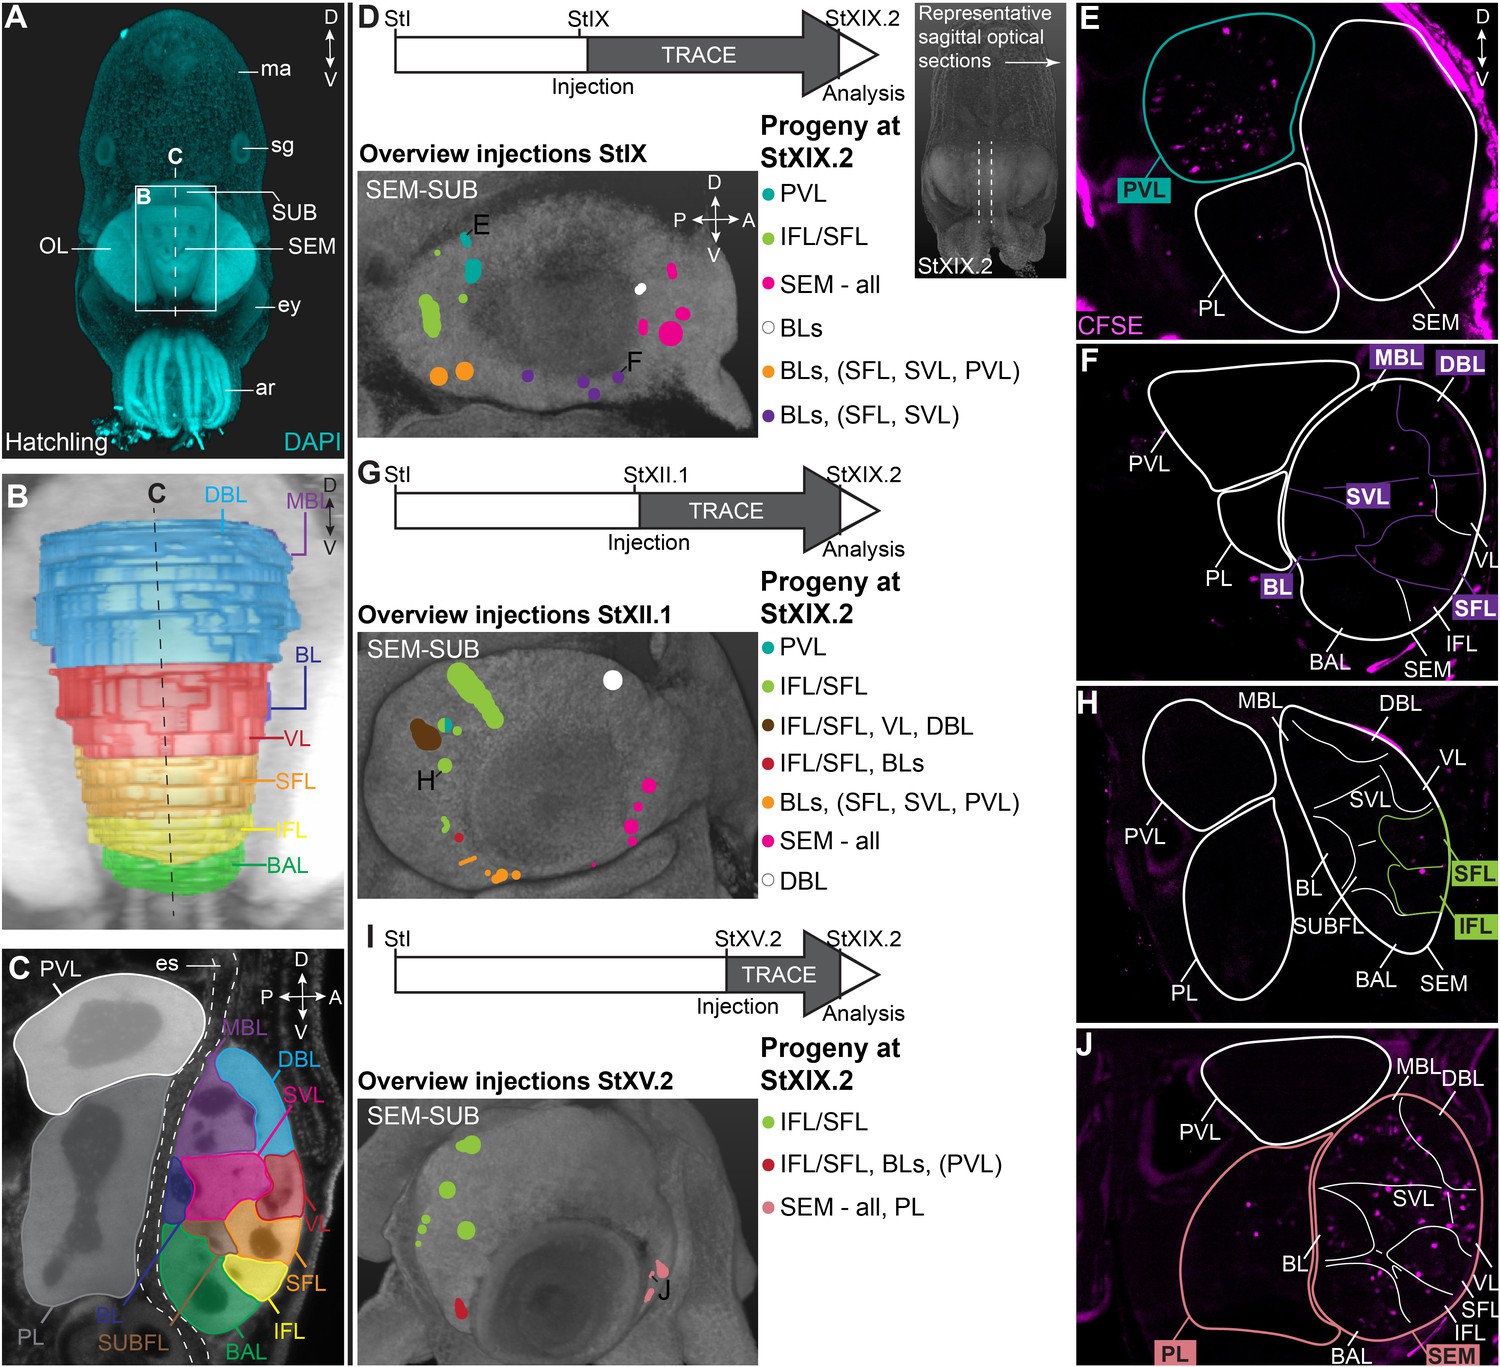
CFDA-SE lineage tracing from the lateral lips to the supra- and subesophageal mass.
(A) Maximum projection after DAPI staining of a hatchling from the anterior side. Boxed area indicates the magnified region in B and dashed line indicates optical sectioning plane for C. (B-C) Reconstruction of the different lobes in the SEM and SUB of a hatchling in 3D from the anterior side (B) and on an optical section (C). (D-J) Injection of CFDA-SE in the lateral lips at Stage IX (D), Stage XII.1 (G) or Stage XV.2 (I) and tracing until Stage XIX.2 resulted in labeled cells (CFSE positive) in specific brain regions, depending on the location of the progenitor domain. Panels on the left show the location of the CFDA-SE injection site in the later lips, with each colored domain representing a single experimental condition. Progenitor cells in domains with the same color generated comparable output to the brain at Stage XIX.2. On the right, panels E,F,H,J display representative optical sections through the central brain, showing the differential output related to the position of the labeled progenitor population. Targeted regions are indicated in the color corresponding to the color-coded progenitor populations in D,G,I. A, anterior; ar, arm; BAL, buccal lobe; BL, basal lobe; BLs, basal lobes (BL, DBL, MBL); D, dorsal; DBL, dorsal basal lobe; es, esophagus; ey, eye; IFL, inferior frontal lobe; MBL, medial basal lobe; OL, optic lobe; P, posterior; PL, pedal lobe; PVL, palliovisceral lobe; SEM, supraesophageal mass; SFL, superior frontal lobe; sg, stellate ganglion; SUB, subesophageal mass; SUBFL, subfrontal lobe; SVL, subvertical lobe; V, ventral; VL, vertical lobe.
Figure 7
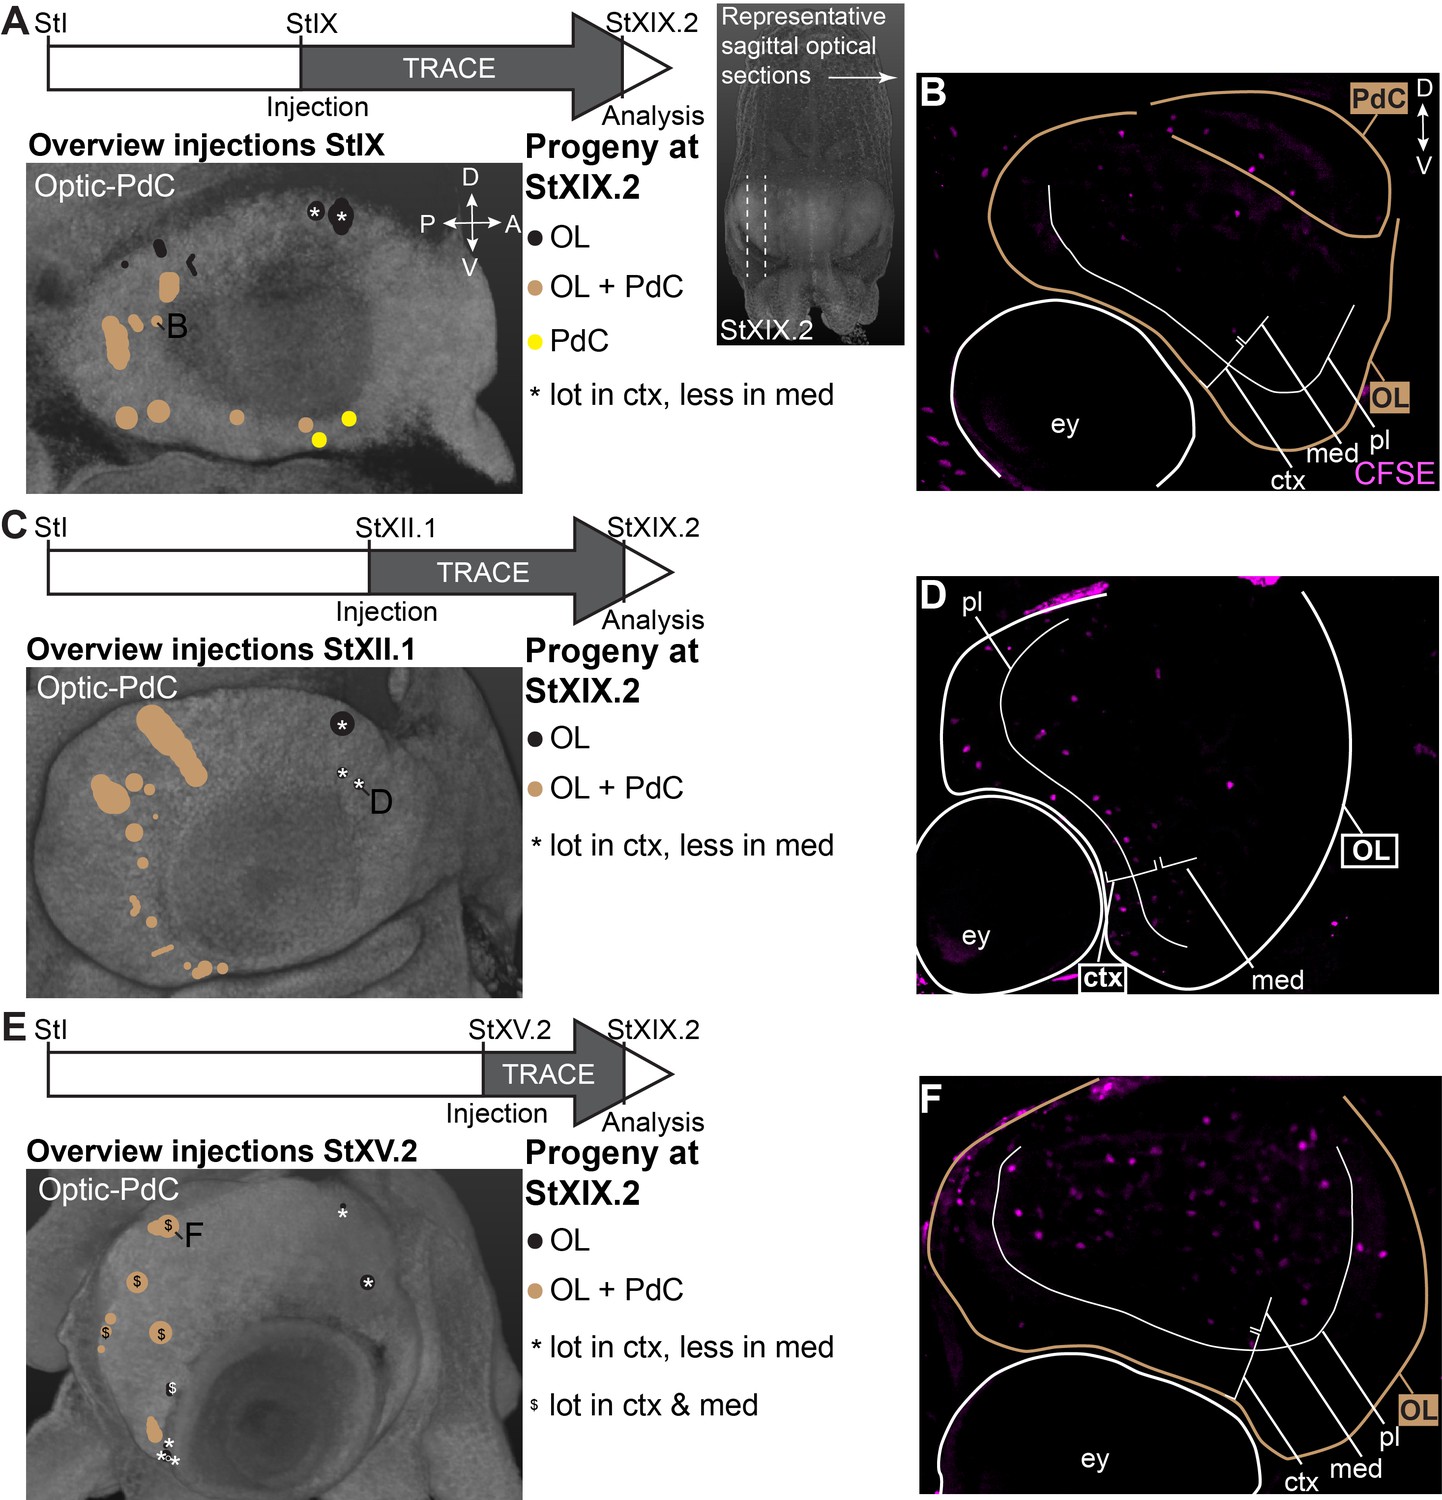
CFDA-SE lineage tracing from the lateral lips to the optic lobe and peduncle complex.
Injection of CFDA-SE in the lateral lips at Stage IX (A), Stage XII.1 (C) or Stage XV.2 (E) and tracing until Stage XIX.2 resulted in labeled cells in specific regions of the optic lobe and peduncle complex, depending on the location of the progenitor domain. Panels on the left show the location of the CFDA-SE injection site in the later lips, with each colored domain representing a single experimental condition. Progenitor cells in domains with the same color generated comparable output to the brain at Stage XIX.2. On the right, panels B,D,F display representative optical sections through the optic lobe, showing the differential output related to the position of the labeled progenitor population. Targeted regions are indicated in the color corresponding to the color-coded progenitor populations. Abbreviations as in Figure 6; ctx, cortex; IGL, inner granular layer; med, medulla; OGL, outer granular layer; PdC, peduncle complex; pl, plexiform layer.
Figure 8 with 2 supplements
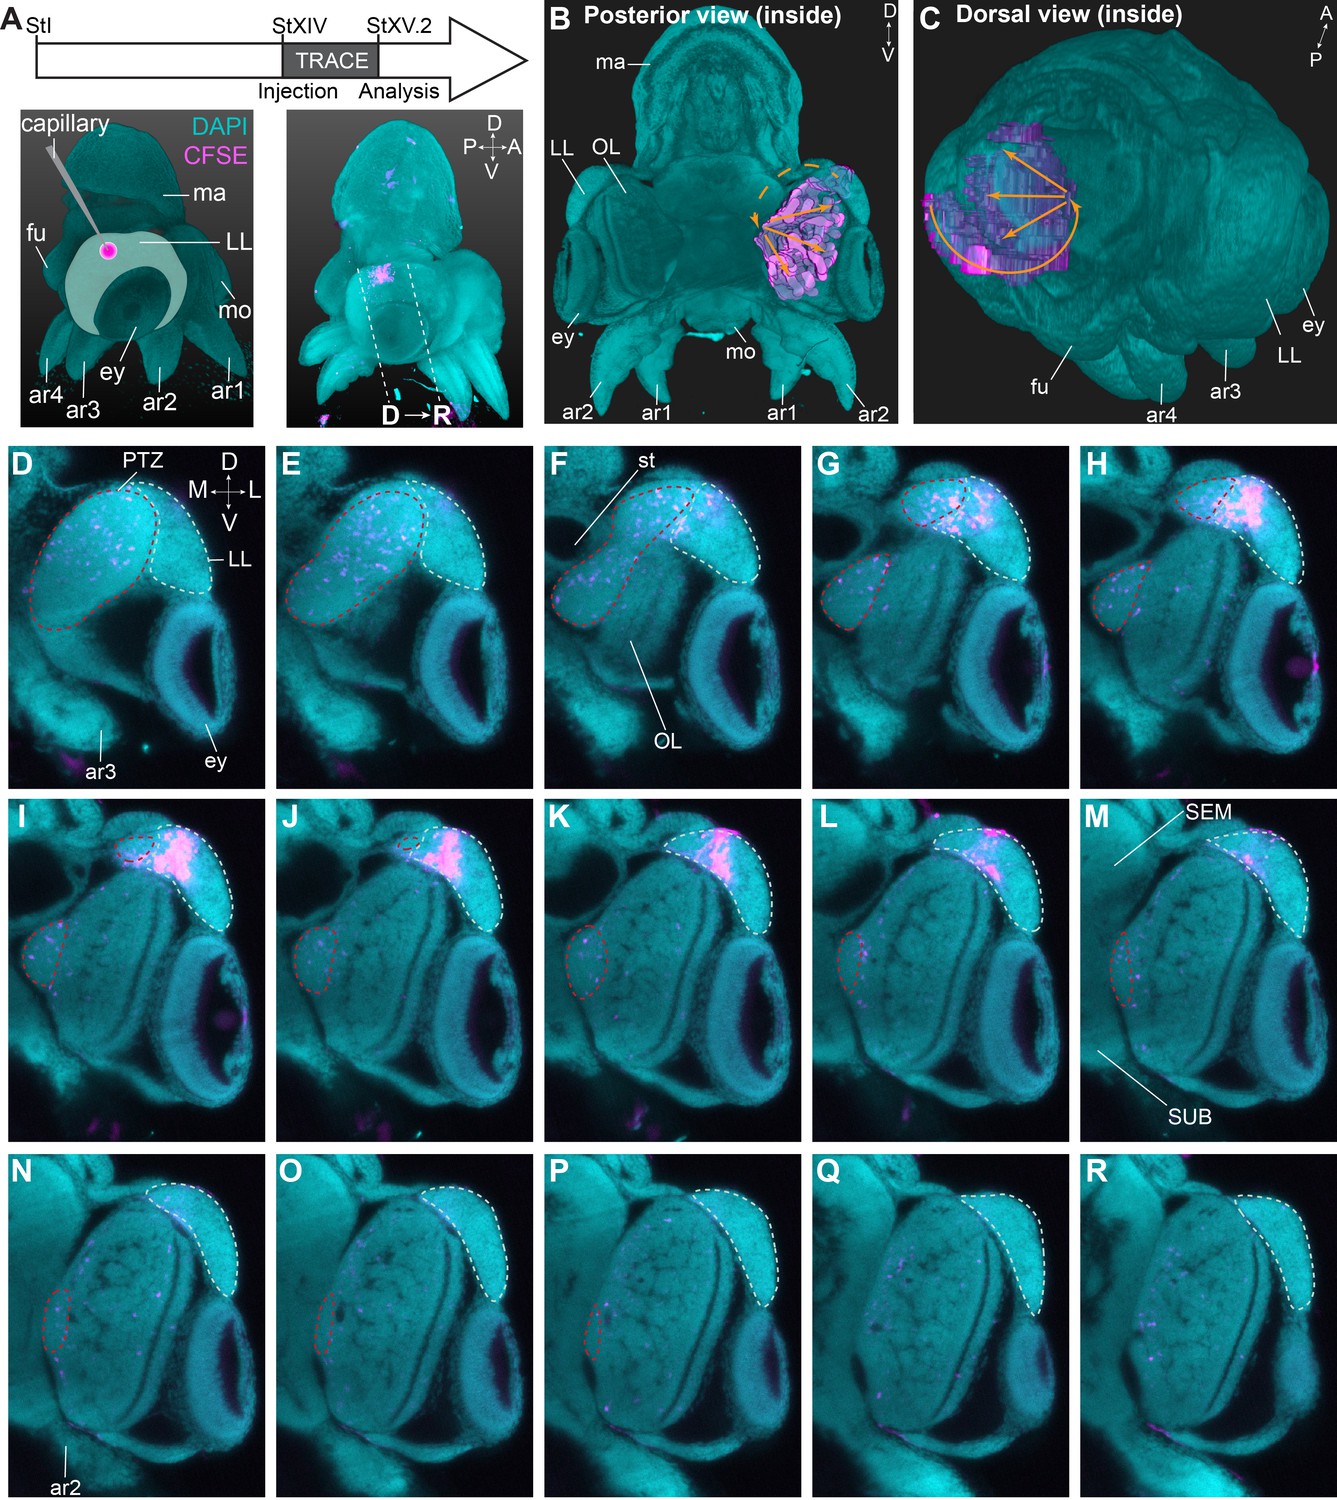
Trajectory mapping of migrating cells from the lateral lips to the central brain.
(A) Experimental setup showing CFDA-SE injection in the lateral lip at Stage XIV and embryo sampling at Stage XV.2. Dashed lines indicate optical sectioning planes for D-R. (B-C) Volumetric rendering of the embryo (DAPI, cyan) and the manually traced CFSE object (pink-purple), showing the trajectory (orange arrows) from the injected area in the lateral lips to the optic lobe. (D-R) Optical sections through the optic lobe from posterior (D) to anterior (R). The population of labeled cells in the lateral lips is visible in G-L. The progeny enters the optic lobes via the posterior transition zone. The lateral lips are encircled in mint green and the posterior transition zone in red. See Figure 8—figure supplement 1 for an overview of injections resulting in a similar trajectory of cells through the PTZ and Figure 8—figure supplement 2 showing that migrating cells in the PTZ are neurogenic. Abbreviations as in Figure 1; L, lateral; M, medial.
Figure 8—figure supplement 1
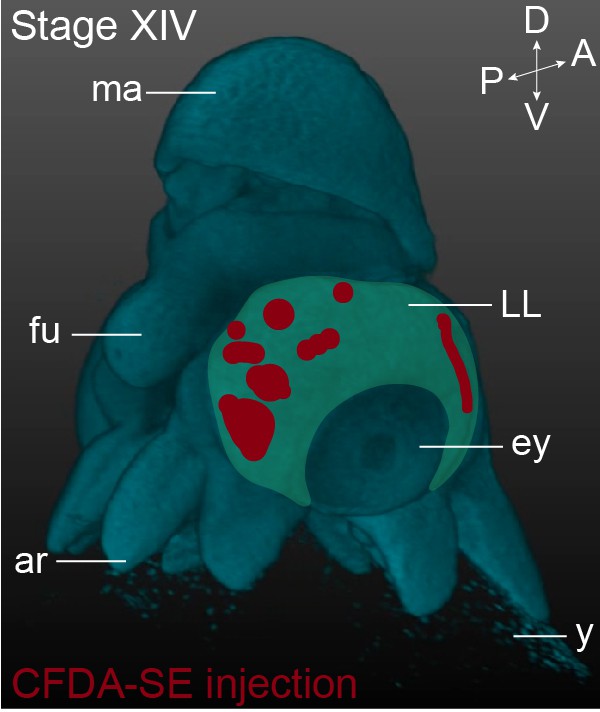
Summary of short-term CFDA-SE lineage tracing.
This panel shows the location of the CFDA-SE injection sites at Stage XIV, with each domain representing a single experimental condition. The lateral lips are pseudo-colored in green. Abbreviations as in Figure 1.
Figure 8—figure supplement 2
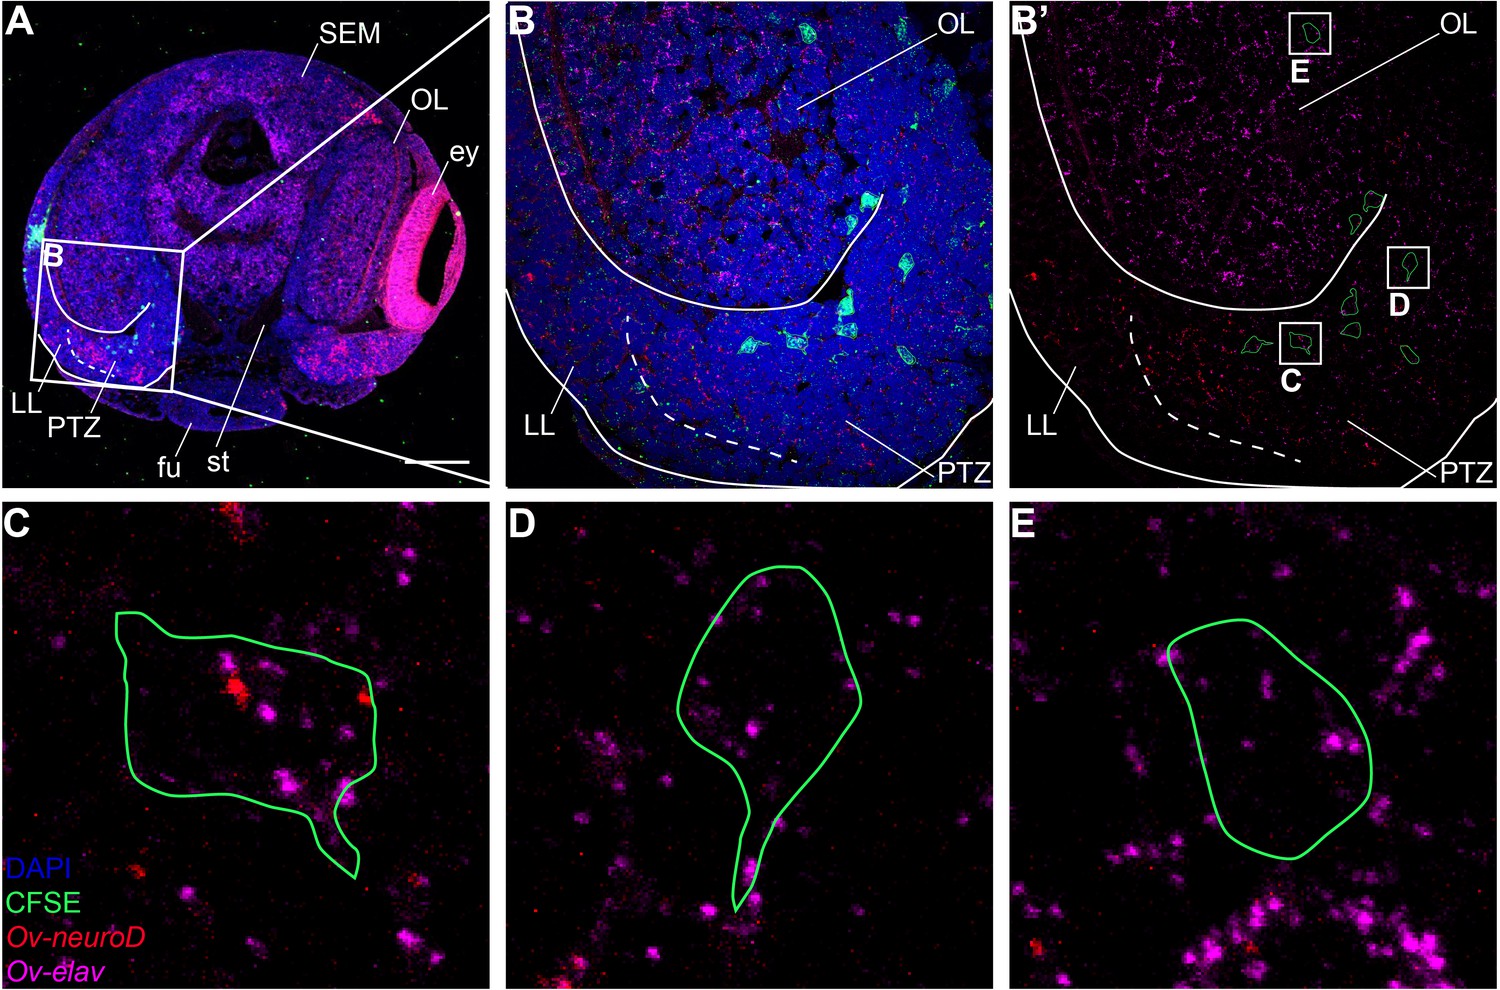
Migrating cells through the PTZ are neurogenic.
Multiplex in situ hybridization (HCR v3.0) on a transversal section of a Stage XV.1 embryo that was injected 48 hr before with CFDA-SE in the dorsal lateral lip. (A) Overview image showing expression of Ov-neuroD and Ov-elav, and CFSE labeled cells. The boxed area indicates the magnified region in B. Scale bar represents 100 μm. (B-B’) 1 μm z-stack showing the progeny of dorsal lateral lip progenitor cells that migrate through the posterior transition zone, into the optic lobe. Labeled cells are outlined and three boxed areas are magnified in C-E. (C-E) Magnification of single, labeled cells in the posterior transition zone (C,D) and optic lobe (E) showing expression of Ov-neuroD and/or Ov-elav in the migrating cells. Abbreviations as in Figure 1.
Figure 9

Overview of the expression of neurogenic genes and hypothetical neurogenesis process in O. vulgaris.
(A) The expression domains of Ov-ngn (purple), Ov-ascl1 (green), Ov-neuroD (red), and Ov-elav (pink) are depicted during O. vulgaris neurogenesis. Areas indicate high level expression in most cells, whereas dots represent lower expression or high expression in a couple of cells. The orange arrows depict the trajectory taken by cells originating in the lateral lips, passing through the posterior transition zone before entering the optic lobe, as observed after CFDA-SE lineage tracing. The arrows are dashed, considering their 3D projection on a 2D figure. (B) Ov-soxB1, Ov-ngn, and Ov-ascl1 are all expressed at high level in the lateral lips. In this structure as well, proliferating cells (Ov-pcna expressing or PH3 positive) are abundant. They mostly colocalize with Ov-ascl1 expressing cells that potentially also express Ov-soxB1. Our data suggest the onset of differentiation in the transition zones, with low-level expression of Ov-ngn, high-level expression of Ov-neuroD and, low-level expression of Ov-elav. We suggest that the induction of Ov-neuroD expression is guided by Ov-ngn and that differentiating cells express Ov-neuroD before Ov-elav. Once arrived in the central brain, neurons start forming synapses (Ov-syt expression, presence of acetylated alpha-tubulin). (C) Evolutionary comparative expression mapping based on a generalized neural specification and differentiation sequence. See main text for details and references. *Note that the depicted cell types are a generalized state, and that certain phyla/subphyla/classes might lack one or more progenitor types. ar, arm; ATZ, anterior transition zone; DN, differentiated neuron; es, esophagus; ey, eye; fu, funnel; LL, lateral lips; NE, neurectodermal cell; NN, newborn neuron; NnPC, neuronal progenitor cell; NPC, neural progenitor cell; OL, optic lobe; PTZ, posterior transition zone; SEM, supraesophageal mass; si, sinus ophthalmicus; SUB, subesophageal mass; y, yolk.
Tables
Key resources table
| Reagent type (species) or resource | Designation | Source or reference | Identifiers | Additional information |
|---|---|---|---|---|
| Antibody | Anti-Tubulin, Acetylated antibody (Mouse Monoclonal) | Sigma | Cat#: T6793 | (1:300) |
| Antibody | Anti-phospho-Histone H3 (Ser10) Antibody (Rabbit Polyclonal) | Millipore | Cat#: 06–570 | (1:300) |
| Antibody | Donkey anti-Mouse IgG (H+L) Secondary Antibody, Alexa Fluor 488 | Life Tech (Invitrogen) | Cat#: A-21202 | (1:300) |
| Antibody | Donkey anti-Rabbit IgG (H+L) Highly Cross-Adsorbed Secondary Antibody, Alexa Fluor 555 | Life Tech (Invitrogen) | Cat#: A-31572 | (1:300) |
| Antibody | Fluorescein Antibody (Goat Polyclonal) | Novus Biologicals | Cat#: NB600-493 | (1:300 on sections, 1:500 whole mount) |
| Antibody | Donkey anti-Goat IgG (H+L) Cross-Adsorbed Secondary Antibody, Alexa Fluor 488 | Invitrogen | Cat#: A-11055 | (1:300) |
| Strain, strain background (Escherichia coli) | JM109 chemocompetent cells | Promega | Cat#: L2005 L1001 | |
| Chemical compound, drug | Mowiol 4–88 | Sigma | Cat#: 81381 | |
| Chemical compound, drug | TRI Reagent Solution | Invitrogen | Cat#: AM9738 | |
| Chemical compound, drug | Eukitt quick-hardening mounting medium | Sigma | Cat#: 03989 | |
| Chemical compound, drug | Poly(dimethylsiloxane-co-methylphenylsiloxane) viscosity 125 cSt | Sigma-Aldrich | Cat#: 378488 | |
| Chemical compound, drug | Mineral oil | Sigma-Aldrich | Cat#: M8410 | |
| Chemical compound, drug | Silicone Elastomer, 2 Part, 1:1 Mix, Sylgard 170, Black / White, Container, 2 kg | DOWSIL | Cat#: 101693 | |
| Commercial assay or kit | RNeasy Micro Kit | Qiagen | Cat#: 74004 | |
| Commercial assay or kit | SMARTer PCR cDNA Synthesis Kit | Takara Bio Inc | Cat#: 634925 | |
| Commercial assay or kit | NEBNext Single Cell/Low Input cDNA Synthesis and Amplification Module | New England BioLabs. | Cat#: E6421S | |
| Commercial assay or kit | Superscript III Reverse Transcriptase | Invitrogen | Cat#: 18080–044 | |
| Commercial assay or kit | TOPO TA Cloning Kit, Dual Promoter, without competent cells (25 reactions). | Invitrogen | Cat#: 450640 | |
| Commercial assay or kit | Micro Bio-Spin P-30 Gel Columns, Tris Buffer (RNase-free) | BioRad Lab. | Cat#: 7326250 | |
| Commercial assay or kit | Ribomap Kit | Roche | Cat#: 5266190001 | |
| Commercial assay or kit | Bluemap detection kit | Roche | Cat#: 5266327001 | |
| Other | Proteinase K, recombinant, PCR Grade | Roche | Cat#: 3115887001 | ISH (1:1000) HCR (1:3000) |
| Other | Tissue-Tek Biopsy 6-Chamber Cassette | Sakura | Cat#: 4073 Biopsy 6 Chamber Cassette White 1.000pcs | For paraffin embedding |
| Other | DAPI | Sigma Aldrich | Cat#: 32670–5 MG-F | (1:1000) |
| Other | HCR Amplifier B1, Alexa Fluor 546 | Molecular Instruments (US) | HCR Amplifier | |
| Other | HCR Amplifier B2, Alexa Fluor 647 | Molecular Instruments (US) | HCR Amplifier | |
| Other | HCR Amplifier B3, Alexa Fluor 488 | Molecular Instruments (US) | HCR Amplifier | |
| Other | Glass Capillaries, 3.5’, For All Model Nanoject Models | Drummond | Cat#: 3-000-203-G/X | For microinjection |
| Other | CFDA-SE | SanBio | Cat#: 14456–10 | (1 mM for trajectory mapping, 0.1 mM for long term tracing in filtered seawater) |
| Other | Fast Green FGF | Sigma-Aldrich | Cat#: F7252 | (0.3 mg/ml) |
| Software, algorithm | Fiji: ImageJ | DOI: 10.1038/nmeth.2019 | ||
| Software, algorithm | SMRT Link v. 9.0.0 | Pacific Biosciences (PACBIO) | ||
| Software, algorithm | IsoSeq 3.3 | Pacific Biosciences (PACBIO) | ||
| Software, algorithm | ARIVIS Vision4D Zeiss Edition 3.1.4 | ARIVIS AG | ||
| Software, algorithm | Adobe Photoshop | Adobe | ||
| Software, algorithm | Blast2GO | DOI: 10.1093/bioinformatics/bti610 | ||
| Software, algorithm | insitu_probe_generator | DOI: 10.5281/zenodo.4086058 | ||
| Software, algorithm | tBLASTn, BLASTp | NCBI: https://blast.ncbi.nlm.nih.gov/Blast.cgi | ||
| Software, algorithm | UCSC Genome Browser on Euprymna scolopes Euprymna scolopes Assembly (eupSco1) | DOI: 10.1073/pnas.1817322116 | ||
| Software, algorithm | ORFfinder | NCBI (RRID:SCR_016643) | ||
| Software, algorithm | MUSCLE Alignment | DOI: 10.1093/bioinformatics/bth090 | ||
| Software, algorithm | MegaX | DOI: 10.1093/molbev/msy096 | ||
| Software, algorithm | TrimAl | DOI: 10.1093/bioinformatics/btp348 | ||
| Software, algorithm | IQTree | DOI: 10.1093/molbev/msu300 | ||
| Software, algorithm | FigTree v.1.4.4 | DOI:http://tree.bio.ed.ac.ukSoftware/Figtree/ | ||
| Software, algorithm | CDD Search Tool | DOI: 10.1093/nar/gkz991 |
Additional files
-
Supplementary file 1
Number of biological replicates (unless specified otherwise) for immunohistochemistry and in situ hybridization experiments.
N/A, not applicable; TR, technical replicate.
- https://cdn.elifesciences.org/articles/69161/elife-69161-supp1-v1.docx
-
Supplementary file 2
Nucleotide sequence of primers used to amplify gene fragments for ISH probes.
- https://cdn.elifesciences.org/articles/69161/elife-69161-supp2-v1.docx
-
Supplementary file 3
Nucleotide sequence of probes for colorimetric in situ hybridization.
- https://cdn.elifesciences.org/articles/69161/elife-69161-supp3-v1.docx
-
Supplementary file 4
Nucleotide sequences of HCR probes.
- https://cdn.elifesciences.org/articles/69161/elife-69161-supp4-v1.docx
-
Supplementary file 5
Accession numbers of protein sequences used for phylogenetic tree construction.
- https://cdn.elifesciences.org/articles/69161/elife-69161-supp5-v1.docx
-
Supplementary file 6
Protein sequences of O. vulgaris homologs used in phylogenetic tree reconstruction.
- https://cdn.elifesciences.org/articles/69161/elife-69161-supp6-v1.docx
-
Transparent reporting form
- https://cdn.elifesciences.org/articles/69161/elife-69161-transrepform-v1.pdf
Download links
A two-part list of links to download the article, or parts of the article, in various formats.
Downloads (link to download the article as PDF)
Open citations (links to open the citations from this article in various online reference manager services)
Cite this article (links to download the citations from this article in formats compatible with various reference manager tools)
Identification of neural progenitor cells and their progeny reveals long distance migration in the developing octopus brain
eLife 10:e69161.
https://doi.org/10.7554/eLife.69161


