Dorsal premammillary projection to periaqueductal gray controls escape vigor from innate and conditioned threats
- Department of Psychology, University of California, Los Angeles, United States
- University of California, Los Angeles, United States
- Institute of Cognitive Science, University of Colorado, United States
- University of Colorado, United States
- Department of Neurobiology, University of California, Los Angeles, United States
- Department of Psychiatry & Biobehavioral Sciences, University of California, Los Angeles, United States
- Department of Anatomy, University of São Paulo, Brazil
- Electrical and Computer Engineering, University of California, Los Angeles, United States
Figures
Figure 1 with 3 supplements

Rat and fear retrieval assays increased fear-related metrics.
(A) Schemes of (top) rat assay and (bottom) fear retrieval assay. The rat is restricted by a harness (shown in red) that is tied to the upper wall edge and can only move in the pink area. In the shock grid assay, mice freely explored a context with a shock grid for three daily sessions (pre-shock, fear acquisition, and fear retrieval). Shocks were delivered only on fear acquisition day. All presented shock grid data is from fear retrieval. (B) Assays were performed in the order described (D = day). (C) Bars depict behavioral metrics (n = 32), for rat and fear retrieval assays, both for control and for threat conditions. Wilcoxon signed-rank test; *p<0.05, ***p<0.001.
Figure 1—figure supplement 1
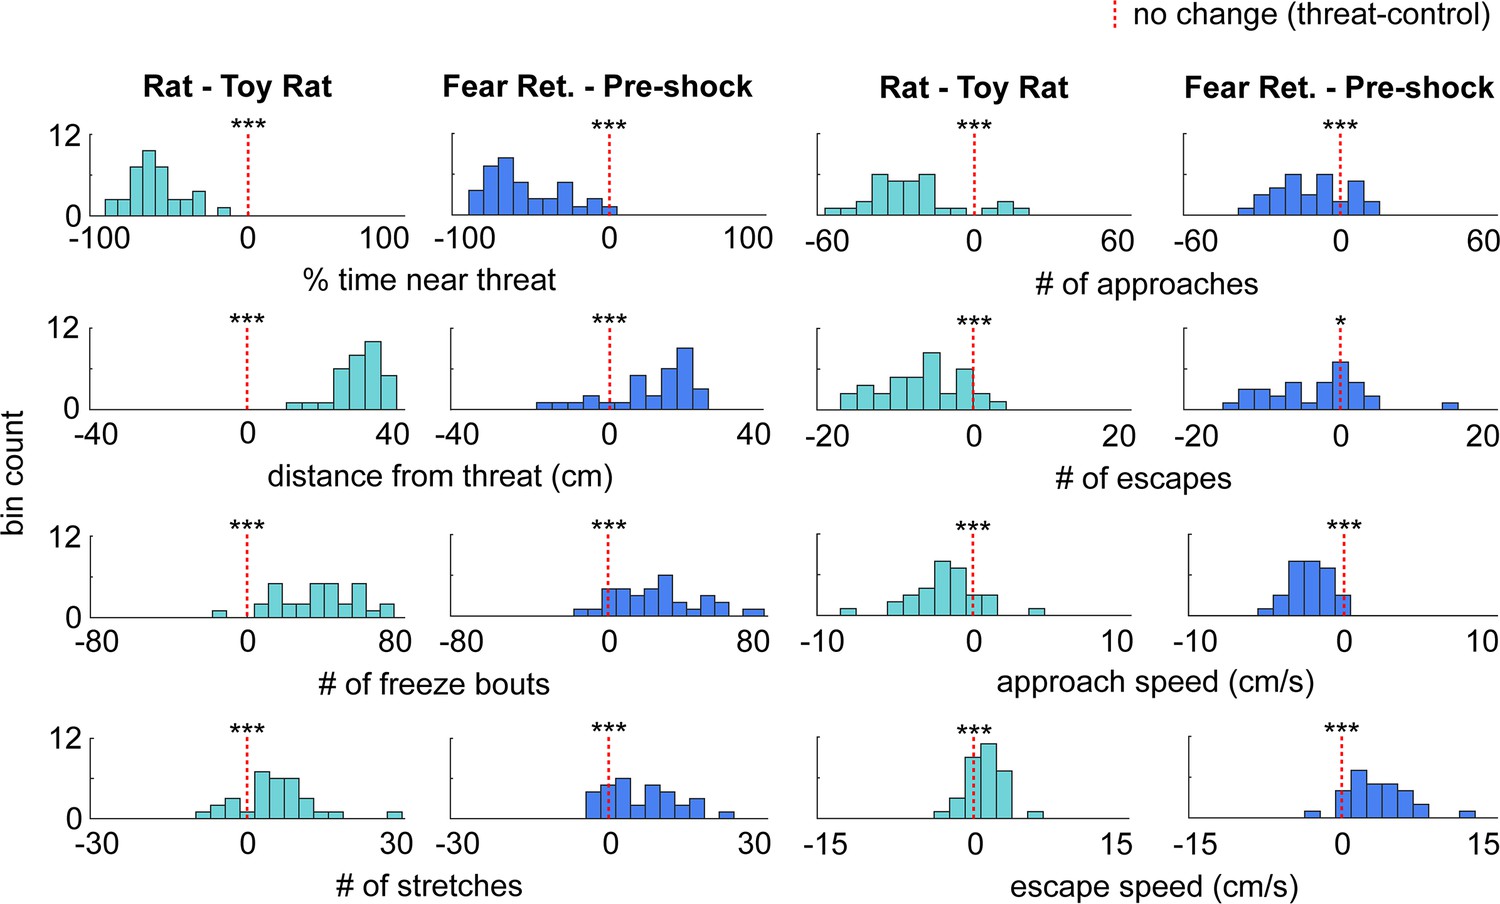
Distribution of the difference scores for threat - control assays.
Histograms depict the difference scores for all mice (threat - control) for each behavioral metric in Figure 1. (n = 32 mice). *p<0.05, ***p<0.001.
Figure 1—figure supplement 2
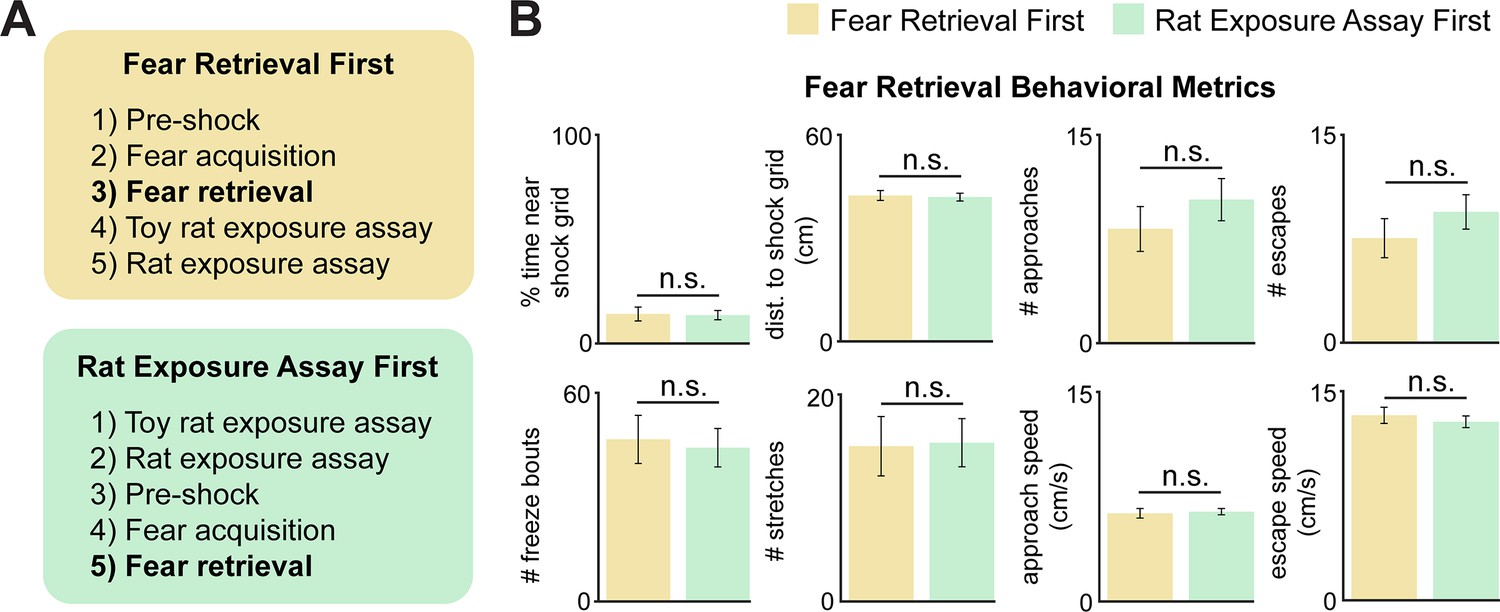
The order of threat exposure does not affect defensive behavioral metrics.
(A) Two cohorts of mice were exposed to the rat and shock grid threats in counterbalanced order, as specified in the blue and green boxes. (B) The defensive behavioral metrics of these two cohorts were compared for the fear retrieval assay. None of the tested metrics were different between groups (Wilcoxon rank-sum test; each group, n = 9).
Figure 1—figure supplement 3

Distribution of the difference scores for threat–control assays for males and females.
Histograms depict the difference scores for all mice, threat–control, for each behavioral metric in Figure 1, separately for males (green) and females (purple). The dotted red line indicates zero, or no difference between threat and control (male n = 17, female n = 15). No significant differences (p>0.05) were found between males and females in any of the metrics plotted.
Figure 2 with 3 supplements
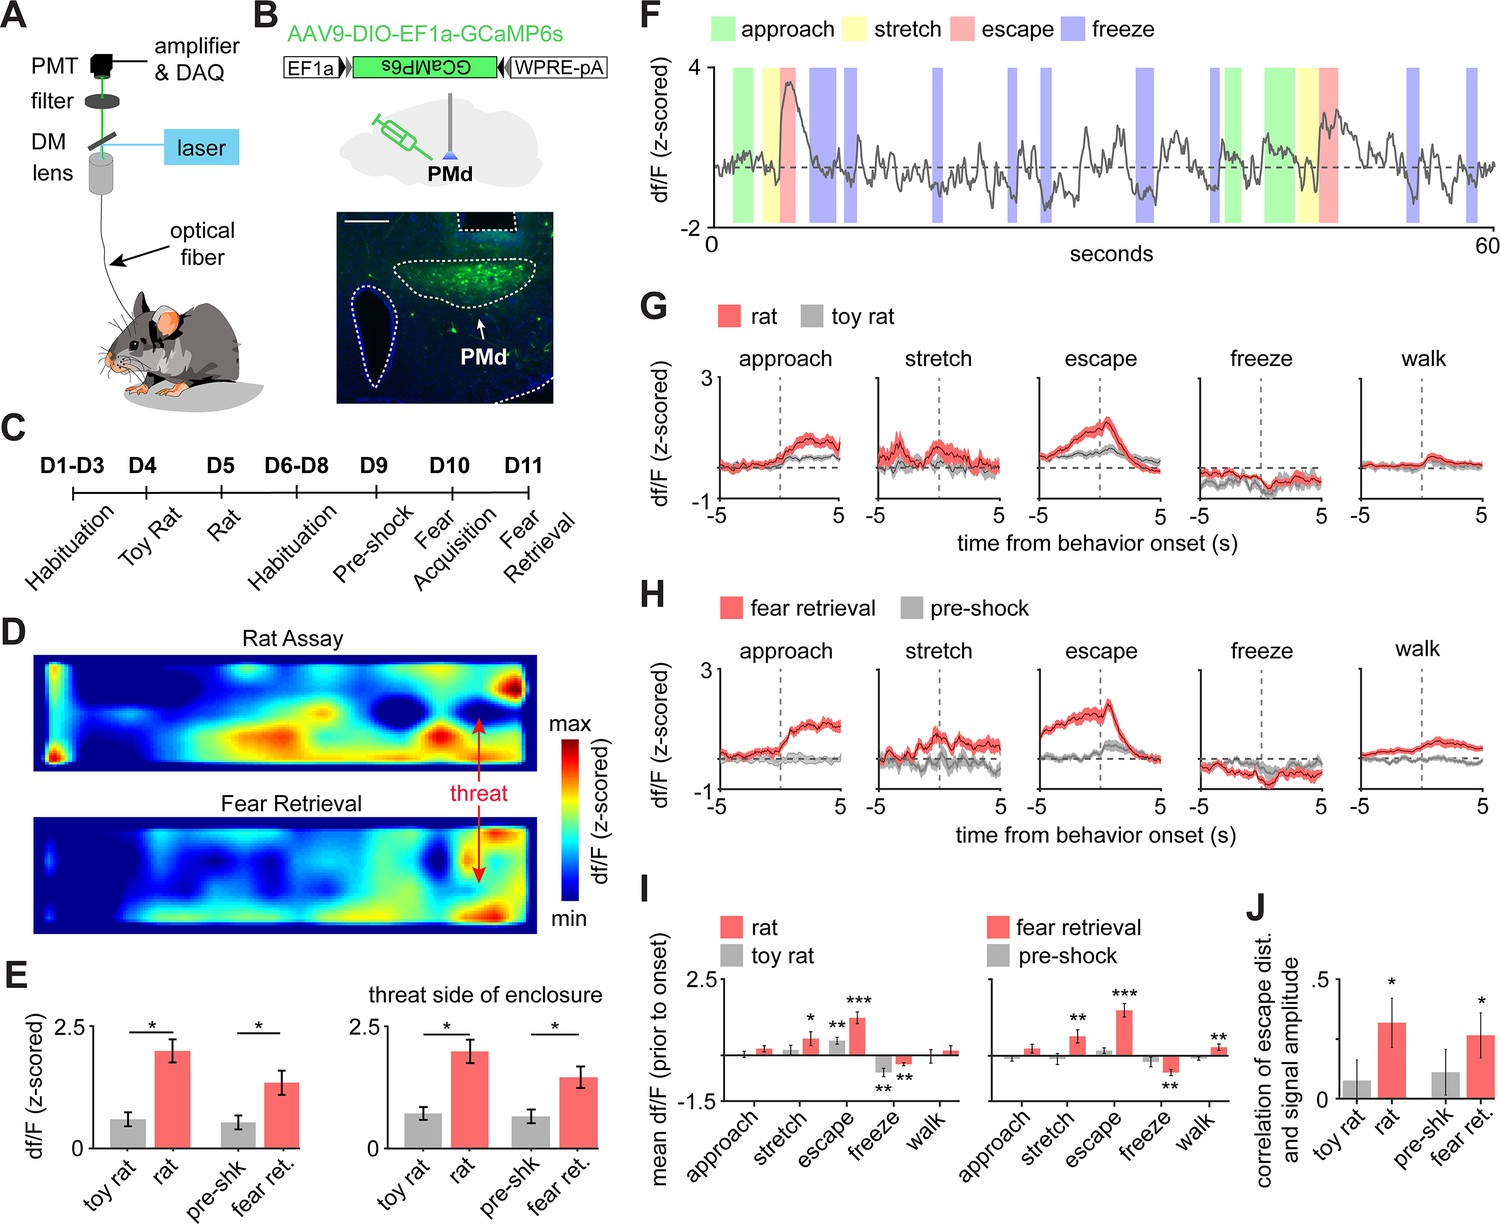
PMd-cck cells are activated by threats and escape.
(A) Scheme showing setup used to obtain fiber photometry recordings. (B) Expression of GCaMP6s in PMd-cck cells. (scale bar: 200 µm). (C) Diagram depicts the behavioral protocol for each day (abbreviated as D). (D) Average heatmaps showing that PMd-cck cells are more active near a rat (top) and the shock grid (bottom) (for each, n = 15). (E) Bar graphs quantifying average z-scored df/F during exposure to the toy rat, rat, pre-shock, and fear retrieval. All data are shown for the same speed range (6–10 cm/s; Wilcoxon signed-rank test). (F) Example GCaMP6s trace from a representative mouse showing that PMd-cck cells are active during escape. (G) Behavior-triggered average showing mean PMd-cck activity during approach to rat, risk-assessment stretch-attend postures, escape, and freeze. (n = 15 mice) (H) Same as (G), but during exposure to the fear retrieval shock grid assay. (n = 15 mice). (I) Bars show the mean df/F from –2 to 0 s from behavior onset for threat (red) and control (gray) assays. (Wilcoxon signed-rank test; n [left] same as (F); n [right] same as (G)). (I) Bars show the Spearman correlation of the mean fiber photometry signal amplitude and distance run for all escapes. (Wilcoxon signed-rank test). (E, I, J), n = 15 mice, data is plotted as mean ± s.e.m. *p<0.05, **p<0.01, ***p<0.001.
Figure 2—figure supplement 1
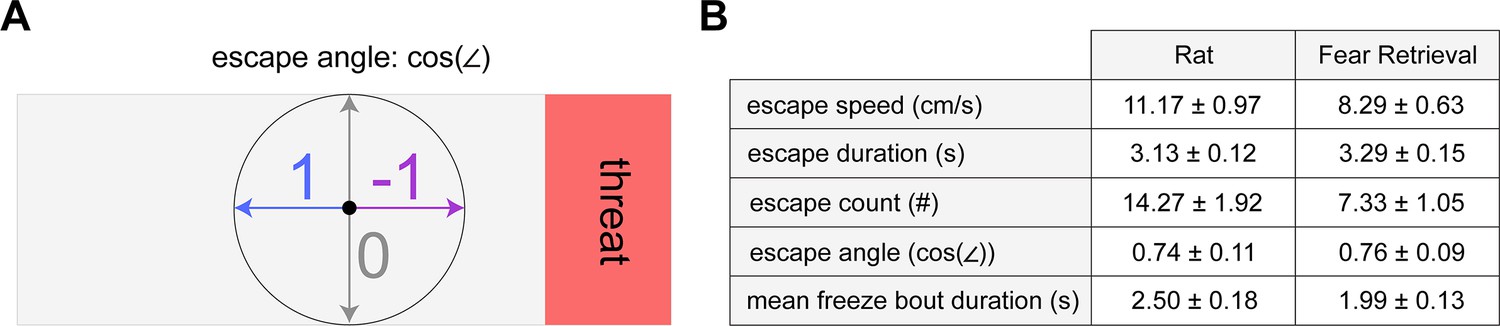
Behavioral metrics for the PMd fiber photometry cohort during threat exposure assays.
(A) Diagram provides a description of the escape angle metric, here calculated as the cosine of the head direction in radians. A value of 1 indicates an escape parallel with the long walls of the enclosure. (B) Table shows pertinent defensive metrics during exposure to rat and fear retrieval assays for the PMd fiber photometry cohort. (n = 15 mice).
Figure 2—figure supplement 2
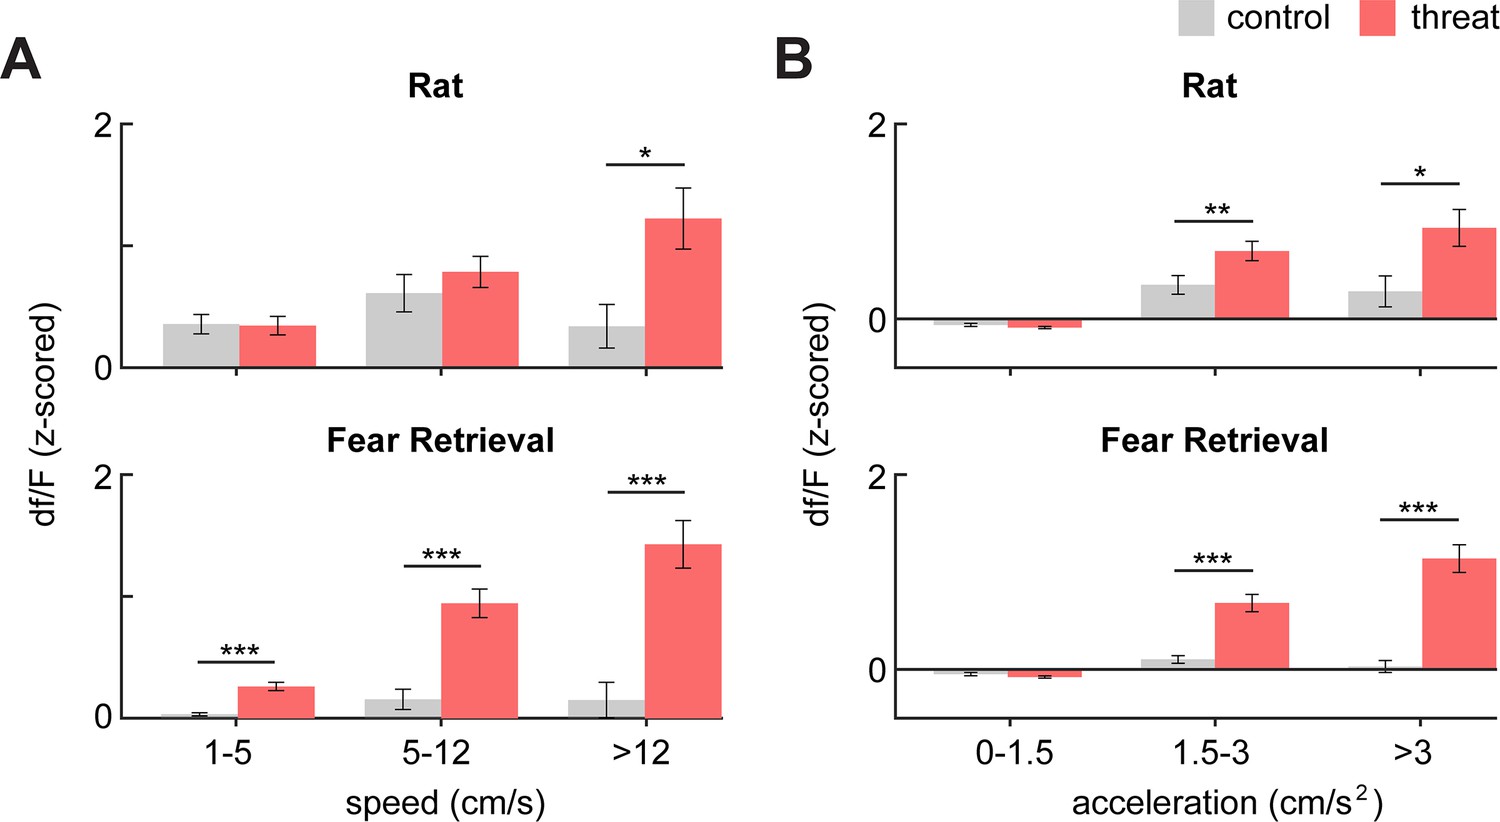
PMd-cck df/F for increasing speed and acceleration ranges.
Bars show the mean df/F (z-scored) for increasing ranges of (A) speed and (B) acceleration. (Wilcoxon signed-rank test; n = 15) *p<0.05, **p<0.01, ***p<0.001.
Figure 2—figure supplement 3
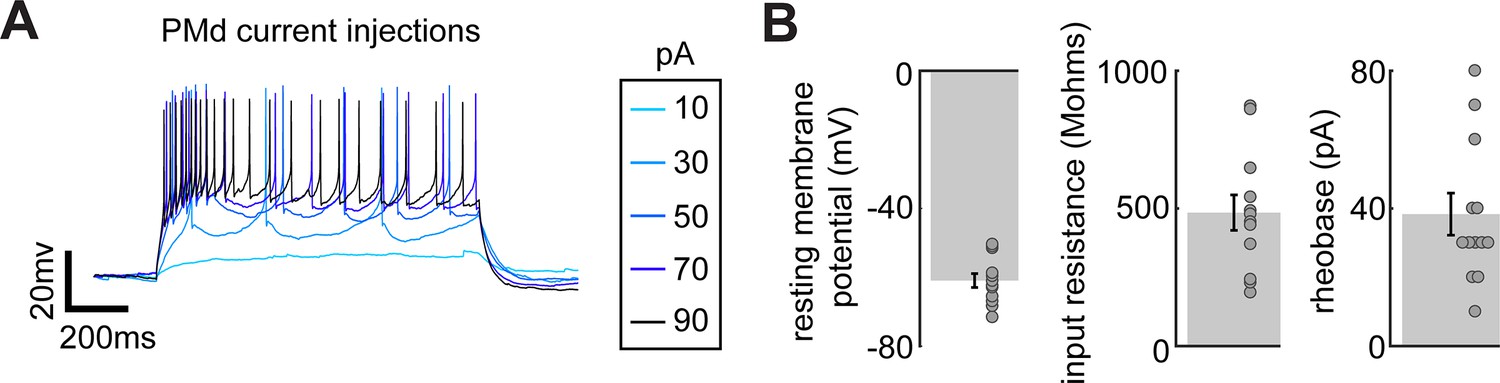
Characterization of PMd-cck cell biophysical properties in acute slices.
Mice from a cck-cre driver line were injected with cre-dependent viral vectors encoding YFP in the PMd. Acute slices were prepared from these mice and YFP-expressing cells in the PMd were used to measure biophysical properties of PMd-cck cells. (A) Injection of current triggers action potentials in PMd cells. (B) Average resting membrane potential, input resistance, and rheobase in PMd cells (n = 12 cells).
Figure 3
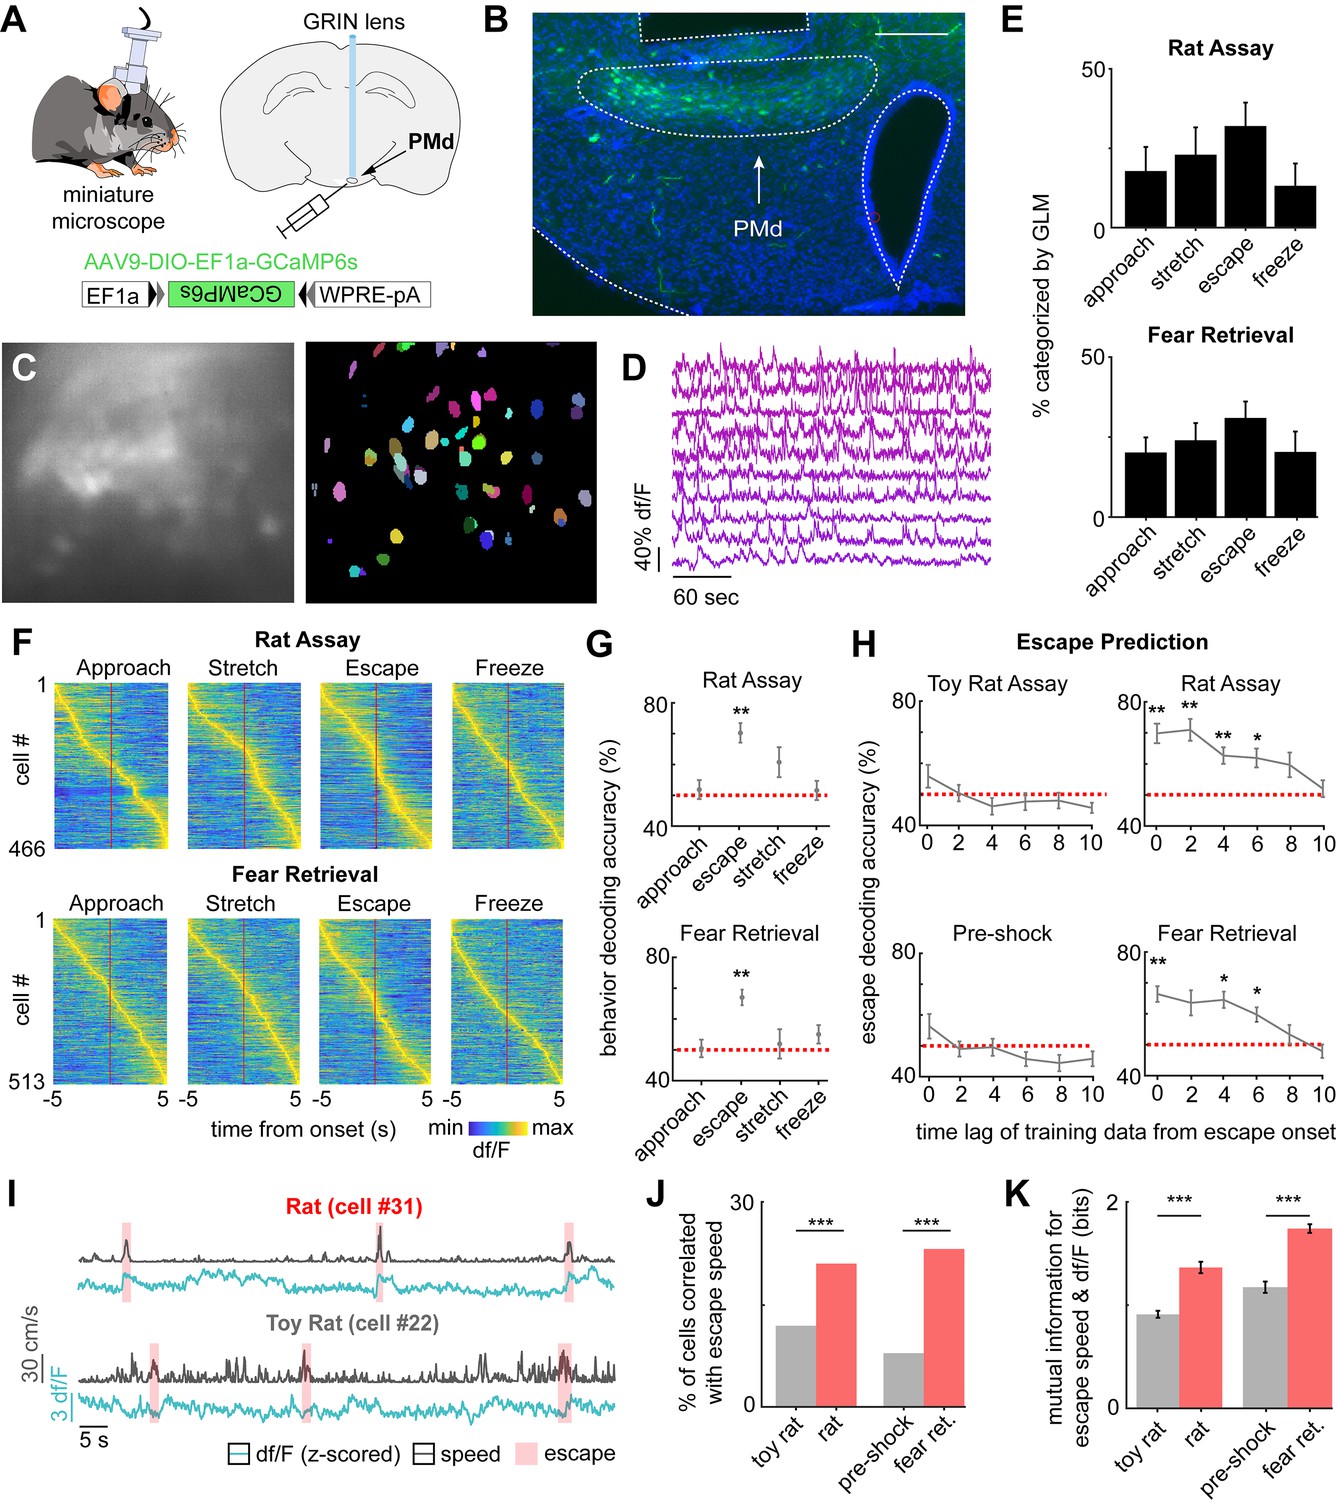
PMd-cck ensemble activity can predict escape in rat and shock grid fear retrieval assays.
(A) PMd-cck mice were injected with AAV9-DIO-EF1a-GCaMP6s in the PMd and then were implanted with a miniaturized microscope. (B) Photograph of the GCaMP6s in PMd-cck cells and location of implanted GRIN lens. (Scale bar 200 µm) (C) (Left) Maximum projection of the PMd field of view in an example mouse. (Right) Extracted cell contours for the same session. (D) Representative traces of a subset of calcium transients from GCaMP6s-expressing PMd-cck cells recorded in a single session. (E) Generalized linear models (GLMs) were used to determine GLM weights for defensive behaviors. Cells were classified as activated by each behavior based on their actual GLM weights compared to the distribution of weights generated by permuting the neural data. (n = 9 mice) (F) Colormaps show average activation for each PMd-cck cell for each scored behavior in the rat (top) and shock grid fear retrieval (bottom) assays. Cells are sorted by time of peak activation. (G) Ongoing escape, but not other behaviors, can be decoded by PMd-cck cell activity in the rat (top) and shock grid fear retrieval assays (bottom) (Mice that displayed less than five instances of a given behavior were removed from the analysis: [top] approach n = 7, stretch n = 6, escape n = 7, freeze n = 6; [bottom] approach n = 5, stretch n = 4, escape n = 5, freeze n = 3; Wilcoxon signed-rank test.) (H) PMd-cck cell activity can predict escape from threats, but not control stimuli, several seconds prior to escape onset. (Toy rat n = 8 mice, rat n = 7, pre-shock n = 5, fear retrieval n = 5). (n = 466 cells in rat assay, n = 513 cells in shock grid fear retrieval assay; Wilcoxon signed-rank test) (I) Traces show the z-scored df/F (blue) and speed (gray) for one cell classified as a speed cell in the rat exposure assay (top) and one non-correlated cell from the toy rat assay (bottom). Individual escape epochs are indicated by red boxes. (J) Bars show the percentage of cells that significantly correlate with escape speed. (Fisher’s exact test; toy rat: n correlated = 56, n non-correlated = 405; rat: n correlated = 100, n non-correlated = 366; pre-shock: n correlated = 50, n non-correlated = 571; fear retrieval: n correlated = 122, n non-correlated = 391) (K) Bars show the mutual information in bits between escape speed and calcium activity for cells whose signals were significantly correlated with escape speed in (J). (Wilcoxon rank-sum test; toy rat n = 56, rat n = 100; pre-shock n = 50, fear retrieval n = 122). ***p<0.001, **p<0.01, *p<0.05.
Figure 4 with 1 supplement
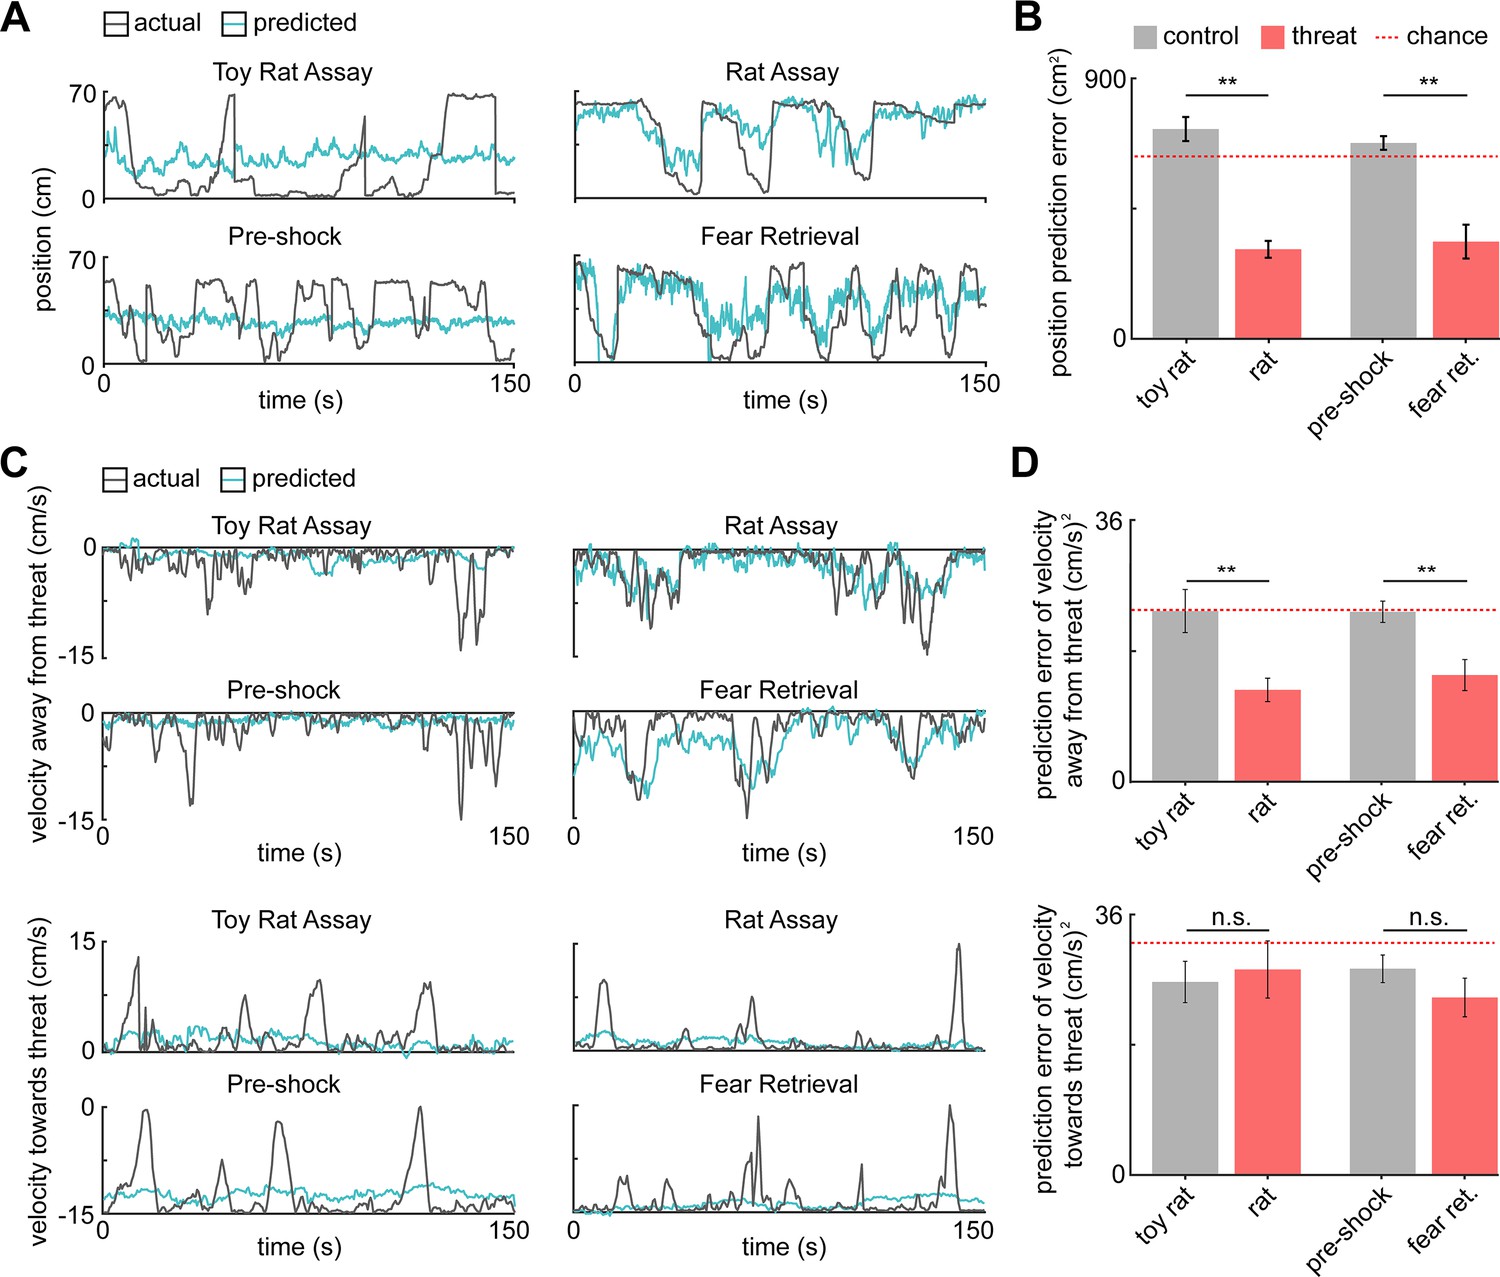
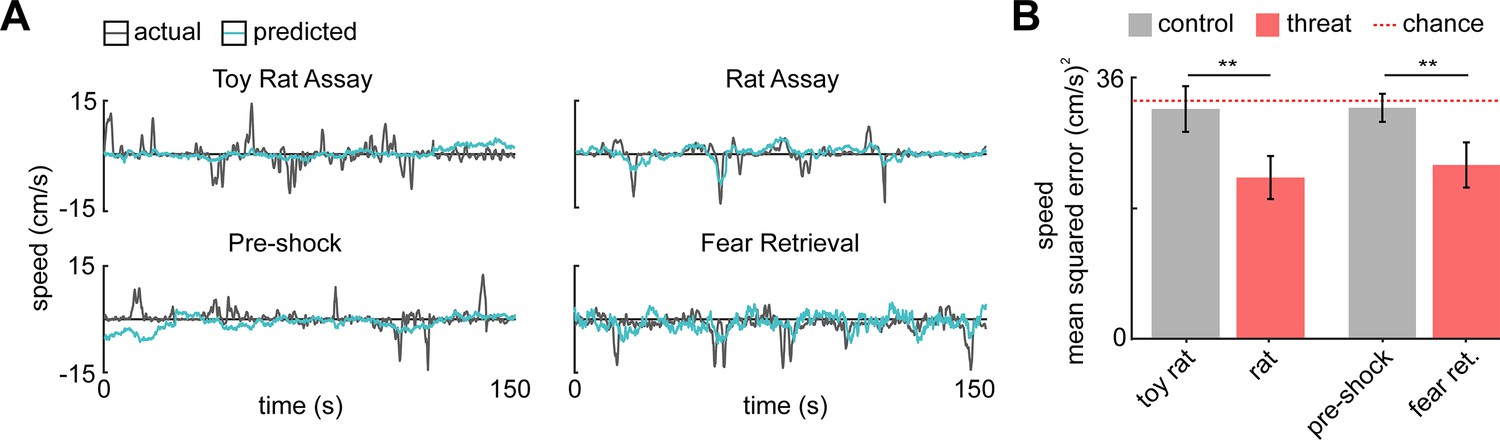
PMd ensemble activity represents distance from threat and escape velocity.
(A) A general linearized model (GLM) was used to decode the position of each animal along the length of the enclosure from the neural data. The line plots depict the actual location (gray line) and GLM-predicted location (blue line) from example toy rat/rat and pre-shock/fear retrieval sessions. Note that the predicted location is more accurate for threat than control assays. (B) Bars show the mean squared error (MSE) of the GLM-predicted location from the actual location. The MSE is significantly lower for threat than control assays (Wilcoxon signed-rank test; n = 9 mice). The dotted red line indicates chance error, calculated by training and testing the GLM on circularly permuted data. Only threat assay error was significantly lower than chance (Wilcoxon signed-rank test; rat p<0.001, fear retrieval p=0.003). (C) Similar to (A), a GLM was used to predict the velocity away from (top) and toward (bottom) the threat in a representative mouse. (D) Similar to (B), bars depict the MSE of the GLM-predicted velocity away from (top) and toward (bottom) the threat. The GLM more accurately decodes threat than control velocities for samples in which the mice move away from the threat (top). As in (B), only threat assay error was significantly lower than chance (Wilcoxon signed-rank test; rat p=0.004, fear retrieval p=0.012). The accuracy does not differ in threat and control assays for samples in which the mice move toward the threat (bottom). (Wilcoxon test; n = 9 mice) **p<0.01.
Figure 4—figure supplement 1
PMd ensemble activity represents speed in threat assays.
(A) A generalized linear model (GLM) was used to predict the speed of a representative mouse. (B) Bars depict the mean squared error of the GLM-predicted speed. The GLM more accurately decodes threat than control speeds. The dotted red line indicates chance error, calculated by training and testing the GLM on circularly permuted data. Only threat assay error was significantly lower than chance (rat p<0.020, fear retrieval p=0.040). (Wilcoxon signed-rank test; n = 9 mice) **p<0.01.
Figure 5 with 1 supplement
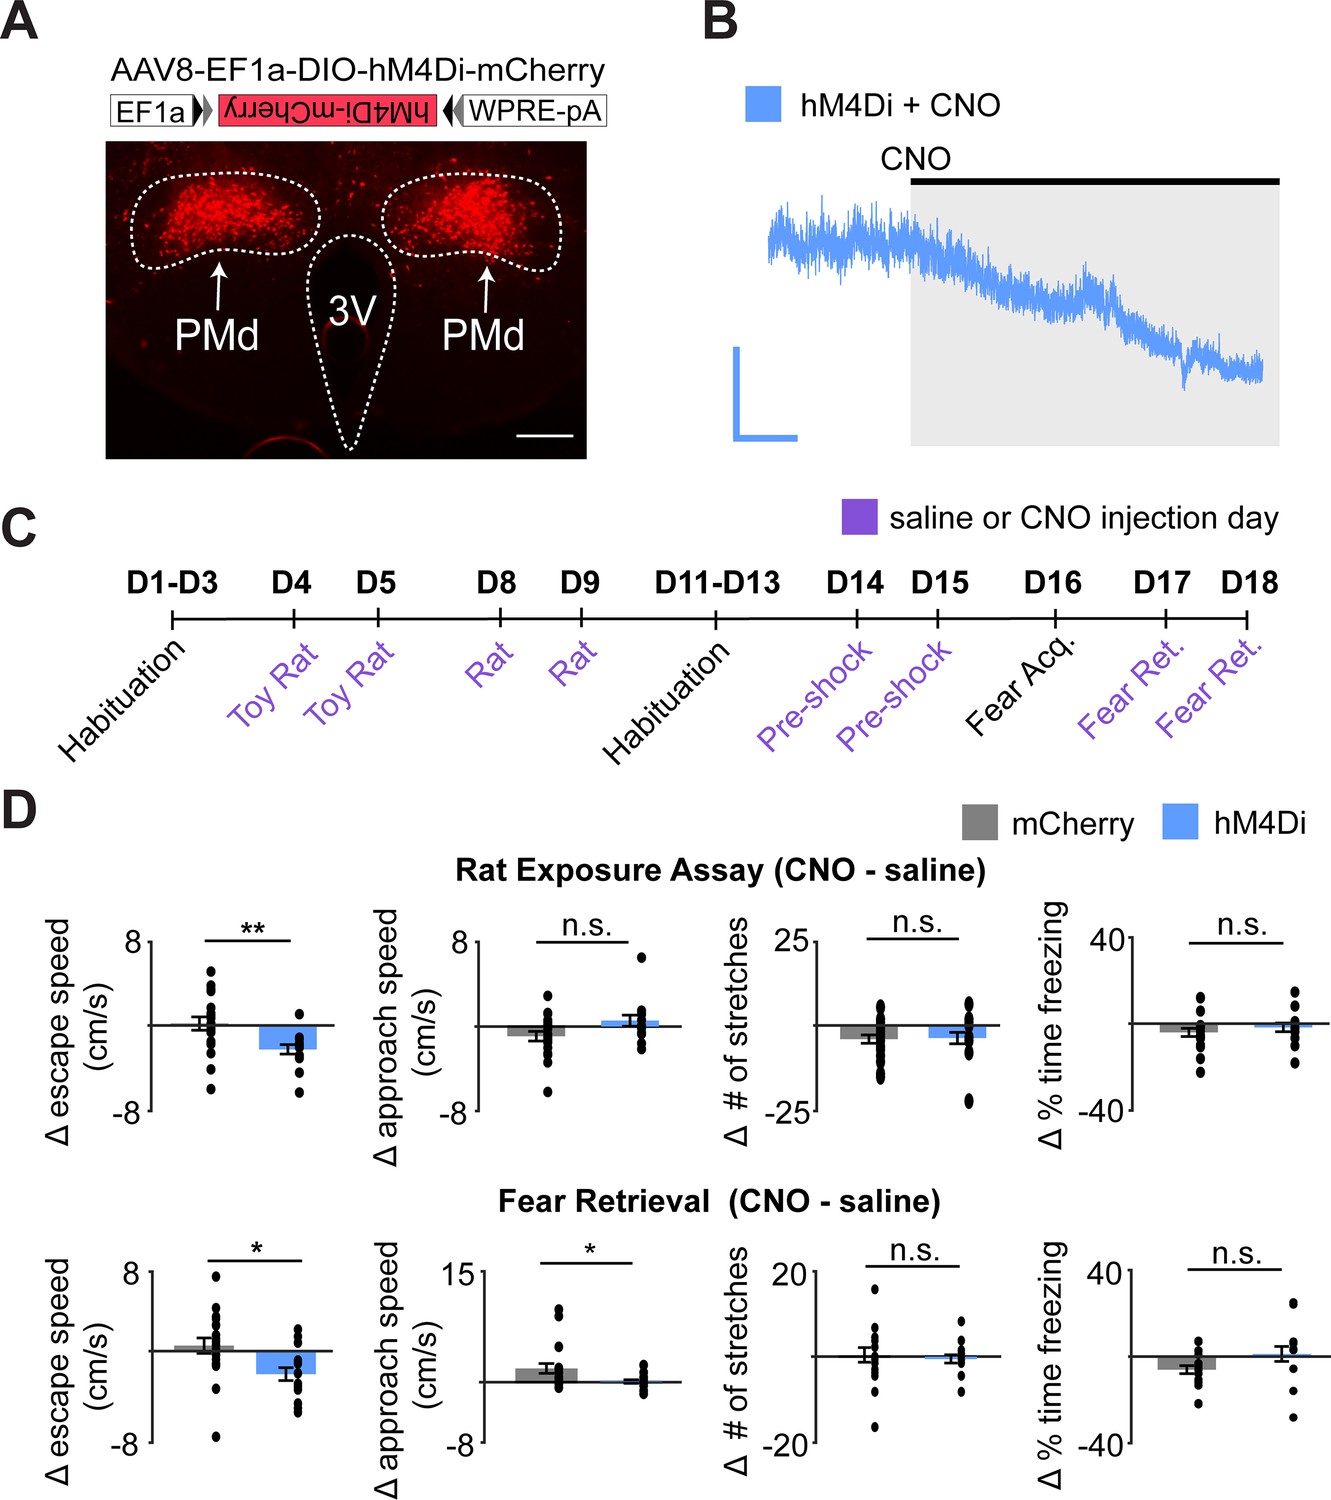
Chemogenetic inhibition of PMd-cck cells decreases escape speed from threats.
(A) Cck-cre mice were injected with cre-dependent vectors encoding hM4Di-mcherry or -mcherry in the PMd (top). Expression of hM4Di-mcherry in PMd-cck cells (bottom). (scale bar: 200 µm) (B) Ex vivo slice recordings showing that clozapine-N-oxide (CNO) hyperpolarized PMd-cck cells expressing hM4Di (scale bar: 60 s, 10 mV). (C) Mice were exposed to each assay twice, in the order shown, after receiving i.p. injections of either saline or CNO. (D) Inhibition of hM4Di-expressing PMd-cck cells decreased escape speed in the rat and fear retrieval assays. (rat exposure assay mCherry/hM4Di n = 19/n = 11; fear retrieval assay mCherry/hM4Di n = 19/n = 12; Wilcoxon signed-rank test) **p<0.01, *p<0.05.
Figure 5—figure supplement 1
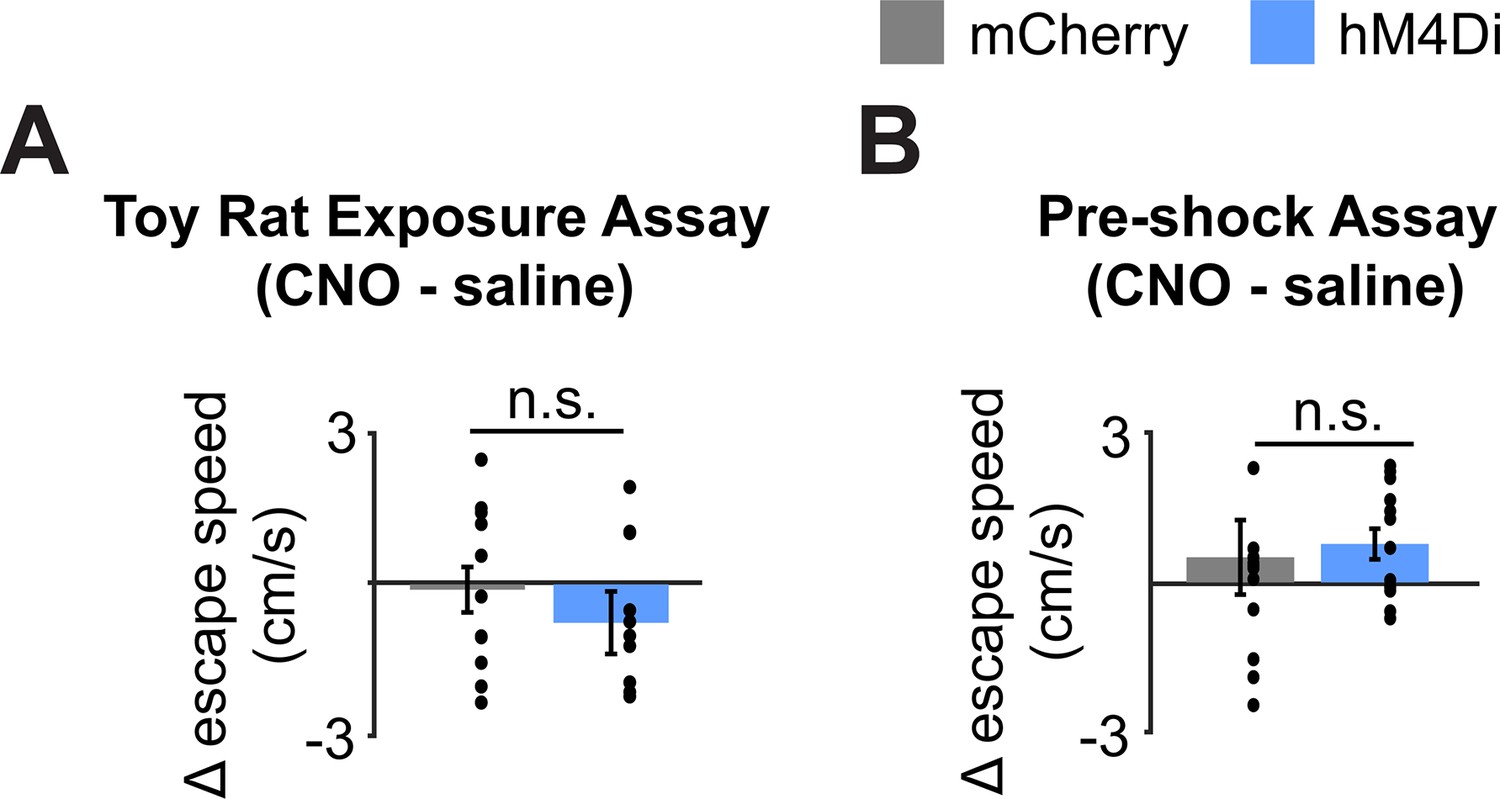
Inhibition of PMd-cck cells does not affect escape speed in control assays.
(A) Bars depict the change in escape speed (CNO-saline) during toy rat exposure assay (Wilcoxon rank-sum test; mCherry/hM4Di n = 7/n = 8). (B) Bars depict the change in escape speed (CNO-saline) during pre-shock assay (Wilcoxon rank-sum test; mCherry/hM4Di n = 7/n = 12).
Figure 6
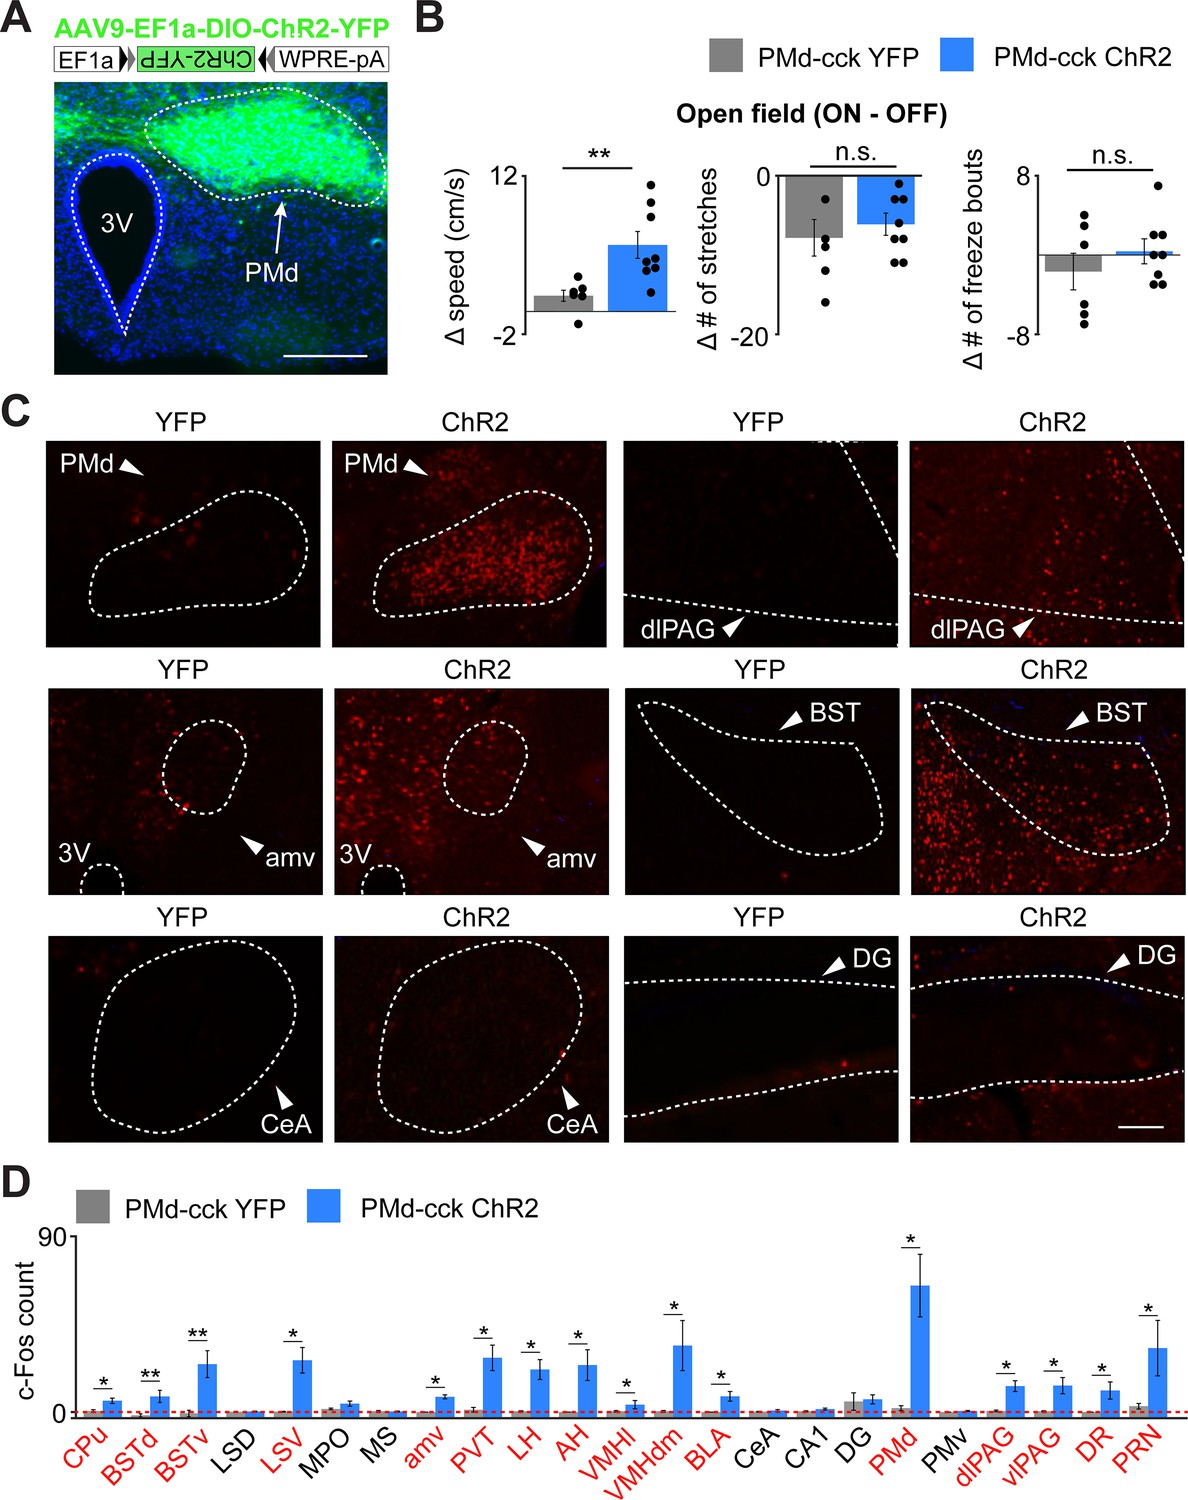
Optogenetic PMd-cck activation increases velocity and recruits widespread defensive networks.
(A) Cck-cre mice were injected with AAV9-Ef1a-DIO-ChR2-YFP in the PMd (top). Expression of Chr2-YFP in PMd-cck cells (bottom; scale bar: 200 µm). (B) Delivery of blue light increases speed in PMd-cck ChR2 mice, but not stretch-attend postures or freeze bouts. (PMd-cck YFP n = 6, PMd-cck ChR2 n = 8; Wilcoxon rank-sum test). (C) Following optogenetic activation of PMd-cck cells, mice were perfused and stained with antibodies against the immediate early gene cfos. Representative images show that blue light delivery caused increased fos expression in the PMd, bed nucleus of the stria terminalis (BST) and anteromedial ventral thalamus (amv). Other regions, such as the central amygdala (Cea) and the dentate gyrus (DG) did not show increased fos expression following PMD-cck optogenetic stimulation. (scale bar: 100 µm) (D) Average number of fos-expressing cells in various brain regions following light delivery to ChR2 (blue) or YFP (gray)-expressing cells. Regions for which the c-Fos count is significantly greater for ChR2 than YFP mice are labeled in red. (Wilcoxon rank-sum test; for all regions, PMd-cck YFP n = 5, PMd-cck ChR2 n = 4 except for BSTd and BSTv: YFP n = 8, ChR2 n = 8) *p<0.05, **p<0.01. Abbreviations: CPu (caudate-putamen), BSTd/v (dorsal and ventral bed nucleus of the stria terminalis), LS D/V (dorsal and ventral lateral septum), MPO (medial preoptic area), amv (anteromedial ventral thalamus), PVT (paraventricular nucleus of the hypothalamus), LH (lateral hypothalamus), AH (anterior hypothalamus), VMHvl/dm (ventrolateral and dorsomedial portions of the ventromedial hypothalamus), BLA (basolateral amygdala), CeA (central amygdala), CA1 (hippocampal cornus ammonis 1), DG (dentate gyrus), PMd (dorsal premammillary nucleus), PMv (ventral premammillary nucleus), dlPAG (dorsolateral periaqueductal gray), vlPAG (ventrolateral periaqueductal gray), DR (dorsal Raphe), PRN (pontine reticular nucleus).
Figure 7
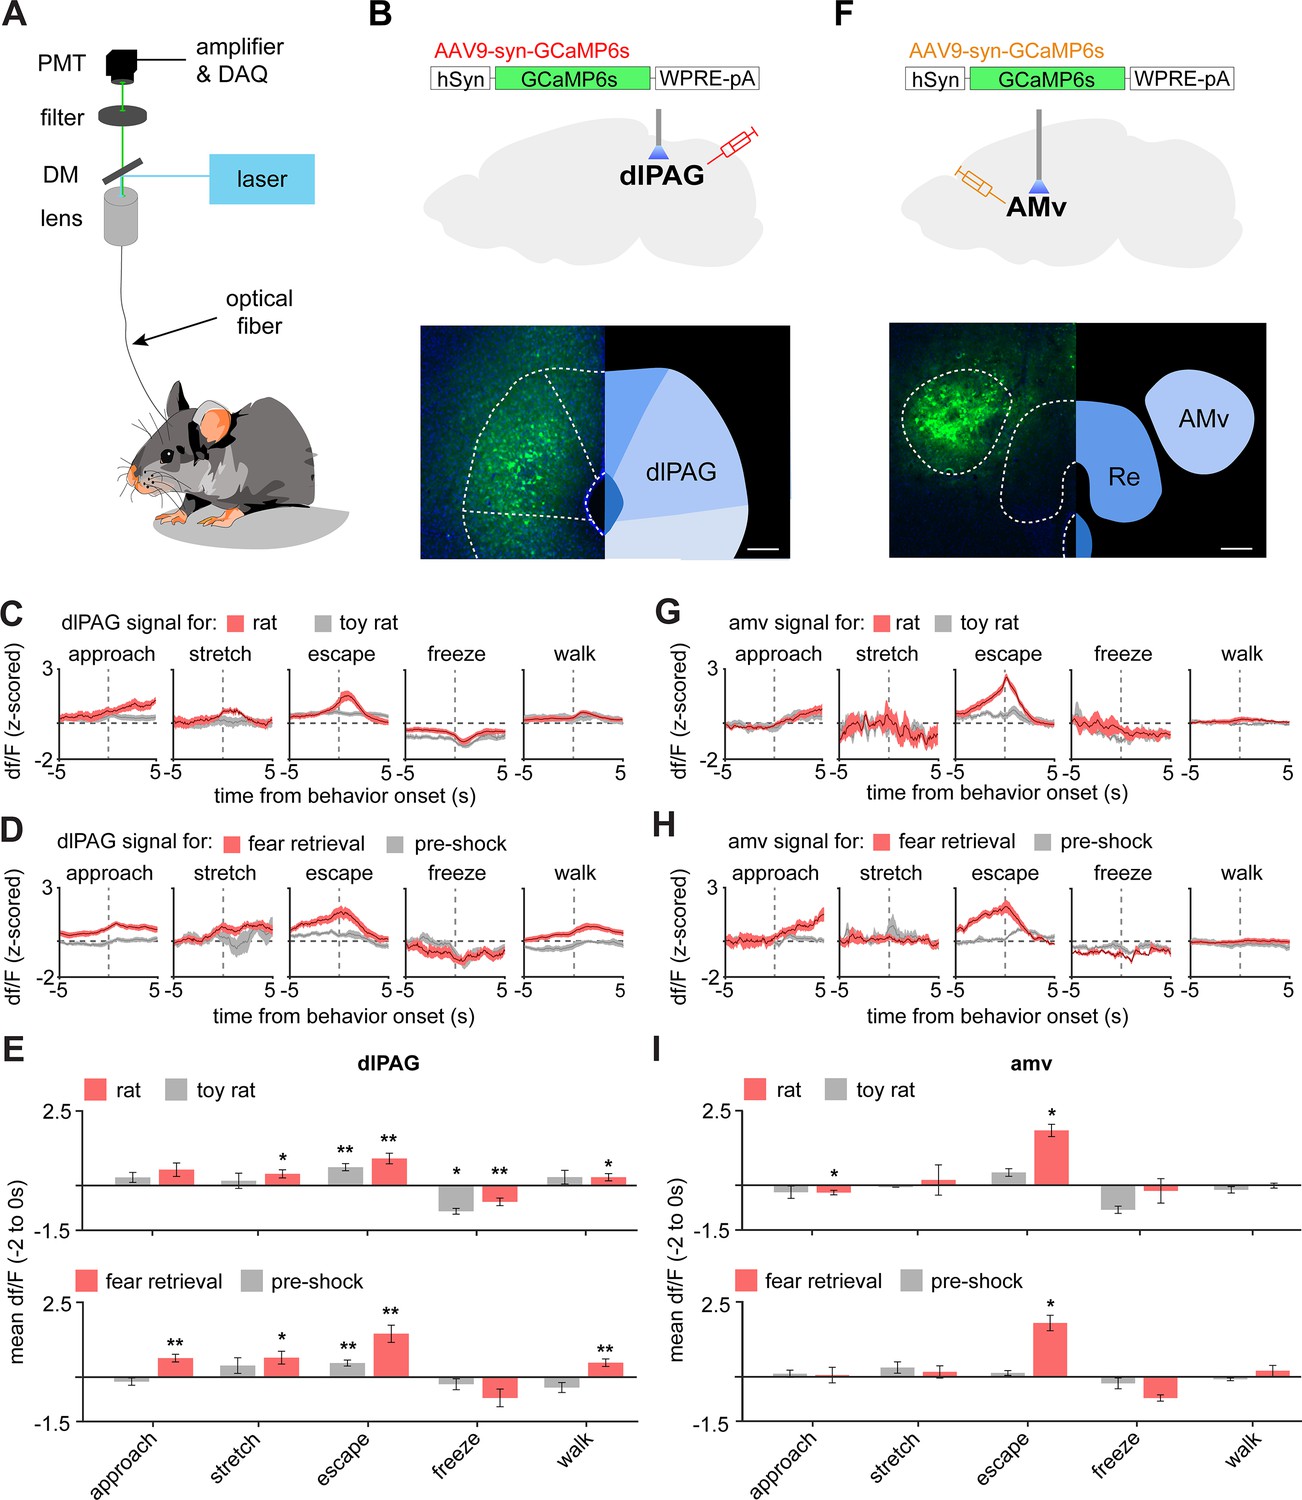
The dlPAG and AMV are activated by threats and escape.
(A) Scheme showing setup used to obtain fiber photometry recordings. (B) Expression of GCaMP6s in the dlPAG. (Scale bar: 150 µm) (C) Behavior-triggered average showing mean dlPAG activity during approach to rat, risk-assessment stretch-attend postures, escape, freeze, and walking perpendicularly to the rat at the safe side of the enclosure. (n = 9 mice) (D) Same as (C), but during exposure to the fear retrieval shock grid assay. (n = 9 mice) (E) Bars show the mean df/F from –2 to 0 s from behavior onset for threat (red) and control (gray) assays. (n = 9 mice). (F–I) Same as (B–E), but for the amv. (F) Scale bar: 150 µm (G–I) n = 6 mice. (E,F) Wilcoxon signed-rank test; **p<0.01, *p<0.05.
Figure 8
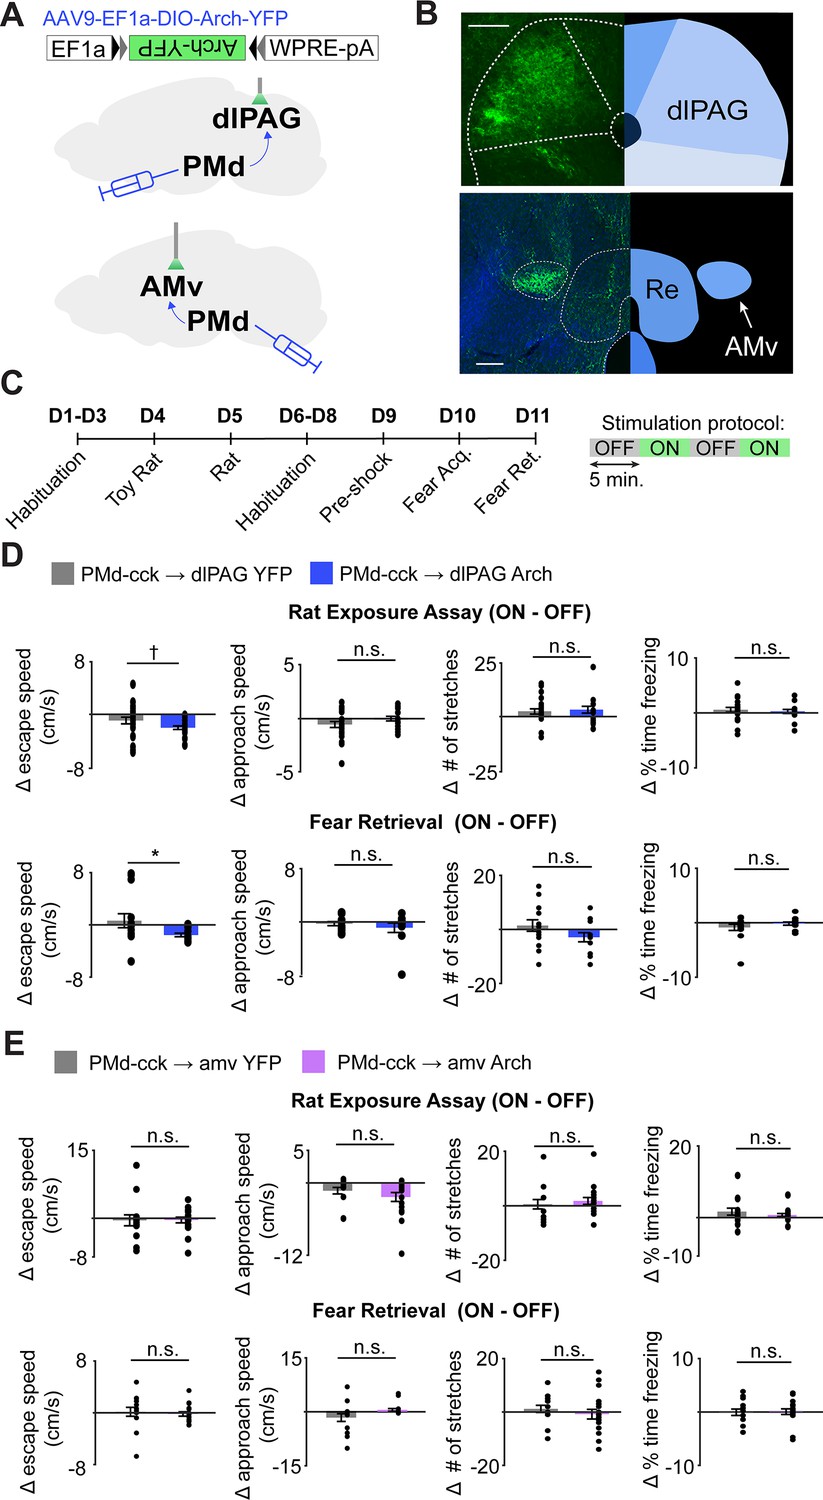
Optogenetic inhibition of the PMd-cck projection to the dlPAG, not the amv, decreases escape velocity during exposure to innate and conditioned threats.
(A) Viral vectors were used to express Arch in PMd-cck cells. Fiber optic cannula were bilaterally implanted over PMd-cck arch-expressing axon terminals in the amv or dlPAG. (B) Image showing PMd-cck axon terminals expressing arch-YFP in the dlPAG and amv. (Scale bars: 150 µm) (C) Summary diagram showing order of assays and green light delivery protocol. (D) Inhibition of the PMd-cck projection to the dlPAG decreased escape speed, but not other defensive behaviors. (Wilcoxon rank-sum test; (top) rat exposure assay: YFP/Arch n = 24/n = 12; (bottom) fear retrieval: YFP/Arch n = 14/n = 11) (E) Inhibition of the PMd-cck projection to the amv did not alter any of the behavioral measures monitored. (Wilcoxon rank-sum test; (top) rat exposure assay: YFP/Arch n = 12/n = 18; (bottom) fear retrieval: YFP/Arch n = 12/n = 17), *p<0.05; †p=0.058.
Figure 9 with 1 supplement
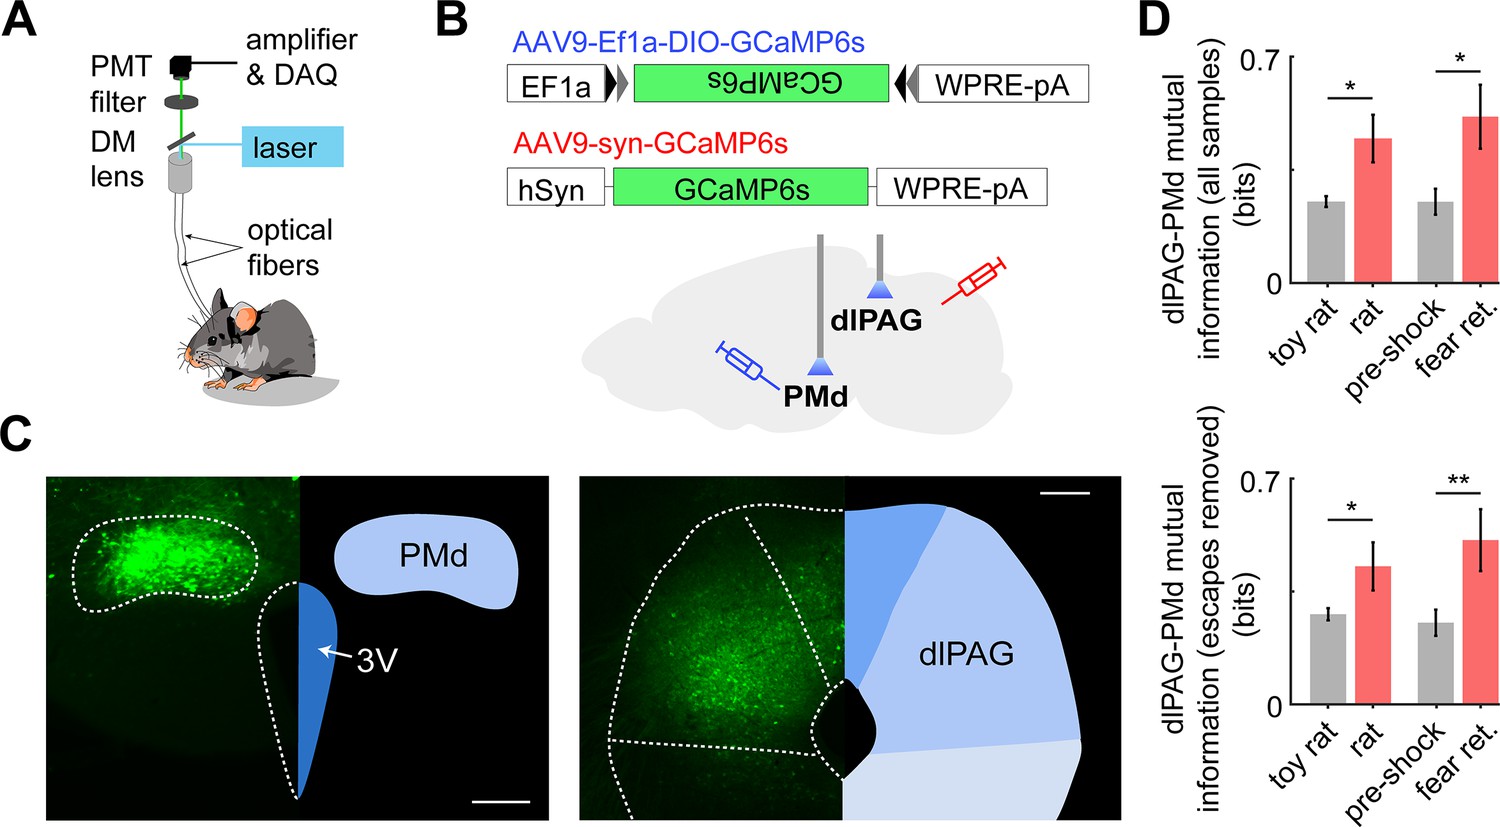
Dual fiber photometry signals from the PMd and dlPAG exhibit increased mutual information during threat exposure.
(A) Scheme showing setup used to obtain dual fiber photometry recordings. (B) PMd-cck mice were injected with AAV9-Ef1a-DIO-GCaMP6s in the PMd and AAV9-syn-GCaMP6s in the dlPAG. (C) Expression of GCaMP6s in the PMd and dlPAG. (Scale bars: [left] 200 µm, [right] 150 µm) (D) Bars show the mutual information between the dual-recorded PMd and dlPAG signals, both including (left) and excluding (right) escape epochs, during exposure to threat and control. Mutual information is an information theory-derived metric denoting the amount of information obtained for one variable by observing another variable. See Materials and methods section for more details. *p<0.05, **p<0.01.
Figure 9—figure supplement 1
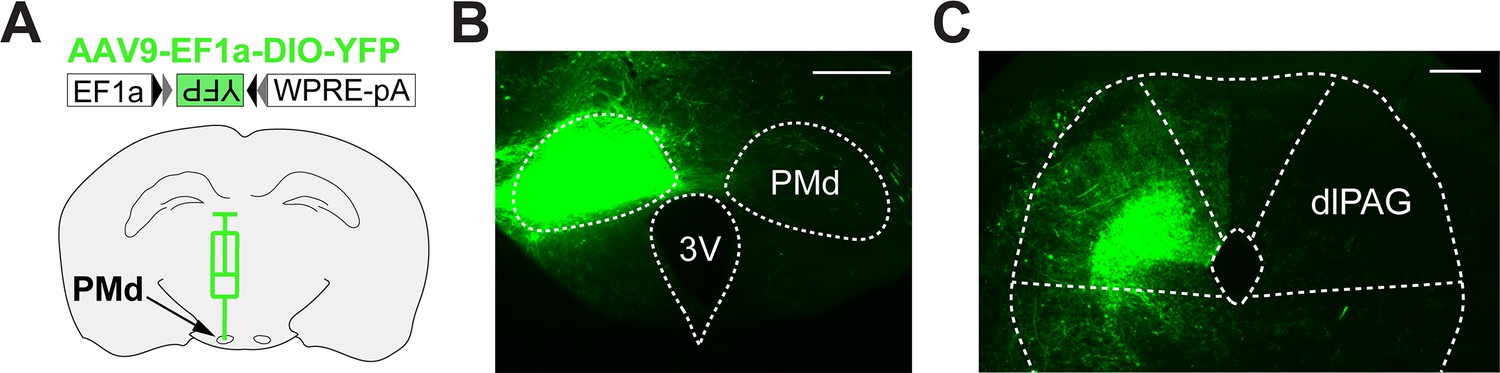
PMd-cck neurons project unilaterally to the dlPAG.
(A) Cck-cre mice were injected with AAV9-Ef1a-DIO-YFP in the left PMd. (B) Image shows the expression of YFP in PMd-cck cells only in the left side. (scale bar: 200 µm) (C) PMd-cck axon terminals unilaterally express YFP in the dlPAG only on the left side. (scale bar: 150 µm).
Figure 10 with 1 supplement
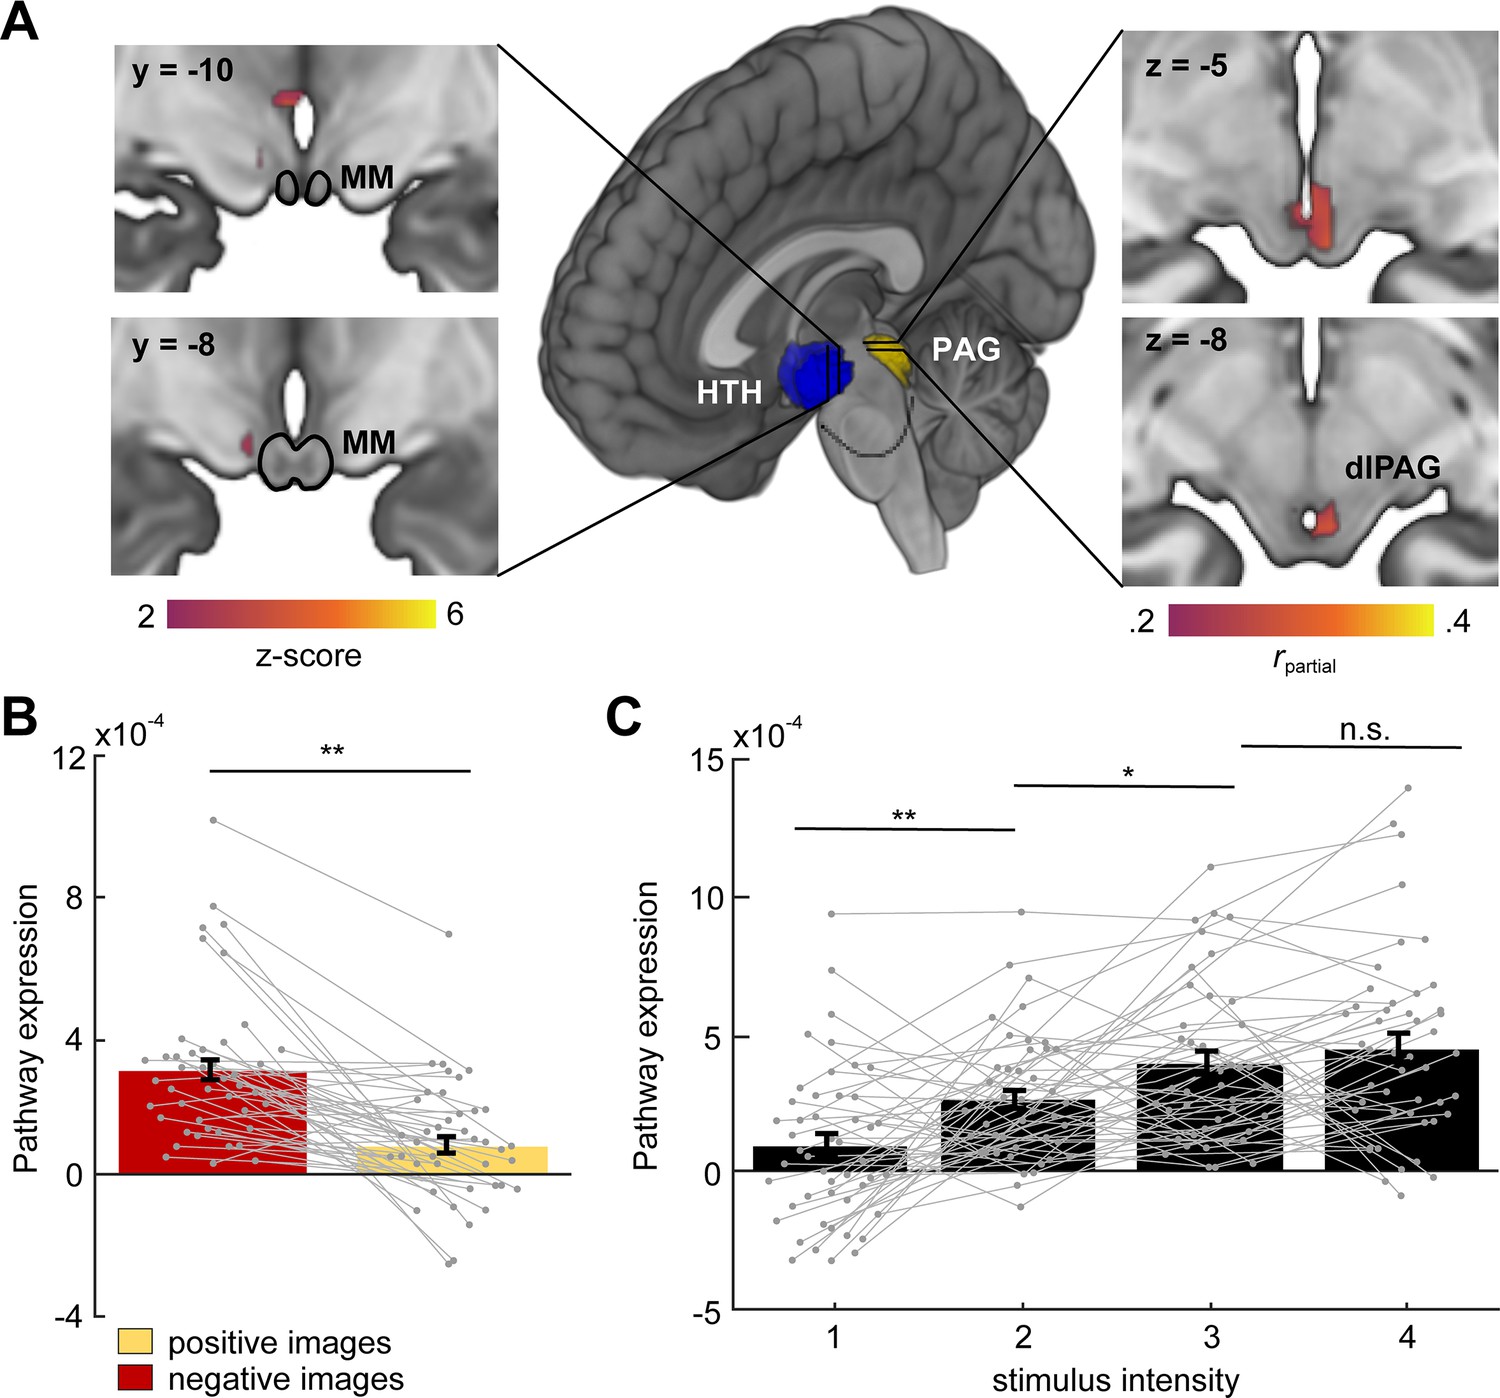
Hypothalamus (HTH)–PAG pathway is sensitive to aversive visual stimuli in humans.
(A) Multivariate brain pathway estimated using activation in the hypothalamus (HTH, rendered in blue) to predict patterns of activation in the periaqueductal gray (PAG, rendered in yellow). Inserts depict statistical maps indicating which regions of the HTH covaried most strongly with the PAG (left) and portions of dorsal PAG (dlPAG) that were explained by the HTH but not a pathway from the central amygdala. The mammillary bodies (MM) are depicted with a black outline. Note that all hypothalamus voxels are included in the model, only suprathreshold voxels are shown here. (B) Average bar plot showing that the HTH–PAG pathway was more active during exposure to threat (aversive visual images) compared to control stimuli (non-aversive, positive images). Each circle corresponds to an individual subject. (C) Pathway expression monotonically increased as a function of stimulus intensity. Inference on brain maps is based on bootstrap resampling of regression coefficients from pathway estimation (left) and partial correlation coefficients (right). All maps are thresholded at qFDR < 0.05. (Wilcoxon signed-rank test, n = 48 participants) **p<0.001, *p<0.01.
Figure 10—figure supplement 1
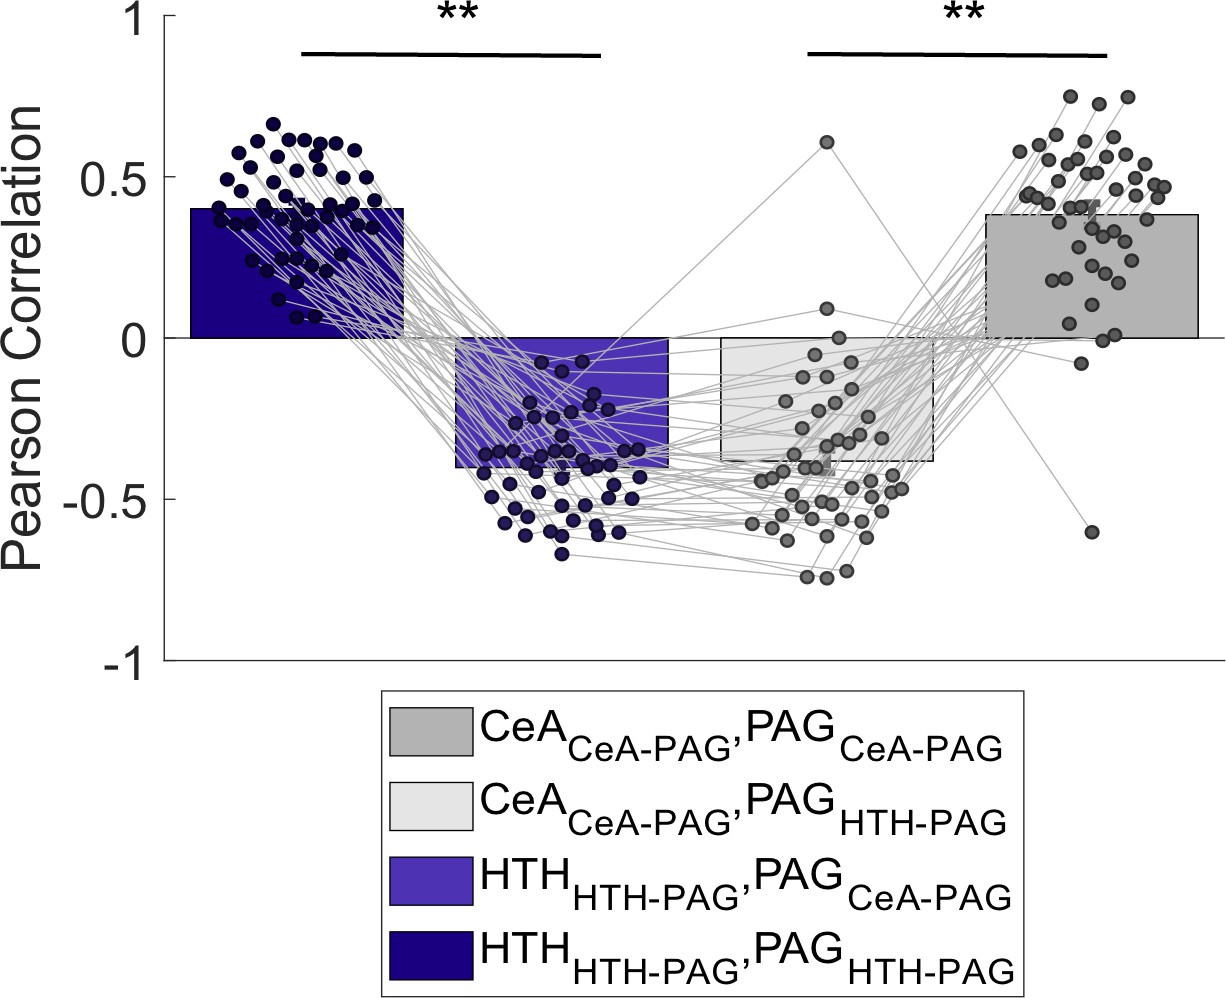
Multi-voxel response patterns in the PAG related to hypothalamus (HTH) and central amygdala (CeA) are functionally distinct.
The HTH pattern optimized for PAG connectivity ([HTHHTH-PAG]) correlates positively with its respective PAG pattern ([PAGHTH-PAG]) in 100% of test subjects (dark blue), but negatively with a PAG pattern optimized to covary with CeA ([PAGCeA-PAG]; light blue). Conversely, the CeA pattern optimized for PAG connectivity ([CeACeA-PAG]) correlates positively with its respective PAG pattern in in >90% of test subjects ([PAGCeA-PAG]; dark gray), but negatively with a PAG pattern optimized to covary with HTH ([PAGHTH-PAG]; light gray). This double dissociation shows that the HTH–PAG and CeA–PAG pathways are functionally distinct in human participants, and even oppose one another. Each circle corresponds to an individual subject. Wilcoxon signed-rank test; **p<0.001. (n = 48 participants).
Author response image 1

(A) Three different distributions were selected to represent a variety of non-normal populations (n=1000).
The γ distribution was generated using shape parameter 6 and scale parameter 3. The chi-square distribution plotted has 6 degrees of freedom. The bimodal gaussian distribution has two normal distributions with standard deviation of 1 and means of 6 and 10. (B) Twelve points were selected from each distribution 1000 times, with replacement. Each sample with n=12 points was classified as normal or non-normal by the Lilliefors test for normality. The percent of samples (n=12 points per sample) to pass the Lilliefors normality test is represented by the gray portion of each pie chart. Note that in the vast majority of trials samples selected from non-normal distributions are not classified as significantly non-normal.
Tables
Author response table 1
Rheobase and membrane input resistance of PMd and commonly studied cell types.
Note that relative to many other cell types PMd cells have relatively low rheobase and high membrane input resistance. Data Source: PMd-cck ((Wang et al., 2021), current report); CA1 (Luque et al., 2017); Striatal medium spiny neurons (Fino et al., 2007); Barrel cortex (Lefort et al., 2009).
| Rheobase (pA) | Input Resistance (MOhms) | |
|---|---|---|
| PMd cck | 38.3± 6.1 | 484±64 |
| Dorsal Hippocampus CA1 | 76.64±11.68 | 151.8±6.90 |
| Striatal medial spiny neurons | 155±6 | 251±11 |
| Barrel cortex (L2 layer) | 126±3 | 188±3 |
| Barrel cortex (L3 layer) | 132±4 | 193±5 |
| Barrel cortex (L4 layer) | 56±1 | 302±4 |
| Barrel cortex (L5a layer) | 68±2 | 210±3 |
| Barrel cortex (L5b layer) | 98±3 | 162±5 |
| Barrel cortex (L6 layer) | 76±3 | 277±4 |
Additional files
Download links
A two-part list of links to download the article, or parts of the article, in various formats.
Downloads (link to download the article as PDF)
Open citations (links to open the citations from this article in various online reference manager services)
Cite this article (links to download the citations from this article in formats compatible with various reference manager tools)
Dorsal premammillary projection to periaqueductal gray controls escape vigor from innate and conditioned threats
eLife 10:e69178.
https://doi.org/10.7554/eLife.69178


