Endothelial SIRPα signaling controls VE-cadherin endocytosis for thymic homing of progenitor cells
- The Key Laboratory of Infection and Immunity, Institute of Biophysics, Chinese Academy of Sciences, China
- College of Life Sciences, University of the Chinese Academy of Sciences, China
Figures
Figure 1 with 1 supplement
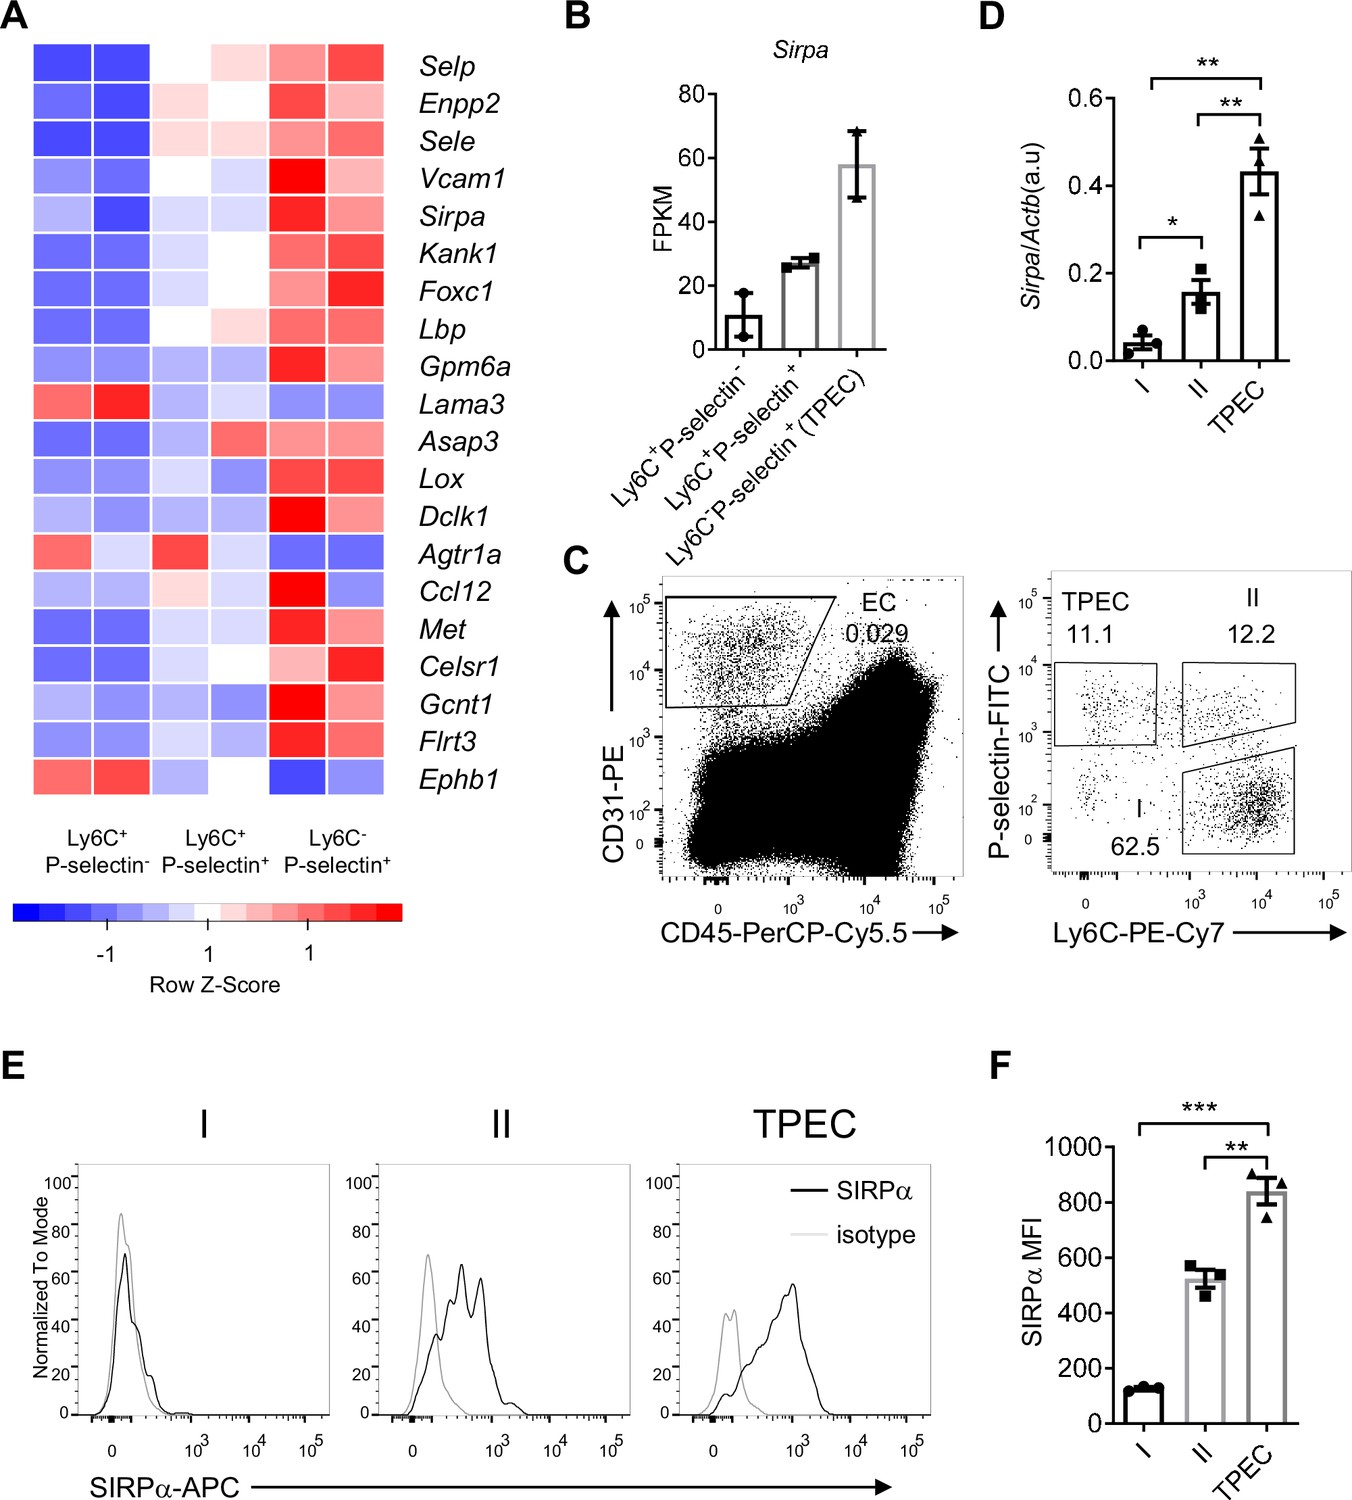
Signal regulatory protein alpha (SIRPα) is preferentially expressed on thymic portal endothelial cells (TPECs).
(A) Expression profile of top 20 signature genes of Ly6C-Selp+ ECs (TPECs), which have absolute FC > 2 and p < 0.01 in TPECs versus either Ly6C+Selp- or Ly6C+Selp+ thymic EC subsets and are in GO term GO_0016477 (cell migration). Relative expression of each gene among EC subsets are presented as mean-centered z-score distribution. (B) Expression level of Sirpa among the three thymic EC subsets. FPKM: fragments per kilobase per million mapped reads. (C) Flow cytometric analysis of thymic ECs (CD31+CD45-) and subset I (Ly6C+Selp-), subset II (Ly6C+Selp+), and subset III (TPEC, Ly6C-Selp+). (D) Real-time PCR analysis of Sirpa mRNA expression in thymic EC subsets, n = 3, each dot represents sample from individual mouse, data are representative of two independent experiments. (E–F) Flow cytometry analysis of SIRPα expression on the three thymic EC subsets (E) and quantification of measuring mean fluorescence intensity of SIRPα (F), data are representative of three independent experiments with three biological replicates (n=3) in each group. Error bars represent s.e.m. Asterisks mark statistically significant difference, *p < 0.05, **p < 0.01, and ***p < 0.001 determined by two-tailed unpaired Student’s t-test. Source data and detailed method for generating heatmap in A are available in Figure 1—source data 1. FPKM table for GSE_83114 is available in Supplementary file 1.
-
Figure 1—source data 1
Source data file for Figure 1.
- https://cdn.elifesciences.org/articles/69219/elife-69219-fig1-data1-v1.xlsx
Figure 1—figure supplement 1

Signal regulatory protein alpha (SIRPα) expression on thymic portal endothelial cells (TPECs).
(A) Representative imaging of CD31+Ly6C- TPECs with or without the structure of perivascular space (PVS). The left panel showed a complete cross section of a blood vessel with all fluorescence channels merged, the yellow outline is generated by ImageJ Wand (Tracing) tool with minimum tolerance setting in the Legacy mode, if one vessel has several parts, these parts are combined in ROI manager. The mean intensity of SIRPα in the above region of interest was measured. The right panel shows the same region as in the left panel, only Collagen-IV and CD31 channels are shown for a clearer view of the PVS (white arrowhead). (B) Statistical analysis of mean SIRPα intensity on the two types of TPECs. Each dot represents one area of blood vessel, data are representative of two independent expriments. Sections were pooled from three mice in each expriments. Seven sections in regions w/PVS, and nine sections in regions without PVS were identified and used for analysis. Horizontal dashed line indicates isotype level. (C) SIRPα mean fluorescence intensity (MFI) on TPECs of wild type (WT) or Ltbr-/- mice, n = 3, data are representative of two independent experiments. (D) SIRPα MFI on TPECs at day 14 after 5.5 Gy total body sublethal irradiation induced thymic injury, n = 3, data are representative of two independent experiments. Error bars represent s.e.m., n.s. not significant difference by two-tailed unpaired Student’s t-test. Source data are available in Figure 1—figure supplement 1—source data 1.
-
Figure 1—figure supplement 1—source data 1
Source data file for Figure 1-figure supplement 1.
- https://cdn.elifesciences.org/articles/69219/elife-69219-fig1-figsupp1-data1-v1.xlsx
Figure 2 with 2 supplements

Signal regulatory protein alpha (SIRPα) is essential for early T cell progenitor (ETP) population maintenance, thymic progenitor homing, and proper T cell development.
(A) Representative flow cytometric analysis of ETPs (lineage-CD25-CD44+cKit+) in the thymus of Sirpa-/- and control mice. (B) Proportion of ETP population of total thymocytes and corresponding cell number in a thymus. n = 4 in each group, data are representative of three independent experiments. (C) Flow cytometric analysis of ETPs in Sirpa TEK-CKO mice. (D) Statistics of ETPs in the thymus, n = 4 in each group, data are representative of three independent experiments. (E) Representative flow cytometric analysis of ETPs (lineage-CD25-CD44+cKit+) in wild type (WT) bone marrow reconstituted WT or Sirpa-/- mice. (F) Statistics of ETPs in the thymus, n = 4 in each group, data are representative of two independent experiments. (G,H) Whole bone marrow short-term homing assay in WT bone marrow reconstituted (8 weeks after lethal irradiation and bone marrow transplant) WT or Sirpa-/-mice. (G) Analysis of lineage-negative donor cells (Lin-CFSE+) among total thymocytes. (H) Statistics of lineage-negative donor cells in the thymus. n = 4 in each group, data are representative of two independent experiments. (I) Statistics of Lin- CD45.1+ donor cells in the thymus 48 hr after adoptive transfer. n = 3 in each group, data are representative of two independent experiments. (J,K) Statistics of donor-derived thymocyte subsets (J) and total CD45.1+ cell numbers (K) in the recipient thymus. Lin- BMCs were transferred as in (I), 3 weeks later, donor-derived thymocytes were detected. n = 3 in each group, data are representative of two independent experiments. Error bars represent s.e.m. Asterisks mark statistically significant difference, *p < 0.05, ***p < 0.001, ****p < 0.0001, n.s. not significant, determined by two-tailed unpaired Student’s t-test. Source data are available in Figure 2—source data 1.
-
Figure 2—source data 1
Source data file for Figure 2.
- https://cdn.elifesciences.org/articles/69219/elife-69219-fig2-data1-v1.xlsx
Figure 2—figure supplement 1
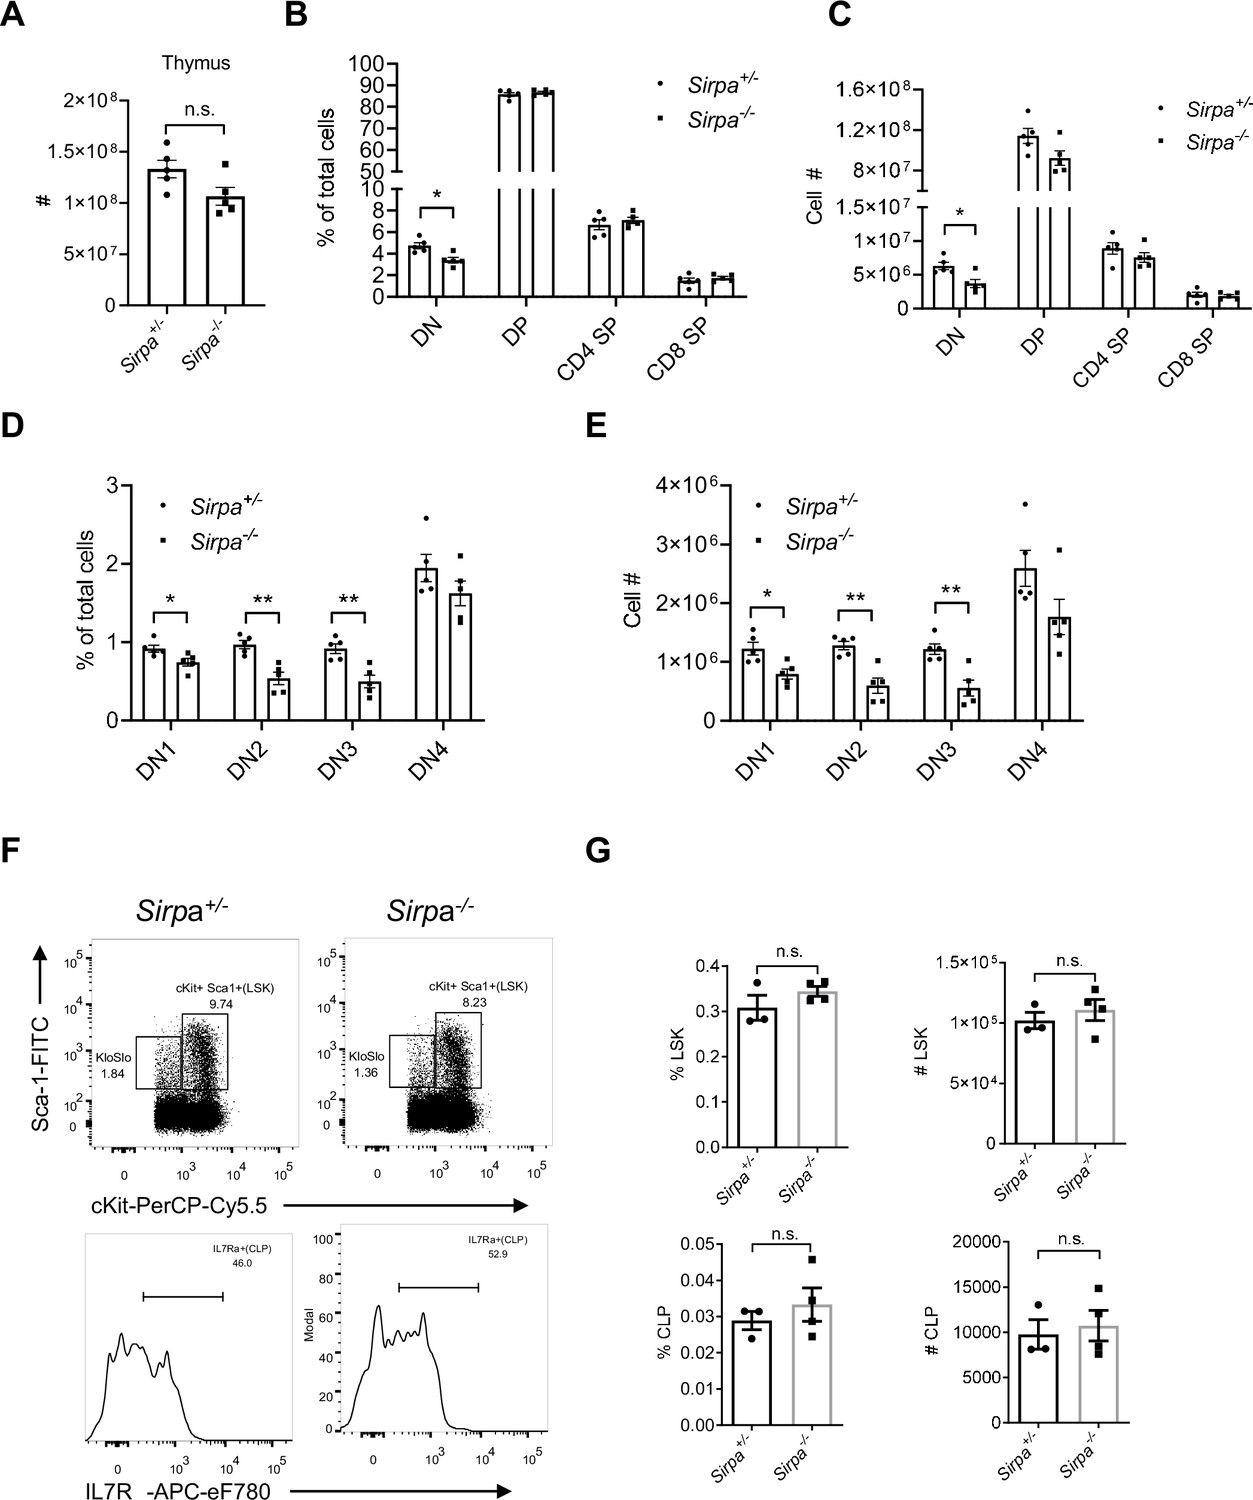
Signal regulatory protein alpha (SIRPα) deficiency has minor effect on T cell development at steady state.
(A–C) Cellularity of the thymus (A), proportion (B), and total cell number (C) of major thymocyte subsets (DN, double negative, DP, double positive, CD4 SP, CD4 single positive, and CD8 SP, CD8 single positive) among total thymocytes in Sirpa-/- and control mice, n = 5 in each group. (D,E) Proportion (D) and total cell number (E) of double negative thymocyte subsets (DN1, DN2, DN3, and DN4), n = 5 in each group. (F) Analysis of LSKs (lineage-Sca1+cKit+) and CLPs (lineage-Sca1locKitloFlt3+IL7Rα+) in the bone marrow. (G) Proportion and total cell number of LSK and CLP in a pair of femurs and tibias, n = 3 in Sirpa+/- group and n = 4 in Sirpa-/- group. Data are representative of three independent experiments. Error bars represent s.e.m. Asterisks mark statistically significant difference, *p < 0.05, n.s. not significant, determined by two-tailed unpaired Student’s t-test. Source data are available in Figure 2—figure supplement 1—source data 1.
-
Figure 2—figure supplement 1—source data 1
Source data file for Figure 2-figure supplement 1.
- https://cdn.elifesciences.org/articles/69219/elife-69219-fig2-figsupp1-data1-v1.xlsx
Figure 2—figure supplement 2
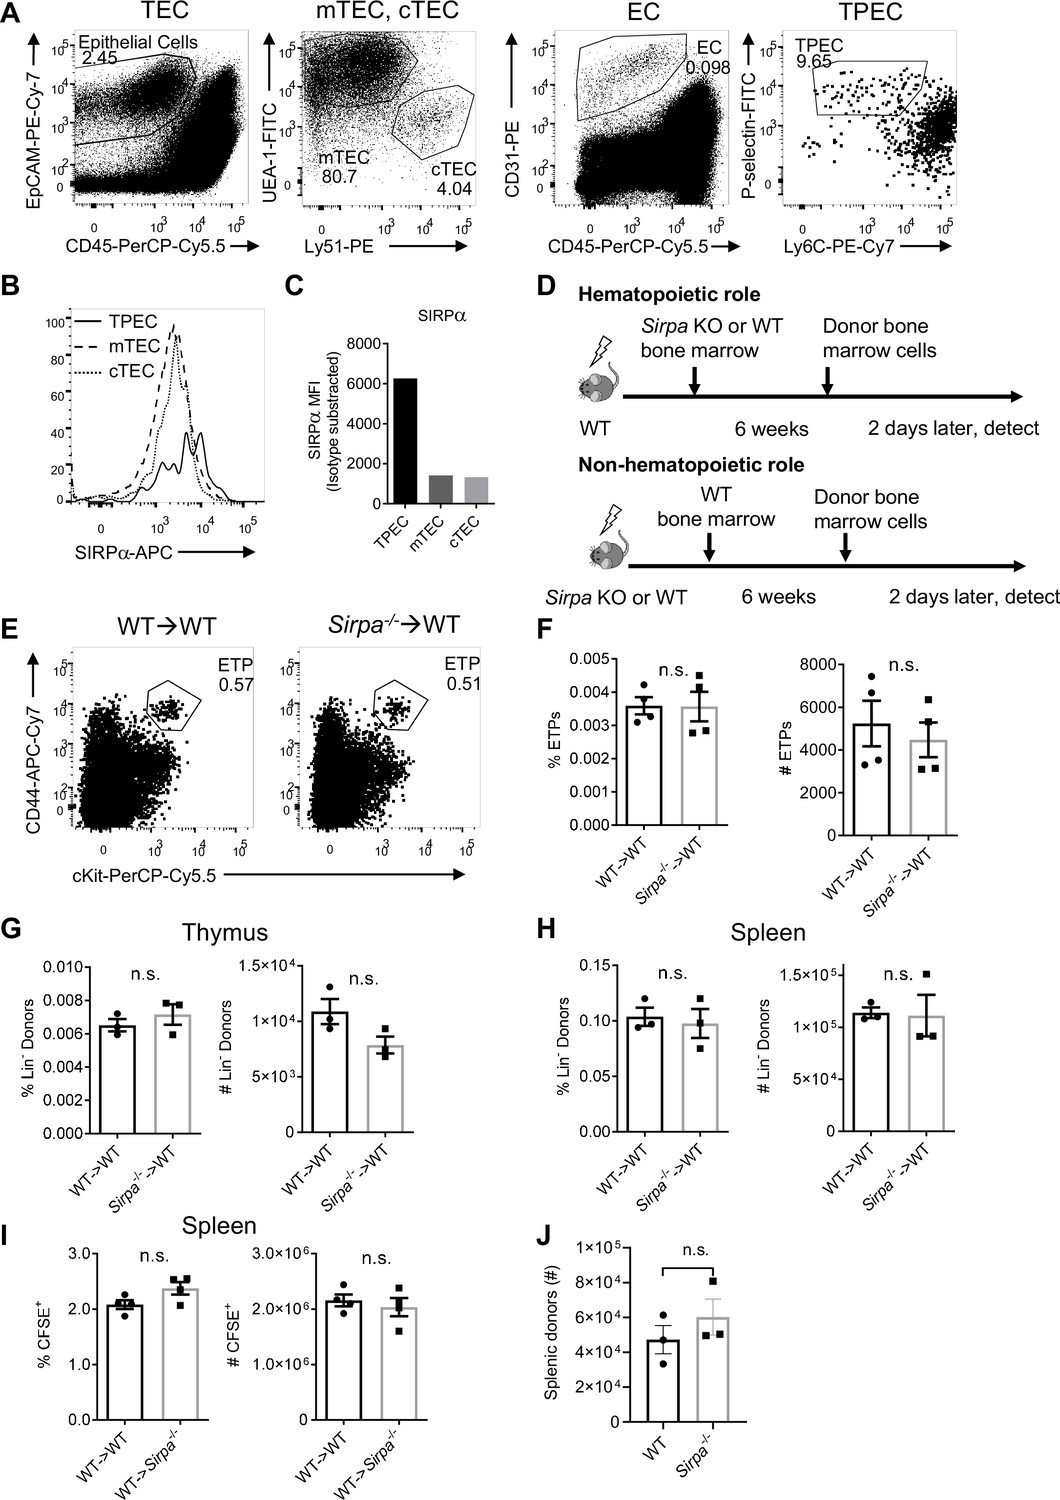
Endothelial signal regulatory protein alpha (SIRPα) is essential for thymic progenitor homing.
(A) Representative dot plot of thymic epithelial cells (TECs, EpCAM+CD45-), TEC subsets (mTECs, UEA-1+Ly51- and cTECs, UEA-1-Ly51+), thymic endothelial cells (ECs, CD31+CD45-), and EC subsets (TPECs, P-selectin+Ly6C-). (B,C) Expression (B) and statistics (C) of SIRPα on TPEC, mTEC, and cTEC subsets of thymic stroma. Data are representative of two independent experiments. (D) Schematic diagram showing thymic progenitor short-term homing assay in bone marrow chimeric mice. (E,F) Flow cytometric analysis (E) and statistics (F) of proportion and absolute cell number of early T cell progenitor (ETP) population in wild type (WT) mice reconstituted with Sirpa-/- or WT bone marrows, n = 4 in each group, data are representative of two independent experiments. (G,H) Whole bone marrow short-term homing assay in WT mice reconstituted with WT or Sirpa-/- bone marrows, as Figure 2H described. Lineage- donor progenitor cells were determined in the thymus (G) and in the spleen (H), n = 3 for each group, data are representative of two independent experiments. (I) Whole bone marrow short-term homing assay in WT or Sirpα-/-mice reconstituted (8 weeks after irradiation and reconstitution) with WT bone marrows. Total donor cells (CFSE+CD45+) in the spleen were determined, n = 4 for each group, data are representative of two independent experiments. (J) Donor Lin- BMC detection in the spleen in short-term homing assay in WT or Sirpa-/- mice, as described in Figure 2I, n = 3 for each group, data are representative of two independent experiments. Error bars represent s.e.m., n.s. means not significant, determined by two-tailed unpaired Student’s t-test. Source data are available in Figure 2—figure supplement 2—source data 1.
-
Figure 2—figure supplement 2—source data 1
Source data file for Figure 2-figure supplement 2.
- https://cdn.elifesciences.org/articles/69219/elife-69219-fig2-figsupp2-data1-v1.xlsx
Figure 3 with 1 supplement
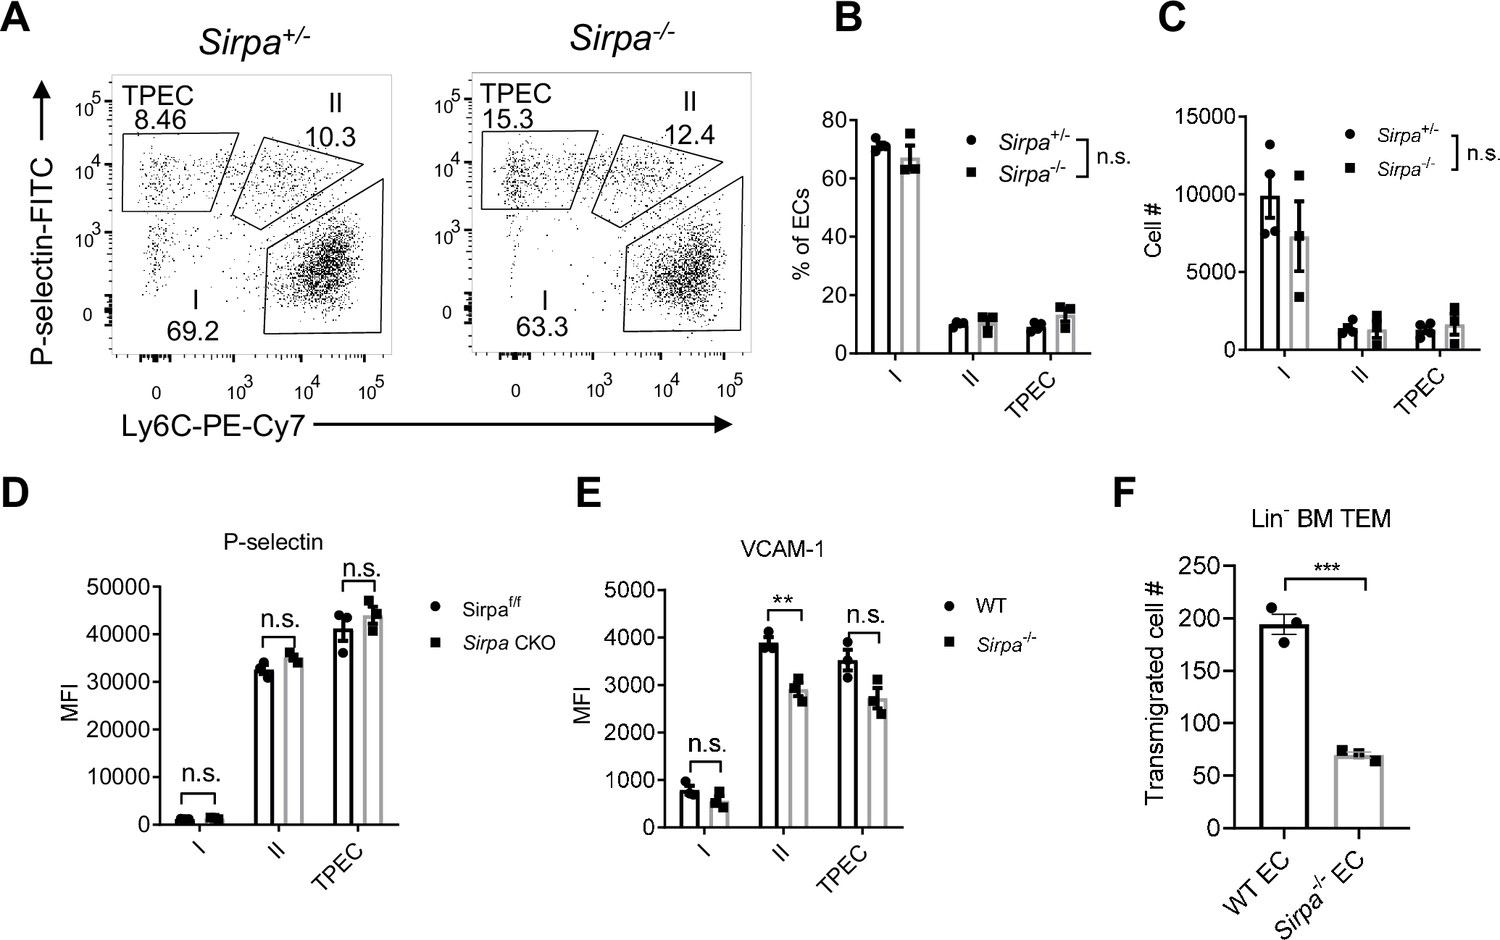
Endothelial cell (EC)-signal regulatory protein alpha (SIRPα) controls bone marrow progenitor cell transendothelial migration (TEM).
(A) Representative flow cytometric analysis of thymic EC composition in Sirpa-/- and control mice. (B,C) Proportion of thymic EC subsets (B) and corresponding cell numbers (C) in the thymus, n = 4 in Sirpa+/- and n = 3 in Sirpa-/- group, data are representative of three independent experiments. (D,E) Expression level of adhesion molecules on thymic EC subsets. (D) P-selectin in Sirpa TEK-CKO or control mice, n = 3 for each group. (E) VCAM-1 in Sirpa-/- or control mice, n = 3 for each group, data are representative of three independent experiments. (F) FACS-sorted Lin- BMC transmigration driven by CCL19, n = 3 in each group, data are representative of three independent experiments. Error bars represent s.e.m. Asterisks mark statistically significant difference, **p < 0.01, n.s. not significant, determined by two-tailed unpaired Student’s t-test. Source data are available in Figure 3—source data 1.
-
Figure 3—source data 1
Source data file for Figure 3.
- https://cdn.elifesciences.org/articles/69219/elife-69219-fig3-data1-v1.xlsx
Figure 3—figure supplement 1
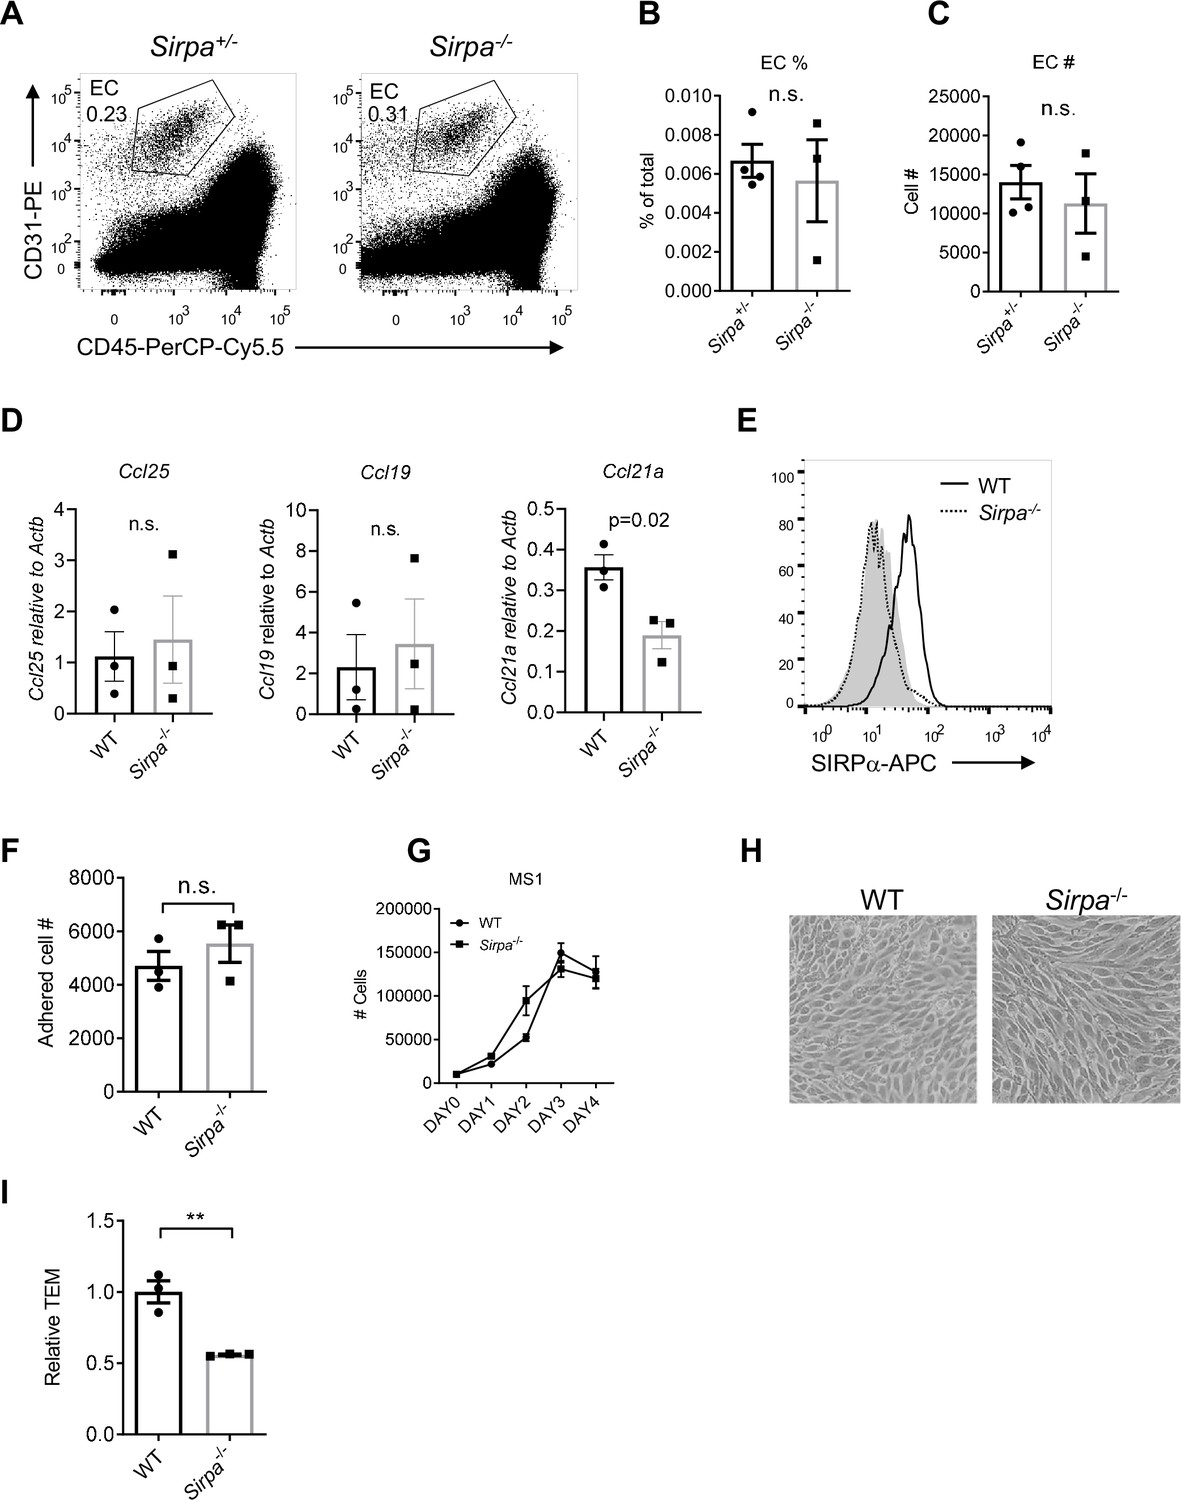
Signal regulatory protein alpha (SIRPα) does not control endothelial cell (EC) development and growth.
(A) Representative flow cytometric analysis of thymic ECs (CD31+CD45-) in the thymus of Sirpa-/- and control mice. (B,C) Proportion (B) and corresponding cell number (C) of ECs in total thymocytes, n = 4 in Sirpa+/- and n = 3 in Sirpa-/-group, data are representative of three independent experiments. (D) Detection of chemokine expression by thymic portal endothelial cells (TPECs), n = 3 in each group, data are representative of two independent experiments. (E) SIRPα detection by flow cytometry in CRISPR/Cas9-mediated Sirpa-/- MS1 cells, shadow indicates isotype level. (F) Adhered lymphocyte cell number in a well in the cell adhesion assay on Sirpa-/- or wild type (WT) MS1 ECs, detected by FACS, n = 3 in each group, data are representative of three independent experiments. (G) Flow cytometric analysis of MS1 cell number in the transwell chamber at indicated time points. (H) Observation (4×) of MS1 cells. (I) Transmigration of lymphocytes driven by CCL19 (10 ng/ml). Average transmigrated cell number in WT group was normalized to 1. Data are representative of three independent experiments. Error bars represent s.e.m., n.s. means not significant, determined by two-tailed unpaired Student’s t-test. Source data are available in Figure 3—figure supplement 1—source data 1.
-
Figure 3—figure supplement 1—source data 1
Source data file for Figure 3-figure supplement 1.
- https://cdn.elifesciences.org/articles/69219/elife-69219-fig3-figsupp1-data1-v1.xlsx
Figure 4 with 1 supplement
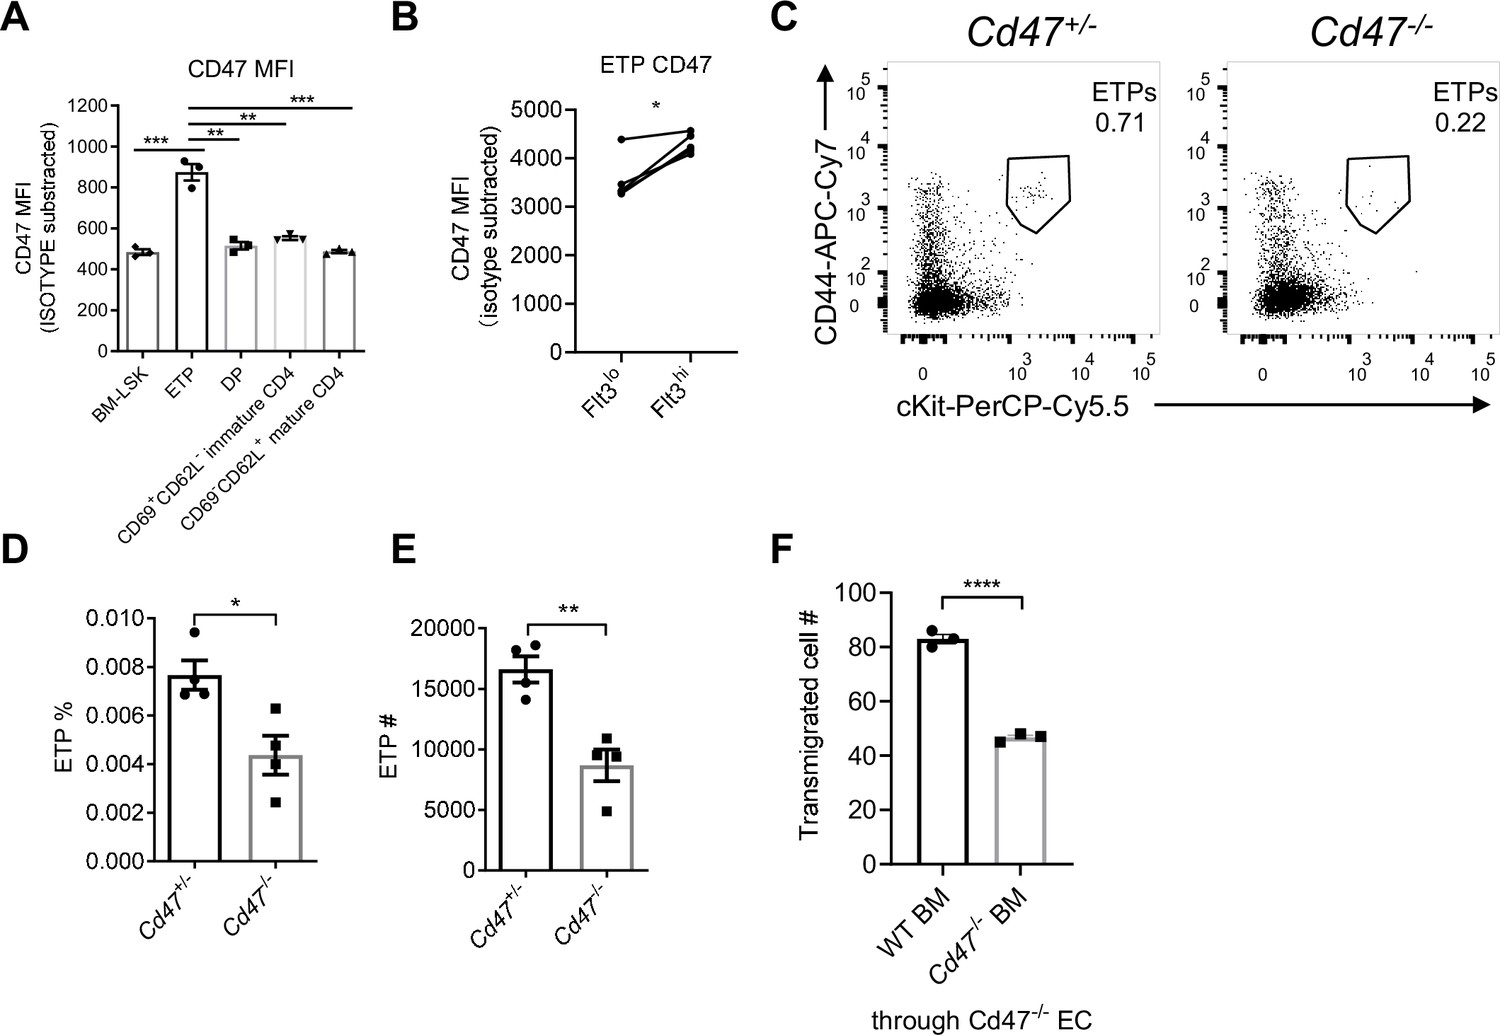
Migrating cell-derived CD47 guides their transendothelial migration (TEM).
(A) CD47 expression measured by flow cytometry in various subsets of T cell lineage. BM-LSK: Lineage-Sca1+cKit+ lymphoid progenitor cells in bone marrows, n = 3 in each group, data are representative of three independent experiments. (B) Statistic analysis of CD47 expression on Flt3hi (newly immigrated) and Flot3lo (settled) early T cell progenitors (ETPs), gated as in Figure 4—figure supplement 1B, n = 3 in each group, paired t-test were performed, data are representative of three independent experiments. (C–E) Flow cytometric analysis (C), proportion (D), and corresponding cell numbers (E) of ETP population in Cd47-/- or control mice, n = 4 in each group, data are representative of three independent experiments. (F) Transmigration of Lin- BMCs through Cd47-/- endothelial cells (ECs). FACS-sorted wild type (WT) or Cd47-/- Lin- BMCs were driven by CCL19 (20 ng/ml) for 7 hr, n = 3 in each group, data are representative of three independent experiments. Error bars represent s.e.m. Asterisks mark statistically significant difference, *p < 0.05, **p < 0.01, ***p < 0.001, determined by two-tailed unpaired Student’s t-test if not otherwise indicated. Source data are available in Figure 4—source data 1.
-
Figure 4—source data 1
Source data file for Figure 4.
- https://cdn.elifesciences.org/articles/69219/elife-69219-fig4-data1-v1.xlsx
Figure 4—figure supplement 1
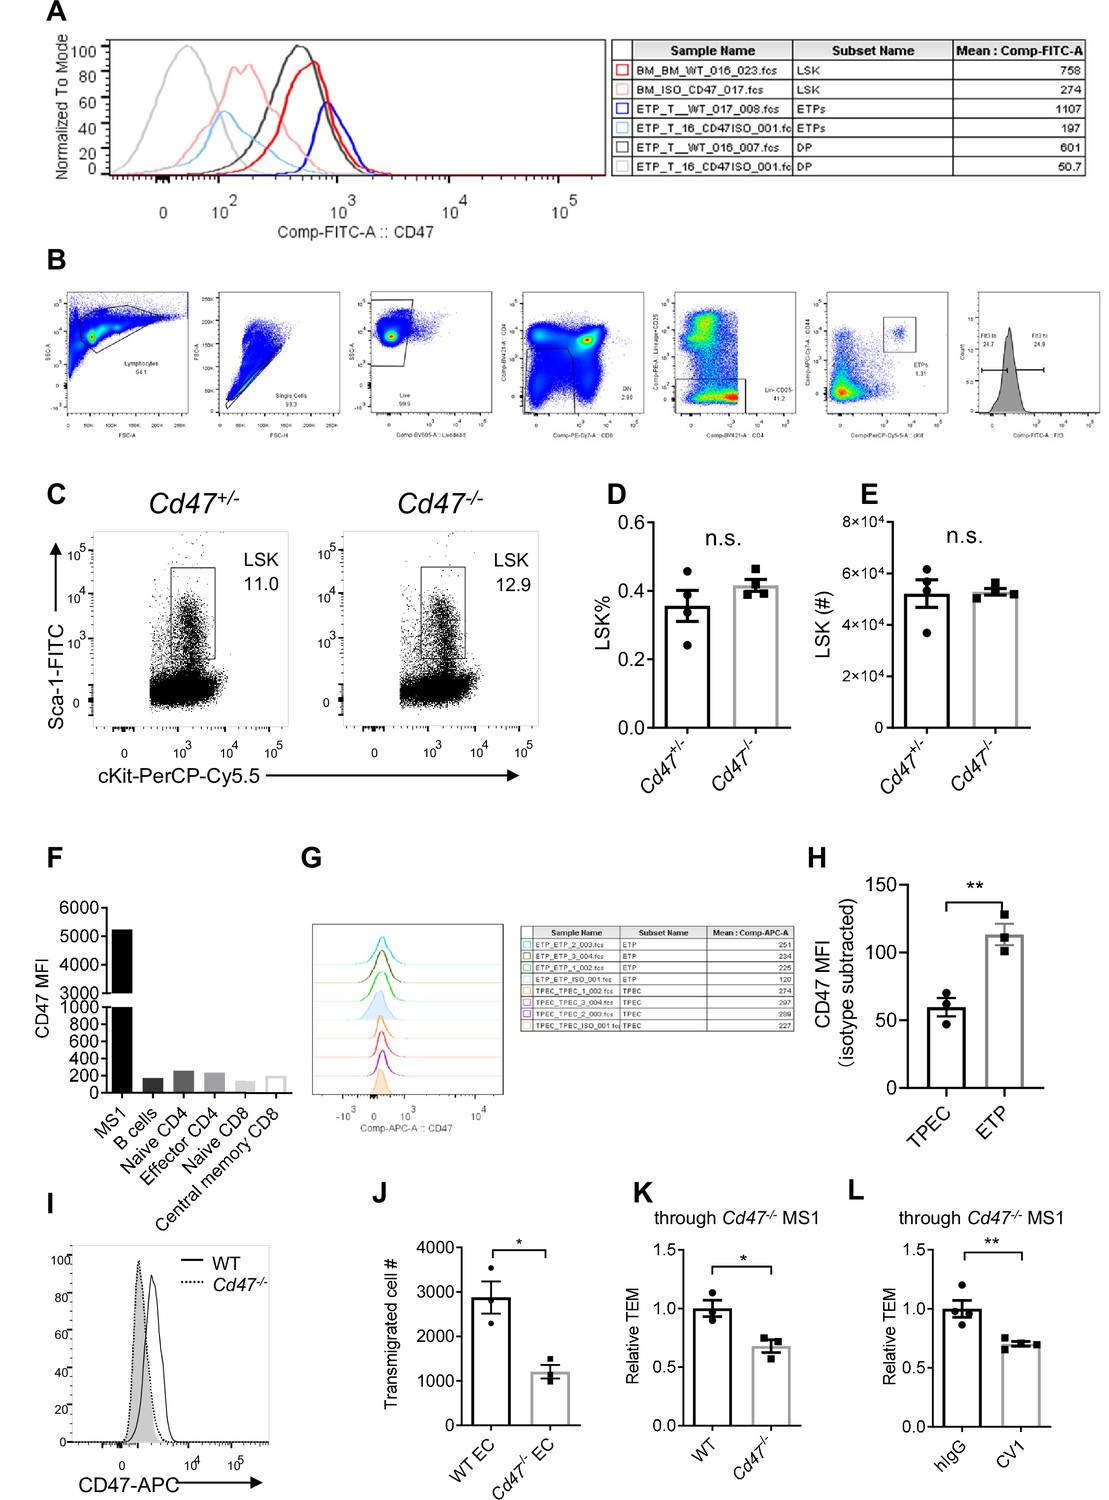
Migrating cell-derived CD47 guides their transendothelial migration (TEM).
(A) CD47 expression in various subsets of T cell lineage as described in Figure 4A. Shallow lines are the isotype control of the subset of corresponding colors. Data are representative of three independent experiments. (B) Gating of Flt3hi and Flt3lo ETP subsets, as described in Figure 4B. (C) Flow cytometric analysis of LSK progenitor cells (lineage-cKit+Sca-1+) in the bone marrow of Cd47-/- and control mice. (D,E) Proportion (D) and corresponding cell number (E) of LSKs of total bone marrow cells in a pair of femurs and tibias, n = 4 in each group, data are representative of three independent experiments. (F) CD47 expression on MS1 endothelial cells and primary lymphocyte subsets from inguinal lymph nodes. (B) Cells (B220+), naïve CD4 (CD4+CD62L+CD44-), effector CD4 (CD4+CD62L-CD44+), naïve CD8 (CD8+CD62L+CD44-), and central memory CD8 (CD8+CD62L+CD44+) T cells. (G) CD47 expression on thymic portal endothelial cells (TPECs) and early T cell progenitors (ETPs) (lineage-CD25-CD44+cKit+), shadow indicates isotype level, mean fluorescence intensity (MFI) of CD47 expression in each subset are shown in the last column of the table. (H) Statistics of CD47 expression on TPECs and ETPs, n = 3 in each group, data are representative of three independent experiments. (I) CD47 detection by flow cytometry in CRISPR/Cas9-mediated Cd47-/- MS1 cells, shadow indicates isotype level. (J) Wild type (WT) T lymphocyte transmigration through WT or Cd47-/- MS1 endothelial monolayer, n = 3 in each group, data are representative of three independent experiments. (K) WT or Cd47-/- T lymphocyte transmigration through Cd47-/- MS1 endothelial monolayer, n = 3 for each group, data are representative of three independent experiments. (L) Transmigration of CV1-incubated or control lymphocytes through Cd47-/- MS1 endothelial monolayer, n = 4 for each group, data are representative of three independent experiments. Error bars represent s.e.m. Asterisks mark statistically significant difference, *p < 0.05, **p < 0.01, ***p < 0.001, n.s., not significant, determined by two-tailed unpaired Student’s t-test. Source data are available in Figure 4—figure supplement 1—source data 1.
-
Figure 4—figure supplement 1—source data 1
Source data file for Figure 4-figure supplement 1.
- https://cdn.elifesciences.org/articles/69219/elife-69219-fig4-figsupp1-data1-v1.xlsx
Figure 5 with 1 supplement
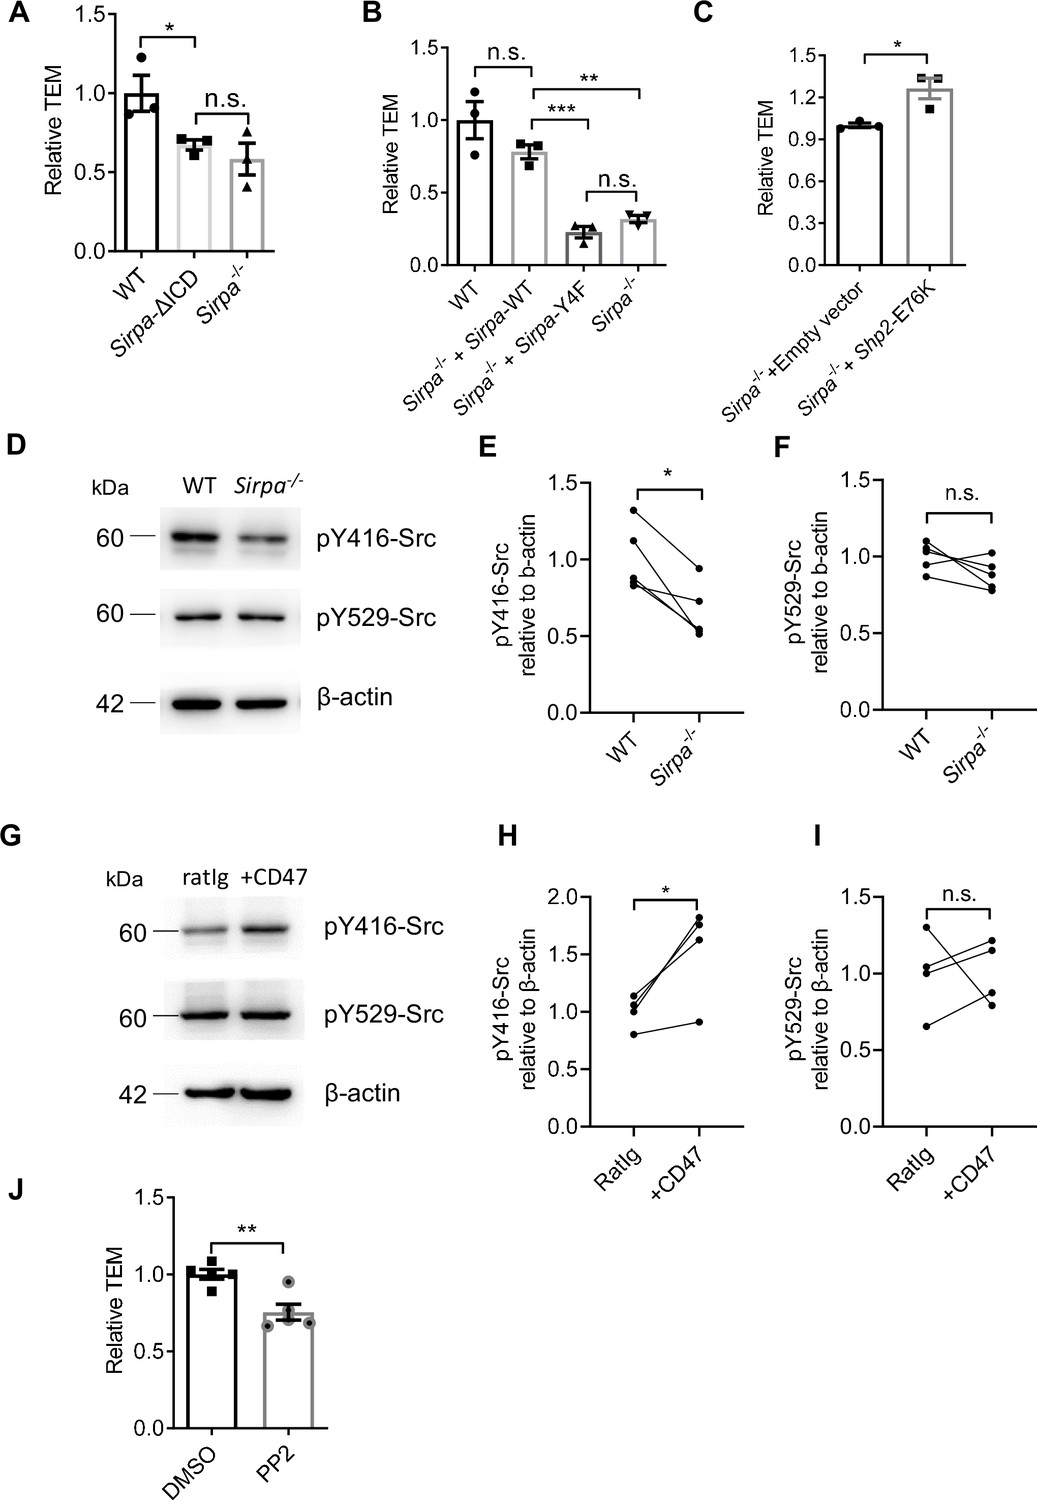
Signal regulatory protein alpha (SIRPα) intracellular signal controls transendothelial migration (TEM) via SHP2 and Src.
(A) Relative TEM efficiency of lymphocytes through wild type (WT), intracellular-truncated Sirpa-ΔICD, and Sirpa-/- MS1 endothelial monolayer, n = 3 in each group, data are representative of three independent experiments. (B) Relative TEM efficiency of lymphocytes through Sirpa overexpressing (Sirpa-/- + Sirpa WT) or SIRPα-tyrosine-to-phenylalanine mutant overexpressing (Sirpa-/- + Sirpa-4F) MS1 endothelial monolayer, n = 3 for each group, data are representative of three independent experiments. (C) Relative TEM efficiency of lymphocytes through Sirpa-/- MS1 endothelial monolayer overexpressing constitutively active form of SHP2 (+Shp2 CA) or control empty vector (+Empty vector), n = 3 for each group, data are representative of three independent experiments. (D) Detection of Src activity in Sirpa-/- and WT MS1 endothelial cell lines, as measured by Western blot with anti-pY416-Src (active form Src antibody), anti-pY529-Src (inactive form Src antibody), and anti-β-actin control antibody. (E,F) Relative quantification of the active Src (pY416-Src) (E) and inactive Src (pY529-Src) (F) to β-actin in five tests, the relative expression in each sample is normalized to WT average, n = 4 in each group, data are representative of five independent experiments. Signifcance was analyzed by paired t-test. (G) Detection of Src activity in Cd47-/- MS1 cells upon mCD47-Ig or control Ig stimulation, as measured by Western blot. (H,I) Relative quantification of the active Src (pY416-Src) (H) and inactive Src (pY529-Src) (I) to β-actin in four tests, and the relative expression in each sample is normalized to WT average, n = 4 in each group, data are representative of four independent experiments. Significance was analyzed by paired t-test. (J) Lymphocyte transmigration, in the absence or presence of Src inhibitor PP2 (5 μM, 12 hr) through WT MS1 endothelial monolayer, n = 5 for each group, data are representative of three independent experiments. Error bars represent s.e.m. Asterisks mark statistically significant difference, *p < 0.05, **p < 0.01, ***p < 0.001, n.s., not significant, determined by two-tailed unpaired Student’s t-test unless otherwise indicated. Raw images and statistics are available in Figure 5—source data 1.
-
Figure 5—source data 1
Source data file for Figure 5.
- https://cdn.elifesciences.org/articles/69219/elife-69219-fig5-data1-v1.xlsx
Figure 5—figure supplement 1
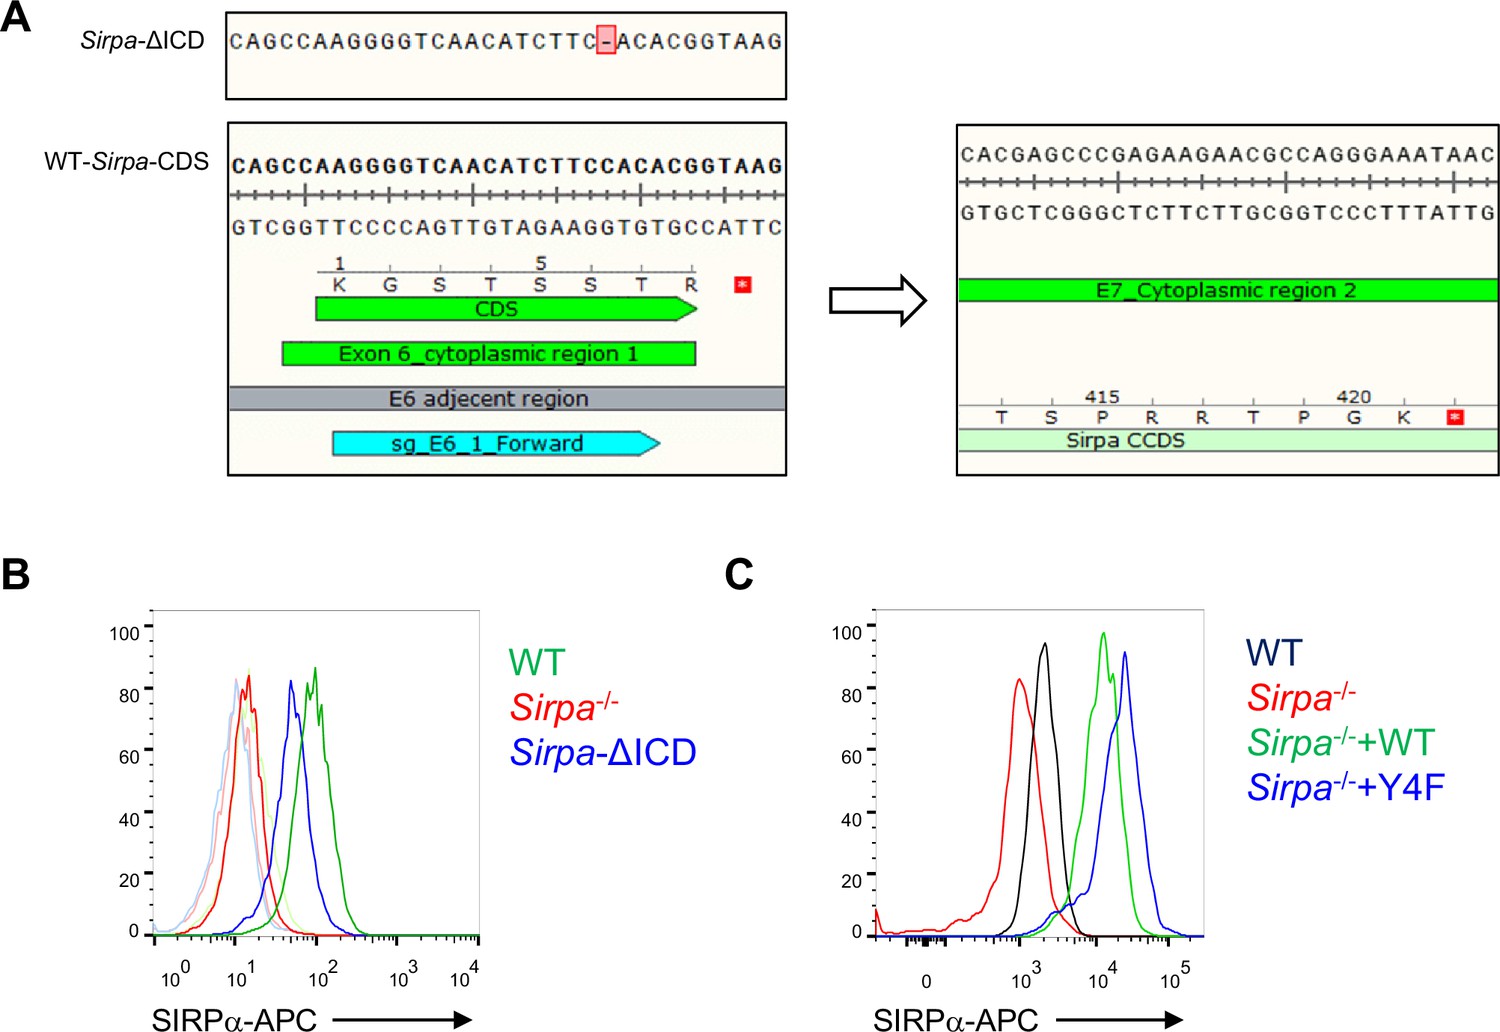
Construction of signal regulatory protein alpha (SIRPα) mutant MS1 cell lines.
(A) Schematic view of Cas9-mediated truncation of Sirpa intracellular region. sgRNA targeting exon 6 of Sirpa, the first exon encoding for the cytoplasmic region, was designed to create frameshift mutation at the exon which generated stop codon TAA at the following exon 7, which terminates SIRPα translation before intracellular signal region within exon 8 to form a presumably truncated form of intracellular region of SIRPα (SIRPα-ΔICD). (B) FACS analysis of surface expression of SIRPα on wild type (WT), intracellular domain truncated (ΔICD), and Sirpa-/- MS1 cell lines, tint lines indicate corresponding isotype level. (C) FACS analysis of SIRPα expression after lentiviral-mediated overexpression of WT coding sequence of Sirpa (+Sirpa WT) or Sirpa with intracellular tyrosine residues mutated to phenylalanine (+Sirpa-4F) which inactivated intracellular signal of SIRPα, on the basis of Sirpa-/- MS1. Source data are available in Figure 5—figure supplement 1—source data 1.
-
Figure 5—figure supplement 1—source data 1
Source data file for Figure 5-figure supplement 1.
- https://cdn.elifesciences.org/articles/69219/elife-69219-fig5-figsupp1-data1-v1.zip
Figure 6 with 1 supplement
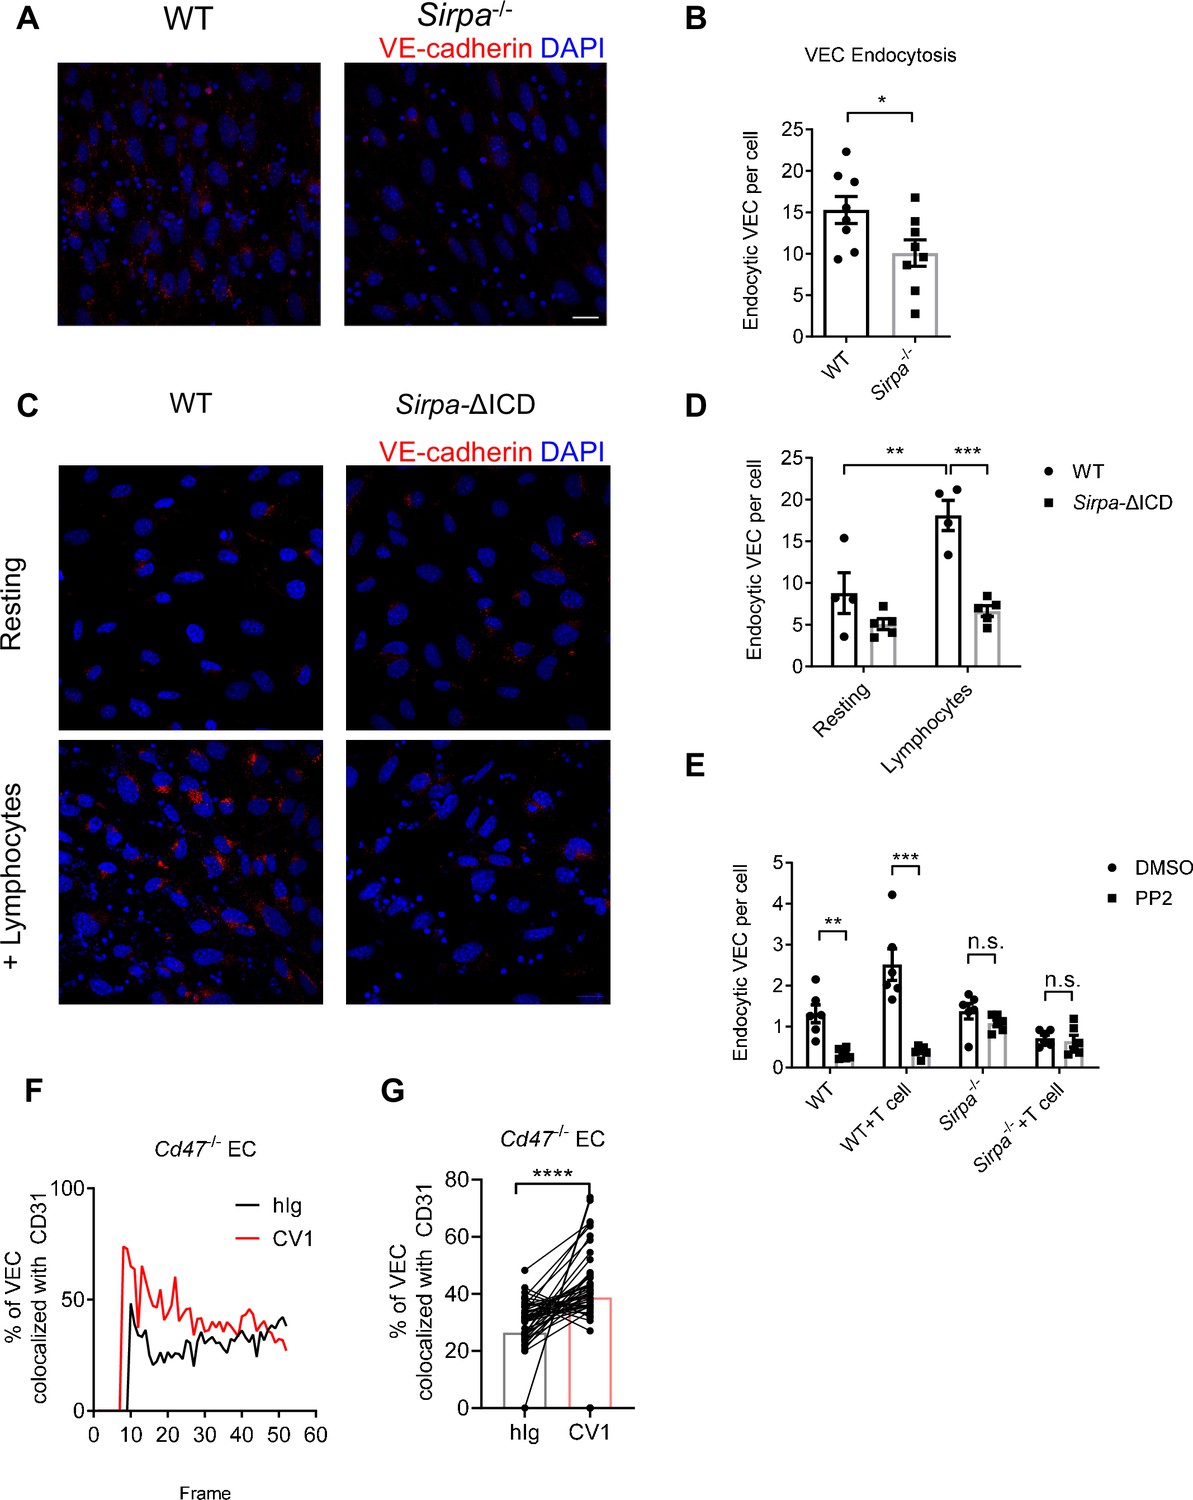
CD47-signal regulatory protein alpha (SIRPα) signaling promotes VE-cadherin endocytosis.
(A) Representative imaging of endocytosed VE-cadherin in the presence of lymphocytes, scale bars represent 20 μm. (B) Statistical analysis of VE-cadherin endocytosis in MS1 endothelial cells. VE-cadherin fluorescence signal was quantified by ImageJ with same threshold for each slide. Data are representative of three independent experiments with n = 8 in each group (captured filed). (C,D) VE-cadherin endocytosis in intracellular-truncated SIRPα-ΔICD or wild type (WT) MS1 cells, with (+lymphocytes) or without lymphocyte incubation (resting). Representative confocal imaging of endocytosed VE-cadherin is shown (C) with statistical analysis of VE-cadherin endocytosis (D), n = 4 in WT, n = 5 in SIRPα-ΔICD-B2, data are representative of three independent experiments. (E) VE-cadherin endocytosis in the presence of lymphocytes (+T cell) and inhibitor of Src activation (+PP2, 5 μM, 2 hr). (F,G) Real-time analysis of adherens junctional VE-cadherin in the presence of migrating lymphocytes pretreated with CV1 or control hIg. Dynamic measurement (F) and statistical analysis (G) of VE-cadherin colocalization with CD31 after CD4+ T cell injection to the flow, data measurement began with emergence of T cells in the field and measured one time each frame for a total of 51 frames. Data were pooled in each group and analyzed by two-tailed paired t-test. Each pair of data indicates paired signals in the same frame. Data are representative of two independent experiments. Error bars represent s.e.m. Asterisks mark statistically significant difference, *p < 0.05, **p < 0.01, ***p < 0.001, n.s., not significant, determined by two-tailed unpaired Student’s t-test unless otherwise indicated. Raw data and analysis method of endocytosis assay and real-time image statistics are available in Figure 6—source data 1.
-
Figure 6—source data 1
Source data file for Figure 6.
- https://cdn.elifesciences.org/articles/69219/elife-69219-fig6-data1-v1.xlsx
Figure 6—figure supplement 1
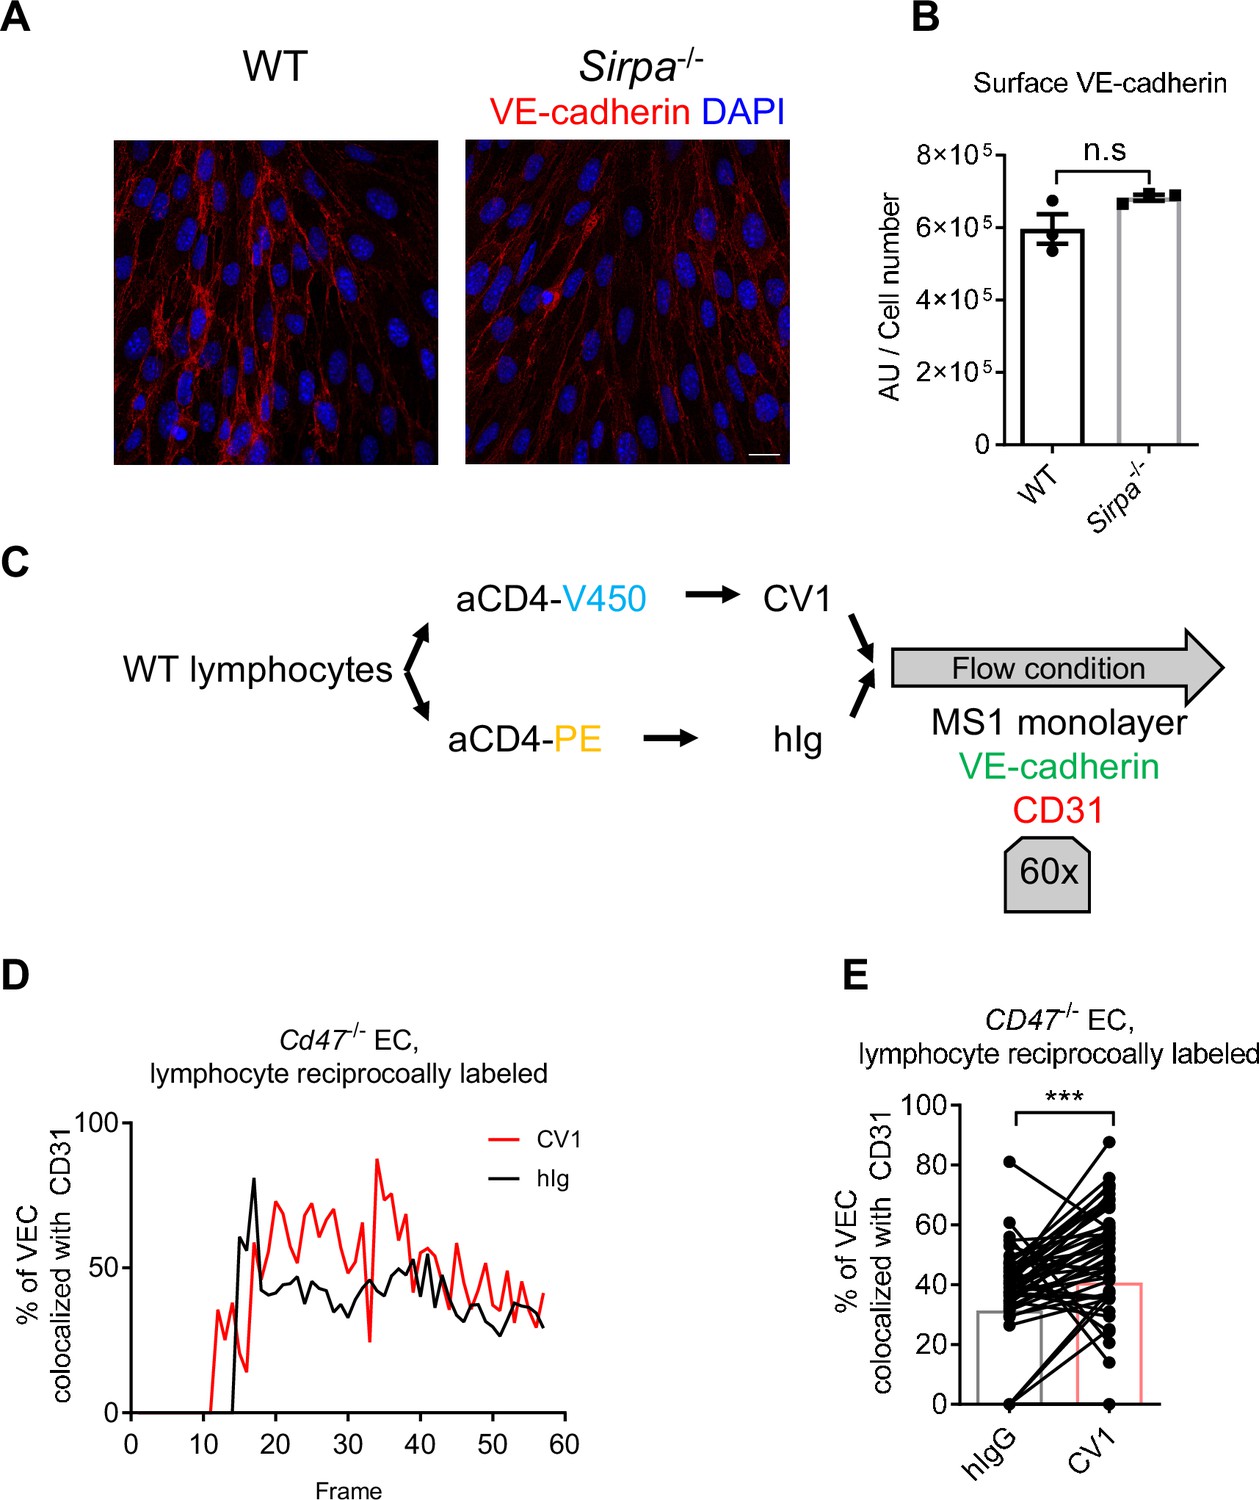
CD47-signal regulatory protein alpha (SIRPα) signaling promotes VE-cadherin endocytosis.
(A) Confocal microscopy of distribution of VE-cadherin on wild type (WT) and Sirpa-/- MS1 monolayers, bar represents 20 μm. (B) VE-cadherin signal per cell calculated by total VE-cadherin signal intensity divided by cell number counted by DAPI highlighted nucleus, n = 3 in each group, data are representative of two independent experiments. (C) Schematic view of real-time analysis of adherens junctional VE-cadherin in the presence of migrating lymphocytes. (D,E) Measurement (D) and statistical analysis (E) of VE-cadherin colocalization with CD31 after CD4+ T cell injection, CV1- and control hIg-treated CD4+ T cells were reciprocally labeled by fluorescent dyes as used in Figure 6F and G, n = 57 frames. Data were pooled in each group and analyzed by two-tailed paired t-test. Data are representative of two independent experiments. Error bars represent s.e.m. Asterisks mark statistically significant difference, ***p < 0.001, n.s., not significant, determined by two-tailed unpaired Student’s t-test unless otherwise indicated. Statistics are available in Figure 6—figure supplement 1—source data 1.
-
Figure 6—figure supplement 1—source data 1
Source data file for Figure 6-figure supplement 1.
- https://cdn.elifesciences.org/articles/69219/elife-69219-fig6-figsupp1-data1-v1.xlsx
Figure 7
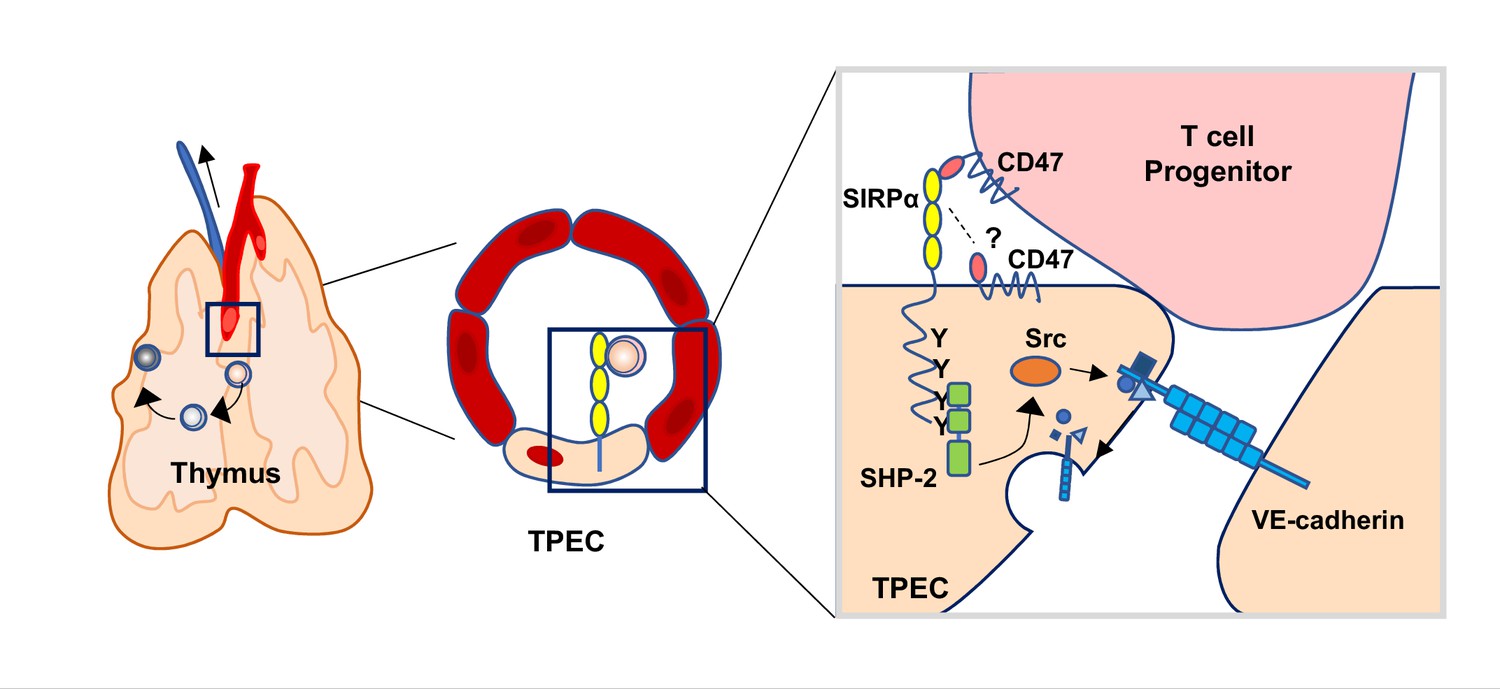
Schematic diagram of signal regulatory protein alpha (SIRPα) signaling in thymic portal endothelial cells (TPECs).
SIRPα on TPECs is engaged by CD47 on progenitor cells to initiate an inward signaling which induces VE-cadherin endocytosis and transendothelial migration for thymic homing of the progenitors.
Author response image 1
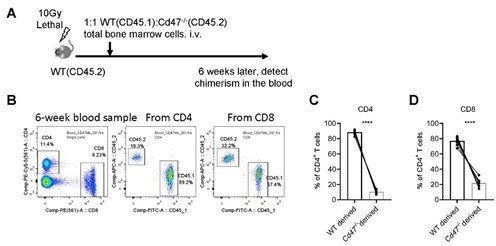
Reconstitution of mixed WT and Cd47-/- bone marrow chimeras.
(A) Schematic view of mixed bone marrow chimera. (B) FACS analysis of chimerism of T cells in the peripheral blood in the host 6 weeks after bone marrow adoptive transfer. (C,D) Statistics of WT and Cd47-/- donor derived CD4+ (C) and CD8+ (D) T cells. n=10 in each group, paired t-test applied. ***: p <0.001.
Author response image 2
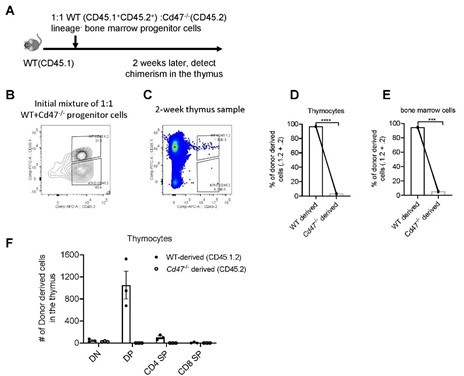
Development of WT and Cd47-/- Lin- progenitors in non-irradiated hosts.
(A) Schematic view of the experiment. (B) Proportion of donor cells in the mixture before transfer. (C) Proportion of donor-derived thymocytes 2 weeks later. (D,E) Statistics of proportion of WT and Cd47-/- donor derived cells in the thymus (D) and in the bone marrow (E) of the host. (F) Cell number of donor-derived thymocytes in each thymocyte subset. n=3 in each group, paired t-test applied. ***: p <0.001, ****:p<0.0001.
Author response image 3
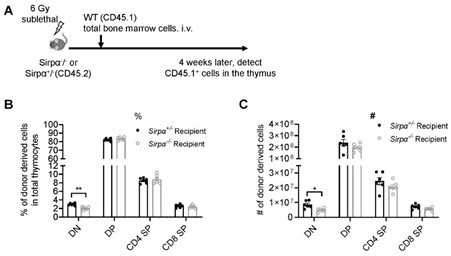
Reconstitution of bone marrow-derived progenitors in Sirpα-/- mice.
(A) Schematic view of the experiment. (B,C) Statistics of proportion (B) and cell number (C) of donor derived cells in the thymus 4 weeks after SL-TBI and adoptive transfer. n=6 in each group, unpaired t-test applied. *: p <0.05, **: p<0.01.
Author response image 4
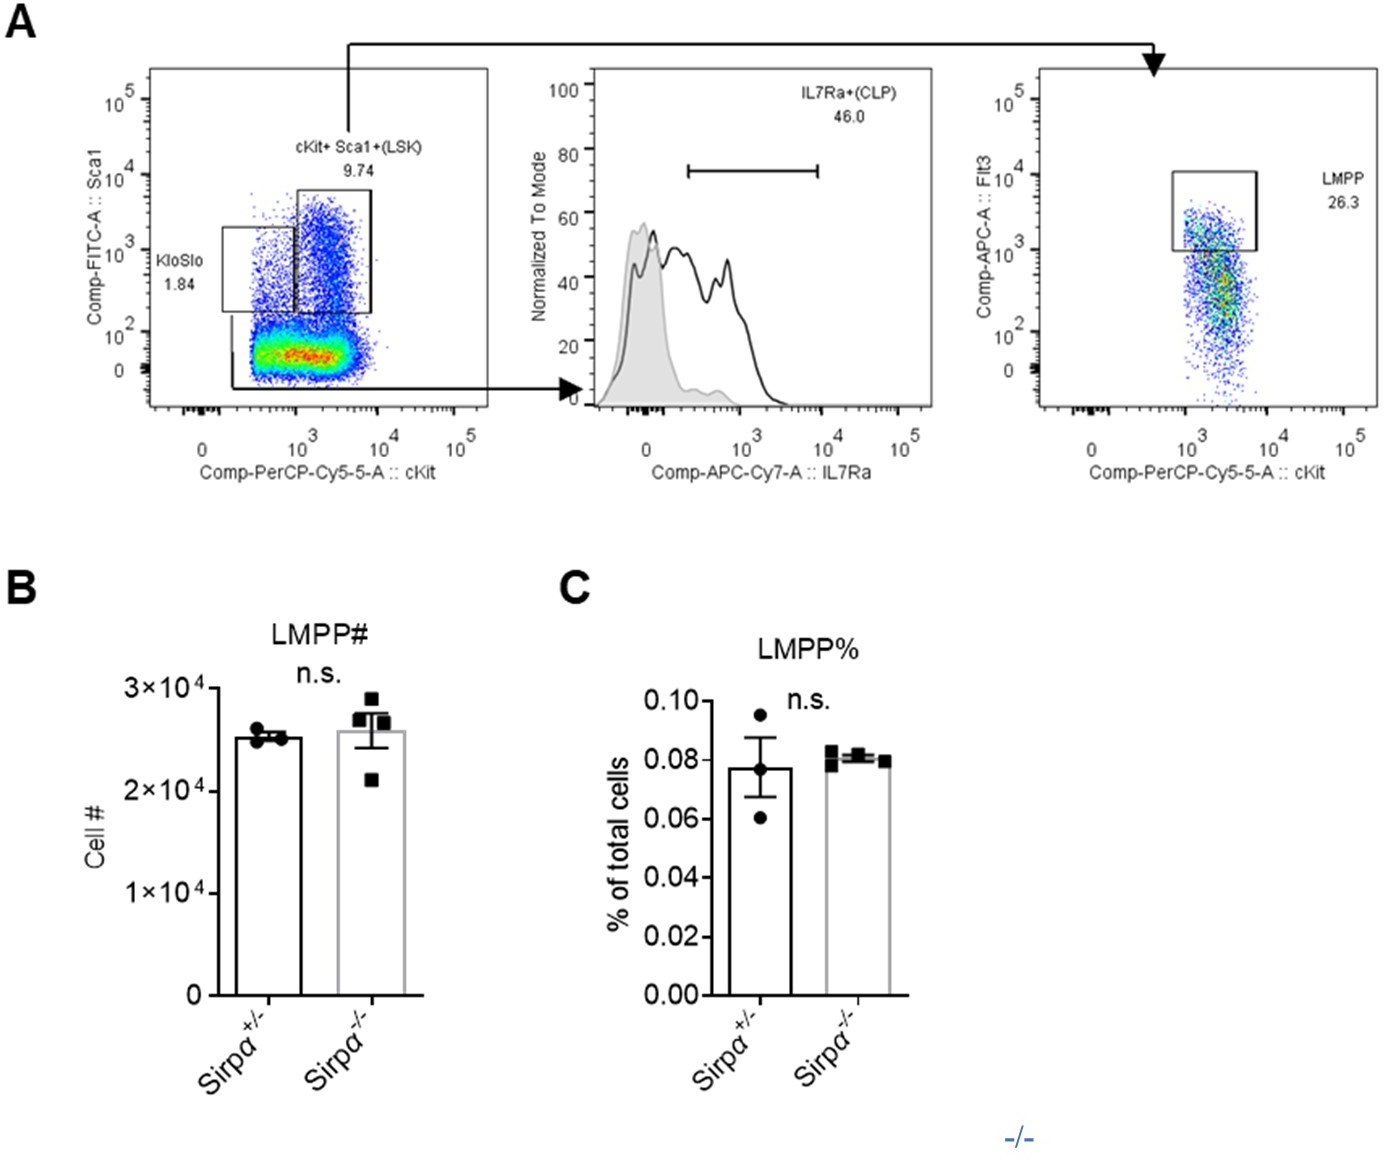
Analysis of lymphoid progenitors in Sirpα mice.
Gating strategy for common lymphoid progenitors (CLPs) and lymphoid myeloid progenitors (LMPPs). (B,C) Statistics of cell number (B) and proportion (C) of LMPPs in the bone marrow, n=3 in Sirpα+/- and n=4 in Sirpα-/-. Unpaired t-test applied. n.s. not significant.
Author response image 5
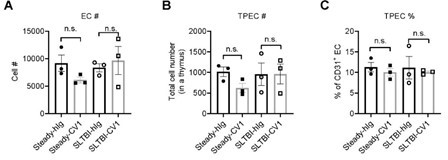
Thymic EC composition upon SIRPα blockade.
(A) Cell number of thymic endothelial cells in the thymus after indicated treatment. (B,C) Cell number (B) and proportion (C) of total thymic portal endothelia cells (TPECs) of a thymus. n=3 in each group. Unpaired t-test applied. n.s. not significant.
Additional files
-
Transparent reporting form
- https://cdn.elifesciences.org/articles/69219/elife-69219-transrepform1-v1.docx
-
Supplementary file 1
Source data file for GSE_83114 RNA-seq analysis.
- https://cdn.elifesciences.org/articles/69219/elife-69219-supp1-v1.xlsx
Download links
A two-part list of links to download the article, or parts of the article, in various formats.
Downloads (link to download the article as PDF)
Open citations (links to open the citations from this article in various online reference manager services)
Cite this article (links to download the citations from this article in formats compatible with various reference manager tools)
Endothelial SIRPα signaling controls VE-cadherin endocytosis for thymic homing of progenitor cells
eLife 11:e69219.
https://doi.org/10.7554/eLife.69219


