Discovery and characterization of Hv1-type proton channels in reef-building corals
- Departmento de Fisiología, Facultad of Medicina, Universidad Nacional Autónoma de México, Mexico
- Unidad Académica de Sistemas Arrecifales, Instituto de Ciencias del Mar y Limnología, Universidad Nacional Autónoma de México, Mexico
- EvoDevo Research Group, Unidad Académica de Sistemas Arrecifales, Instituto de Ciencias del Mar y Limnología, Universidad Nacional Autónoma de México, Mexico
- Department of Physiology and Biophysics, School of Medicine, Virginia Commonwealth University, United States
- Departmento of Neurociencia Cognitiva, Instituto de Fisiología Celular, Universidad Nacional Autónoma de México, Mexico
Figures
Figure 1 with 2 supplements
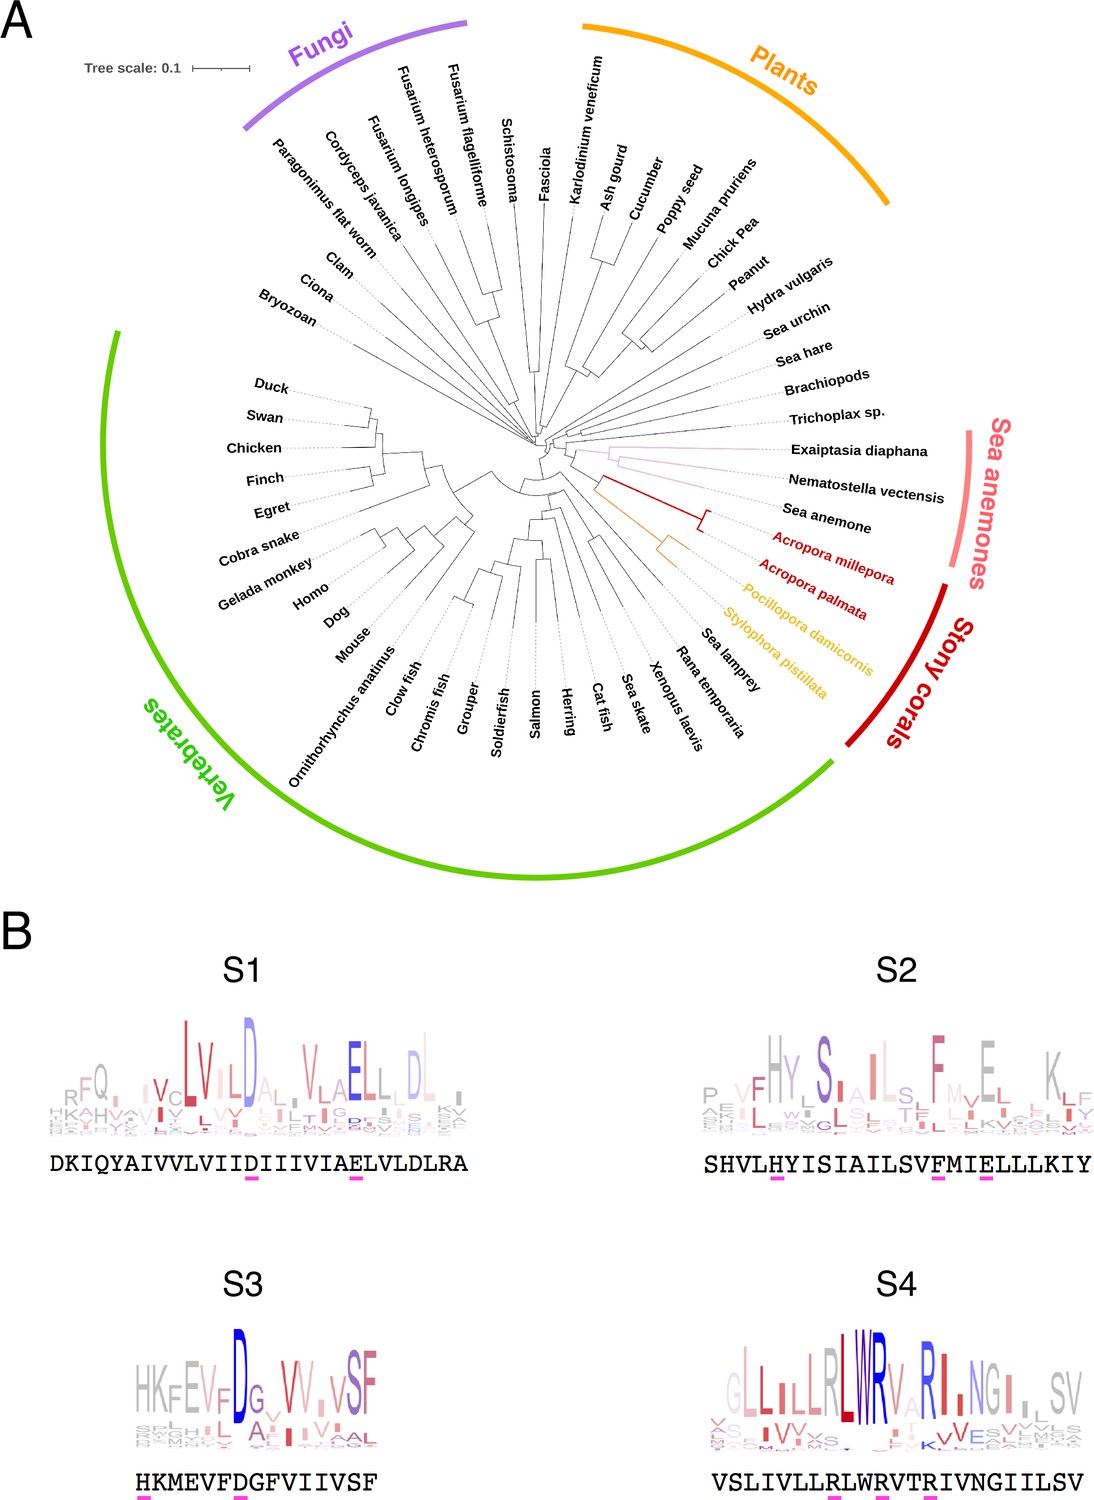
Conservation and phylogenetic relationships of Hv1 channels.
(A) The tree obtained from a multiple sequence alignment from Hv1 channels in CLUSTAL-O. Highlighted in red and yellow are the branches containing coral Hv1 sequences. (B) Consensus logo sequences of transmembrane domains of Hv1 channels. The color code indicates the hydrophobicity of each residue, where blue indicates charged residues, red indicates non-polar residues, and other colors indicate either non-polar or charged residues with less conservation.
-
Figure 1—source code 1
Code for generating the tree in Figure 1.
- https://cdn.elifesciences.org/articles/69248/elife-69248-fig1-code1-v1.xlsx.zip
Figure 1—figure supplement 1
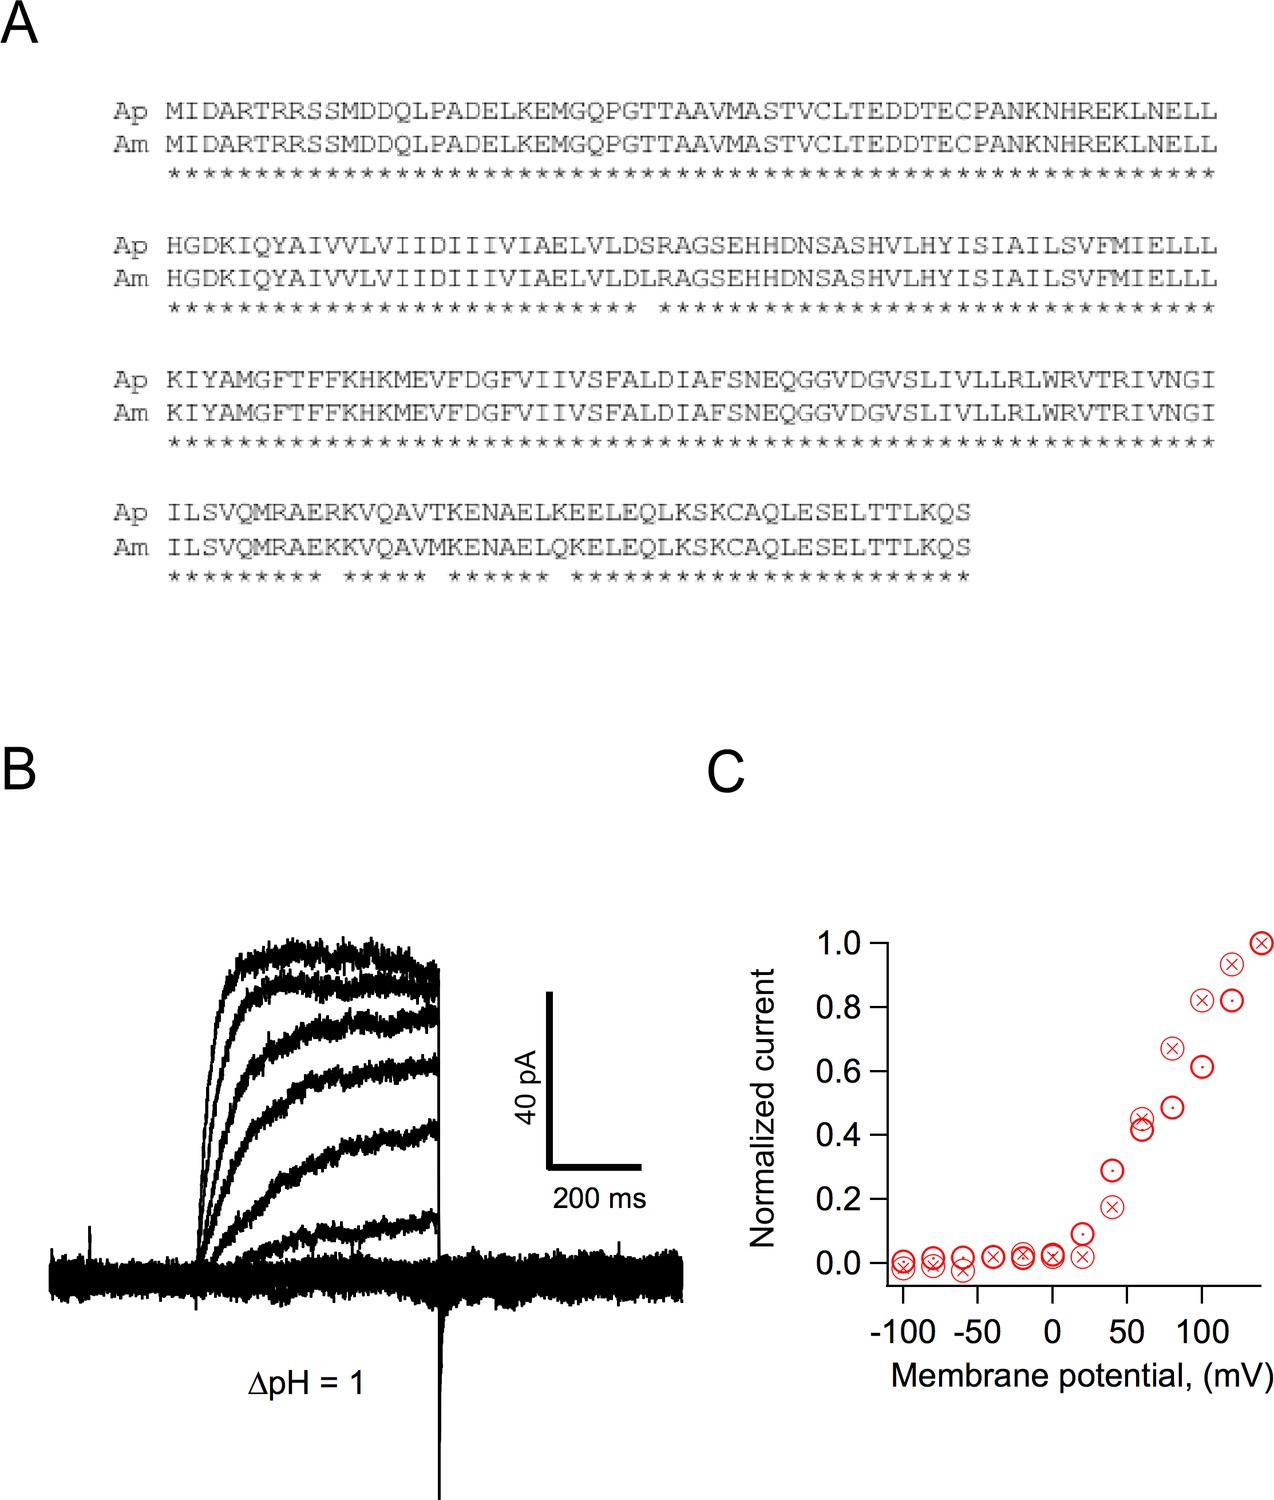
Some characteristics of Hv1 from Acropora palmata.
(A) Comparison of the amino acid sequence of Hv1s from Acropora millepora (Am) and Acropora palmata (Ap). The asterisks below each residue indicate identity. (B) Currents elicited from an inside-out patch obtained from an HEK293 cell expressing ApHv1. Voltage pulses were from −100 to 140 mV in 20 mV steps. ΔpH was 1. (C) Normalized current-voltage relationships of two patches obtained as in (B).
Figure 1—figure supplement 2
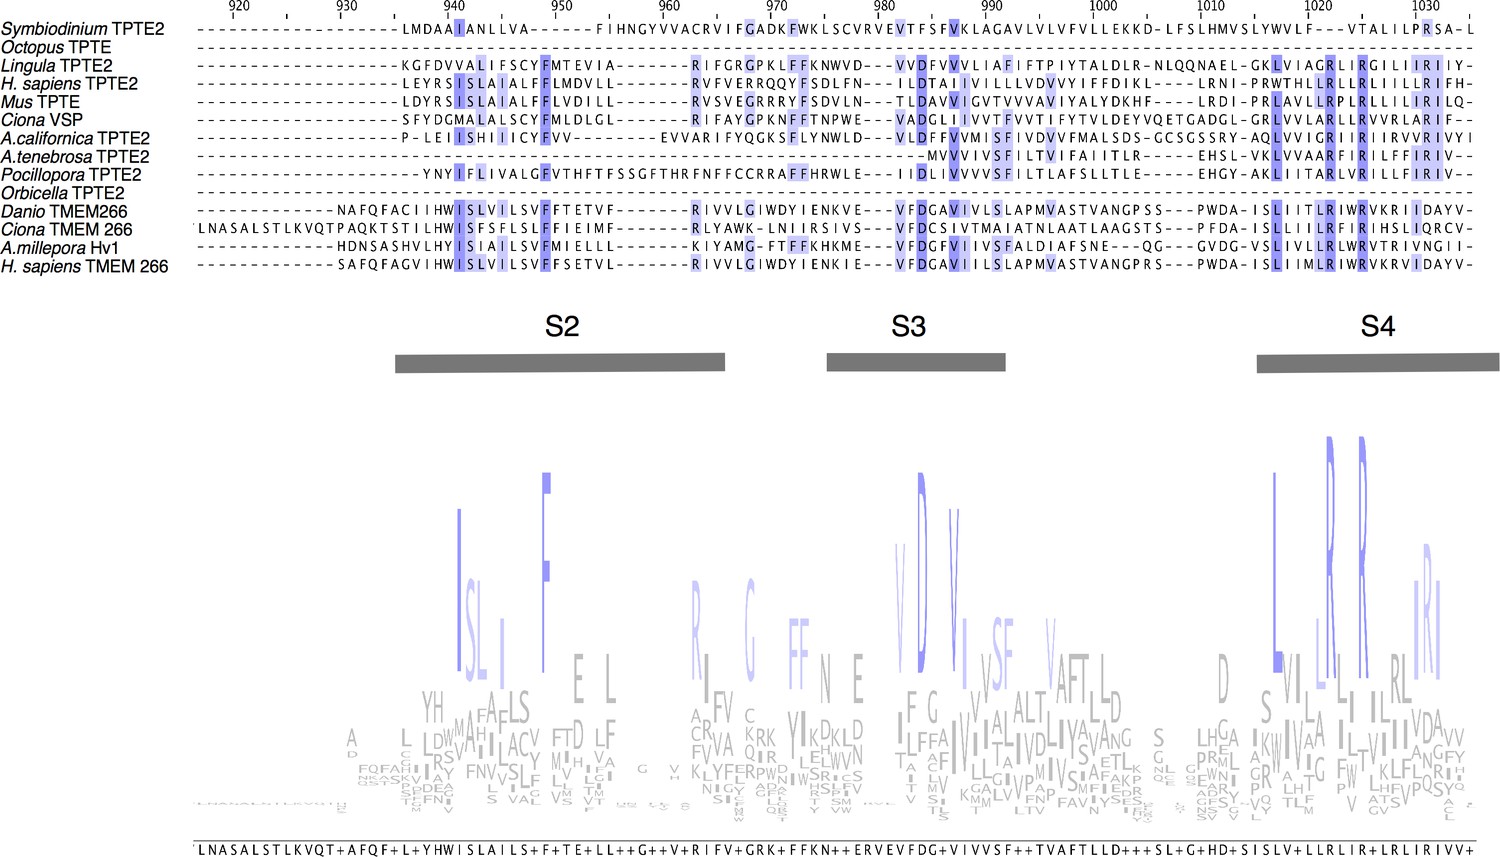
Comparison of the sequence of AmHv1 to other voltage-sensing proteins.
Voltage-sensing phosphatases like CiVSP, and TPTE and TPTE2 membrane proteins contain a voltage-sensing domain (VSD). Other proteins such as TMEM266 also contain VSDs. Sequence similarity can be detected in the putative transmembrane domains. We show the sequence alignment of the region with the highest similarity between the selected sequences of diverse organisms. The logo consensus sequence shows conservation, specially of the S4 segment. Other amino acid residues common in VSDs are also conserved in S2 and S3. However, TPTE and TMEM266 proteins are very different from Acropora millepora Hv1.
Figure 2 with 1 supplement
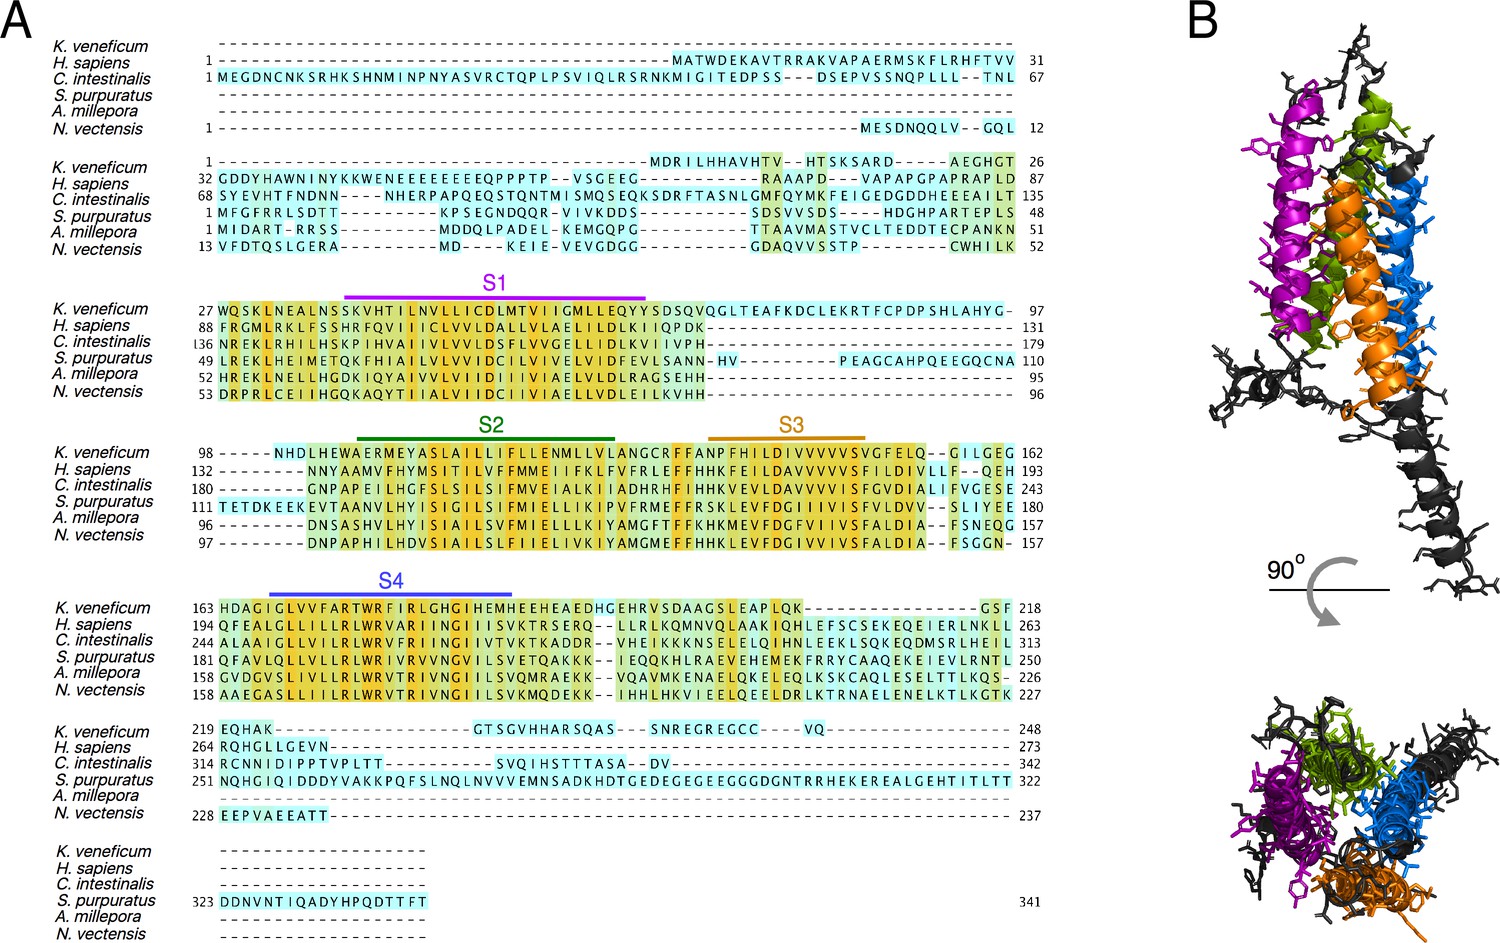
Protein sequence alignment of the AmHv1 channel with selected Hv1s from other organisms.
(A) Amino acid sequence alignment of Acropora millepora Hv1 (AmHv1) with other known Hv1 orthologs provided by the CLUSTAL-O algorithm. The predicted transmembrane domains are shown by the colored horizontal lines and letters. The colors highlighting the sequence indicate sequence identity. Orange indicates identical amino acids, and cyan indicates no identity. (B) Predicted structural topology of AmHv1. Transmembrane domains are colored to correspond with the sequences in (A). The top panel is the view parallel to the membrane while the bottom panel is the view from the top (extracellular) side.
Figure 2—figure supplement 1
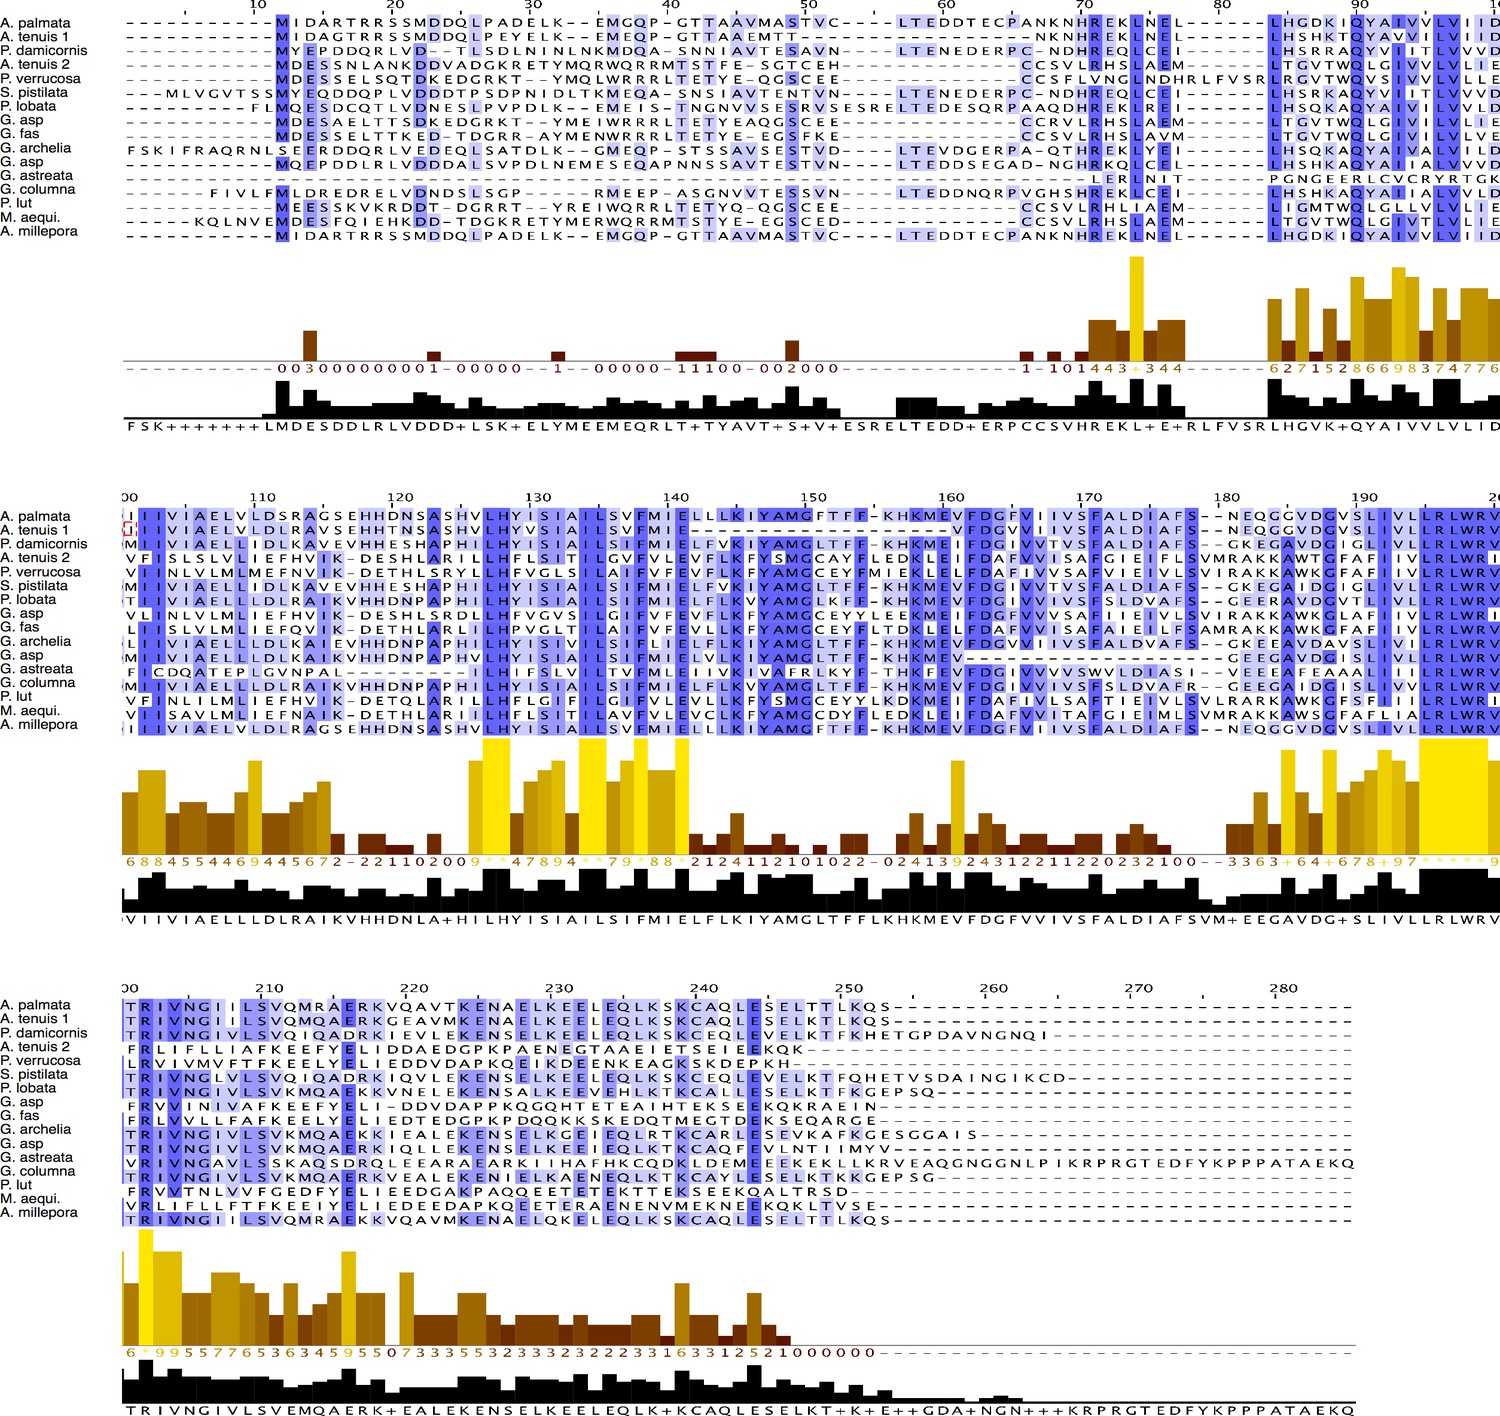
Comparison of the AmHv1 protein sequence with similar sequences found in other coral species.
Species for which transcriptomes are available at Reefgenomics.org and https://dornsife.usc.edu/labs/carlslab/data/ are Acropora palmata, Acropora tenuis, Posillopora damicornis, Posillopora verrucosa, Stylophora pistilata, Porites lobata, Goniastrea aspera (G. asp), Galaxea fascicularis (G. fas), Galaxea acrhelia, Galaxea astreata, Goniopora columna, Porites lutea, Montastrea aequituberculata (M. aequi.), and Acropora millepora. The histograms below the sequences indicate the degree of conservation and the consensus sequence.
Figure 3
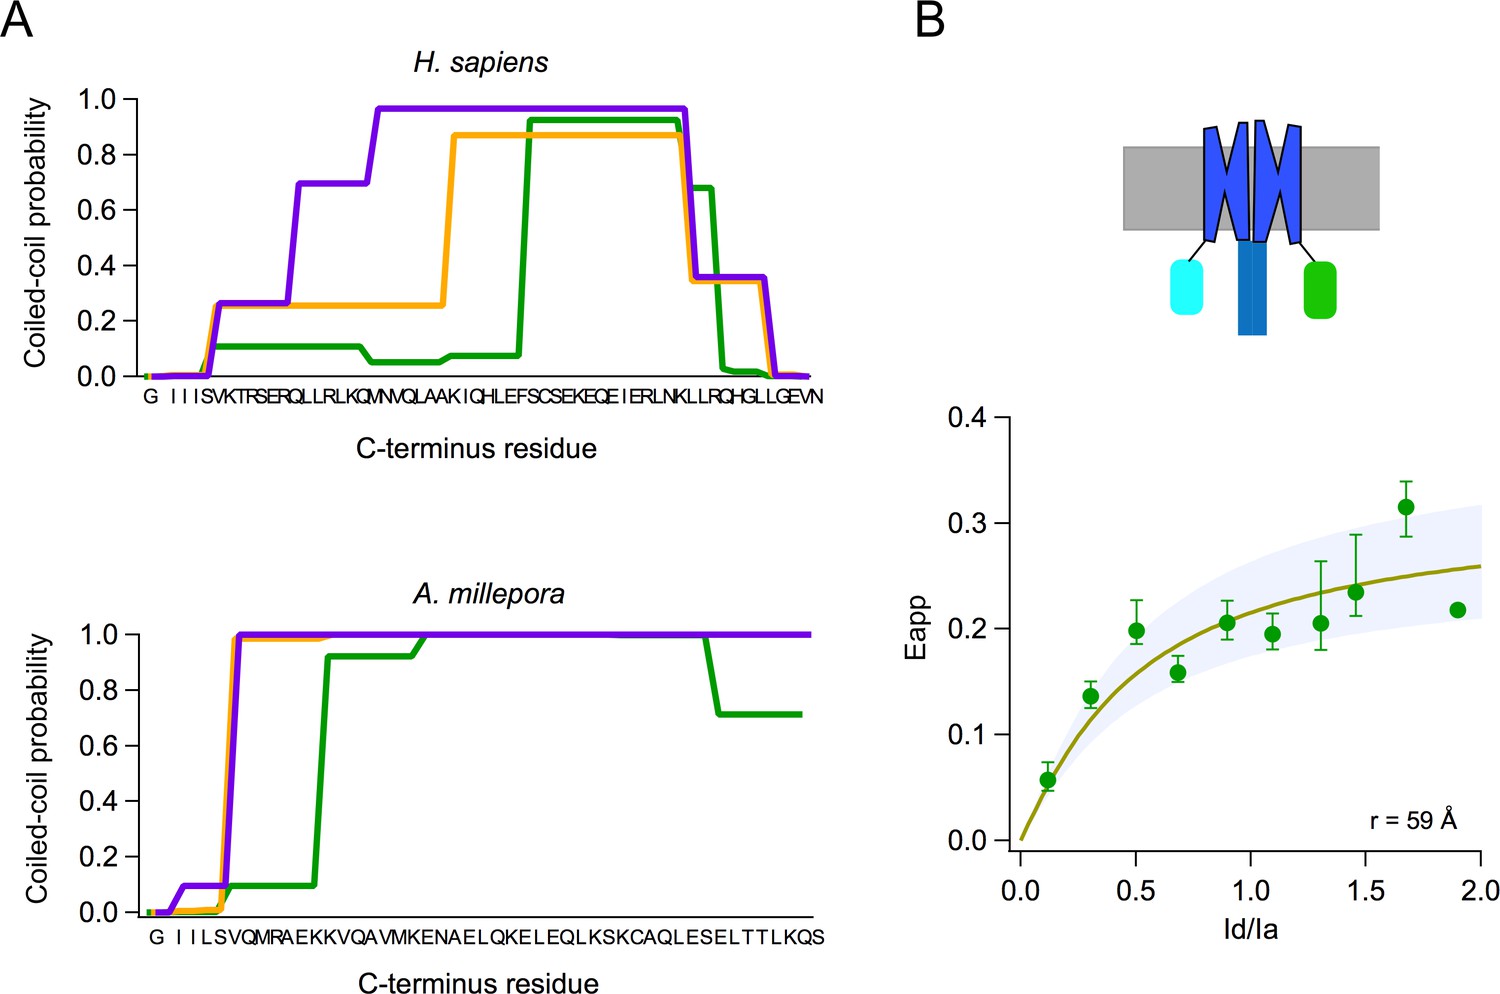
Subunits of the AmHv1 channel associate to form dimers.
(A) Probability of coiled-coil formation per amino acid residue of the C-terminus domain of hHv1 (top) and Acropora millepora Hv1 (AmHv1) (bottom). The different colors correspond to the three seven-residue windows used by the program to calculate the score. The sequence of the C-terminus is shown in the x-axis. (B) FRET measurement of dimer formation. The apparent FRET measured from 134 cells is plotted as a function of the ratio of donor to acceptor fluorescence (Id/Ia). Shown is the average and sem for data in Id/Ia windows of 0.1. The continuous curve is the fit of the data to the prediction of a model that considers random assembly of donor- and acceptor-tagged subunits into a dimer. The separation between the FRET pairs in a dimer is ~60 Å, according to the model. The upper panel depicts a cartoon of the presumed fluorescent protein (FP)-tagged dimer in the membrane.
-
Figure 3—source data 1
Source data for Figure 3.
- https://cdn.elifesciences.org/articles/69248/elife-69248-fig3-data1-v1.xlsx
Figure 4

Proton currents mediated by AmHv1 expressed in HEK293 cells.
(A) A typical proton current family elicited by depolarizing pulses from −50 to 60 mV in 10 mV intervals. The duration of the pulses is 500 ms. Linear current components have been subtracted. (B) Reversal potential of currents as a function of the pH gradient. Symbols are individual data and the black horizontal lines are the mean. The dotted line is the expected reversal potential as predicted by the Nernst equation. The inset shows a tail current family from which instantaneous IV curves were extracted to measure the reversal potential. Recordings shown in (A) and (B) were obtained in the whole-cell configuration. (C) Normalized conductance-voltage curve at ∆pH = 1. The purple curve is the fit to Equation 1 with parameters V0.5 = 7.85 mV and q = 2.09 eo. Circles are the mean and error bars are the sem (n = 7). (D) Kinetic parameters of activation. Activation time constant and delay estimated from fits of current traces to Equation 2. Circles are the mean, and the sem is indicated by the shaded areas (n = 6). The voltage-dependence of the delay and tau of activation were estimated from a fit to Equation 3, which appears as the red curve. Parameters are δ(0) = 98.2 ms and qδ = 0.47 eo. The voltage-dependence parameters for tau are τ(0) = 212 ms and qτ = 0.37 eo.
-
Figure 4—source data 1
Source data for Figure 4.
- https://cdn.elifesciences.org/articles/69248/elife-69248-fig4-data1-v1.xlsx
Figure 5
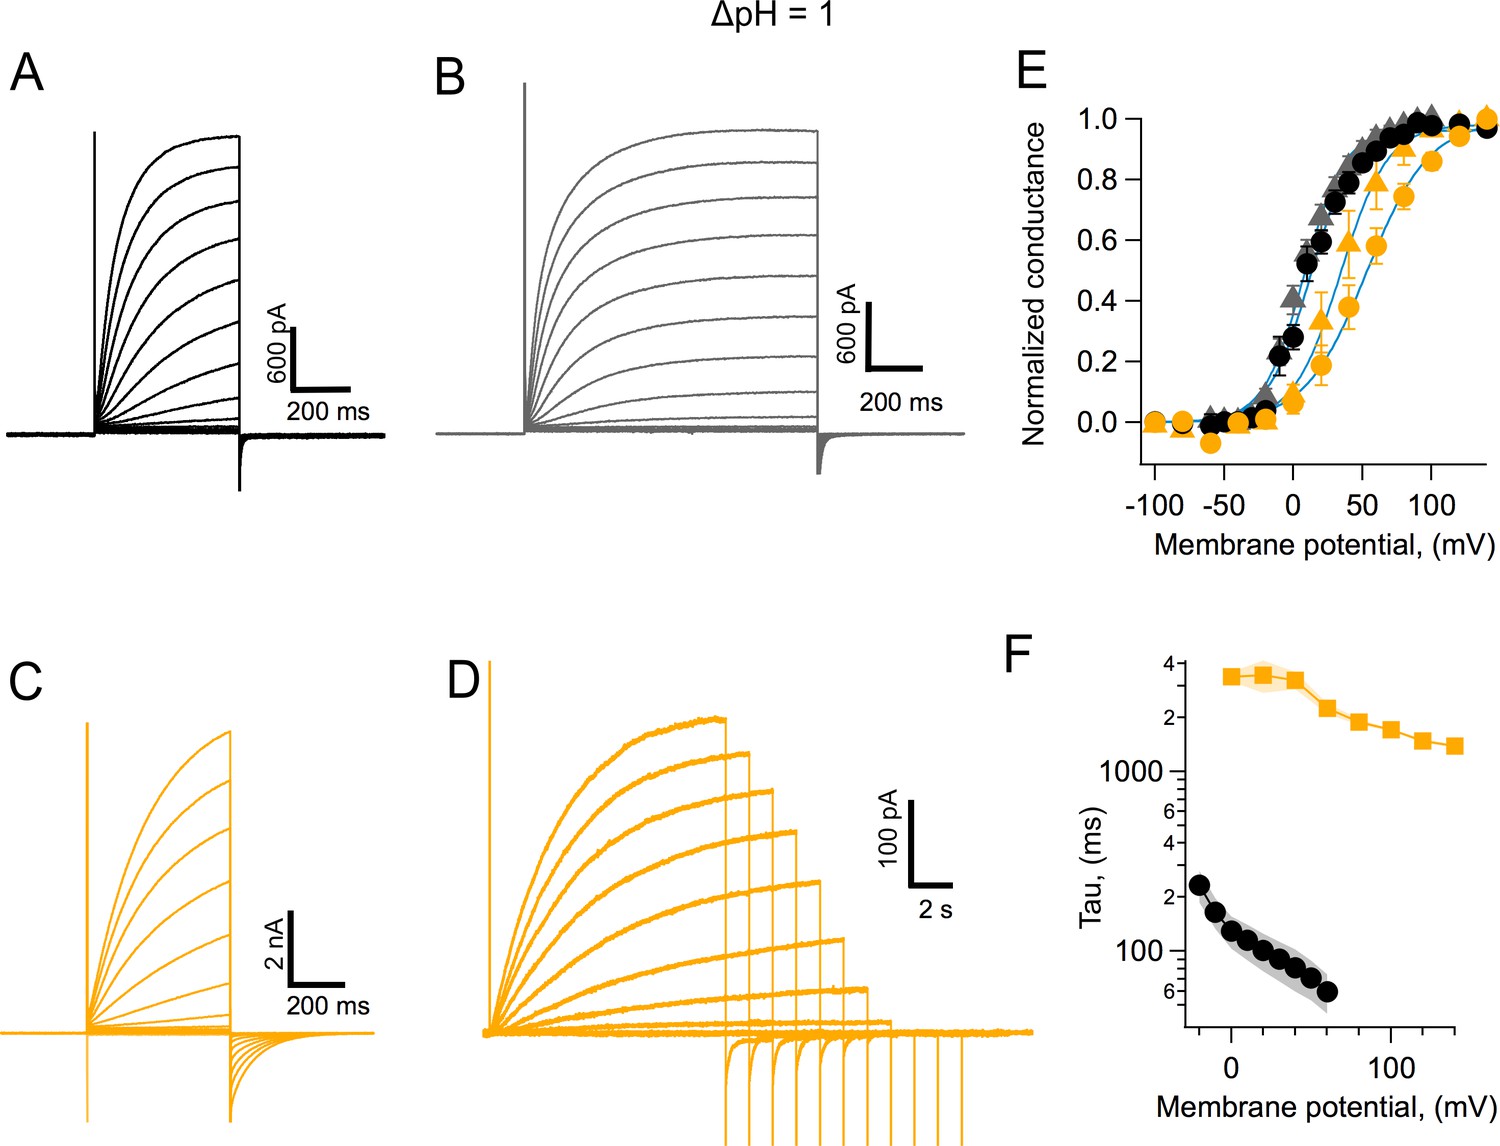
Coral Hv1 channels are faster and activate more readily than their human counterpart.
(A) Acropora millepora Hv1 (AmHv1) currents in response to voltage-clamp pulses from −100 to 120 mV and of 500 ms duration. (B) AmHv1 currents in response to the same voltage-clamp pulses as in (A) but of a longer duration of 800 ms. (C) Currents through hHv1 channels in response to voltage-clamp pulses from −100 to 120 mV of 500 ms duration, compared with (A). (D) hHv1 currents recorded with long pulses designed to reach the steady state. Pulses were shortened in duration as depolarizations became larger, in an effort to reduce intracellular proton depletion. Pulses are from −100 to 140 mV. Recordings shown in (A), (B), (C), and (D) were obtained in the whole-cell configuration. (E) Comparison of the conductance-voltage relationship for both channels for short- (circles) and long (triangles)-duration pulses. Black symbols are the mean G/Gmax for AmHv1 and yellow symbols for hHv1. The error bars are the sem (n = 3, for short pulses, both channels, and n = 4, for long pulses, both channels). The continuous blue curves are fits to Equation 1. The fitted parameters are AmHv1, short pulses, q = 1.62 eo, V0.5 = 12.2 mV; AmHv1, long pulses, q = 1.7 eo, V0.5 = 7.7 mV; hHv1, short pulses, q = 1.11 eo, V0.5 = 53.1 mV; hHv1, long pulses, q = 1.47 eo, V0.5 = 34.1 mV. (F) The activation time constant estimated from fits of currents elicited by long pulses to Equation 2. Squares are the mean for hHv1 and circles, for AmHv1. The shaded areas are the sem (n = 4, for both channels).
-
Figure 5—source data 1
Source data for Figure 5.
- https://cdn.elifesciences.org/articles/69248/elife-69248-fig5-data1-v1.xlsx
Figure 6 with 2 supplements
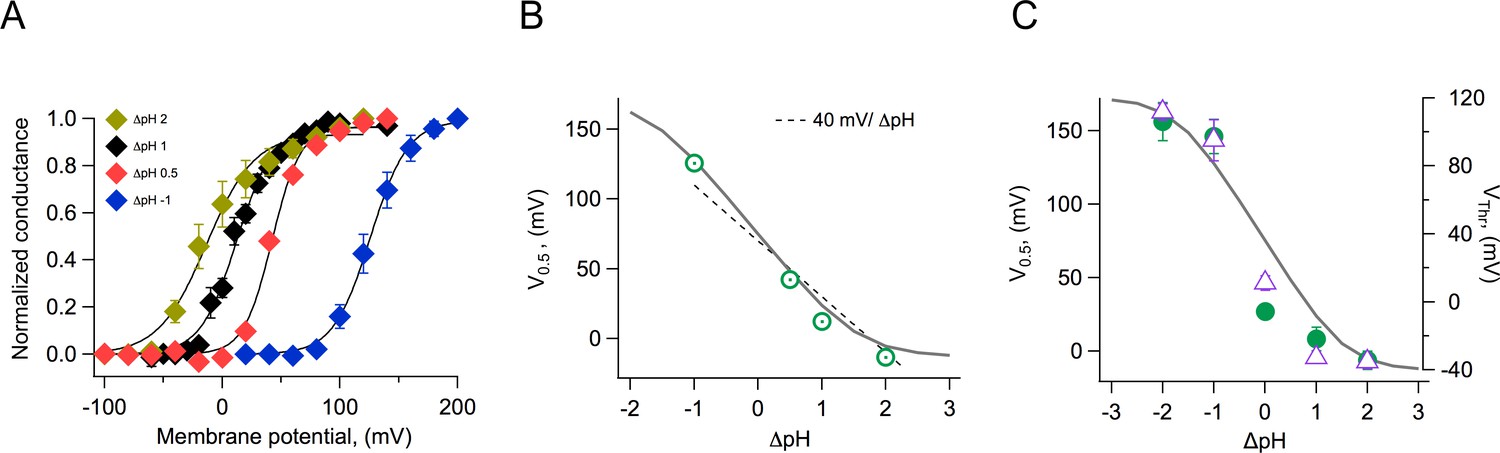
Modulation of channel activation by the pH gradient.
(A) Conductance vs voltage relationships obtained at the indicated ΔpH values, from whole-cell recordings of Acropora millepora Hv1 (AmHv1) proton currents. Continuous lines are fits to Equation 1. (B) The parameter V0.5 was obtained from the fits in (A) and is displayed as a function of ΔpH. The dotted line is the 40 mV/ΔpH linear relationship. The continuous gray curve is the prediction of the allosteric model (Figure 7). (C) Parameters V0.5 (green circles) and VThr (purple triangles) obtained from a different set of inside-out current recordings. Data are mean ± sem. The continuous gray curve is the same prediction of the allosteric model (Figure 7) that is shown in panel (B). The model parameters used to generate the theoretical curve are E = 5x10⁵, D = 105, C = 0.0002, Kv(0) = 0.00005, qg = 1.0 eo, pKo = 3.4, and pKi = 7.
-
Figure 6—source data 1
Source data for Figure 6.
- https://cdn.elifesciences.org/articles/69248/elife-69248-fig6-data1-v1.xlsx
Figure 6—figure supplement 1
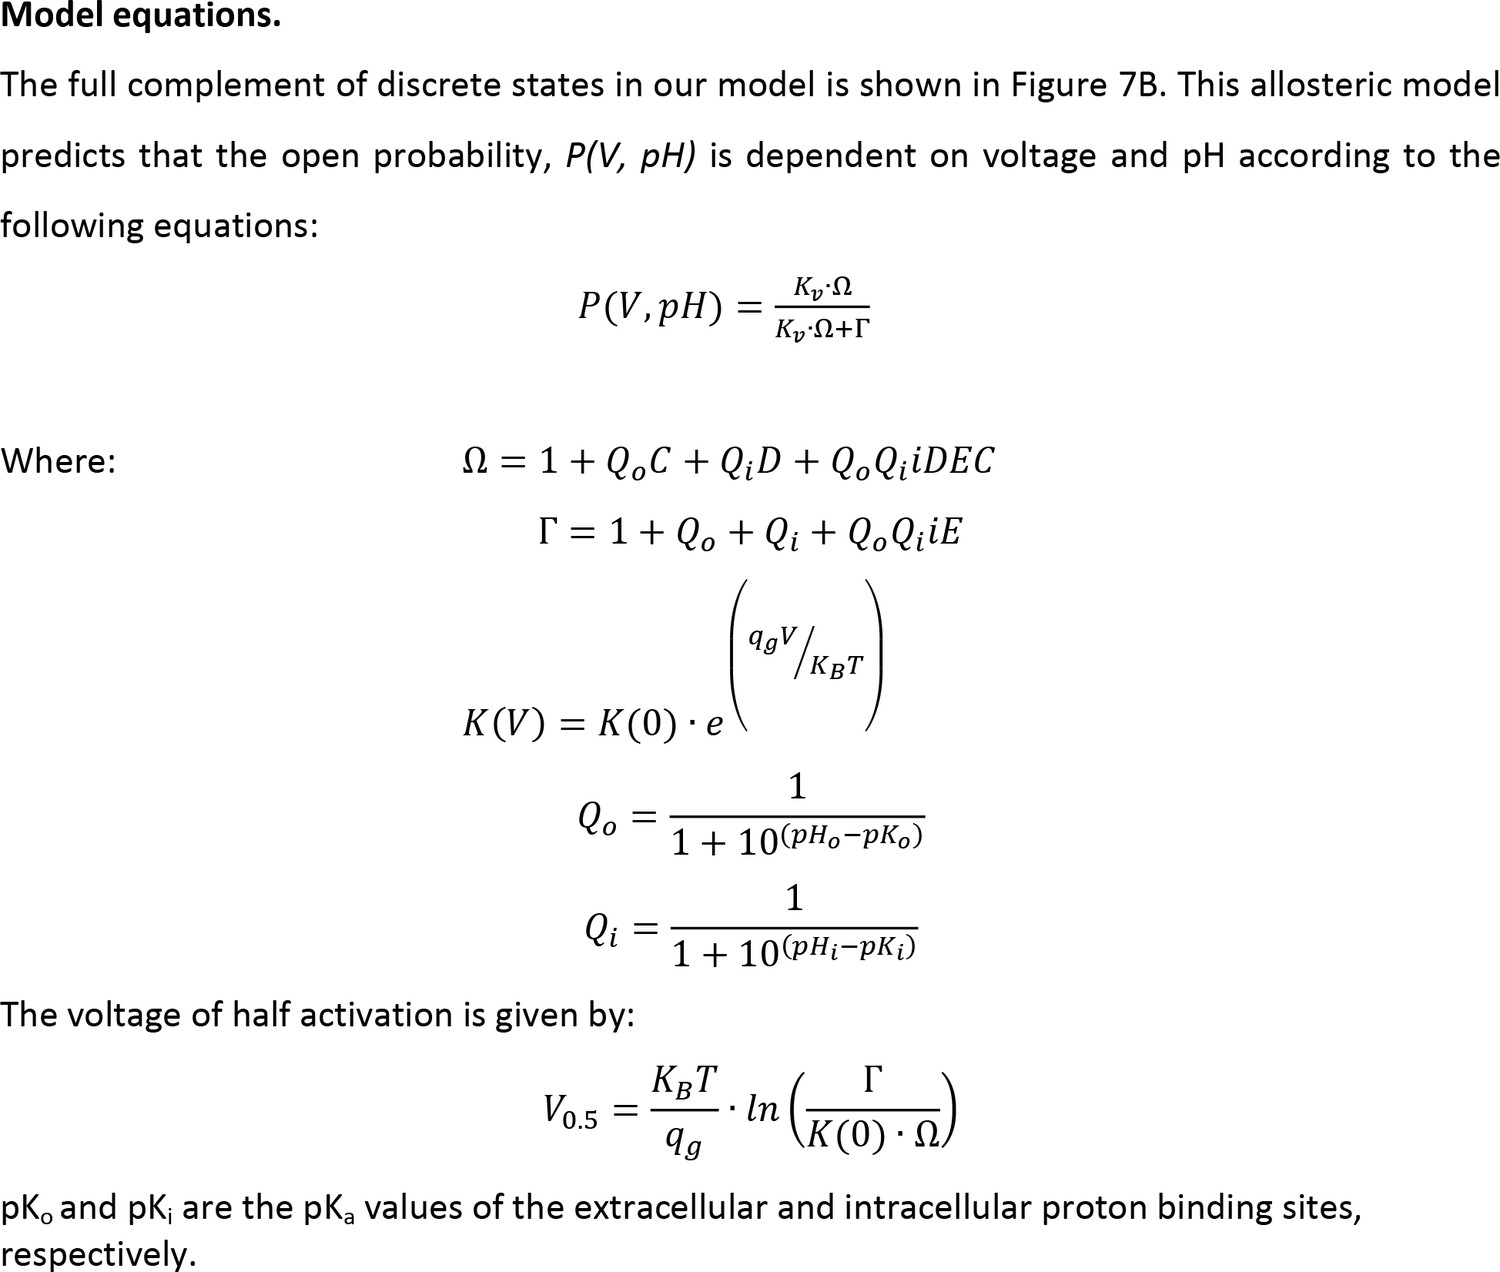
Equations for the model in Figure 7.
These equations describe the steady-state open probability of the channel as a function of voltage and the internal and external pH.
Figure 6—figure supplement 2
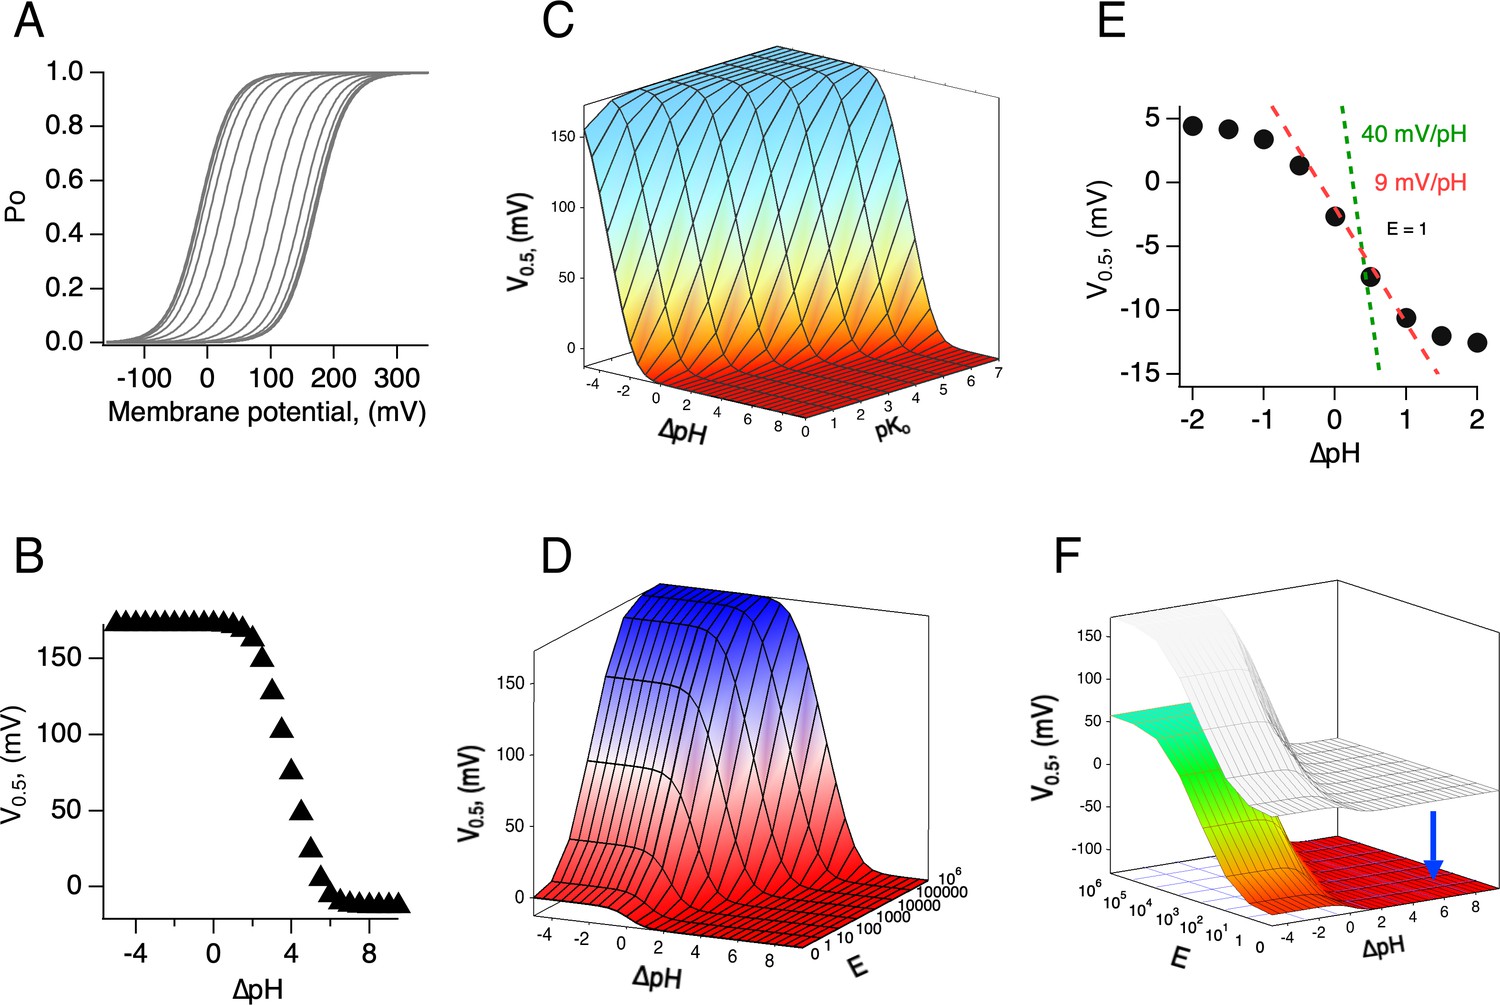
Simulations of the voltage- and pH-dependent behavior predicted by the allosteric model.
(A) Calculated conductance-voltage (G-V) curves and (B) V0.5 as a function of ΔpH. The range of ΔpH values is the same for both the panels. Model parameters are pKo, pKi = 7, K(0) = 0.00005, q = 1 eo, E = 106, C = 0.0002, and D = 105. (C) V0.5 as a function of ΔpH calculated for different values of pKo. (D) V0.5 as a function of ΔpH calculated for different values of the coupling factor E, which determines the allosteric communication between external and internal protonation sites. Note that a lack of coupling between sites (E = 1) results in channels with very shallow modulation by pH, as illustrated in (E). All other parameters are as in (A) and (B). (E) A slice of the surface in (D), with E = 1. The two lines show the expected dependence of V0.5 on ΔpH for a fully modulated channel (E>100). Also shown is the dependence of 9 mV/ΔpH unit. (F) The range of V0.5 is dependent on the value of the voltage-dependent equilibrium constant at 0 mV. An increase to K(0) = 0.005 shifts the whole surface by approximately −110 mV. All other parameters are as in (D).
-
Figure 6—figure supplement 2—source code 1
Source code for Figure 6—figure supplement 2.
- https://cdn.elifesciences.org/articles/69248/elife-69248-fig6-figsupp2-code1-v1.xlsx.zip
Figure 7

Gating scheme I.
(A) Modular representation of a simple Monod-Wyman-Changeux (MWC) model; the channel opening transition is voltage-dependent, with equilibrium constant K(V). Bo and Bi are the unbound states of the extracellular and intracellular proton-binding sites, respectively, and BoHo and BiHi are the proton-bound states of these binding sites. Qo and Qi are equilibrium constants that depend on the pKa of each of these binding states. C, D, and E are the coupling constants between each of the indicated modules. (B) All the individual states implied in (A) are depicted, along with proton-binding states and the appropriate equilibrium constants. C, closed states, O, open states. OHx, OHxHx and CHx, CHxHx are single or double proton-occupied states, where x can be o for outside or i for inside-facing binding sites.
Figure 8
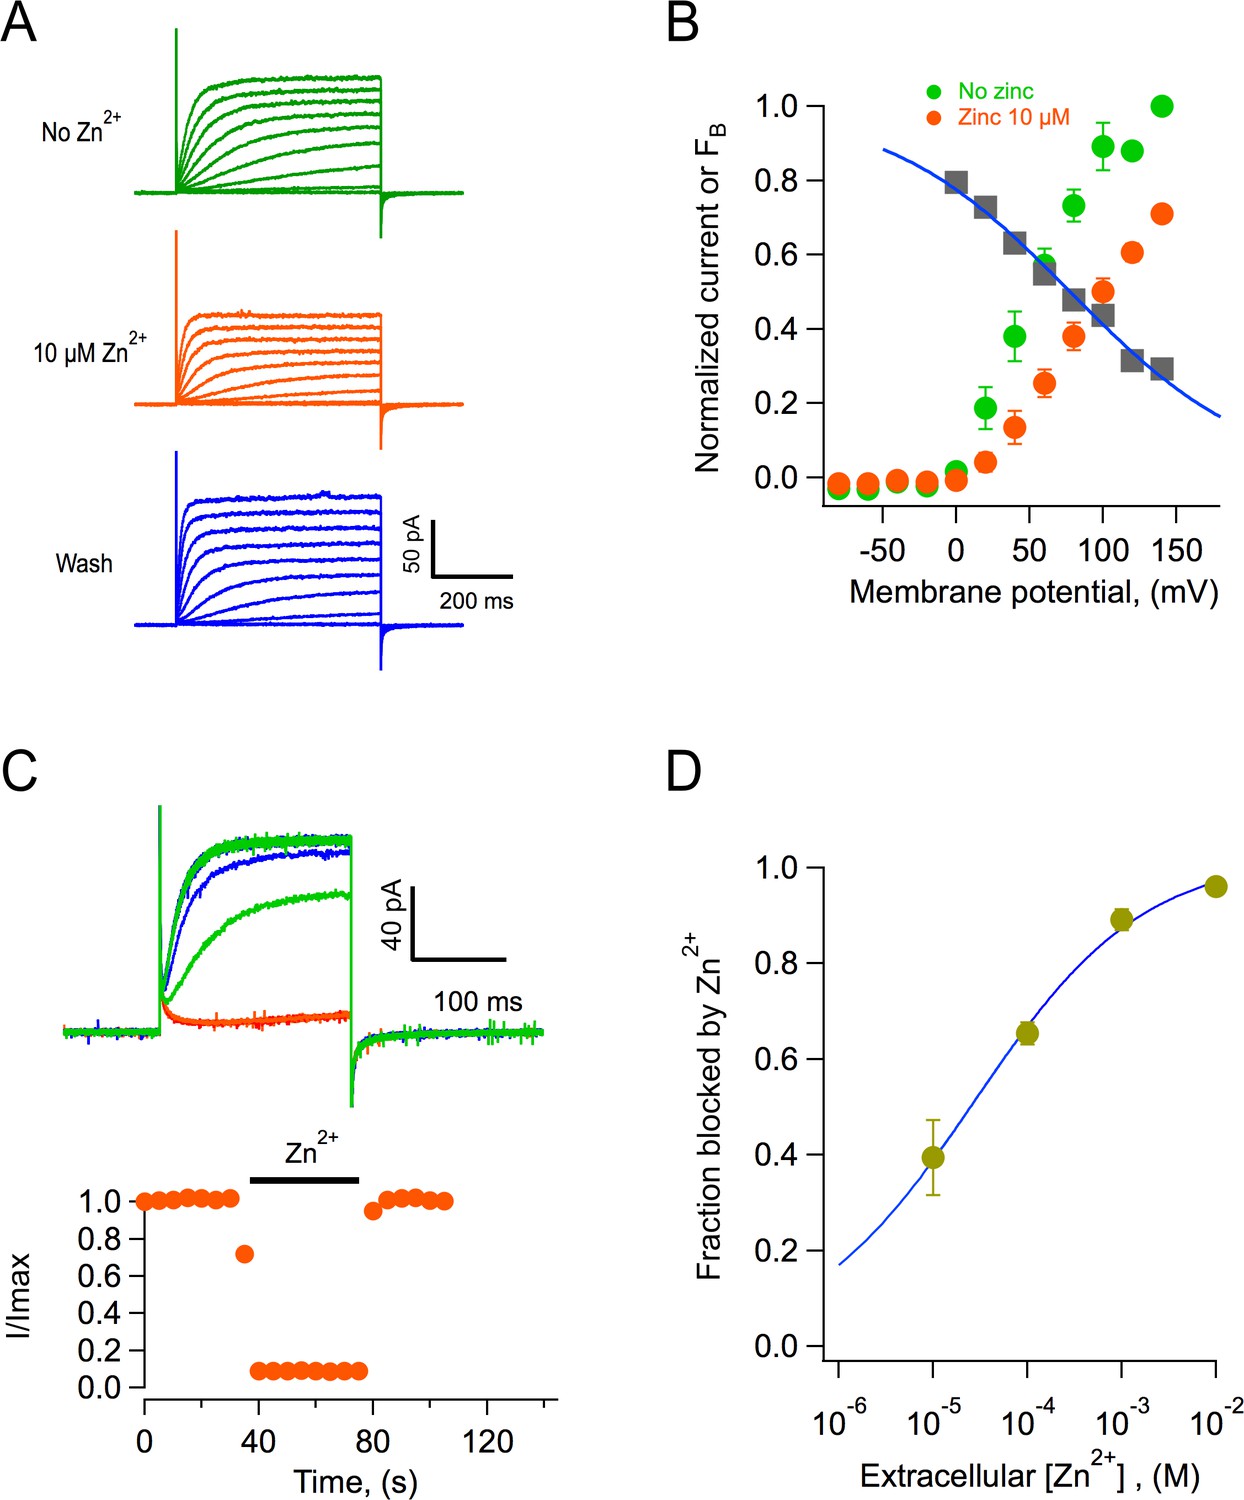
Block of AmHv1 channels by extracellular zinc.
(A) Acropora millepora Hv1 (AmHv1)-mediated currents from an outside-out patch in the absence (top) and presence of 10 μM zinc (middle) and after washing of zinc (bottom). The scale bars apply to the three current families. Voltage pulses lasted 500 ms and were from −80 to 140 mV in 20 mV steps. The ΔpH = 1 with pHi = 6 and pHo = 7. (B) Normalized current-voltage relationships before and in the presence of 10 μM zinc from four patches as in (A). The gray squares are the ratio Izinc(V)/I(V), which gives the voltage-dependence of the blocking reaction. The blue curve is the fit to the Woodhull equation , where FB is the fraction of the current blocked, δ is the fraction of the electric field where the blocker binds, z is the valence of the blocker, V0.5 is the potential where half of the current is blocked, KB is Boltzmann’s constant, and T is the temperature in Kelvin. The fitting parameters are δ = 0.19, V0.5 = 77.6 mV. (C) The effect of zinc is fast. Application of 1 mM zinc to an outside-out patch produces almost instantaneous block of ~90% of the current. The effect also washes off quickly upon removal of zinc. Trace colors are as in (A). Voltage pulse was 100 mV applied every 5 s. (D) Dose-response curve of zinc block of AmHv1 obtained at 100 mV. The continuous curve is a fit of the data to Equation 4 with apparent KD = 27.4 μM and n = 0.48.
-
Figure 8—source data 1
Source data for Figure 8.
- https://cdn.elifesciences.org/articles/69248/elife-69248-fig8-data1-v1.xlsx
Tables
Table 1
Oligonucleotides used to clone amino- and carboxy-terminal partial sequences of AmHv1 from total reverse-transcribed mRNA from A. millepora.
| Oligo name | Sequence |
|---|---|
| AcHvNt5´ | ATGATTGATGCAAGAACCAGACGATCGAGCATGGATGAT |
| AcHvNt3´ | TGATCCTGCTCTCAAGTCAAGAACCAACTCAGCAATGAC |
| AcHvCt5´ | ATGGGATTCACATTTTCAAGCACAAATGGAGGTGTTT |
| AcHvCt3´ | TCAGCTTTGTTTTAATGTTGTCAATTCAGACTCCAACTG |
Additional files
Download links
A two-part list of links to download the article, or parts of the article, in various formats.
Downloads (link to download the article as PDF)
Open citations (links to open the citations from this article in various online reference manager services)
Cite this article (links to download the citations from this article in formats compatible with various reference manager tools)
Discovery and characterization of Hv1-type proton channels in reef-building corals
eLife 10:e69248.
https://doi.org/10.7554/eLife.69248


