A population-level invasion by transposable elements triggers genome expansion in a fungal pathogen
- Laboratory of Evolutionary Genetics, Institute of Biology, University of Neuchâtel, Switzerland
- Institute for Plant and Microbial Biology, University of Zurich, Switzerland
- Ecologie Systématique Evolution, Bâtiment 360, Univ. Paris-Sud, AgroParisTech, CNRS, Université Paris-Saclay, France
- Plant Pathology, Institute of Integrative Biology, ETH Zurich, Switzerland
- Department of Botany and Plant Pathology, Oregon State University, United States
Figures
Figure 1 with 3 supplements
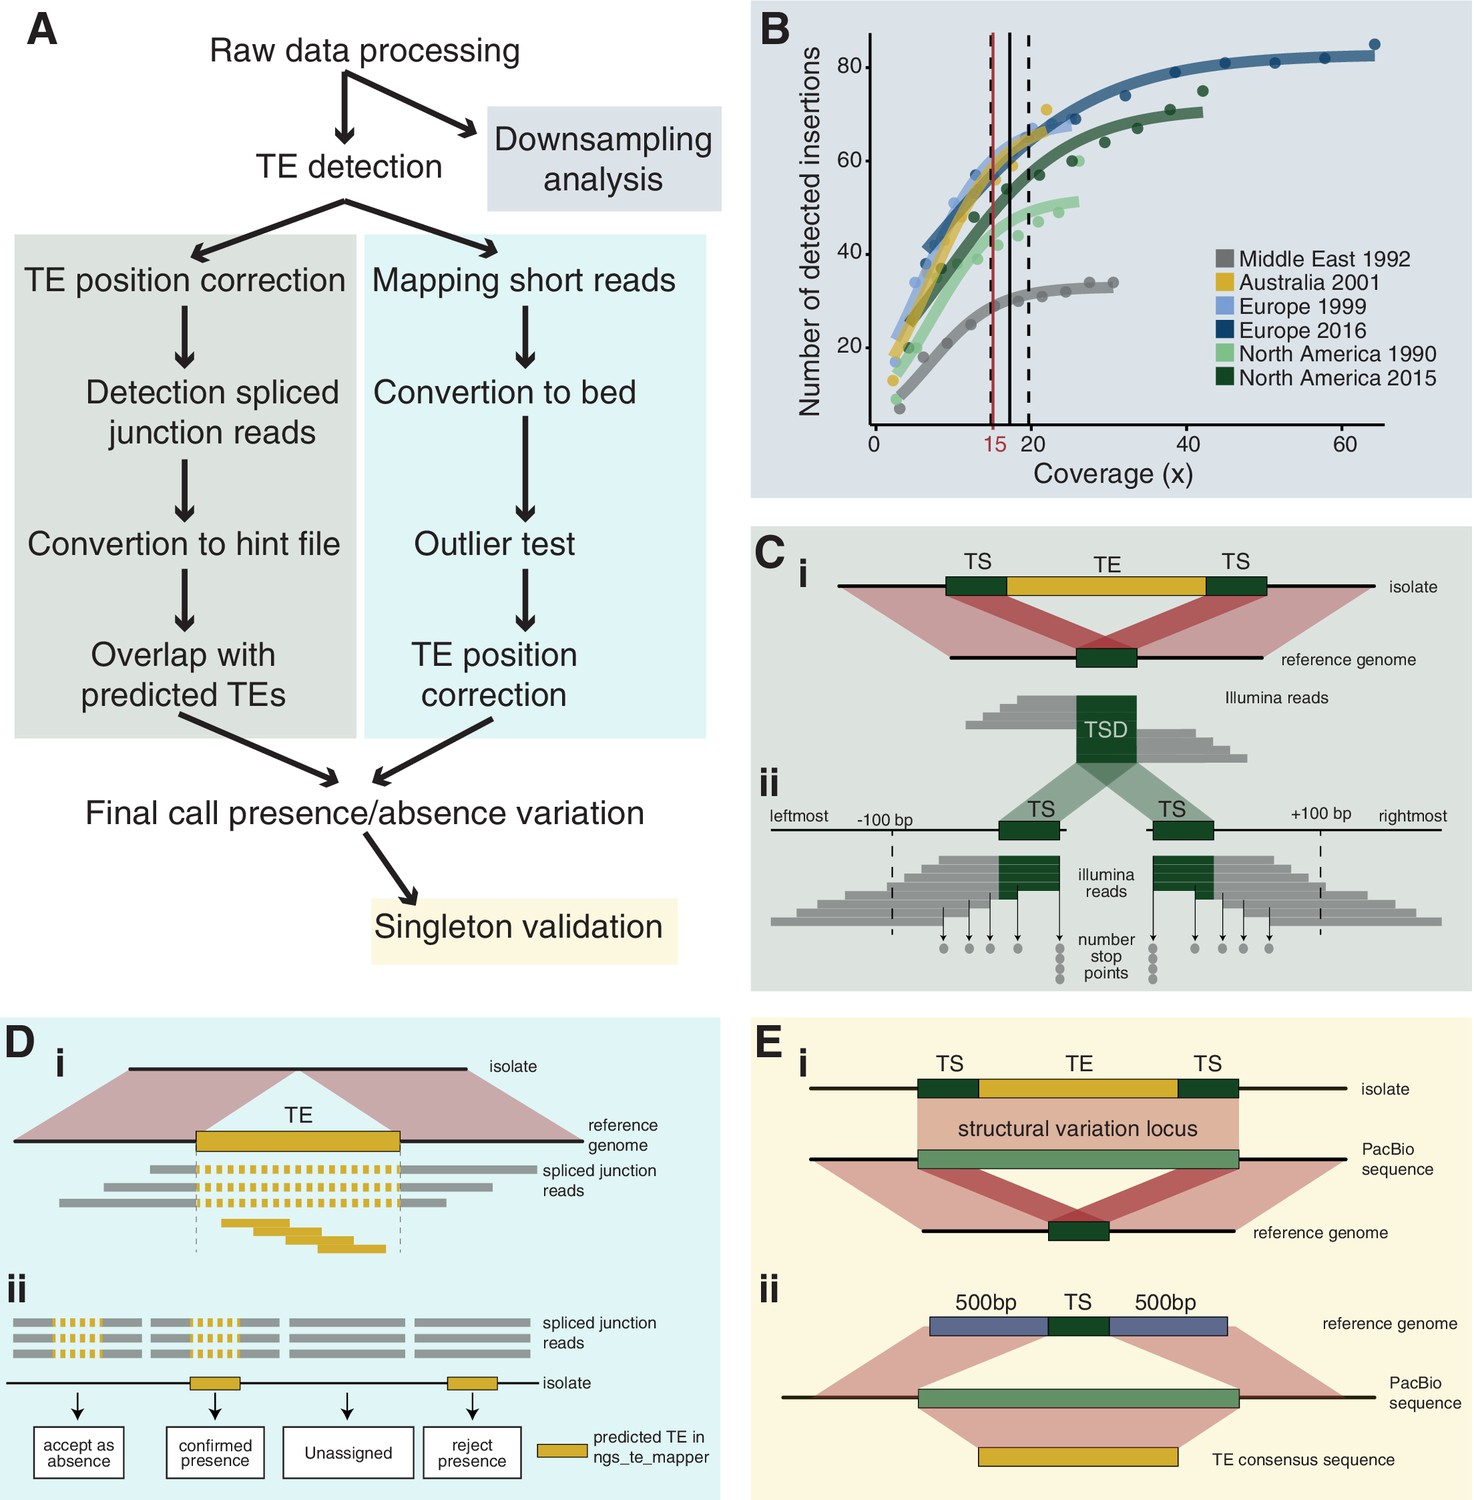
Robust discovery and validation of transposable element (TE) insertions: (A) General analysis pipeline.
(B) Read depth downsampling analysis for one isolate per population with an average coverage of the population. The vertical black line indicates the coverage at which on average 90% of the maximally detectable variants were recovered. Dashed black lines indicate the standard error. The threshold for a minimal mean coverage was set at 15× (red line). (C) Validation of insertions absent in the reference genome. (i) TE insertions that are not present in the reference genome show a duplication of the target site and the part of the reads that covers the TE will not be mapped against the reference genome. We thus expect reads to map to the TE surrounding region and the target site duplication but not the TE itself. At the target site, a local duplication of read depth is expected. (ii) We selected all reads in an interval of 100 bp up- and downstream including the target site duplication to detect deviations in the number of reads terminating near the target site duplication. (D) Validation of insertions present in the reference genome. (i) Analyses read coverage at target site duplications. (ii) Decision map if a TE should be kept as a true insertion or rejected as a false positive. Only predicted TE insertions that overlap evidence of split reads were kept as TE insertions in downstream analyses. (E) Singleton validation using long-read PacBio sequencing. (i) Analysis if TE insertions overlap with a detected insertion/deletion locus (Badet et al., 2021). (ii) Homology search of the TE insertion flanking sequences based on the reference genome against PacBio reads. In addition, the consensus sequence of the inserted TE was used for matches between the flanks.
-
Figure 1—source data 1
TE insertion validations for non-reference copies.
- https://cdn.elifesciences.org/articles/69249/elife-69249-fig1-data1-v1.txt
-
Figure 1—source data 2
TE consensus sequences.
- https://cdn.elifesciences.org/articles/69249/elife-69249-fig1-data2-v1.txt
Figure 1—figure supplement 1
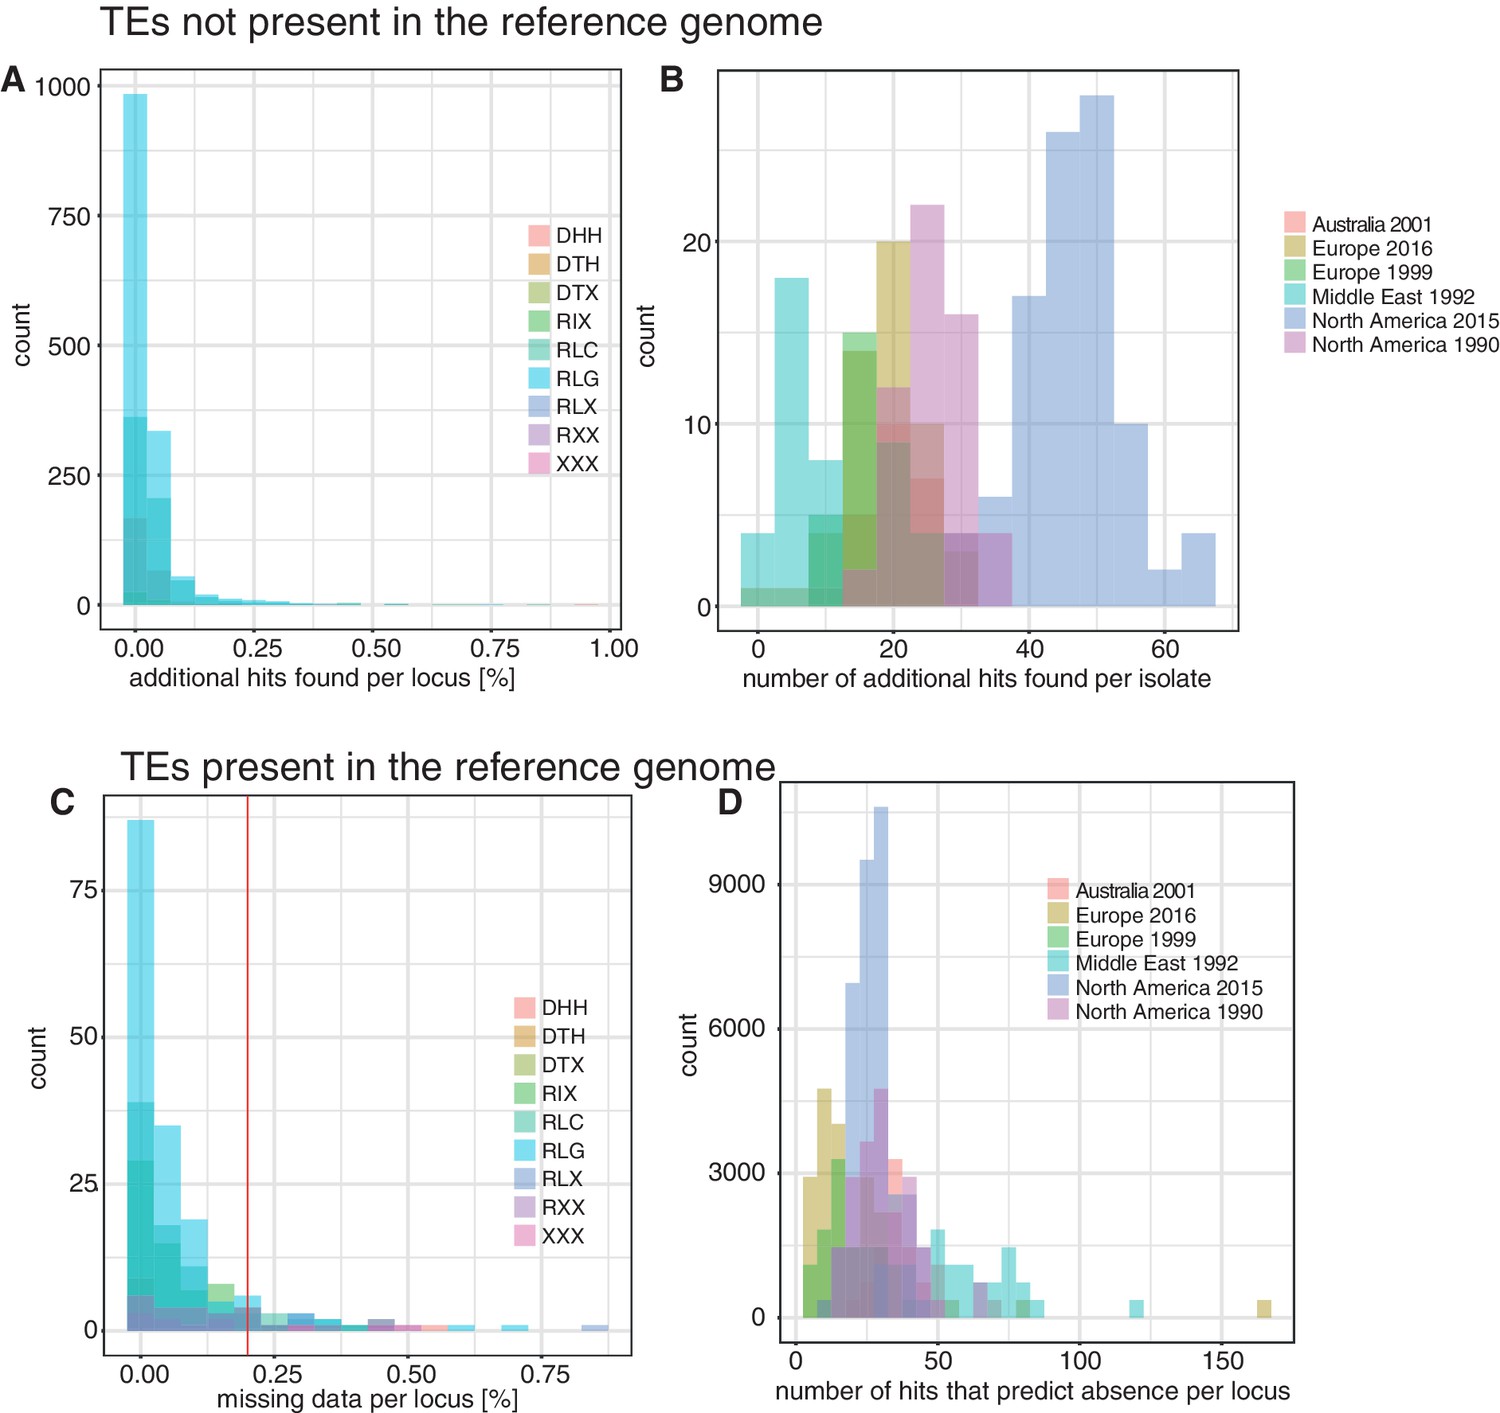
Validation of transposable element (TE) insertion predictions.
(A) TEs not present in the reference genome: distribution of additional TE hits found per locus after the outlier test. Color indicates superfamilies. (B) TEs not present in the reference genome: distribution of additional TE hits found per population after the outlier test. Colors indicate populations. (C) TEs present in the reference genome: distribution of missing data per locus after the validation with spliced junction reads. Missing data indicates that the TE was not predicted with ngs_te_mapper and that there was no indication of spliced reads. The red line ( = 20%) indicates the threshold for missing data. TE loci with an amount of missing data >20% were completely excluded from further analyses. Color indicates superfamily. (D) TEs present in the reference genome: detection of strong outlier isolates with a high number of split reads. Color indicates the population.
Figure 1—figure supplement 2

Establishment of transposable element (TE) loci with differing start and end positions in the isolates.
Distribution of length of distance for start position, end position, and both start and end combined after the correction.
Figure 1—figure supplement 3
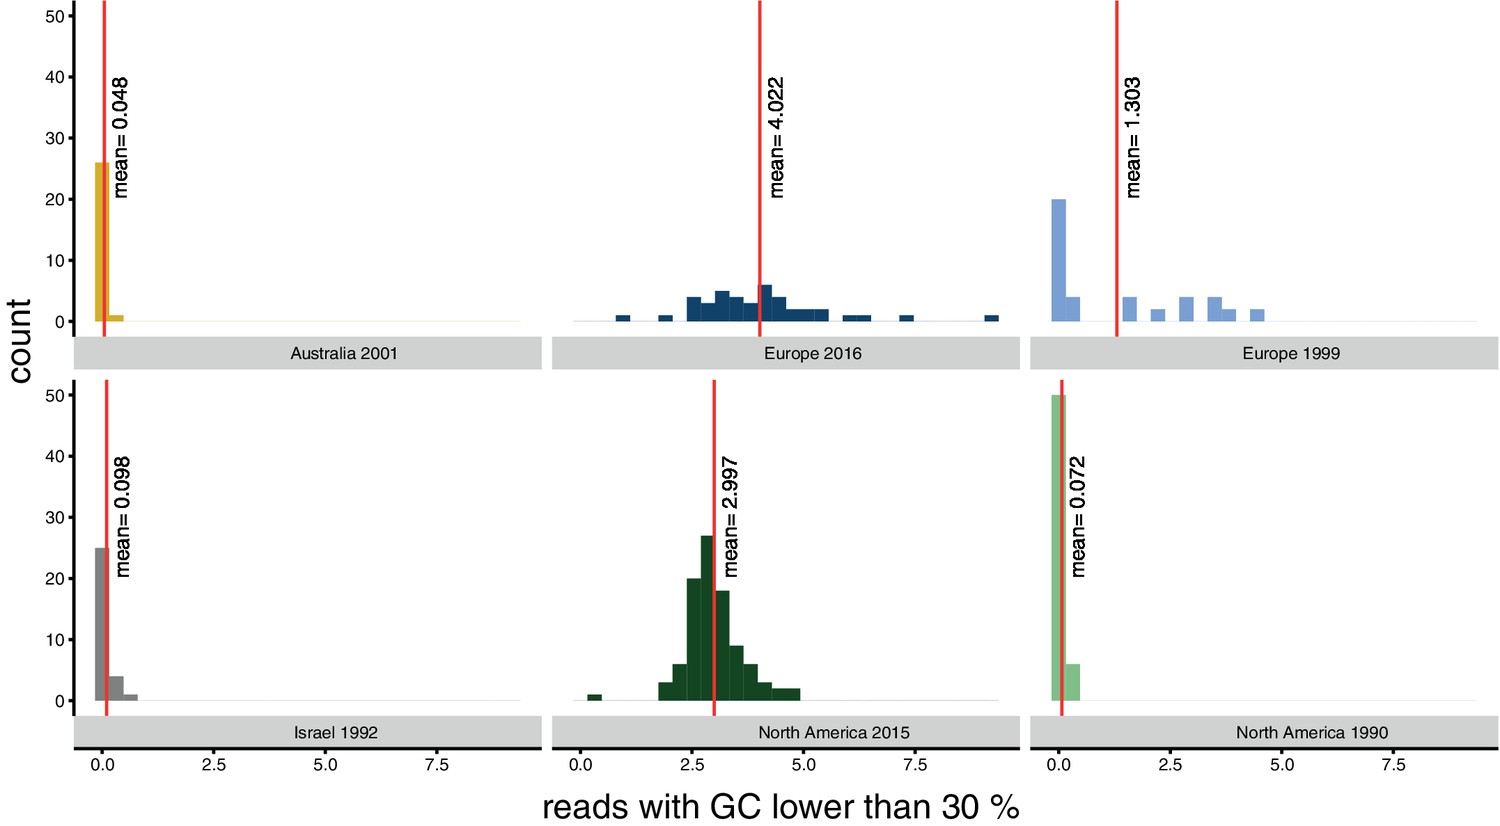
Bias for reads with a GC content lower than 30% per population.
Red lines indicate the mean.
Figure 2 with 3 supplements
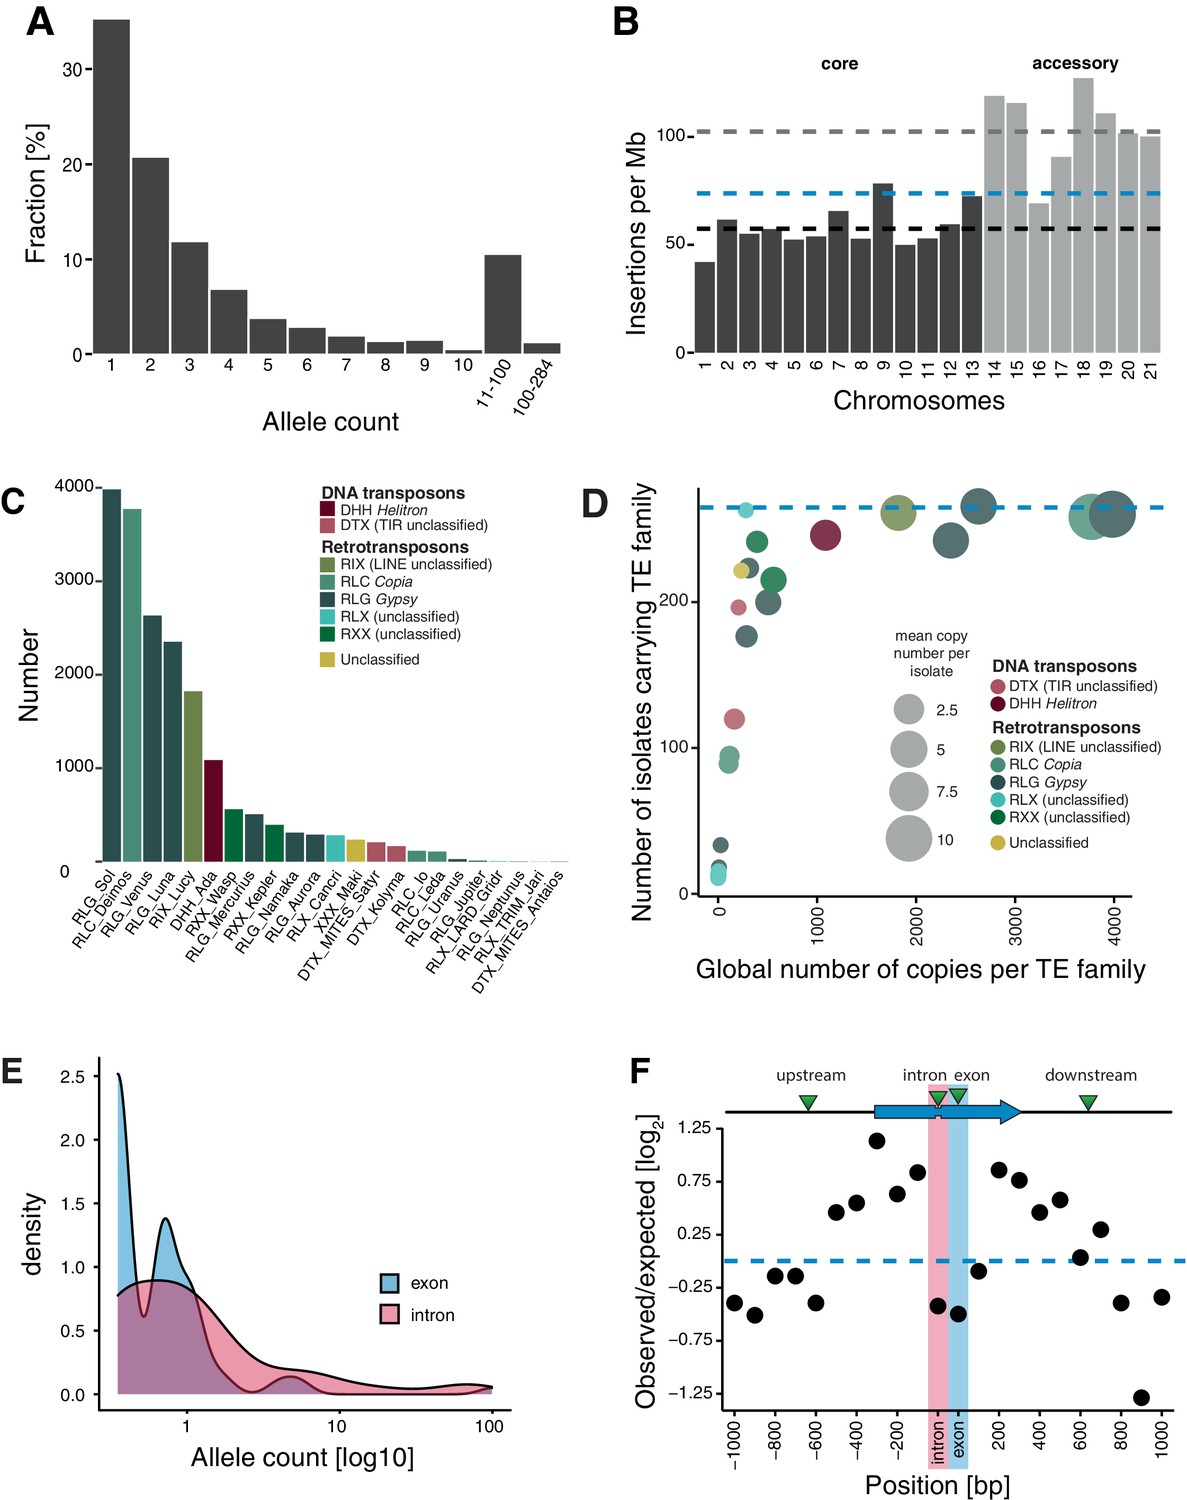
Transposable element (TE) landscape across populations.
(A) Allele frequencies of the TE insertions across all isolates. (B) TE insertions per Mb on core chromosomes (dark) and accessory chromosomes (light). Dashed lines represent mean values. Blue: global mean of 75.65 insertions/Mb, dark: core chromosome mean of 58 TEs/Mb, light: accessory chromosome mean of 102.24 insertions/Mb. (C) Number of TE insertions per family. (D) TE frequencies among isolates and copy numbers across the genome. The blue line indicates the maximum number of isolates (n = 284). (E) Allele frequency distribution of TE insertions into introns and exons. (F) Number of TE insertions within 1 kb up- and downstream of genes on core chromosomes including introns and exons (100 bp windows). The blue arrow indicates a gene schematic with exons and an intron, the green triangles indicate TE insertions. The dotted blue line indicates no deviation from the expected value (i.e., mean number of TEs per window).
-
Figure 2—source data 1
TEs in reference.
- https://cdn.elifesciences.org/articles/69249/elife-69249-fig2-data1-v1.txt
-
Figure 2—source data 2
Presence absence matrix TE loci.
- https://cdn.elifesciences.org/articles/69249/elife-69249-fig2-data2-v1.txt
-
Figure 2—source data 3
Singletons.
- https://cdn.elifesciences.org/articles/69249/elife-69249-fig2-data3-v1.txt
Figure 2—figure supplement 1
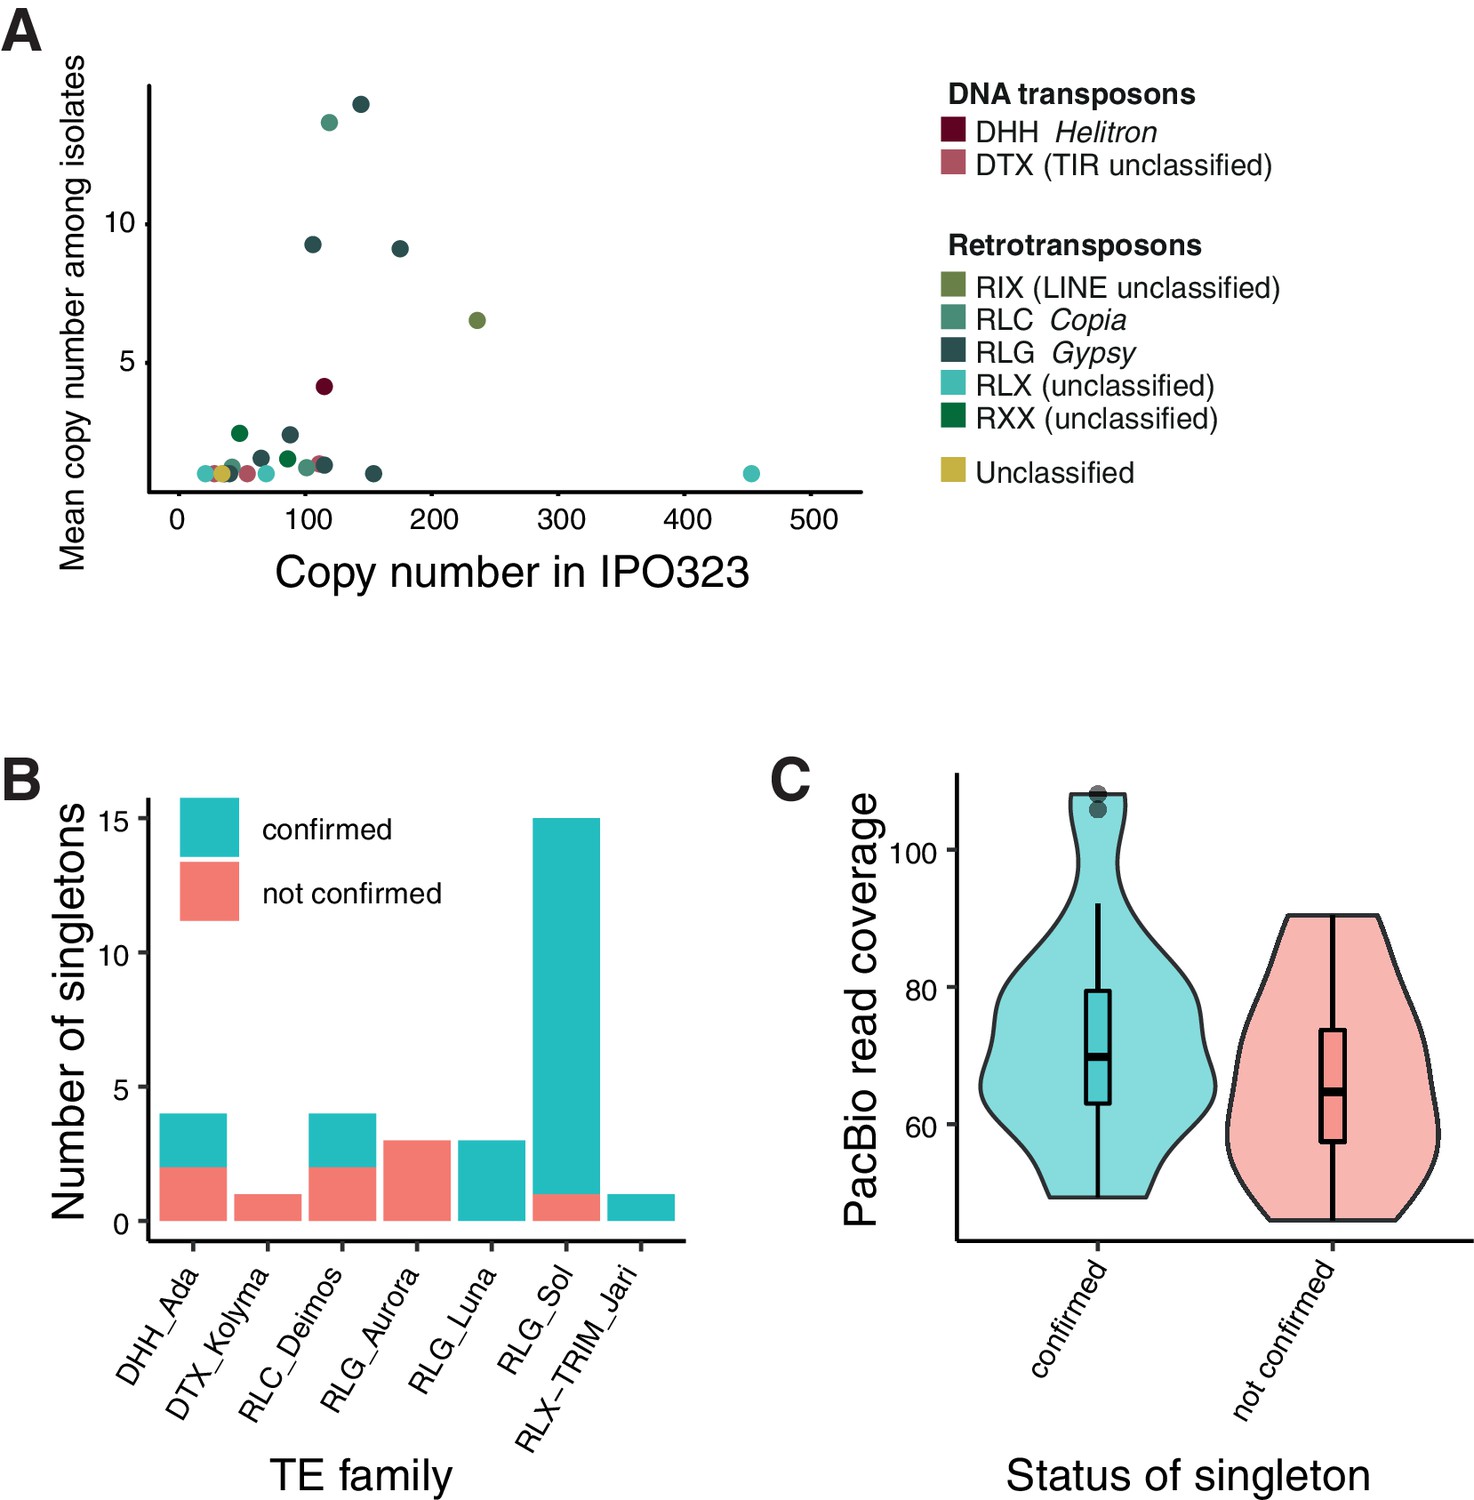
Validation of singleton insertions detected by mapped Illumina reads using PacBio read alignments for confirmation.
(A) Comparison of TE family copy numbers per isolate to the number of copies found in the reference genome (IPO323). The color is indicating superfamilies. This figure includes only TE families that were detected in any of the isolates used for validation. (B) Confirmation of singleton TE insertions detected in the isolates CH99_SW5, CH99_SW39, CH99_3D7, CH99_3D1, ISR92_Ar_4 f, AUS01_1H8, and ORE90Ste_4A10 using aligned PacBio reads. Confirmed/not confirmed TE insertions are shown by TE family. (C) PacBio read coverage (in 500 bp window) at singleton loci.
Figure 2—figure supplement 2
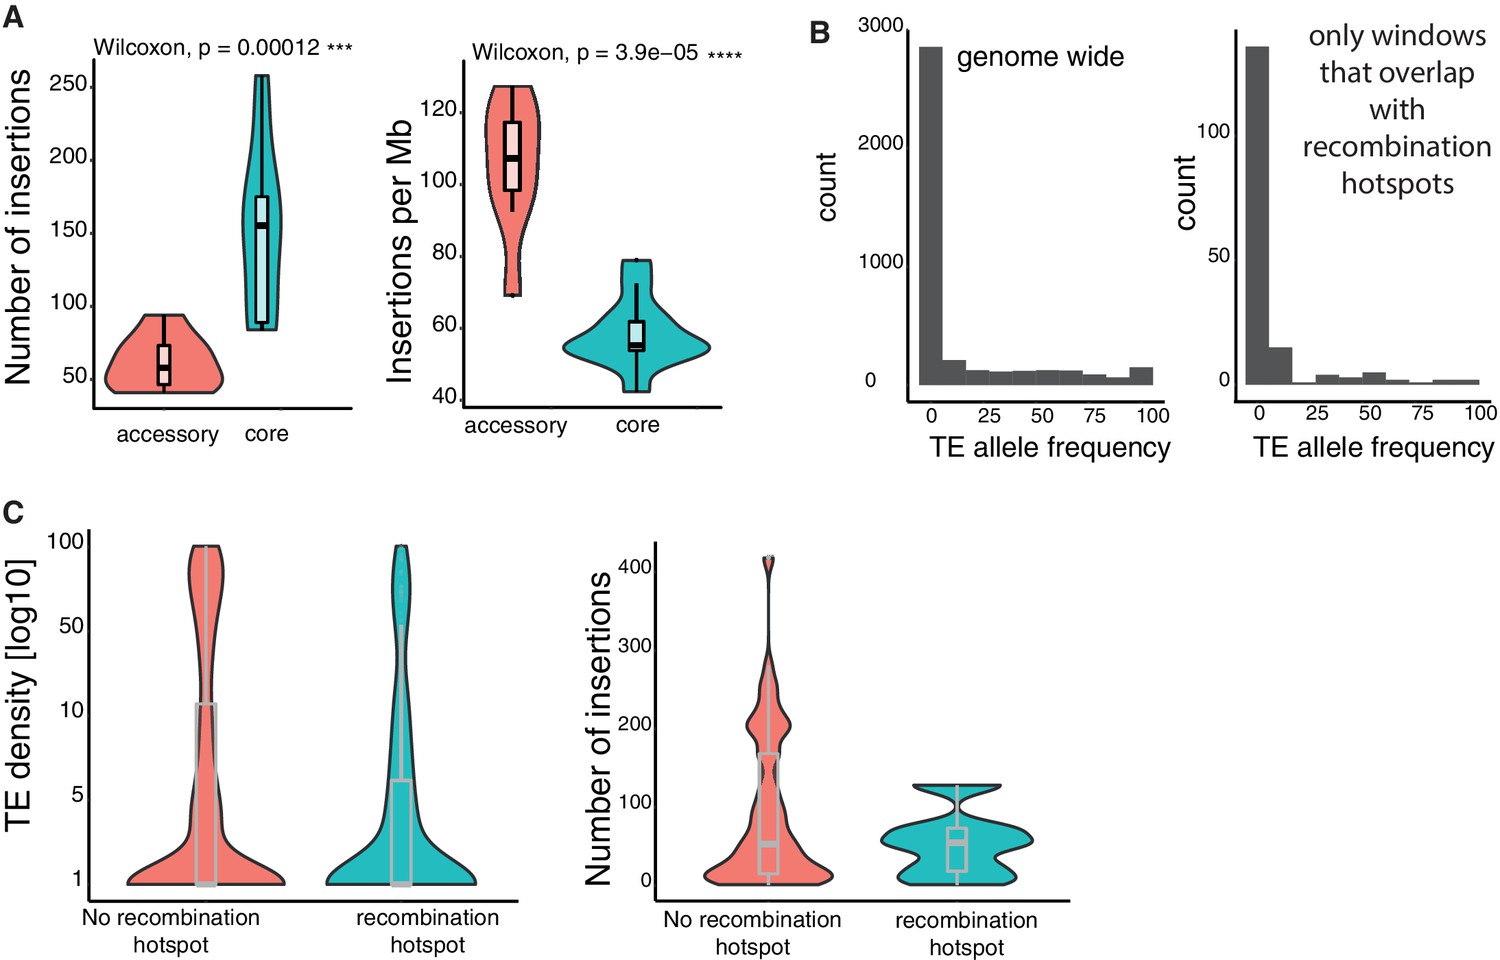
TE insertion loci characteristics.
(A) Number of TE insertions and density (insertions per Mb) in accessory and core genes. (B) Allele frequencies of TEs genome-wide and restricted to recombination hotspots. (C) TE insertion density and TE copy numbers within and outside of recombination hotspots.
Figure 2—figure supplement 3
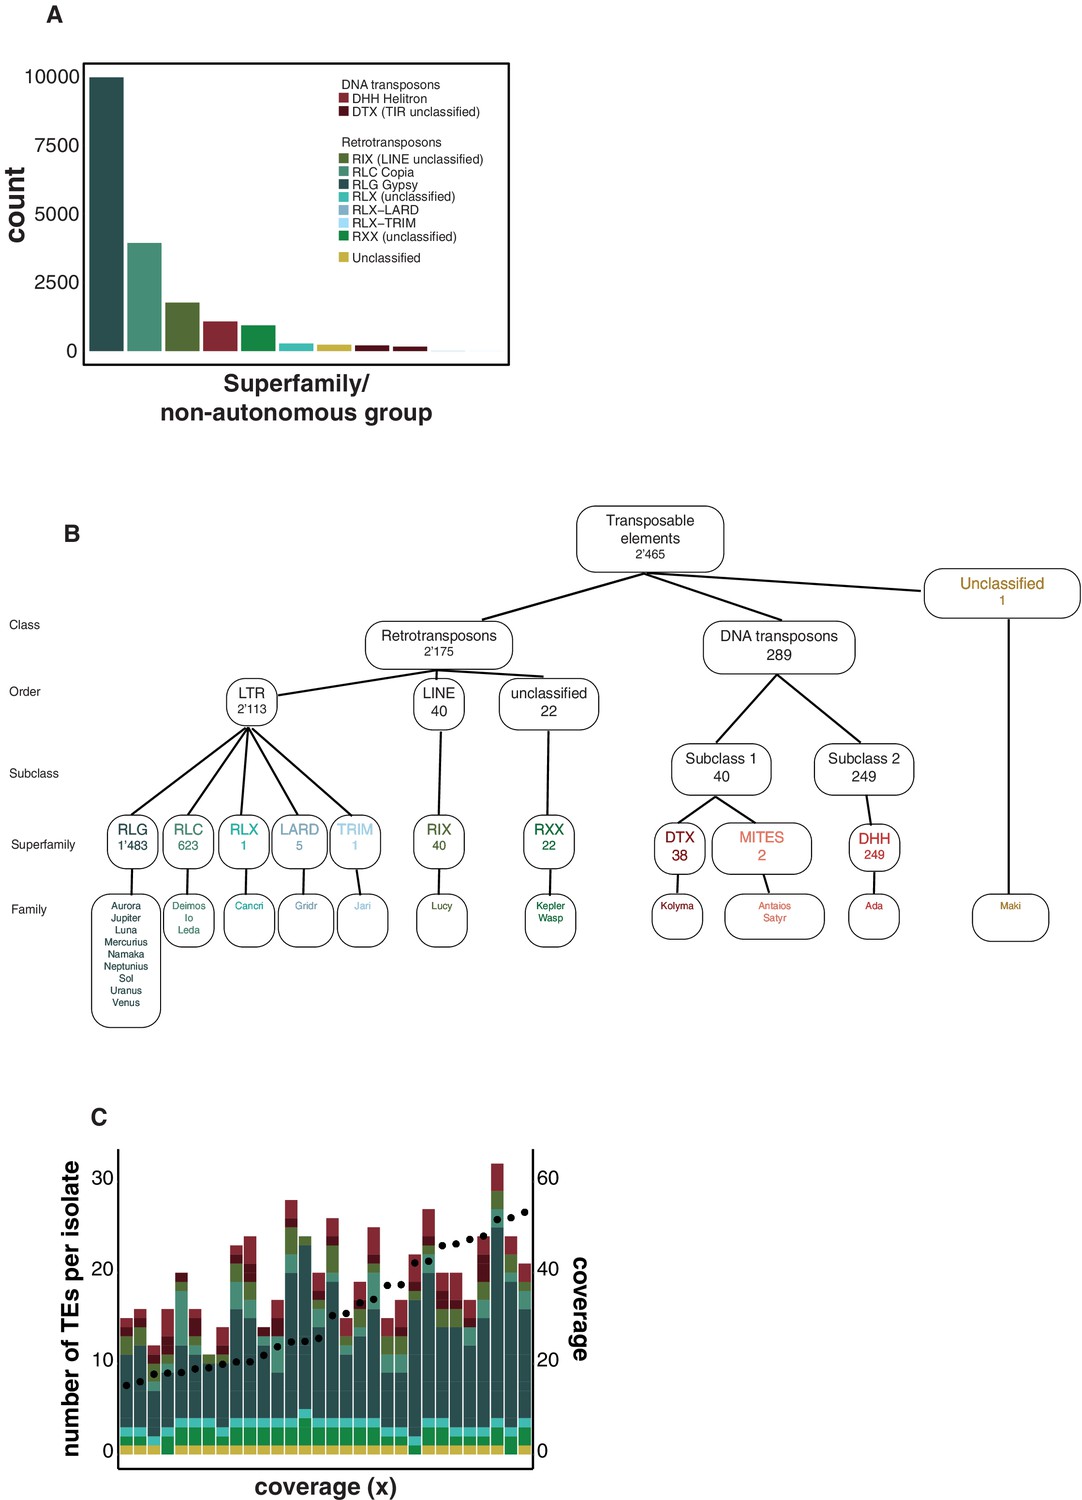
Hierarchy superfamilies.
(A) Number of transposable element (TE) insertions per superfamily. Colors indicate the superfamily. (B) Number of TE loci and classification hierarchy. (C) Comparison of mean genome sequencing coverage and the number of detected TEs with ngs_te_mapper in isolates of the Middle East population. Dots indicate the coverage, and colors indicate the superfamily.
Figure 3 with 1 supplement
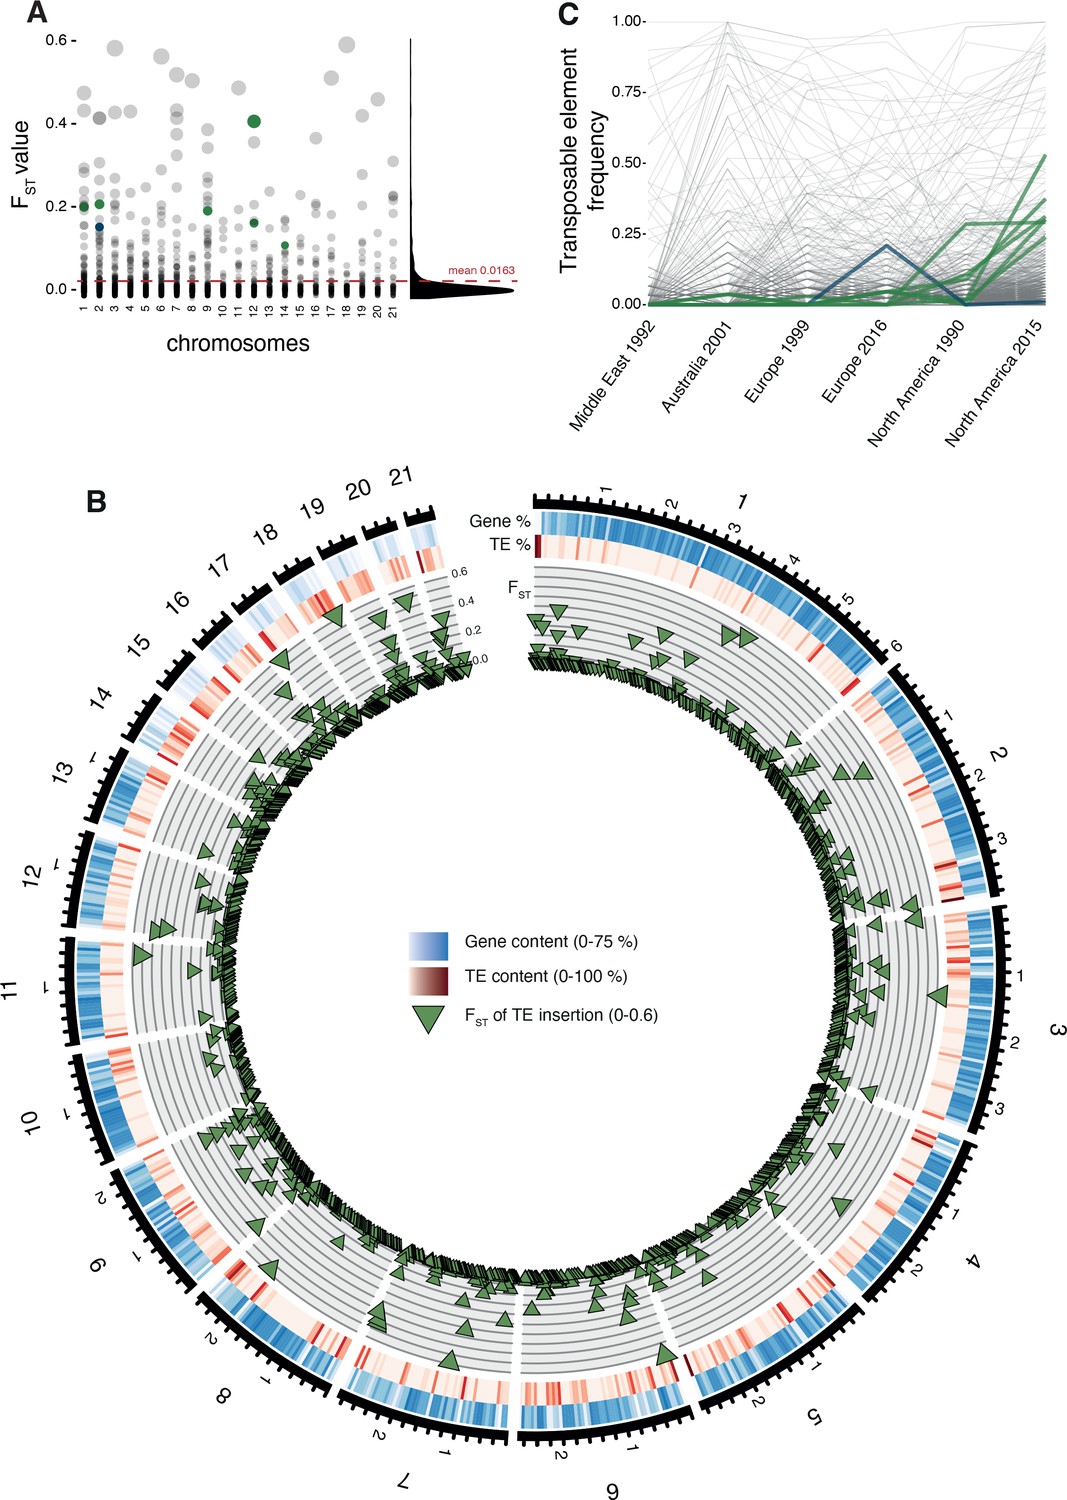
Differentiation in transposable element insertion frequencies across the genome.
(A) Global pairwise FST distributions shown across the 21 chromosomes. The red horizontal line indicates the mean FST (=0.0163). TEs with a strong local short-term frequency difference among populations are highlighted (blue: increase in Europe; green: increase in North America). (B) Allele frequency changes between the populations. The same TE loci as in (A) are highlighted. (C) Circos plot describing from the outside to the inside: The black line indicates chromosomal position in Mb. Blue bars indicate the gene density in windows of 100 kb with darker blue representing higher gene density. Red bars indicate the TE density in windows of 100 kb with a darker red representing higher TE density. Green triangles indicate positions of TE insertions with among population FST value shown on the y-axis.
Figure 3—figure supplement 1
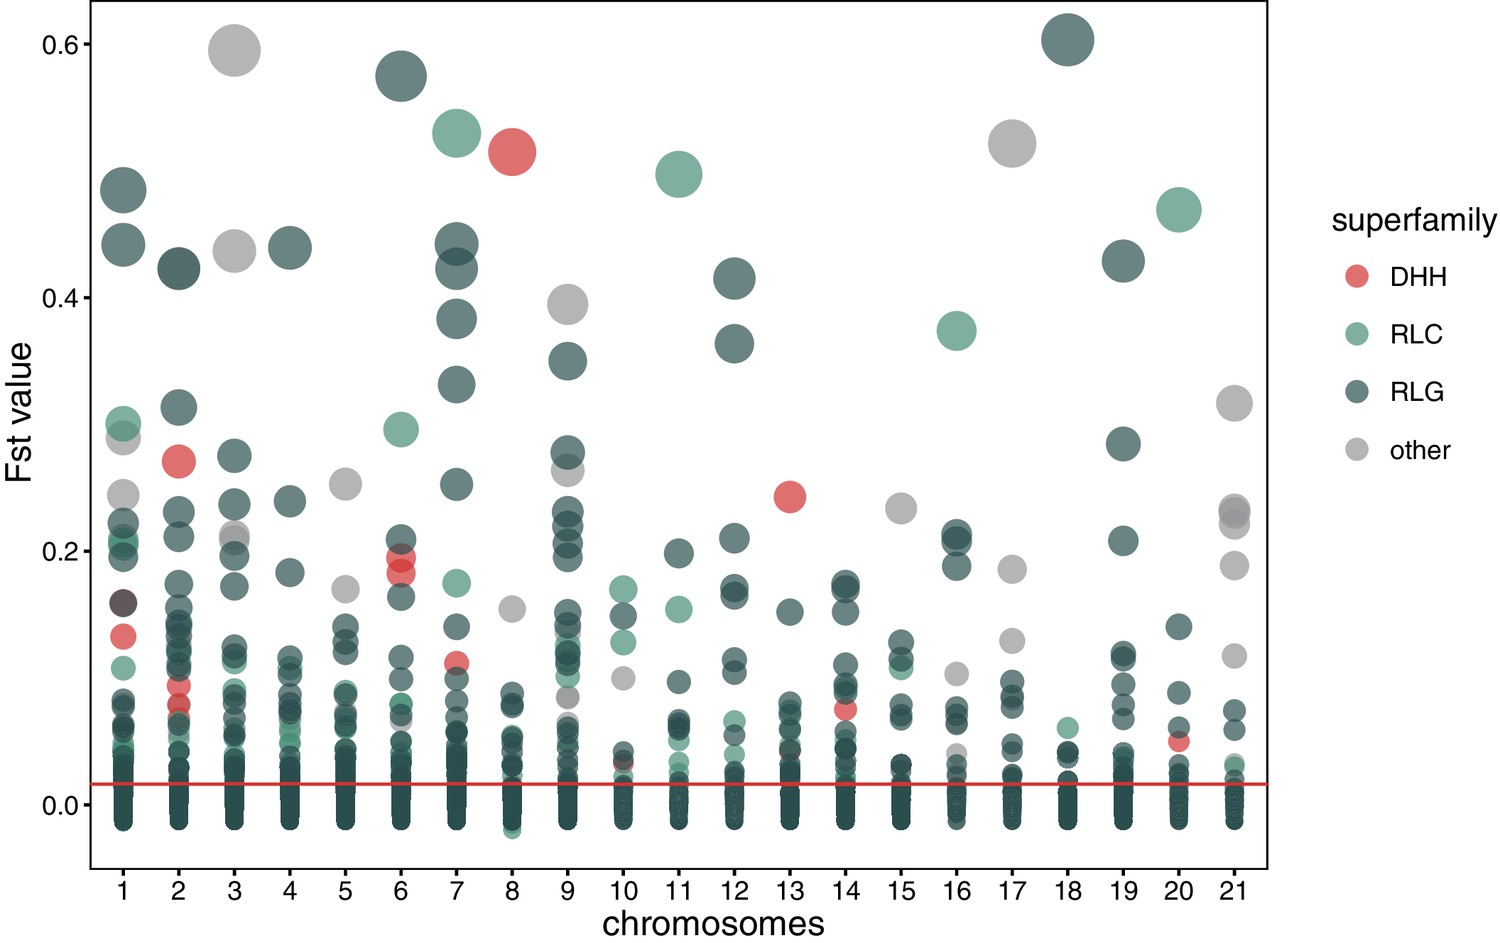
Global pairwise FST distributions shown separately for the 21 chromosomes.
The red horizontal line indicates the mean FST = 0.0163. Colors are according to the three main superfamilies (RLG, RLC, DHH).
Figure 4 with 1 supplement
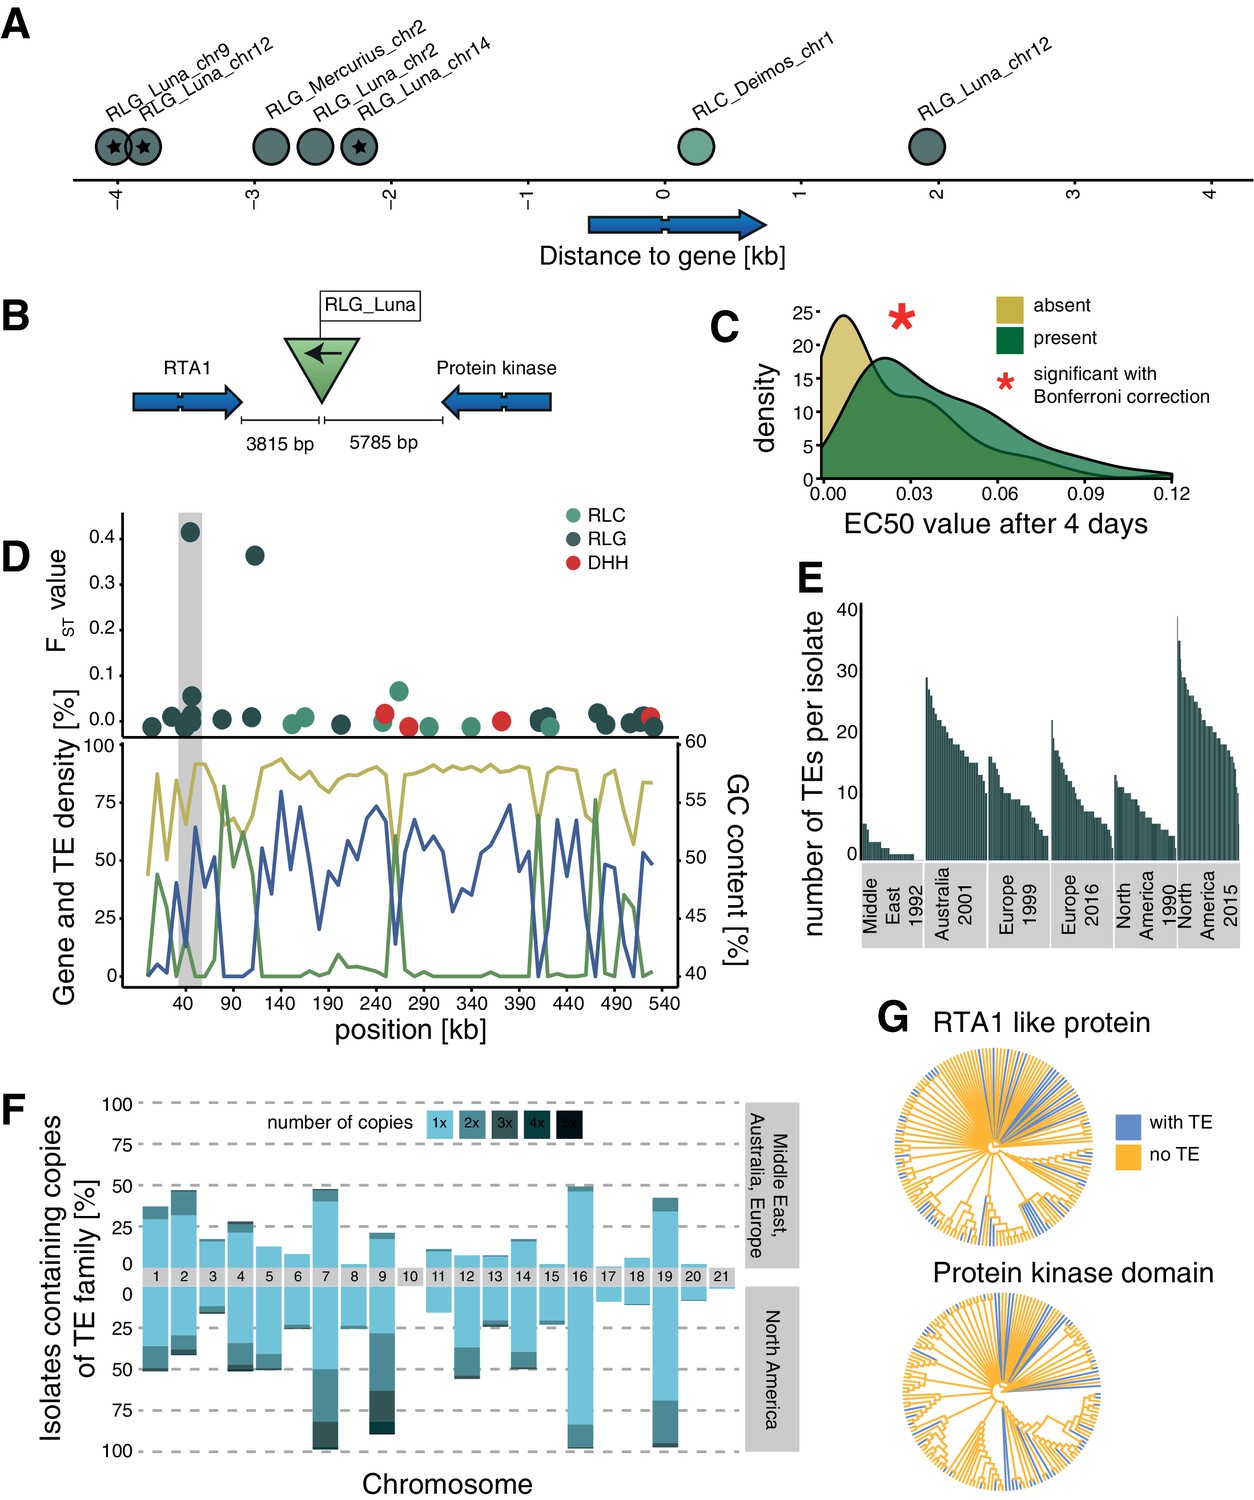
Candidate adaptive transposable element (TE) insertions.
(A) Distribution of all extremely differentiated TEs and their distance to the closest gene. Color indicates the superfamily. The stars indicate TE insertions not found in the reference genome. (B) Location of the RLG_Luna TE insertion on chromosome 12 corresponding to its two closest genes. (C) Resistance against azole fungicides among isolates as a function of TE presence or absence. (D) Genomic niche of the RLG_Luna TE insertion on chromosome 12: FST values for each TE insertion, gene content (blue), TE content (green) and GC content (yellow). The gray section highlights the insertion site. (E) Number of RLG_Luna copies per isolate and population. (F) Frequency changes of RLG_Luna between the two North American populations compared to the other populations. Colors indicate the number of copies per chromosome. (G) Phylogenetic trees of the coding sequences of either the gene encoding the RTA1-like protein or the protein kinase domain. Isolates of the two North American populations and an additional 11 isolates from other populations not carrying the insertion are shown. Blue color indicates TE presence, yellow indicates TE absence.
-
Figure 4—source data 1
Top loci information.
- https://cdn.elifesciences.org/articles/69249/elife-69249-fig4-data1-v1.txt
Figure 4—figure supplement 1
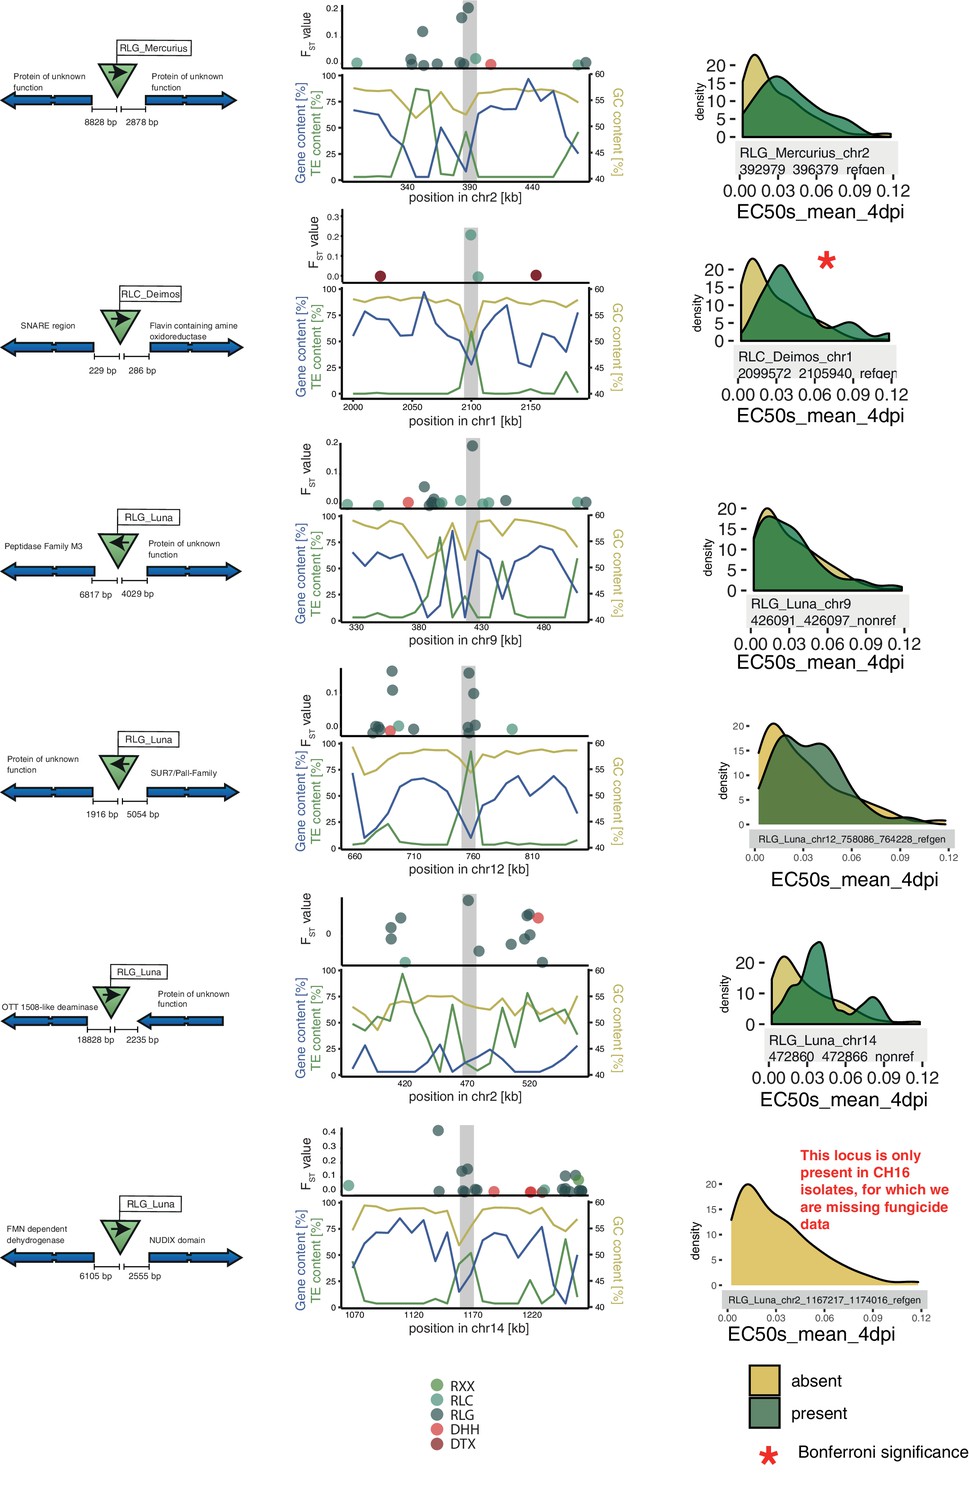
Additional top loci.
Six additional candidate adaptive transposable element (TE) insertions. Each row corresponds to a candidate, with the first five being candidates detected in the North American populations and the last one in the European populations. For each candidate, the direction of the TE and the direction, function, and distance of the closest two genes are indicated. The middle column indicates the location of the TE in the genomic niche, with TE content, gene content, and GC content for the surrounding windows. The third column indicates resistance levels toward azole antifungals for isolates with and without the TE insertion.
Figure 5

Population differentiation at transposable element (TE) and genome-wide SNP loci.
(A) Sampling locations of the six populations. Middle East represents the region of origin of the pathogen. In North America, the two populations were collected at an interval of 25 years in the same field in Oregon. In Europe, two populations were collected at an interval of 17 years from two fields in Switzerland <20 km apart. Dark arrows indicate the historic colonization routes of the pathogen. (B) Principal component analysis (PCA) of 284 Zymoseptoria tritici isolates, based on 900,193 genome-wide SNPs. (C) PCA of a reduced SNP data set with randomly selected 203 SNPs matching approximately the number of analyzed TE loci. (D) PCA based on 193 TE insertion loci. Loci with allele frequency <5% are excluded.
-
Figure 5—source data 1
Isolates.
- https://cdn.elifesciences.org/articles/69249/elife-69249-fig5-data1-v1.txt
Figure 6 with 2 supplements
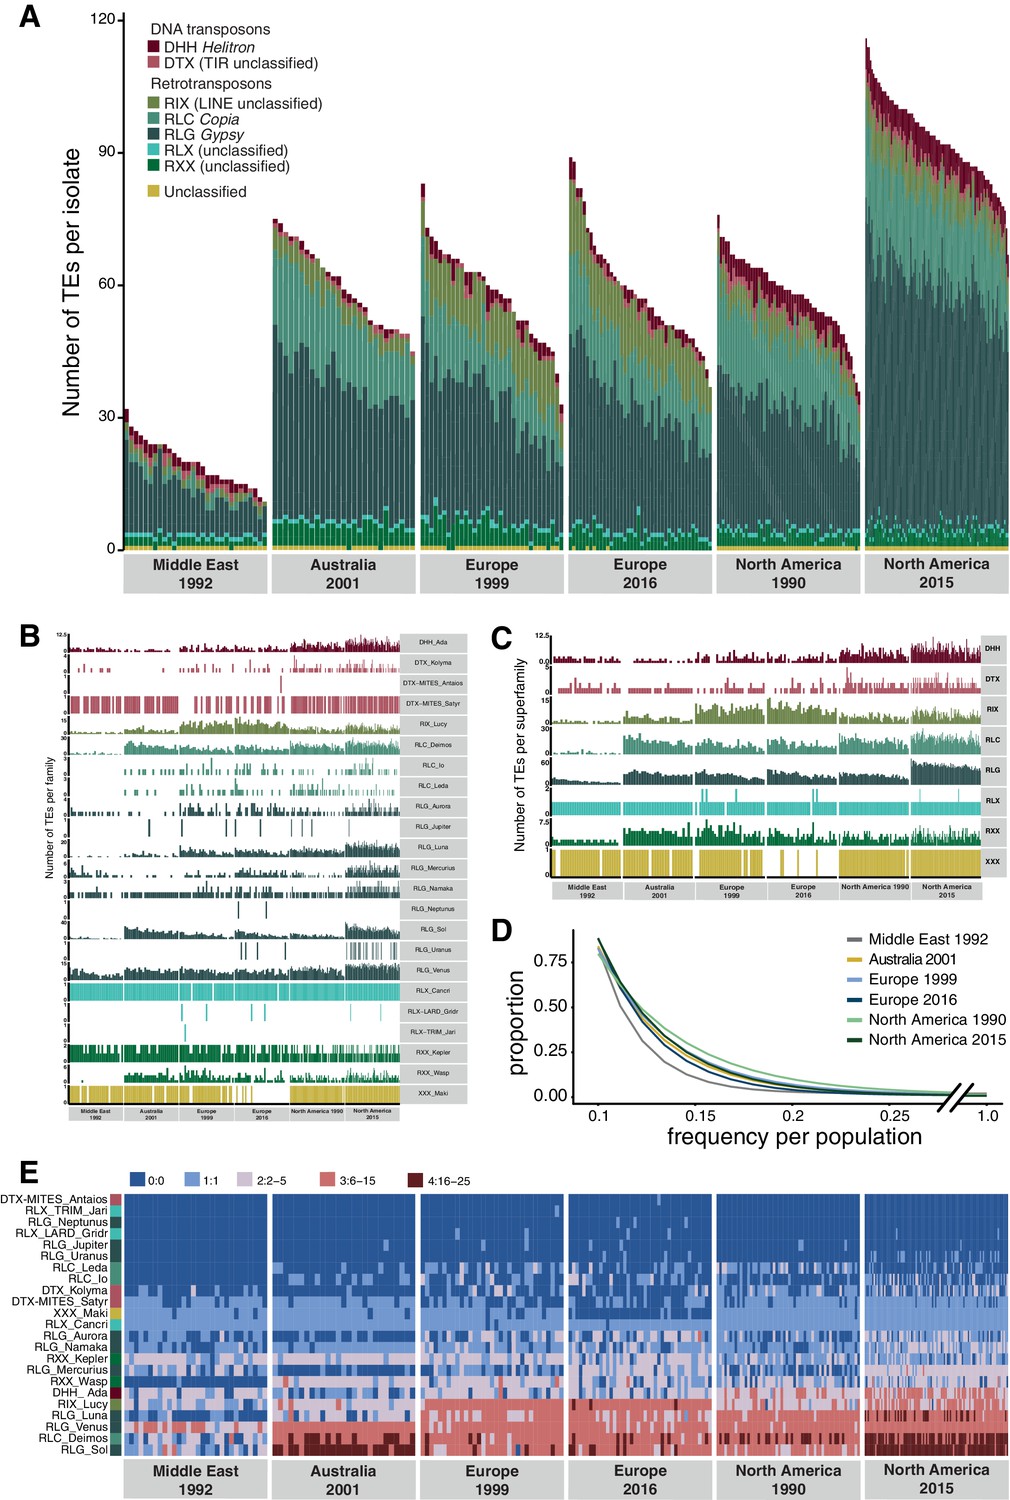
Global population structure of transposable element (TE) insertion polymorphism.
(A) Total TE copies per isolate. Colors identify TE superfamilies. (B) TE copies per family and (C) superfamily. (D) TE insertion frequency spectrum per population. The curve fitting was performed with a self-starting Nls asymptomatic regression model (E). TE family copy numbers per isolate.
-
Figure 6—source data 1
Kolmogorof–Smirnov.
- https://cdn.elifesciences.org/articles/69249/elife-69249-fig6-data1-v1.txt
Figure 6—figure supplement 1
Population changes additional.
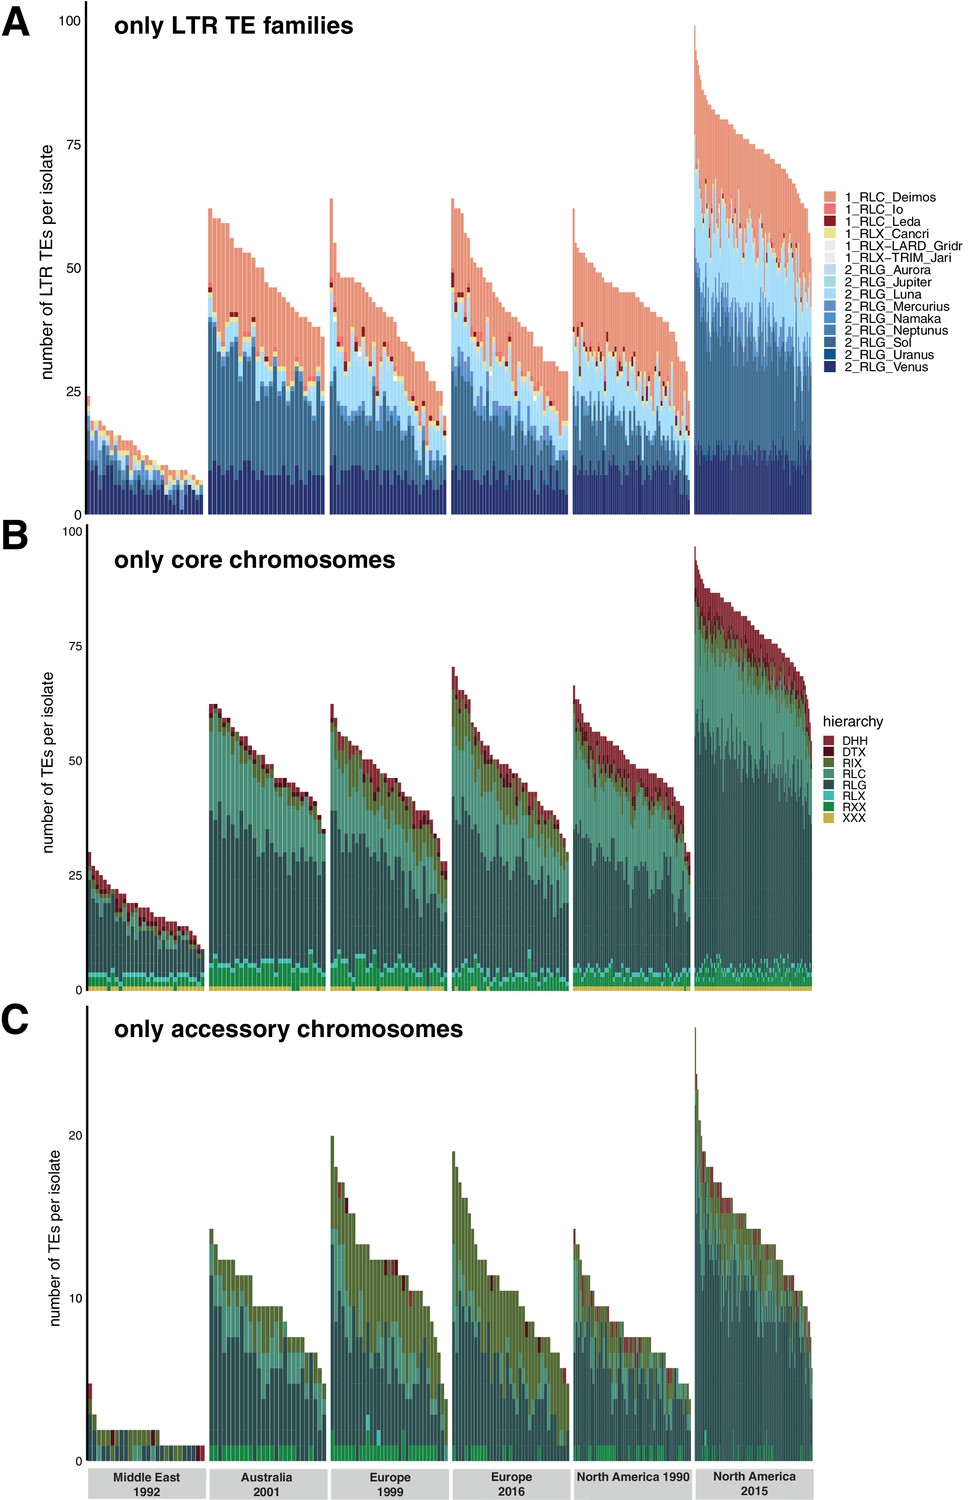
Variation in transposable element (TE) content per isolate across populations. (A) Total TE copies per superfamily (colored) and per isolate only including LTR (long terminal repeat) TEs Copia and Gypsy. Color indicates the family. (B) Total TE copies per superfamily (colored) and per isolate only on the core chromosomes. (C) Total TE copies per superfamily (colored) and per isolate only on the accessory chromosomes.
Figure 6—figure supplement 2
Heatmap loci.
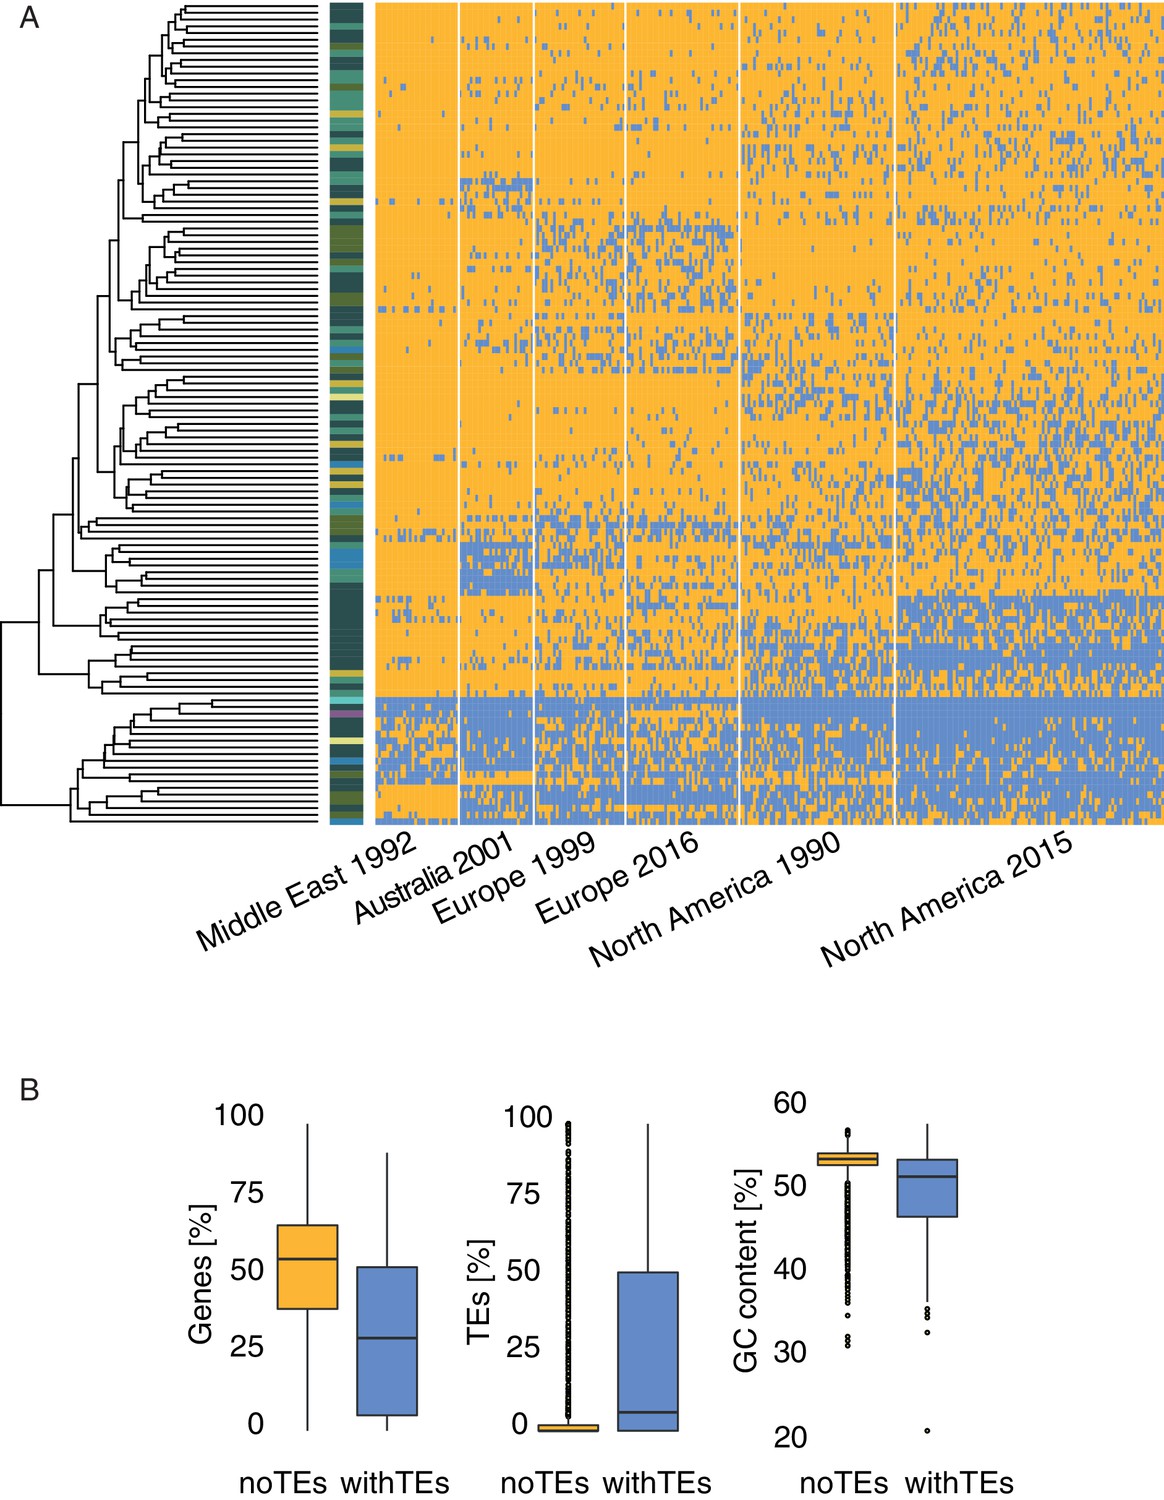
(A) Presence (blue) and absence (yellow) matrix for all transposable element (TE) loci in all isolates per population. Colors on the left side indicate the superfamily. (B) Comparison of different genomic regions with and without TE insertions in IPO323.
Figure 7 with 1 supplement

Core genome size and transposable element (TE) evolution across populations.
(A) BUSCO completeness variation among genome assemblies. Black lines indicate the mean genome size per population. (B) Genome-wide GC content variation. (C) Core genome size variation among the isolates of the populations (excluding accessory chromosomes). (D) Correlation of core genome size and number of detected TEs. (E) Correlation of core genome size and the cumulative length of all TEs detected as inserted. (F) Correlation of core genome size and genome-wide GC content. (G) Spearman correlation matrix of BUSCO completeness, core genome size, number of detected TEs, and genome-wide GC content.
Figure 7—figure supplement 1
Genome size expansion.
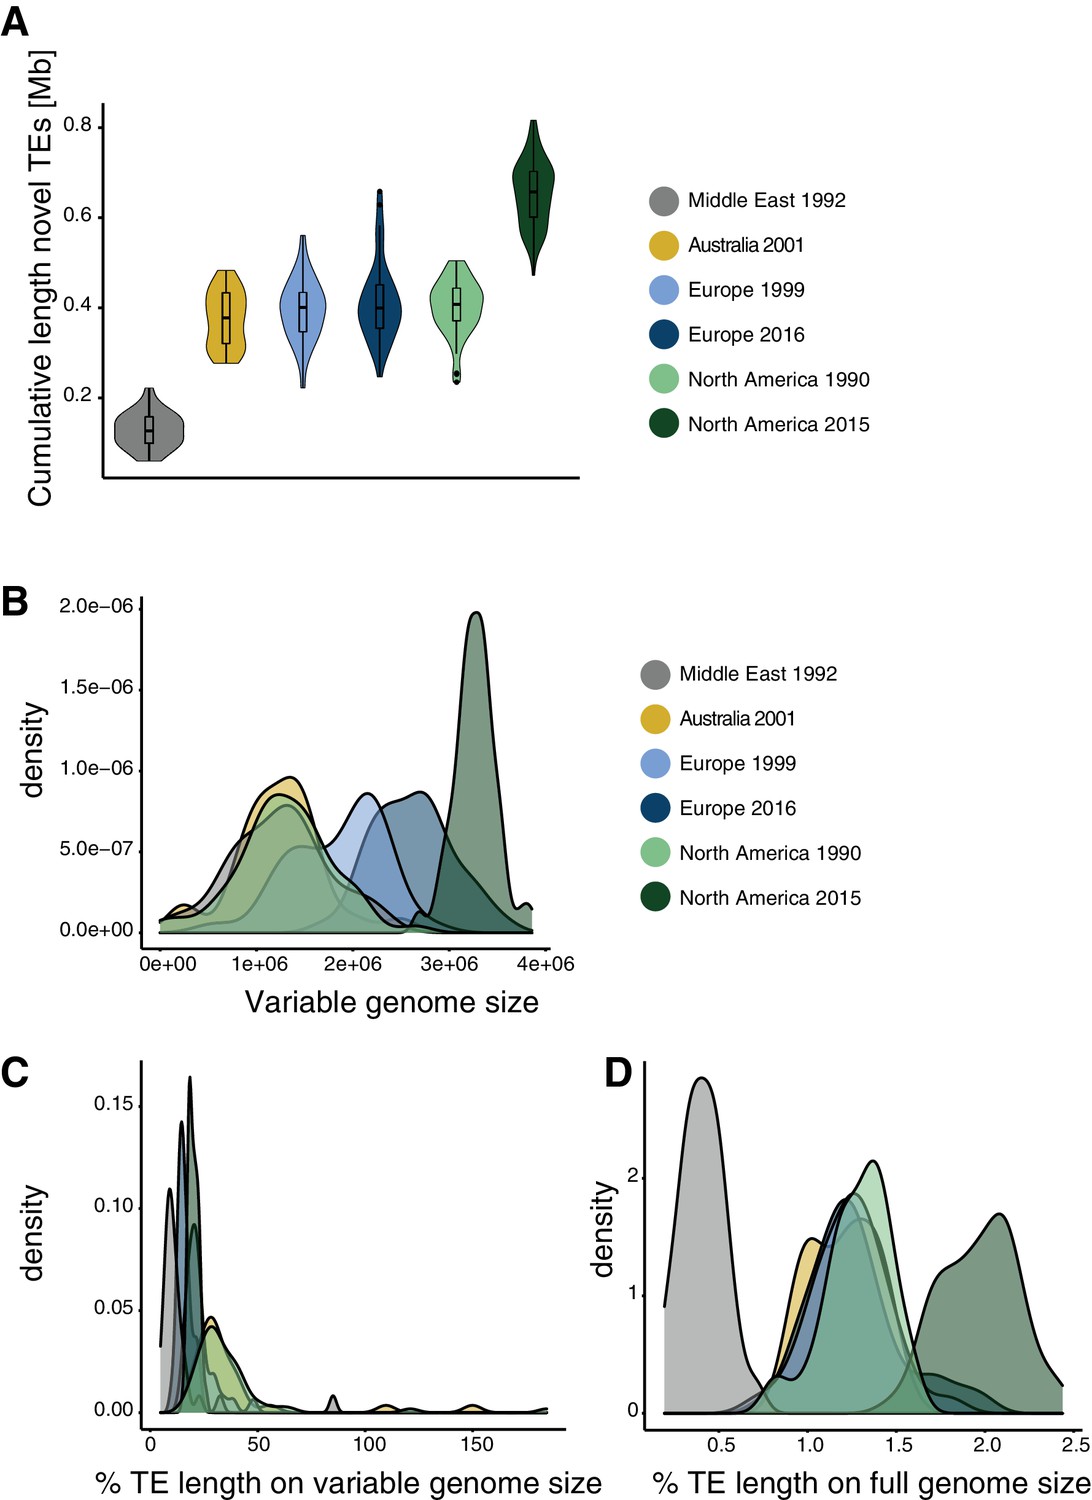
(A) Estimated length of TE insertions per isolate and population. (B) Genome size variation per population. (C) Percentage of TEs content variation compared to the variation in genome size. (D) TE contributions to genome size variation compared to full genome size.
Additional files
Download links
A two-part list of links to download the article, or parts of the article, in various formats.
Downloads (link to download the article as PDF)
Open citations (links to open the citations from this article in various online reference manager services)
Cite this article (links to download the citations from this article in formats compatible with various reference manager tools)
A population-level invasion by transposable elements triggers genome expansion in a fungal pathogen
eLife 10:e69249.
https://doi.org/10.7554/eLife.69249


