Corticohippocampal circuit dysfunction in a mouse model of Dravet syndrome
- Department of Neurology, The Perelman School of Medicine at The University of Pennsylvania, United States
- Division of Neurology, Department of Pediatrics, The Children’s Hospital of Philadelphia, United States
- Neuroscience Graduate Group, The University of Pennsylvania Perelman School of Medicine, United States
- College of Arts and Sciences, The University of Pennsylvania, United States
- Department of Neuroscience, The Perelman School of Medicine at The University of Pennsylvania, United States
Figures
Figure 1
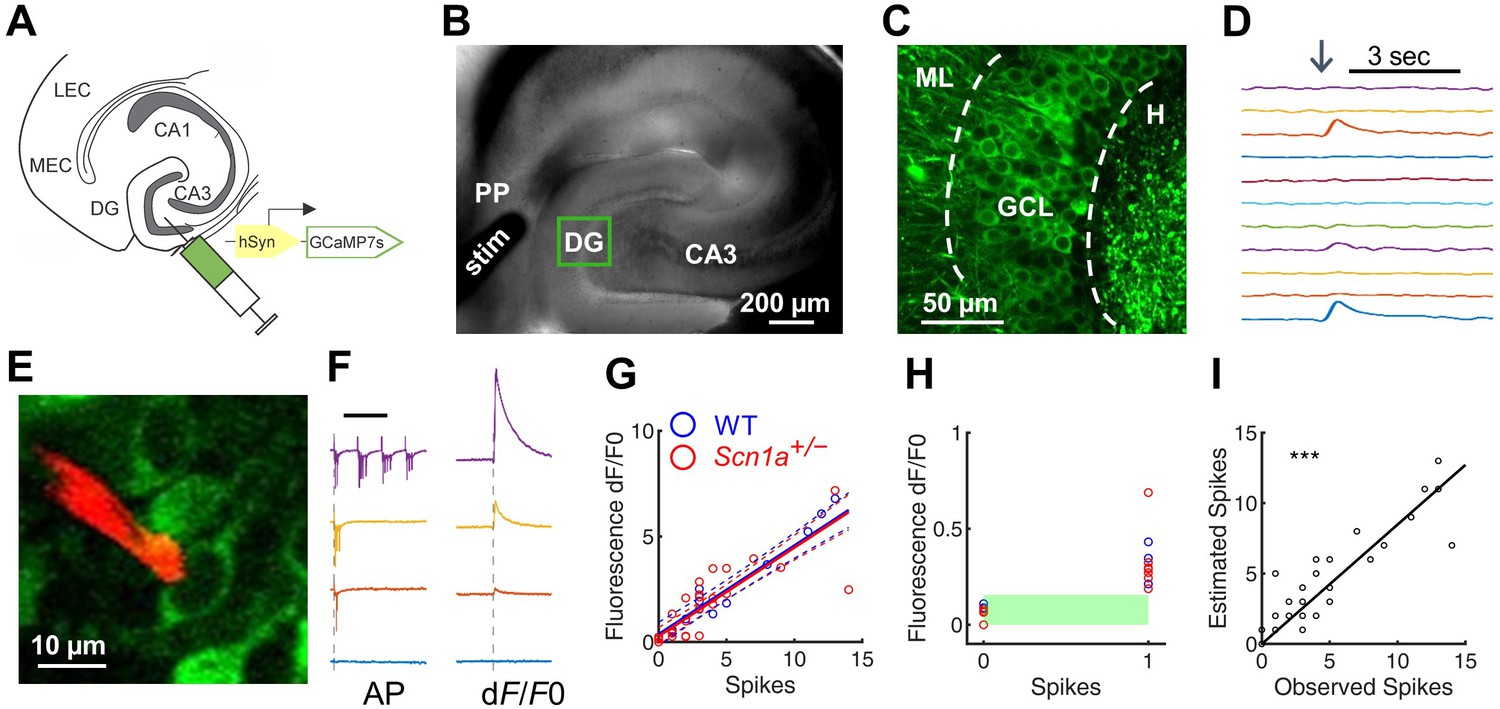
Two-photon calcium imaging of perforant path-evoked dentate gyrus activation in acute brain slice.
(A) Mice were injected with AAV9-hSyn-jGCaMP7s-WPRE into DG. (B) Acute slices are cut at a 15° angle off-axial to maximize connectivity. Shown is the location of a stimulation electrode (stim) in the perforant path (PP), and the imaging field in DG (green box). (C) GCaMP labeling of GCs in the granule cell layer (GCL; dashed lines) between the hilus (H) and molecular layer (ML). (D) Example GC response to PP stimulation (arrow), displayed as change in fluorescence over baseline (dF/F0). (E) Representative image showing a quantum dot (Andrásfalvy et al., 2014)-labeled pipette tip (red) used for cell-attached recording of GCaMP-expressing GCs (green). (F) Representative data from a single GC firing 0, 1, 3, or 13 action potentials (left) in response to PP stimulation, while calcium transients (right) were simultaneously recorded. Scale bar represents 75 ms (left) and 5 s (right). Vertical dashed line indicates stimulus onset. (G) Action potentials versus calcium transient magnitude for GCs from WT (blue) and Scn1a+/- (red) mice. Data were fit using a linear model, with no significant difference between genotypes (solid / dashed line = best fit / 95% confidence interval). n = 7 (cells), 5 (mice). (H) Results for 0 and 1 action potentials. Threshold for action potential detection (green bar) was defined as p = 0.001 from a normal distribution fit to the dF/F0 values for 0 action potentials. (I) Observed action potentials versus action potentials derived from deconvolution (R2 = 0.83; p < 0.0001).
-
Figure 1—source data 1
Quantification of spikes.
- https://cdn.elifesciences.org/articles/69293/elife-69293-fig1-data1-v2.xlsx
Figure 2 with 4 supplements
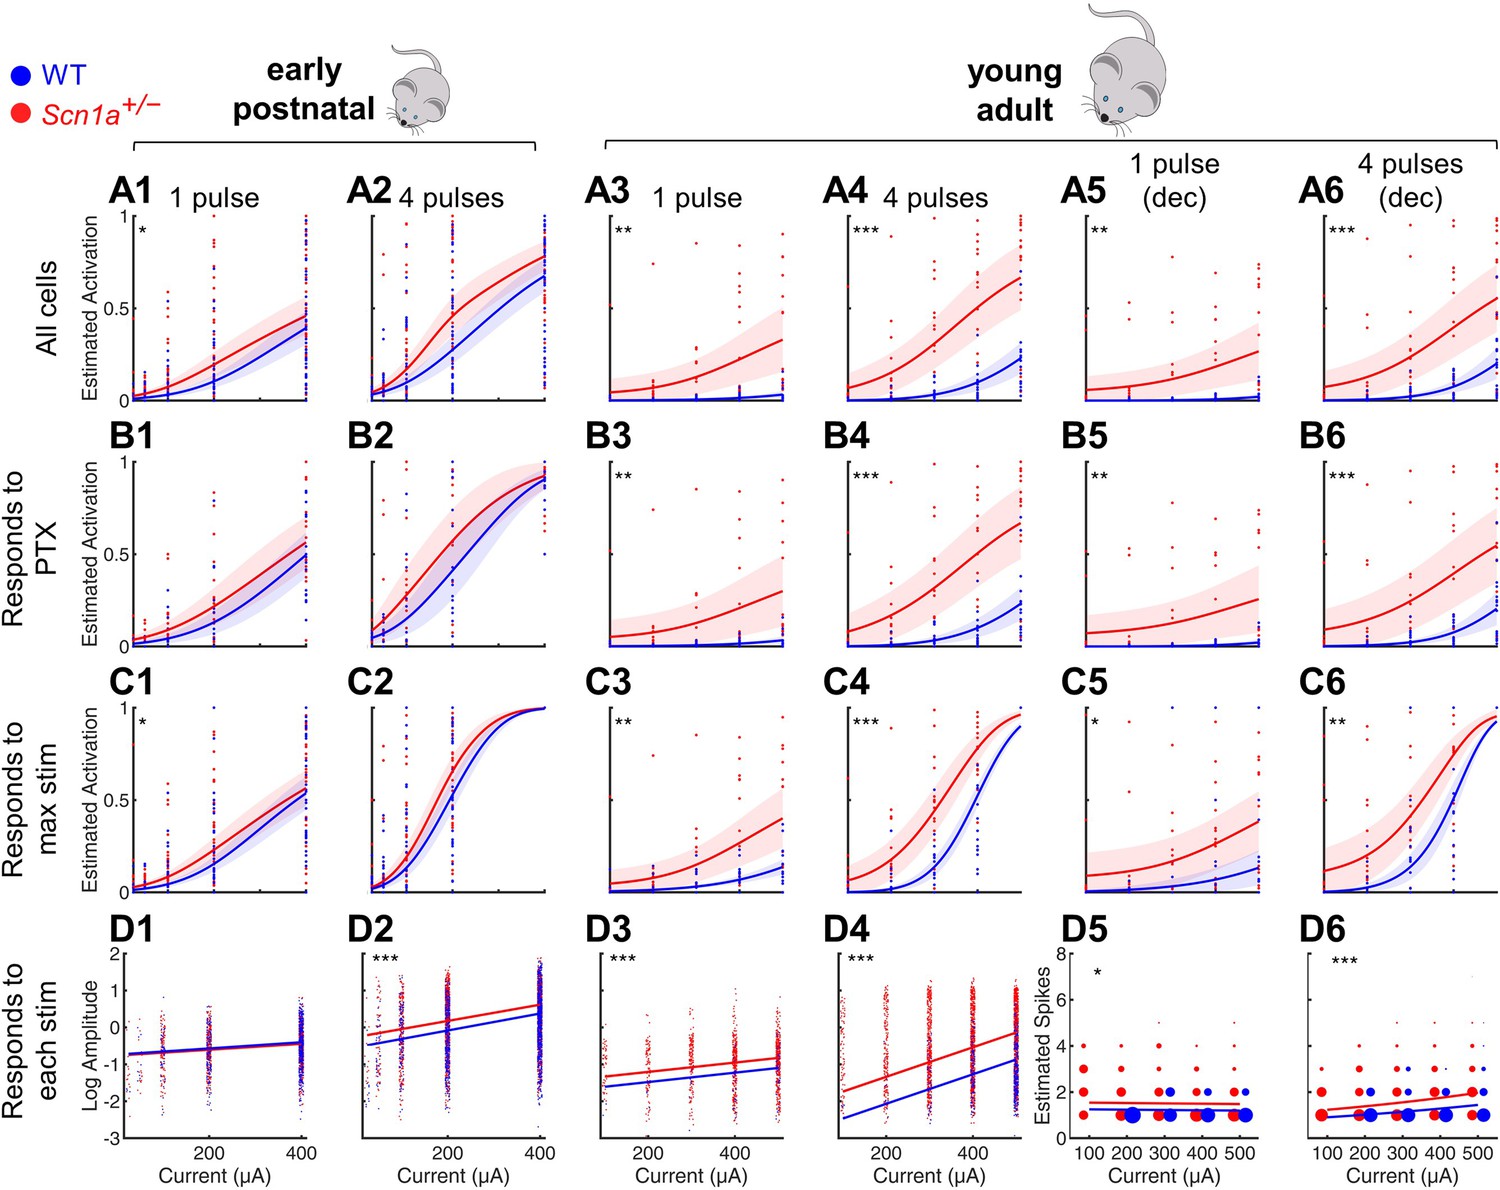
Selective impairment of dentate gyrus function in young adult Scn1a+/- mice.
Proportion of activated GCs (A–C) and magnitude of activation (D) in response to PP stimulation (early postnatal P14-21, columns 1 and 2; young adult P48-91, columns 3 and 4), with deconvolved data for the young adult time point (columns 5 and 6). Wild-type in blue; Scn1a+/- in red. Data were analyzed using a mixed model to account for potential variability between animal, slice, field, and cell. Proportion of responsive GCs was calculated (A) relative to all GCaMP-expressing cells, or restricting analysis (B) to only GCs that respond to PP stimulation in the presence of 100 µM picrotoxin or (C) to only GCs that respond to the maximal stimulation delivered. (D) Magnitude of activated GC responses to PP stimulation, expressed as natural log dF/F0 (columns 1–4) or estimated spikes based on deconvolution (columns 5–6; size of data points reflects number of cells at that value). Dots: raw data from all imaging fields or cells; dark lines: average of fits; shaded: 95% confidence intervals of average fits. Stars indicate significant differences in curve fits: *, p < 0.05; **, p < 0.01; ***, p < 0.001. For early postnatal mice, n for the experiments in rows A, C, and D was, for Scn1a+/- and WT, respectively: 991 and 1,210 (cells), 51 and 58 (fields), 31 and 29 (slices), 11 and 10 (mice); for row B: 372 and 445 (cells), 16 and 17 (both fields and slices), 5 and 5 (mice). For the young adult mice, n for the experiments in rows A, C, and D: 1236 and 1167 (cells), 17 and 17 (both fields and slices), 8 and 6 (mice); for row B: 1109 and 1073 (cells), 16 and 14 (both fields and slices), 6 and 7 (mice).
-
Figure 2—source data 1
Quantified imaging data, reported by cell.
- https://cdn.elifesciences.org/articles/69293/elife-69293-fig2-data1-v2.xlsx
-
Figure 2—source data 2
Quantified imaging data, reported by field.
- https://cdn.elifesciences.org/articles/69293/elife-69293-fig2-data2-v2.xlsx
-
Figure 2—source data 3
Quantified imaging data, summarizing field response to PTX.
- https://cdn.elifesciences.org/articles/69293/elife-69293-fig2-data3-v2.xlsx
Figure 2—figure supplement 1

Selective impairment of dentate gyrus function in young adult Scn1a+/- mice.
Same dataset presented in Figure 2A–C but including predicted fits for each individual imaging field (light lines) in addition to raw data from each field (dots), average of fits (dark lines), and 95% confidence intervals of fits (shaded). See Figure 2 legend for additional details.
Figure 2—figure supplement 2
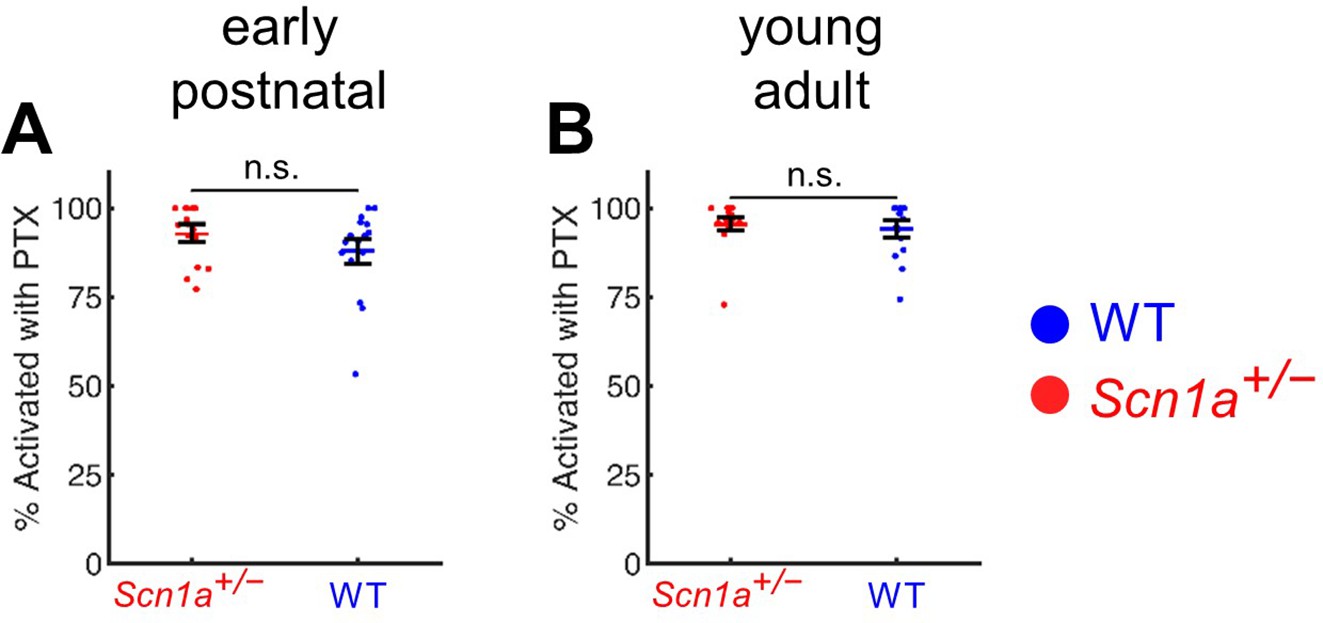
A high percentage of GCs are activated by PP stimulation in the presence of PTX.
(A) Quantification of early postnatal Scn1a+/- GCs (96% ± 2%) and WT GCs (94% ± 3%) that respond to maximal (400 µA) perforant path stimulation in the presence of 100 µM PTX. (B) Quantification of early postnatal Scn1a+/- GCs (93% ± 2%) and WT GCs (88% ± 4%) that respond to maximal ( 500 µA) perforant path stimulation in the presence of 100 µM PTX. There was no significant difference between the proportion of Scn1a+/- versus wild-type GCs responding to maximal stimulation in the presence of PTX at either time point. For early postnatal mice, n for Scn1a+/- and WT, respectively: 16 and 17 (fields), 5 and 5 (mice). For young adult mice, n for Scn1a+/- and WT, respectively: 16 and 14 (fields), 6 and 7 (mice).
Figure 2—figure supplement 3
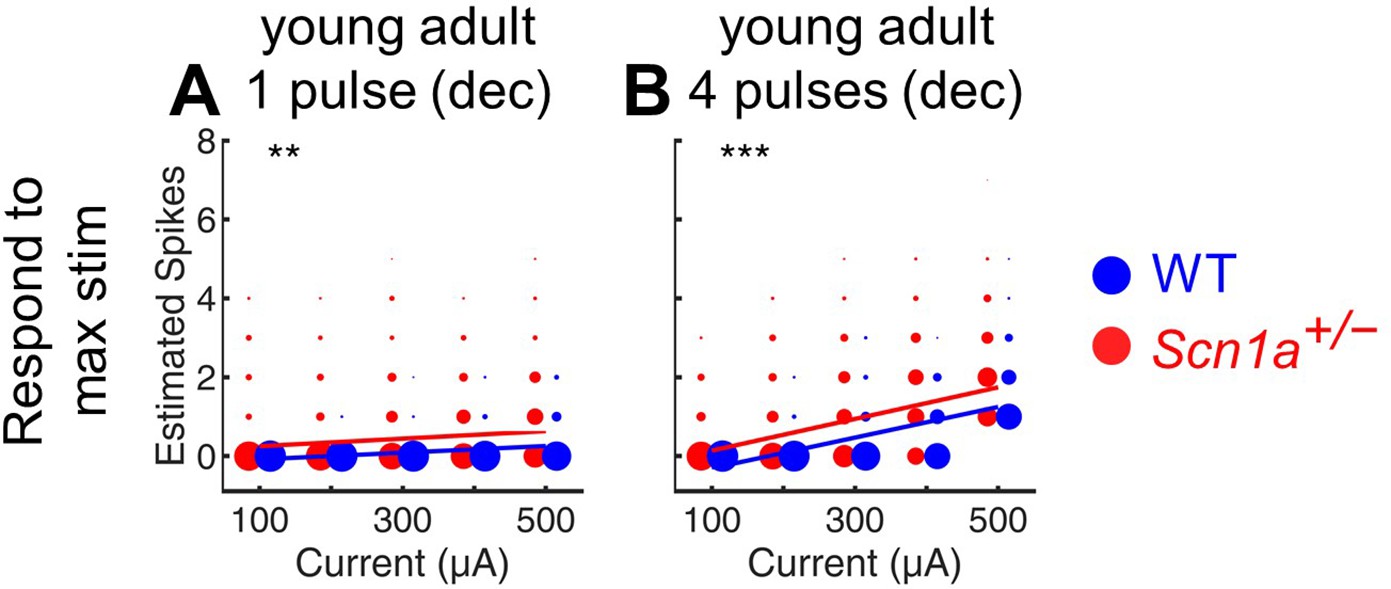
Estimation of total evoked spikes in young adult GCs.
Deconvolution was performed to calculate the total estimated number of action potentials in response to either a single perforant path stimulus (A) or 4 stimuli at 20 Hz (B) in young adult Scn1a+/- (red) and wild-type (blue) mice. Note that this analysis includes at each point the data from all cells that respond to the maximal stimulation condition (400 µA), whereas Figure 2D 5–6 are otherwise similar but include only the cells that respond at each given condition (that is, these plots include cells that fire 0 action potentials, whereas such data are excluded from Figures 2D—6 5-6). **, p < 0.01; ***, p < 0.001. n for Scn1a+/- and WT, respectively: 1236 and 1167 (cells), 17 and 17 (both fields and slices), 8 and 6 (mice).
Figure 2—figure supplement 4
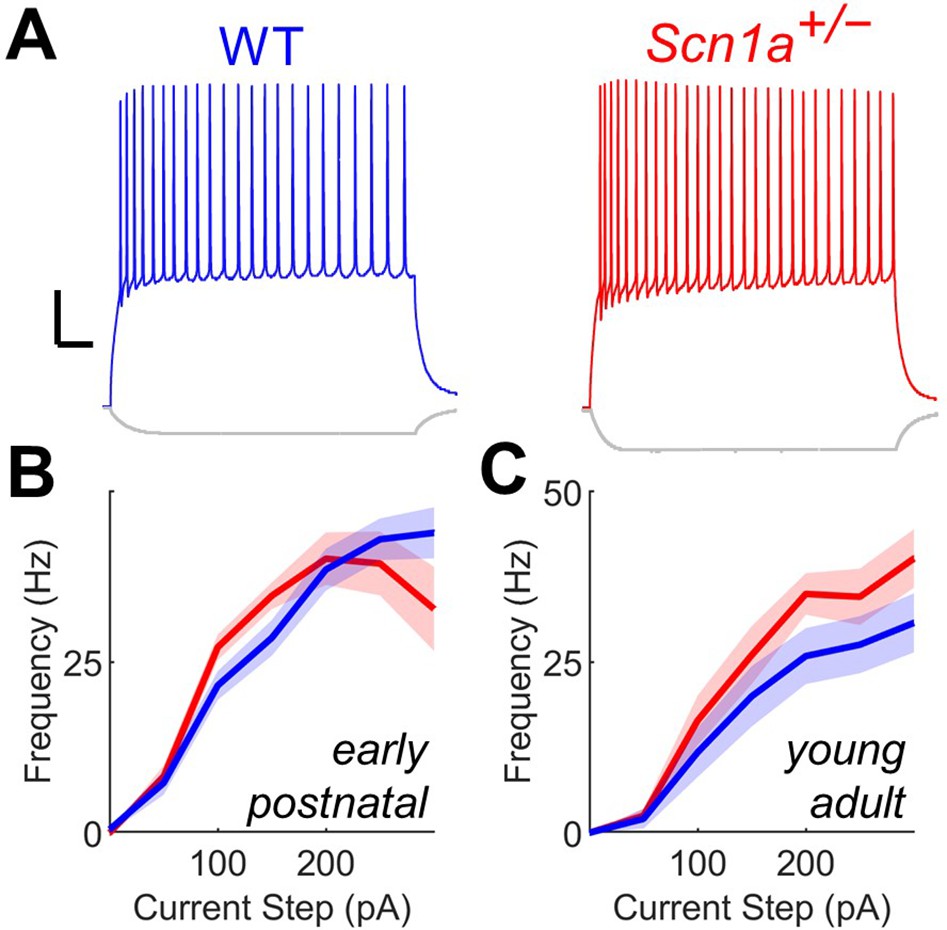
Scn1a+/- DG GCs have normal firing properties at both early postnatal and young adult timepoints.
(A) Current clamp recordings from WT (blue) and Scn1a+/- (red) DG GCs at the young adult timepoint. Scale bar 20 mV / 100ms. Current/frequency (I-f) plot for GC at the early postnatal (B) and young adult (C) timepoints, with no significant differences across genotype. n and mouse ages are as per Table 1.
Figure 3
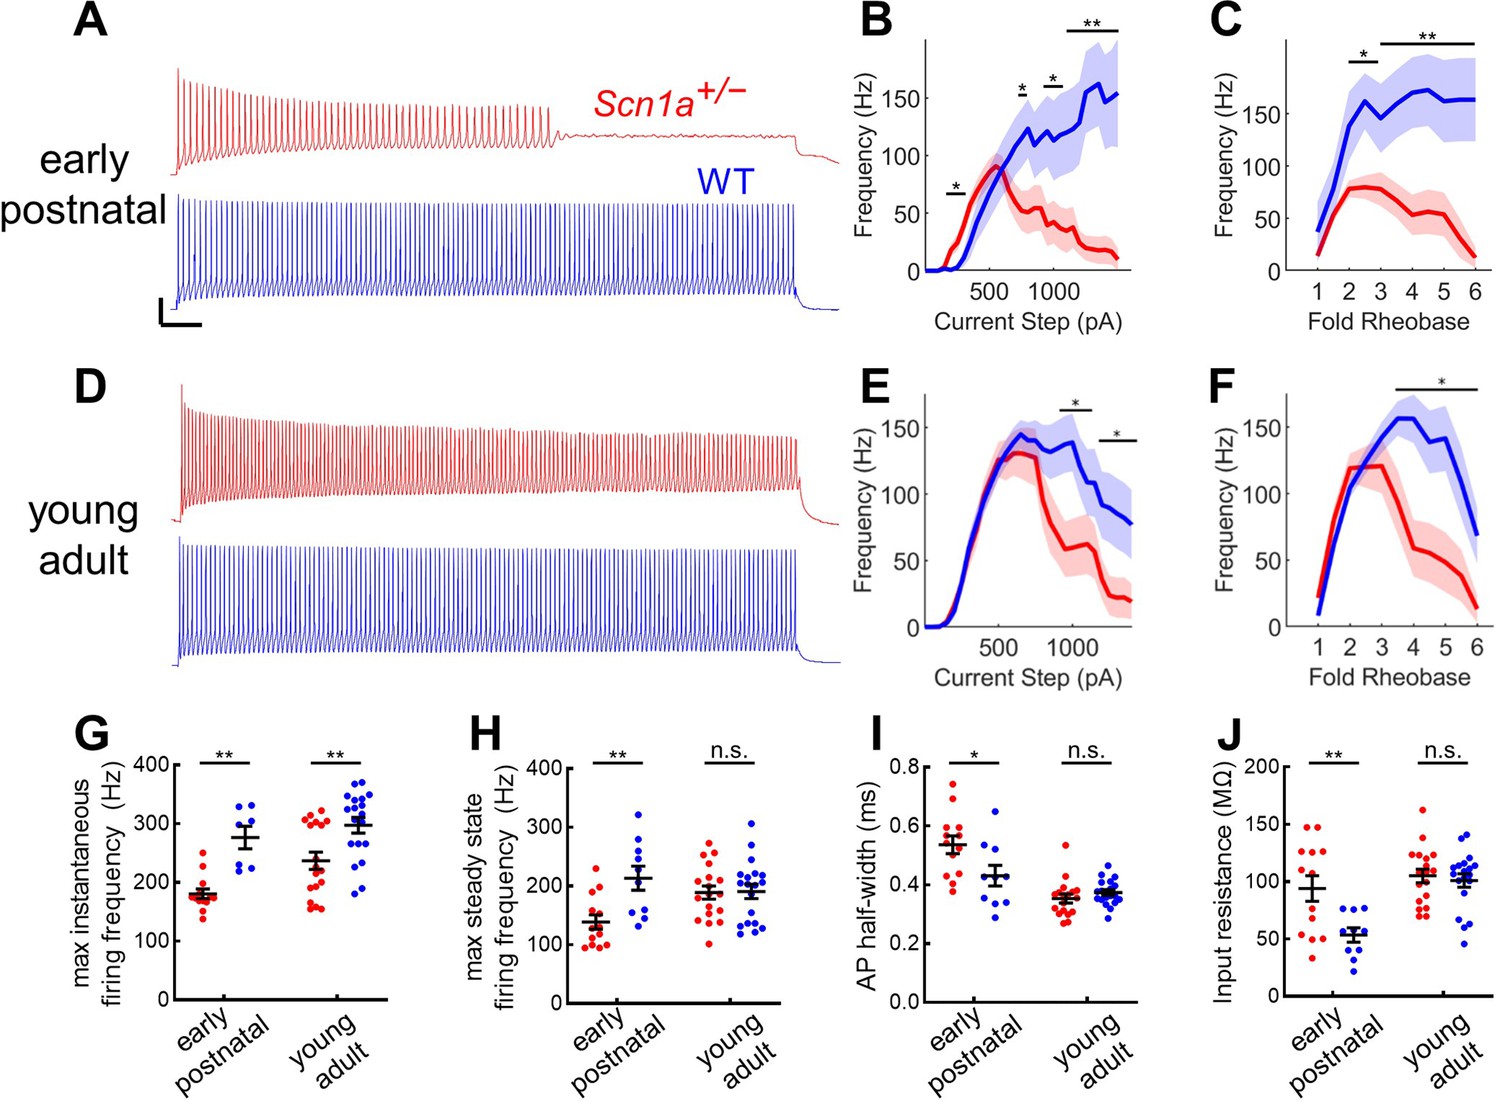
Profound impairment of spike generation in DG PV-INs from early postnatal Scn1a+/- mice, with partial normalization by young adulthood.
(A) Example current clamp recordings of DG PV-INs from WT (blue) and Scn1a+/- (red) mice at the juvenile timepoint, demonstrating early spike failure in Scn1a+/- PV-INs. Scale bar 20 mV / 100ms. For juvenile GC PV-INs, (B) current/frequency (I-f) plot and (C) I-F plot with current normalized to Rheobase for each cell. (D) Example current clamp recordings from WT (blue) and Scn1a+/- (red) DG PV-INs at the young adult timepoint, demonstrating progressive spike-height accommodation in Scn1a+/- PV-INs in response to a prolonged depolarizing current step. Scale bar as in A. For young adult GC PV-INs, (E) current/frequency (I-F) plot and (F) I-F plot with current normalized to Rheobase for each cell. Scn1a+/- PV-INs have significantly lower instantaneous firing frequency at both timepoints (G) but the steady state firing frequency normalizes by the young adult timepoint (H). Scn1a+/- PV-INs display larger input resistance (I) and action potential half-width (J) at the early postnatal timepoint only. For B–F, line and shaded areas represent mean and SEM, and bars indicate significance calculated using one-way ANOVA and post-hoc tests with Bonferroni correction. For G–J, significance is determined by Tukey’s multiple comparisons test. *, p < 0.05; **, p < 0.01; ***, p < 0.001. n and mouse ages are as per Table 2. See also Table 2—source data 1.
Figure 4
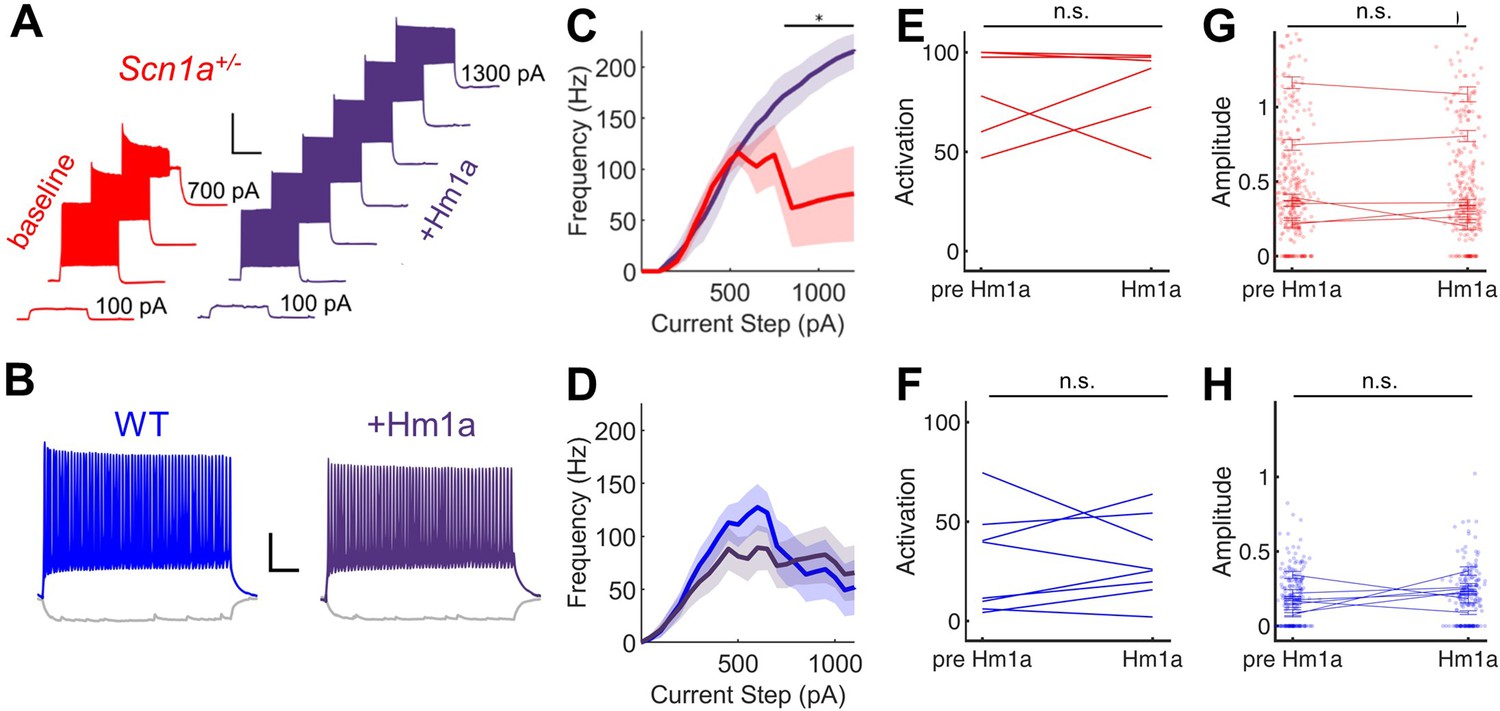
Hm1a enhances fast-spiking discharge properties in DG PV-INs from Scn1a+/- (but not wild-type) mice but has no effect on evoked GC activation.
(A) Example trace from one Scn1a+/- PV-IN showing responses to depolarizing current steps at baseline (red) or in the presence of Hm1a (purple). Hm1a decreased spike height accommodation and prevented AP failures with larger current injections. Scale bar 300 ms / 50 mV. Note that single APs cannot be visualized due to condensed timescale and high frequency firing. (B) Example trace from one wild-type PV-IN at baseline (blue) or in the presence of Hm1a (purple). Scale bar 100 ms / 20 mV. Current/frequency (I-F) plots at baseline and in the presence of Hm1a for Scn1a+/- PV-INs (C) and wild-type PV-INs (D), showing significant enhancement of firing in Scn1a+/- PV-INs only. Line and shaded areas represent mean and SEM. Bars indicate significance calculated using one-way ANOVA and post-hoc tests with Bonferroni correction: *, p < 0.05. For both genotypes, bath-application of Hm1a does not alter the perforant path-evoked proportional activation of GCs (E–F) or the amplitude of the calcium signal within those activated cells (G–H). n for Scn1a+/- and WT, respectively: 5 and 9 (cells), 3 and 4 (mice) for electrophysiology; 335 and 465 (cells), 6 and 8 (fields), 2 and 3 (mice) for 2 P imaging.
-
Figure 4—source data 1
Quantified Hm1a imaging data, reported by cell.
- https://cdn.elifesciences.org/articles/69293/elife-69293-fig4-data1-v2.xlsx
-
Figure 4—source data 2
Quantified Hm1a imaging data, reported by field.
- https://cdn.elifesciences.org/articles/69293/elife-69293-fig4-data2-v2.xlsx
Figure 5 with 2 supplements

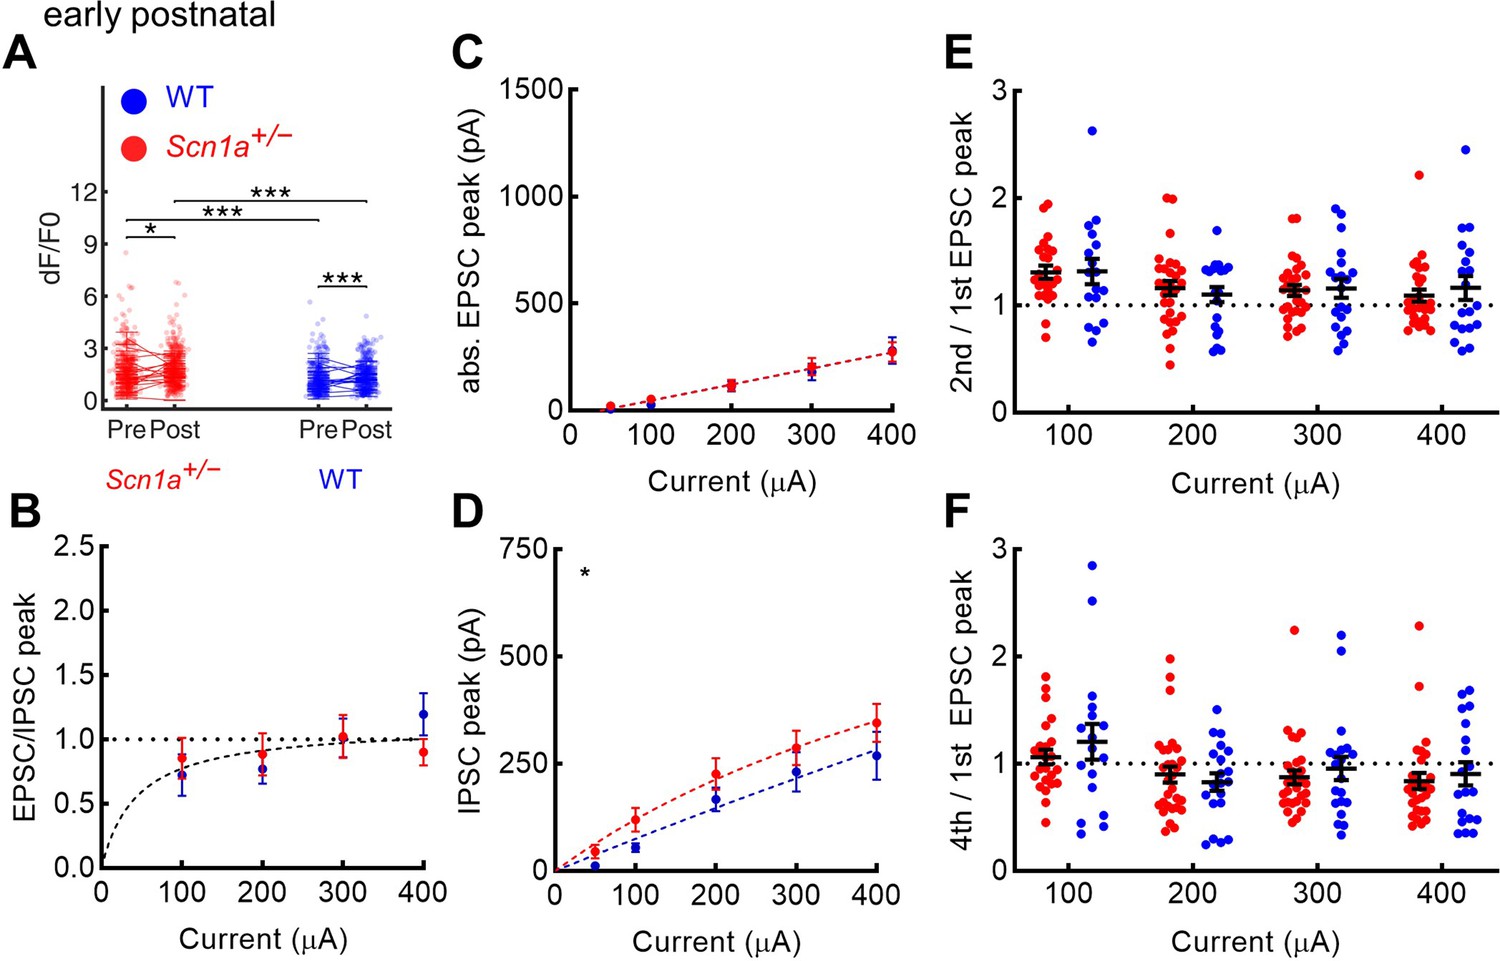
Selective increase in PP-evoked excitation of young adult Scn1a+/- dentate gyrus granule cells.
Whole cell patch clamp recordings were performed in GCs from Scn1a+/- and wild-type mice (P54-75). (A) Representative traces from wild-type (blue) and Scn1a+/- (red) GCs showing evoked monosynaptic EPSCs (recorded at –70 mV; solid) and di-synaptic IPSCs (recorded at +10 mV; dashed) in response to 300 µA PP stimulation. Scale bar, 10 ms / 500 pA. (B) EPSC / IPSC magnitude was calculated in response to 100–500 µA PP input. Data were fit with a one site binding curve and compared with an extra sum-of-squares F test (p < 0.0001). Mixed-effects analysis with multiple comparisons were used for comparisons at each point (p = 0.03 for 400 µA and p = 0.009 for 500 µA). (C) Raw evoked ESPC magnitude was significantly larger in Scn1a+/- GCs (p < 0.0001; extra sum-of-squares F test comparison of curve fits). Mixed-effects analysis with multiple comparisons were used for comparisons at each point (p = 0.01 for 200 µA, 0.004 for 400 µA, and <0.001 for 300 and 500 µA). (D) Raw evoked disynaptic IPSC magnitude was also higher overall in Scn1a+/- GCs (p = 0.01, extra sum-of-squares F test comparison of curve fits), although significance was not reached at any individual data point. n for the experiments in B-D was, Scn1a+/- and WT, respectively: 13 and 16 (cells), 4 and 4 (mice). Stars in the upper left indicate significance of overall curve fits while stars above individual data points indicate post-hoc significance at each point. (E) Magnitude of evoked GC responses as quantified by calcium imaging (dF/F0) in the presence of 100 µM picrotoxin, with persistence of significantly larger responses measured in Scn1a+/- GCs in the setting of GABAA receptor blockade (p < 0.001; mixed model analysis). n for Scn1a+/- and WT, respectively: 1073 and 1109 (cells), 14 and 16 (both fields and slices), 7 and 6 (mice). (F) Puffed glutamate (1 mM) was applied to the mid-molecular layer, with pulses of 5, 10, or 30 ms duration, while resulting currents were recorded from GCs. Scale bar 100 pA / 100ms. Arrow indicates delivery of pressure pulse to the glutamate-containing pipette. (G) Currents evoked by 10 ms glutamate puffs. n for Scn1a+/- and WT, respectively: 4 and 4 (mice), 23 and 22 (cells). (H) Representative scaled traces from wild-type and Scn1a+/- GCs showing EPSCs in response to 300 µA PP stimulation delivered at 20 Hz. Scale bar, 400 pA (Scn1a+/-) / 300 pA (wild-type) / 40ms. The decay of the EPSC (from 300 µA stimulation) was fit with a single exponential that was not different by genotype: 7.2 ± 0.6ms for Scn1a+/- (n = 8) and 8.1 ± 0.7ms for WT (n = 15; p = 0.44 vs. WT via unpaired t-test). (I) EPSC PPR comparing 2nd / 1st PP stimuli. There was a highly significant overall effect of genotype (p < 0.0001; two-way ANOVA) as well as significant genotype differences with individual comparisons (Sidak’s multiple comparisons test: 100 µA, p = 0.04; 200 µA, p = 0.04; 300 µA, p = 0.01). n for Scn1a+/- and WT, respectively: 14 and 16 (cells), 4 and 4 (mice).
-
Figure 5—source data 1
Young adult evoked response data.
- https://cdn.elifesciences.org/articles/69293/elife-69293-fig5-data1-v2.xlsx
-
Figure 5—source data 2
Early postnatal evoked response data.
- https://cdn.elifesciences.org/articles/69293/elife-69293-fig5-data2-v2.xlsx
Figure 5—figure supplement 1
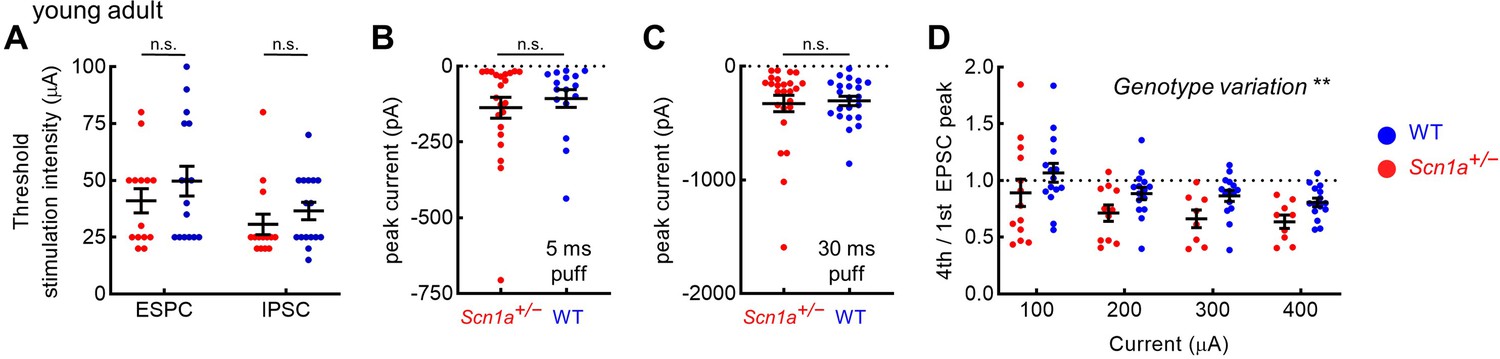
Additional metrics of evoked post-synaptic responses in young adult dentate gyrus granule cells.
(A) The threshold EPSC and IPSC stimulation intensity was identified for each cell, with no significant difference between genotypes. There was no genotype difference in response to puffed glutamate with 5 ms (B) or 30 ms (C) pulse duration. (D) 4th / 1st evoked EPSC amplitude. There was a significant overall effect of genotype (p = 0.003; two-way ANOVA), although the individual comparisons did not reach threshold for significance (Sidak’s multiple comparisons tests). n values as per Figure 5.
Figure 5—figure supplement 2
Evoked excitation is not increased in early postnatal Scn1a+/- dentate gyrus granule cells.
(A) Magnitude of evoked GC responses as quantified by calcium imaging (dF/F0) in the presence of 100 µM picrotoxin, with persistence of significantly larger responses measured in Scn1a+/- GCs in the setting of GABAA receptor blockade (p < 0.001; mixed model analysis). (B) EPSC / IPSC magnitude was calculated in response to 100–400 µA PP input, for which one curve (one site binding curve) fit both data sets (p = 0.48), and with no significant differences seen at any individual data point. (C) Raw evoked ESPC magnitude was similar across genotypes (p = 0.72). (D) Raw evoked disynaptic IPSC magnitude was slightly higher overall in Scn1a+/- GCs (p = 0.03, extra sum-of-squares F test comparison of curve fits), although significance was not reached at any individual data point. Both the 2nd/ 1st EPSC (E) and the 4th / 1st EPSC (F) had no significant overall effect of genotype (two-way ANOVA followed by multiple comparison tests). For experiments in A, n was, for Scn1a+/- and WT, respectively: 372 and 445 (cells), 16 and 17 (both fields and slices), 5 and 5 (mice). For experiments in B–F, n was: 33 and 24 (cells), 7 and 6 (mice). Stars in the upper left indicate significance of overall curve fits. For A–D, note that the y-axes are scaled to match the young adult dataset.
Figure 6

Activation of entorhinal cortex lowers temperature threshold for seizure induction in Scn1a+/- mice.
(A) Scn1a+/- and wild-type mice were injected with AAV9-CaMKIIα-ChR2-YFP into entorhinal cortex; a subset of Scn1a+/- mice were instead injected with the control virus AAV9-CaMKIIα-YFP. (B) Viral expression (green) was seen in the PP projection to dorsal (left) and ventral (right) hippocampus (as delineated by DAPI; blue). (C) Whole-cell current-clamp trace demonstrating light-evoked 20 Hz action potentials in a ChR2-expressing neuron in entorhinal cortex (470 nm, blue lines). Scale bar: 200 ms / 40 mV. (D) Pulsed photostimulation is delivered to EC at 20 Hz, 5ms pulse-width, for 5 s on / 5 s off. Mice are stimulated initially at room temperature for up to 5 min, then while subjected to hyperthermia again until 42.5 °C, or until a behavioral seizure is observed. (E) Seizure threshold for Scn1a+/- mice expressing ChR2 (38.7°C ± 0.5°C; n = 6 mice; red circles) was significantly lower than that for Scn1a+/- mice expressing YFP control virus (41.7°C ± 0.1°C; n = 6 mice; red triangles), or wild-type mice expressing ChR2 (n = 5 mice; blue circles). Note that some wild-type mice had no seizure prior to 42.5 °C (open circles). p < 0.0001 for both two-way comparisons (Sidak’s multiple comparisons tests, assuming a threshold of 42.5 °C for the wild-type mice that had no seizure). (F) Photostimulation duration prior to seizure onset was also significantly lower for the Scn1a+/--ChR2 group (p = 0.02 versus Scn1a+/--YPF and 0.04 versus wild-type-ChR2; Sidak’s multiple comparisons tests).
-
Figure 6—source data 1
Seizure threshold and time to seizure data.
- https://cdn.elifesciences.org/articles/69293/elife-69293-fig6-data1-v2.xlsx
Figure 7
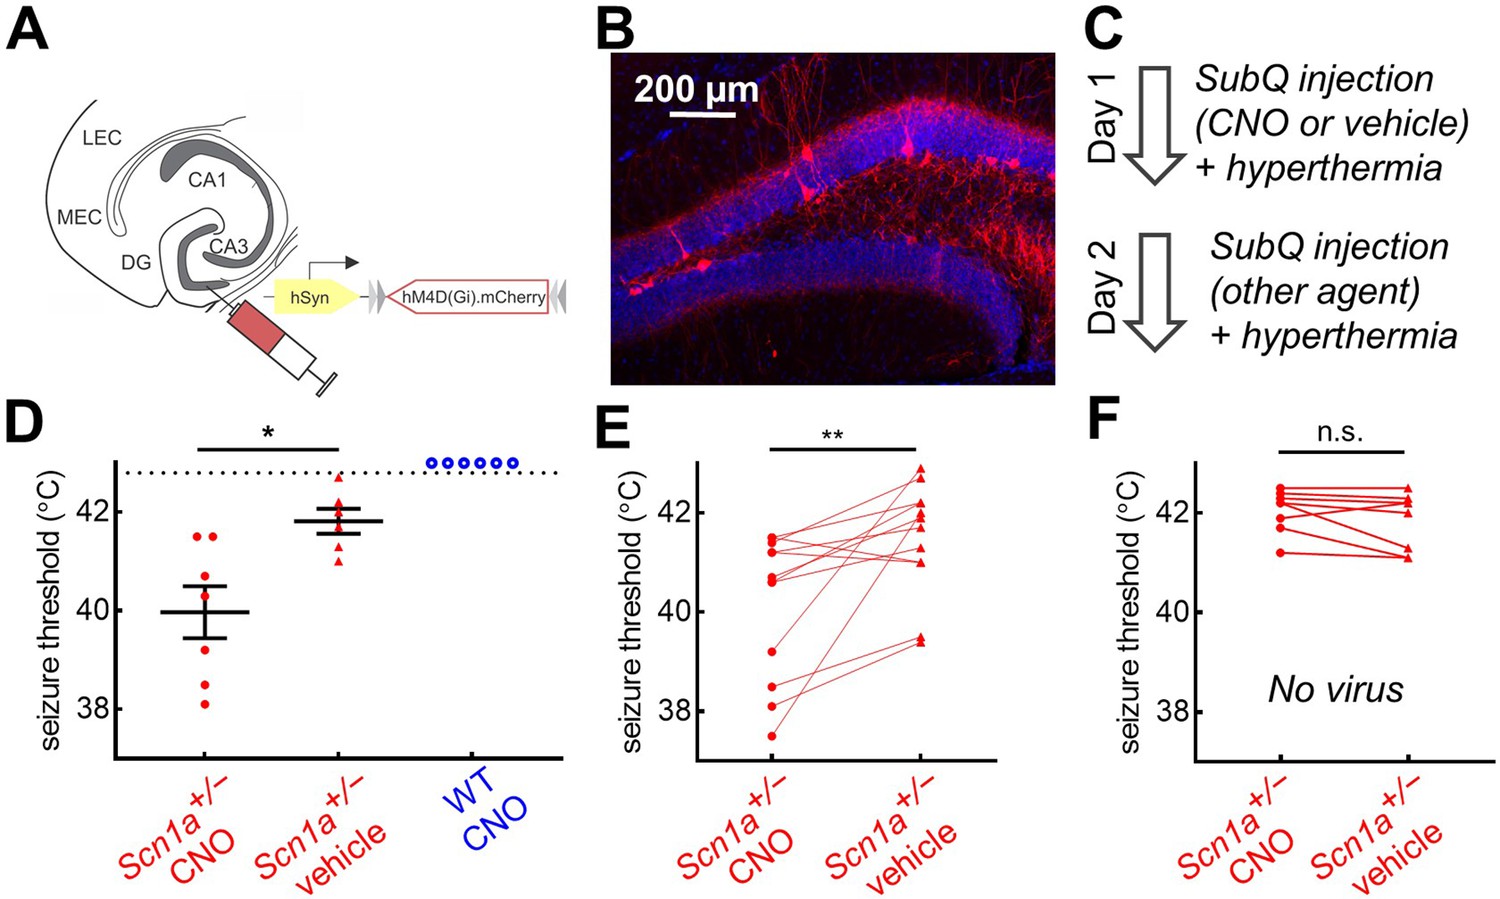
Chemogenetic inhibition of PV-INs lowers temperature threshold for seizure induction in Scn1a+/- mice.
(A)Scn1a+/- and wild-type PvalbCre mice were injected with AAV9-hSyn-FLEX-hM4D(Gi)-mCherry into bilateral DG. (B) PV-IN expression (red) was sparse within the dentate gyrus (anatomically delineated by DAPI staining, blue). (C) On Day 1, mice were randomized to receive either CNO (circle) or vehicle (triangle) injection prior to hyperthermic seizure induction; mice received the other agent on Day 2. (D) The seizure threshold for mice with CNO injection (i.e. inhibition of dentate PV-INs) was significantly lower than vehicle (p = 0.01; unpaired t test); no wild-type mice had evoked seizures after CNO injection (open circles). (E) Data pooled across the two days revealed a significantly lower seizure threshold with CNO injection (p = 0.009; paired t test). (F) In a separate control cohort of mice not injected with hM4D(Gi), there was no effect of CNO on seizure threshold. n = 12 Scn1a+/- mice with hM4D(Gi), 6 wild-type mice with hM4D(Gi), and 8 Scn1a+/- mice with no viral injection.
-
Figure 7—source data 1
Seizure threshold data.
- https://cdn.elifesciences.org/articles/69293/elife-69293-fig7-data1-v2.xlsx
Figure 8 with 1 supplement
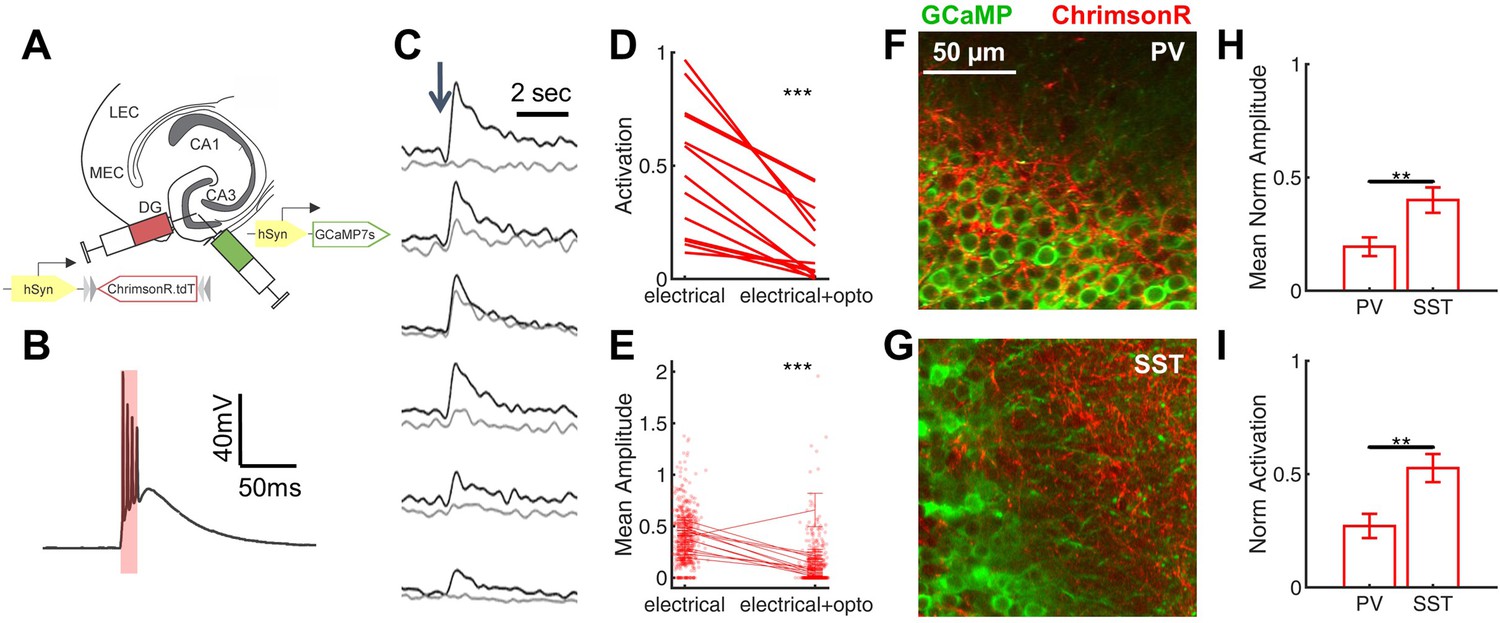
Rescue of corticohippocampal hyperexcitability via optogenetic activation of PV interneurons.
(A) Scn1a+/-.PvalbCre mice were injected with a mix of AAV9-hSyn-GCaMP7s and AAV9-hSyn-FLEX-ChrimsonR-tdT into DG. (B) Whole-cell current-clamp trace demonstrating light-evoked action potentials in a ChrimsonR-expressing PV-IN (660 nm, red bar). (C) Example calcium transients in GCs with electrical PP stimulation (single pulse, 500 µA, arrow), either alone (black) or coupled with optogenetic PV-IN activation (10ms light pulse; gray). Proportional GC activation (D) and magnitude of GC responses (E) to PP stimulation (one pulse, 500 µA) are both significantly decreased by concurrent optogenetic PV-IN activation. Each line represents one imaging field, subject to PP stimulation alone versus PP stimulation with optogenetic PV-IN activation (p < 0.001; paired t-test). Expression in PV-INs (F) results in perisomatic ChrimsonR fibers (red) surrounding GCaMP-expressing GC cells (green) within the granule cell layer, whereas expression in SST-INs (G) results in ChrimsonR expression primarily seen within the molecular layer. Optogenetic activation of DG PV-INs is more effective that activation of DG SST-INs at decreasing PP stimulation-evoked activity in GCs, with a lower proportional activation (G) and dF/F0 amplitude (H), normalized to the response to PP stimulation alone in the same cells and imaging fields. Significance (p < 0.01) determined using mixed model analysis. n for PvalbCre and SstCre, respectively: 1055 and 663 (cells), 13 and 15 (fields), 6 and 3 (mice).
-
Figure 8—source data 1
Quantified imaging data with optogenetic activation of PV- and SST-INs, reported by cell.
- https://cdn.elifesciences.org/articles/69293/elife-69293-fig8-data1-v2.xlsx
-
Figure 8—source data 2
Quantified imaging data with optogenetic activation of PV- and SST-INs, reported by field.
- https://cdn.elifesciences.org/articles/69293/elife-69293-fig8-data2-v2.xlsx
Figure 8—figure supplement 1
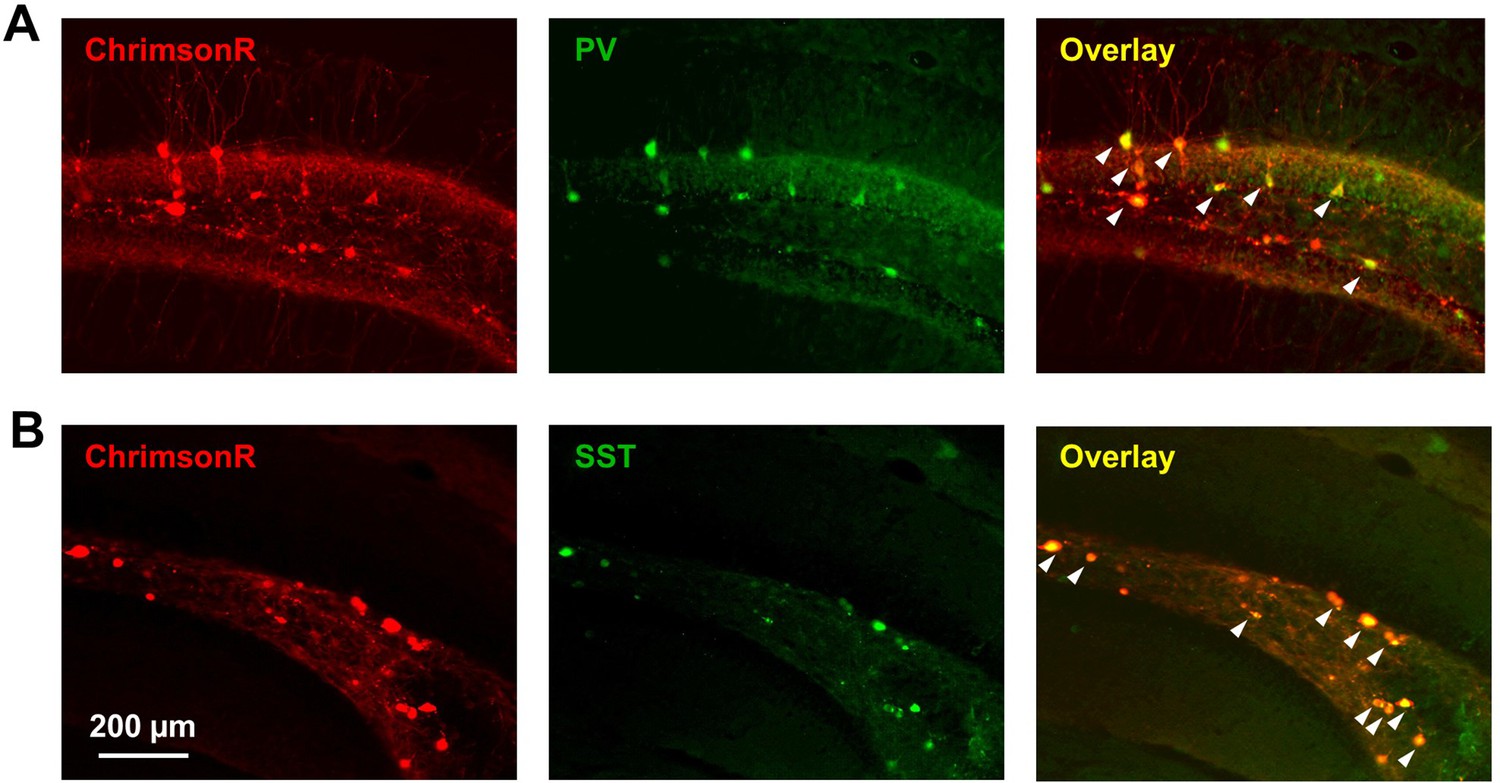
PvalbCre and SstCre lines have high specificity in dentate gyrus.
PvalbCre (A) and SstCre (B) mice were injected with AAV9-hSyn-FLEX-ChrimsonR-tdT into DG. ChrimsonR expression (red) and antibody staining for PV or SST (green) were highly colocalized (white arrows).
Tables
Table 1
Properties of early postnatal and young adult DG GCs from Scn1a+/- and wild-type mice.
| Measurement | Early postnatal | Young adult | Genotype variation (ANOVA) | ||||
|---|---|---|---|---|---|---|---|
| Scn1a+/- | WT | p-value | Scn1a+/- | WT | p-value | p-Value | |
| n cells (mice) | 19 (3) | 21 (3) | 16 (7) | 13 (4) | |||
| Age (days) | 18 ± 2 | 19 ± 1 | 0.88 | 55 ± 6 | 58 ± 2 | 0.75 | |
| Vm (mV) | –78.0 ± 1.6 | –77.6 ± 1.7 | 0.99 | –78.1 ± 1.6 | –78.8 ± 2.1 | 0.99 | 0.95 |
| Rm (MΩ) | 379 ± 19 | 405 ± 43 | 0.89 | 237 ± 20 | 217 ± 19 | 0.97 | 0.89 |
| Time Constant | 8.3 ± 1.4 | 9.1 ± 1.2 | 0.96 | 7.2 ± 0.8 | 8.1 ± 1.5 | 0.96 | 0.51 |
| Rheobase (pA) | 65 ± 8 | 69 ± 8 | 0.99 | 134 ± 16 | 119 ± 19 | 0.86 | 0.66 |
| AP Threshold (mV) | –36.2 ± 1.7 | –34.1 ± 2.8 | 0.89 | –37.2 ± 1.5 | –36.8 ± 1.6 | 0.99 | 0.56 |
| AP Amplitude (mV) | 80.9 ± 2.4 | 84.2 ± 1.8 | 0.64 | 81.4 ± 1.6 | 83.8 ± 2.5 | 0.88 | 0.19 |
| AP Peak (mV) | 44.7 ± 1.4 | 46.1 ± 2.2 | 0.94 | 44.2 ± 1.4 | 47.0 ± 2.1 | 0.77 | 0.27 |
| AP Rise Time (ms) | 0.54 ± 0.02 | 0.53 ± 0.03 | 0.97 | 0.57 ± 0.02 | 0.59 ± 0.02 | 0.94 | 0.87 |
| AP Halfwidth (ms) | 0.76 ± 0.02 | 0.80 ± 0.04 | 0.69 | 0.77 ± 0.03 | 0.86 ± 0.04 | 0.34 | 0.05 |
| AHP Amplitude (mV) | 15.2 ± 1.1 | 15.7 ± 0.7 | 0.98 | 13.9 ± 1.0 | 13.8 ± 1.1 | > 0.99 | 0.81 |
| AHP time (ms) | 3.08 ± 0.34 | 2.99 ± 0.27 | 0.99 | 1.91 ± 0.14 | 2.16 ± 0.09 | 0.93 | 0.09 |
| Sag (percent) | 3.2 ± 0.3 | 4.0 ± 0.5 | 0.71 | 3.5 ± 0.6 | 3.8 ± 0.9 | 0.98 | 0.32 |
| Max instantaneous (Hz) | 140 ± 10 | 160 ± 8 | 0.44 | 184 ± 13 | 161 ± 8 | 0.49 | 0.91 |
| Max steady-state (Hz) | 57 ± 3 | 65 ± 4 | 0.41 | 66 ± 4 | 63 ± 6 | 0.97 | 0.50 |
-
Table 1—source data 1
Data summary for all DG GCs electrophysiological data.
- https://cdn.elifesciences.org/articles/69293/elife-69293-table1-data1-v2.xlsx
Table 2
Properties of early postnatal and young adult DG PV-INs from Scn1a+/- and wild-type mice.
| Measurement | Early postnatal | Young adult | Genotype variation (ANOVA) | ||||
|---|---|---|---|---|---|---|---|
| Scn1a+/- | WT | p-value | Scn1a+/- | WT | p-value | p-Value | |
| n cells (mice) | 13 (5) | 10 (5) | 18 (5) | 19 (4) | |||
| Age (days) | 19 ± 1 | 19 ± 1 | 0.72 | 69 ± 3 | 66 ± 2 | 0.56 | |
| Vm (mV) | –57.9 ± 1.7 | –61.5 ± 2.3 | 0.65 | –57.6 ± 1.8 | –57.2 ± 1.8 | 0.99 | 0.42 |
| Rm (MΩ) | 94 ± 11 | 53 ± 6 | 0.007 (**) | 105 ± 6 | 101 ± 6 | 0.97 | 0.005 (**) |
| Time Constant | 5.3 ± 0.8 | 4.7 ± 1.0 | 0.91 | 6.4 ± 0.3 | 5.1 ± 0.3 | 0.26 | 0.10 |
| Rheobase (pA) | 555 ± 96 | 802 ± 120 | 0.10 | 489 ± 35 | 463 ± 34 | 0.99 | 0.10 |
| AP Threshold (mV) | –35.7 ± 3.4 | –45.8 ± 3.1 | 0.04 (*) | –50.4 ± 1.4 | –49.0 ± 1.6 | 0.96 | 0.07 |
| AP Amplitude (mV) | 64.2 ± 2.1 | 61.8 ± 4.2 | 0.92 | 75.1 ± 1.7 | 76.9 ± 1.9 | 0.93 | 0.91 |
| AP Peak (mV) | 28.5 ± 3.4 | 16.1 ± 4.0 | 0.008 (**) | 24.7 ± 31.3 | 27.9 ± 1.3 | 0.69 | 0.05 |
| AP Rise Time (ms) | 0.63 ± 0.15 | 0.50 ± 0.07 | 0.61 | 0.67 ± 0.08 | 0.50 ± 0.05 | 0.41 | 0.06 |
| AP Halfwidth (ms) | 0.54 ± 0.03 | 0.43 ± 0.04 | 0.01 (*) | 0.35 ± 0.01 | 0.37 ± 0.01 | 0.86 | 0.048 (*) |
| AHP Amplitude (mV) | 10.7 ± 1.5 | 7.2 ± 3.5 | 0.58 | 11.4 ± 1.1 | 9.7 ± 1.2 | 0.85 | 0.14 |
| AHP time (ms) | 1.60 ± 0.11 | 1.12 ± 0.10 | 0.001 (**) | 0.98 ± 0.05 | 0.93 ± 0.03 | 0.92 | 0.0008 (***) |
| Sag (percent) | 11.1 ± 1.7 | 26.4 ± 6.6 | 0.007 (**) | 9.0 ± 1.1 | 17.3 ± 2.3 | 0.10 | 0.0001 (***) |
| Max instantaneous (Hz) | 181 ± 8 | 277 ± 19 | 0.002 (**) | 237 ± 15 | 297 ± 13 | 0.006 (**) | < 0.0001 (****) |
| Max steady-state (Hz) | 139 ± 12 | 213 ± 20 | 0.006 (**) | 189 ± 11 | 191 ± 12 | 0.99 | 0.008 (**) |
-
Table 2—source data 1
Data summary for all DG PV-IN electrophysiological data.
- https://cdn.elifesciences.org/articles/69293/elife-69293-table2-data1-v2.xlsx
Key resources table
| Reagent type (species) or resource | Designation | Source or reference | Identifiers | Additional information |
|---|---|---|---|---|
| Genetic reagent (Mus musculis) | 129S-Scn1atm1Kea/Mmjax | Jax | RRID:MMRRC_037107-JAX | Dr. Jennifer A. Kearney, Northwestern University |
| Genetic reagent (M. musculis) | B6;129P2-Pvalbtm1(cre)Arbr/J | Jax | RRID:IMSR_JAX: 017320 | |
| Genetic reagent (M. musculis) | B6J.Cg-Ssttm2.1(cre)Zjh/MwarJ | Jax | RRID:IMSR_JAX:028864 | |
| Genetic reagent (M. musculis) | Rosa-CAG-LSL-tdTomato | Jax | RRID:IMSR_JAX:007914 | |
| Genetic reagent (M. musculis) | C57BL/6 J | Jax | RRID:IMSR_JAX:000664 | |
| Recombinant DNA reagent | pGP-AAV-syn-jGCaMP7s-WPRE | Addgene | 104487-AAV9 | 3 × 10¹³ cfu/mL |
| Recombinant DNA reagent | pAAV-Syn-ChrimsonR-tdT | Addgene | 59171-AAV9 | 2.3 × 10¹² cfu/mL |
| Recombinant DNA reagent | pAAV-CaMKIIa-hChR2(H134R)-EYFP | Addgene | 26969-AAV9 | 3.9 × 10¹² cfu/mL |
| Recombinant DNA reagent | AAV9-CamKIIα-eYFP-WPRE-hGH | UNC Vector Core | 3.9 × 10¹² cfu/mL | |
| Recombinant DNA reagent | pAAV-hSyn-DIO-hM4D(Gi)-mCherry | Addgene | 44362-AAV9 | 9.0 × 10¹² cfu/mL |
| Peptide, recombinant protein | Hm1a | Alomone | STH-601 | 50 nM |
| Chemical compound, drug | Quantum dot | PMID:25326662 | Igor L. Medintz, U.S. Naval Research Laboratory | |
| Chemical compound, drug | Picrotoxin | Tocris Bioscience | 11–281 G | 100 µM |
| Chemical compound, drug | Clozapine N-oxide (CNO) | Sigma-Aldrich | C0832 | 10 µM (slice); 10 mg/kg (in vivo) |
| Software, algorithm | pClamp 10 | Clampfit | RRID:SCR_011323 | V10.0 |
| Software, algorithm | Matlab | Mathworks | RRID:SCR_001622 | 2019 a |
| Software, algorithm | Python Programming Language | http://www.python.org/ | RRID:SCR_008394 | |
| Software, algorithm | Analysis of two photon imaging data | This paper Somarowthu, 2022 | https://github.com/GoldbergNeuroLab/Mattis-et-al.-2022 | |
| Software, algorithm | Analysis of whole cell patching data | This paper Evans, 2022; Goff, 2022 | https://github.com/GoldbergNeuroLab/Mattis-et-al.-2022 | |
| Antibody | anti-Parvalbumin antibody (Rabbit polyclonal) | Swant Cat# PV27 | RRID:AB_2631173 | (1:1000) |
| Antibody | anti- Somatostatin antibody (Rat monoclonal) | Millipore Cat# MAB354 | RRID:AB_2255365 | (1:50) |
| Antibody | Anti-Rat IgG (H + L) Antibody, Alexa Fluor 488 (Goat polyclonal) | Molecular Probes Cat# A-11006 | RRID:AB_141373 | (1:500) |
| Antibody | Anti-Rabbit IgG (H + L) Antibody, Alexa Fluor 488 (Goat polyclonal) | Molecular Probes Cat# A-11008 | RRID:AB_143165 | (1:500) |
| Other | DAPI stain | Thermo Fisher Scientific Cat# D1306 | RRID:AB_2629482 | (1:50,000) |
Additional files
Download links
A two-part list of links to download the article, or parts of the article, in various formats.
Downloads (link to download the article as PDF)
Open citations (links to open the citations from this article in various online reference manager services)
Cite this article (links to download the citations from this article in formats compatible with various reference manager tools)
Corticohippocampal circuit dysfunction in a mouse model of Dravet syndrome
eLife 11:e69293.
https://doi.org/10.7554/eLife.69293


