Quantifying the relationship between SARS-CoV-2 viral load and infectiousness
- Université de Paris, IAME, INSERM, France
- Centre for Interdisciplinary Research in Biology (CIRB), Collège de France, CNRS, INSERM, PSL Research University, France
- Fight AIDS and Infectious Diseases Foundation, Hospital Universitari Germans Trias i Pujol, Spain
- Lihir Medical Centre, International SOS, Papua New Guinea
- Hospital Universitari Parc Taulí, Spain
- Facultat de Medicina–Universitat de Barcelona, Spain
- London School of Hygiene and Tropical Medicine, United Kingdom
- Hospital for Tropical Diseases, United Kingdom
- Division of infection and Immunity, University College London, United Kingdom
Figures
Figure 1 with 2 supplements

Individual fits of viral dynamics in index cases and occurrence of high-risk contacts.
Black dots represent the measured viral load. Squares indicate documented high-risk contacts, with empty squares representing contacts without transmission, and red squares representing contacts with a subsequent infection. Results obtained in the 41 index cases having three viral load measurements.
Figure 1—figure supplement 1
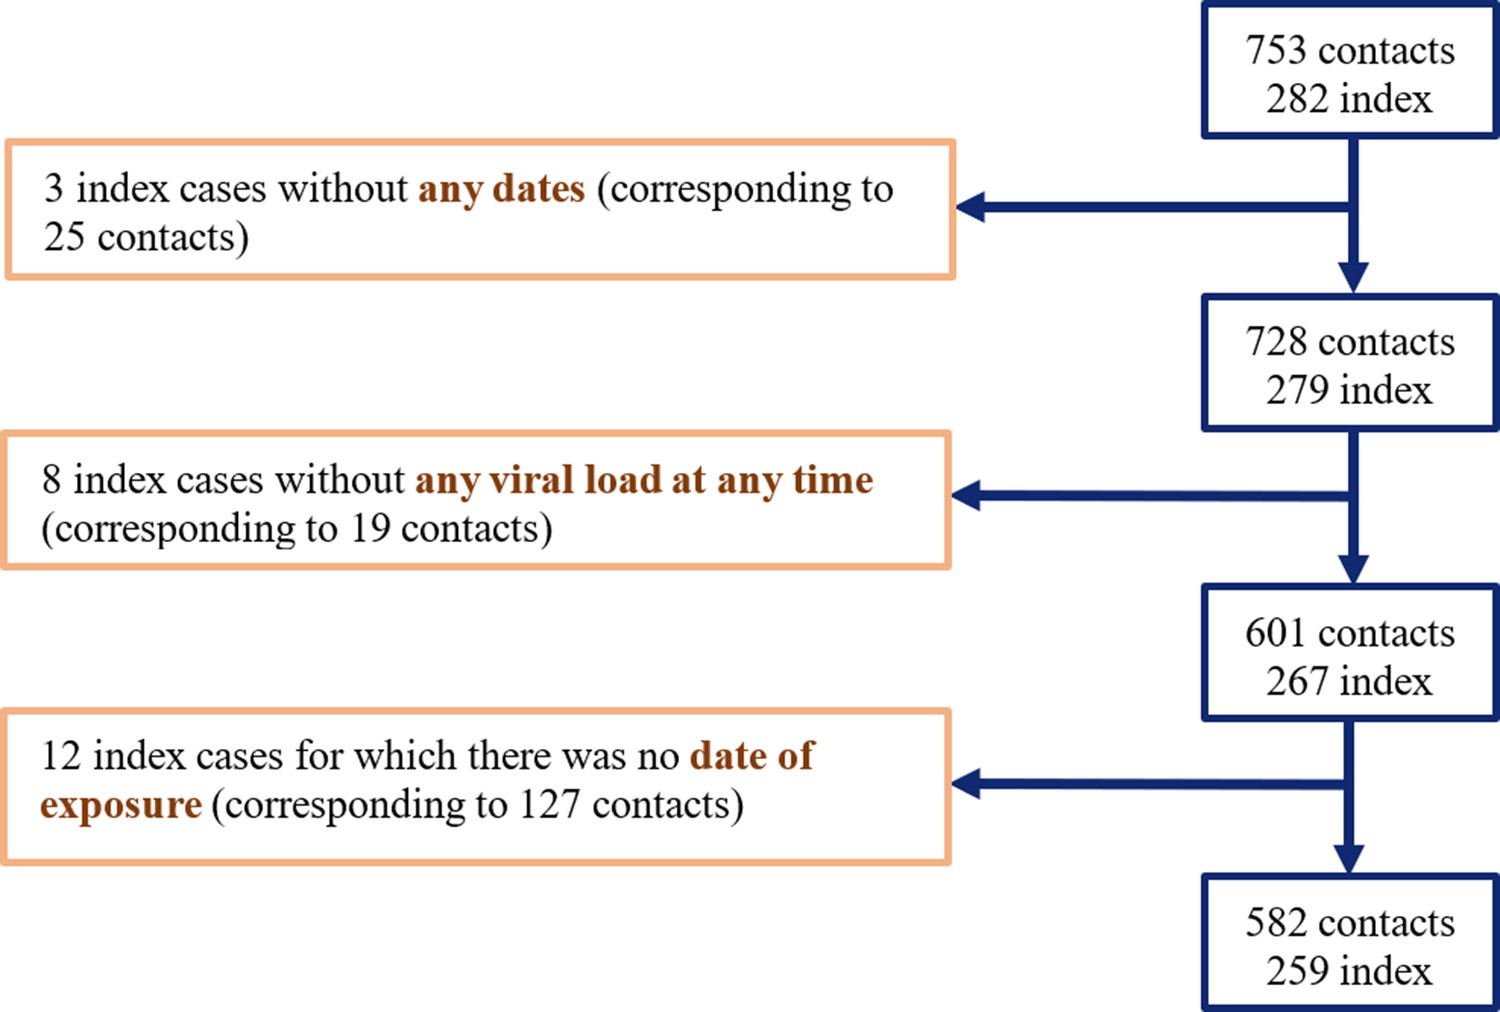
Flow chart of data selection.
Figure 1—figure supplement 2
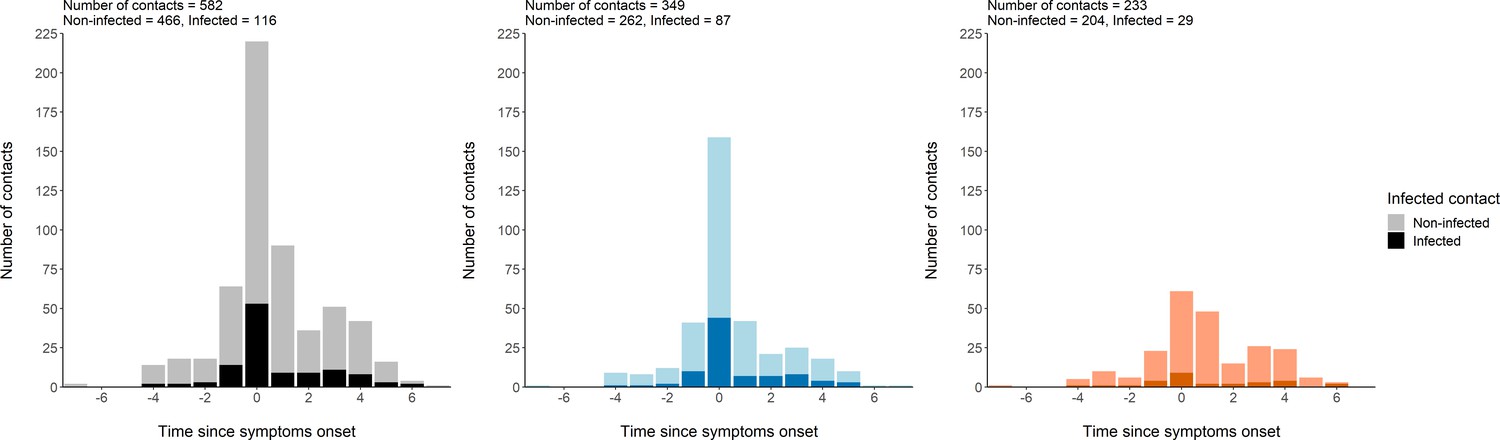
Distribution of contacts.
Distribution of the times at which a high-risk contact occurred between an index and a contact, with reference to the time of symptom onset of the index case. This indicates that most contacts reported in the study occurred at the time of symptom onset of the index, and that many contacts occurred during the pre-symptomatic period of the index. All contacts (Left). Household contacts (Middle). Non-household contacts (Right).
Figure 2
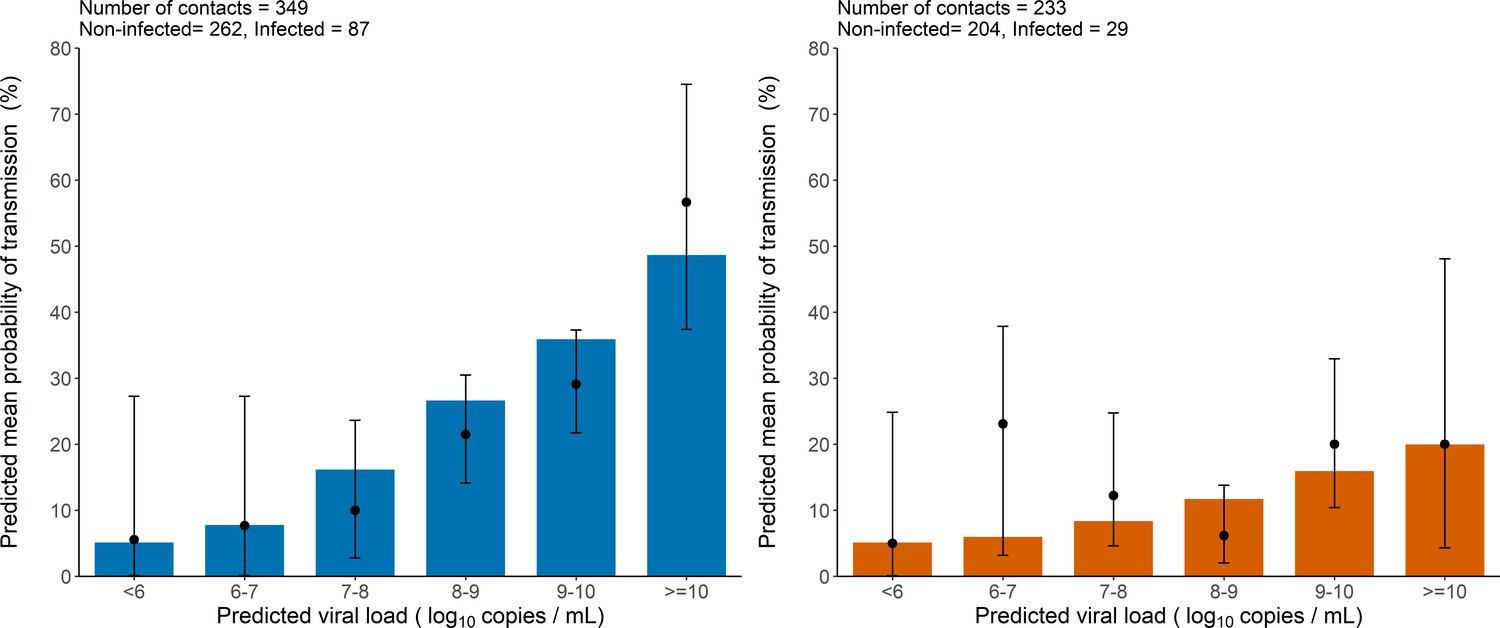
Model-based predictions of the effect of viral load on the risk of transmission and comparison to observed data.
Bars represent the mean predicted probability of transmission obtained from 1000 simulations of the model M2 and stratified by viral load level at the time of contact. Black dots are the proportion of transmission events observed in the data stratified by the predicted viral load of the index cases at the time of contact (along with their 95% confidence intervals). Household contacts (Left). Non-household contacts (Right).
Figure 3
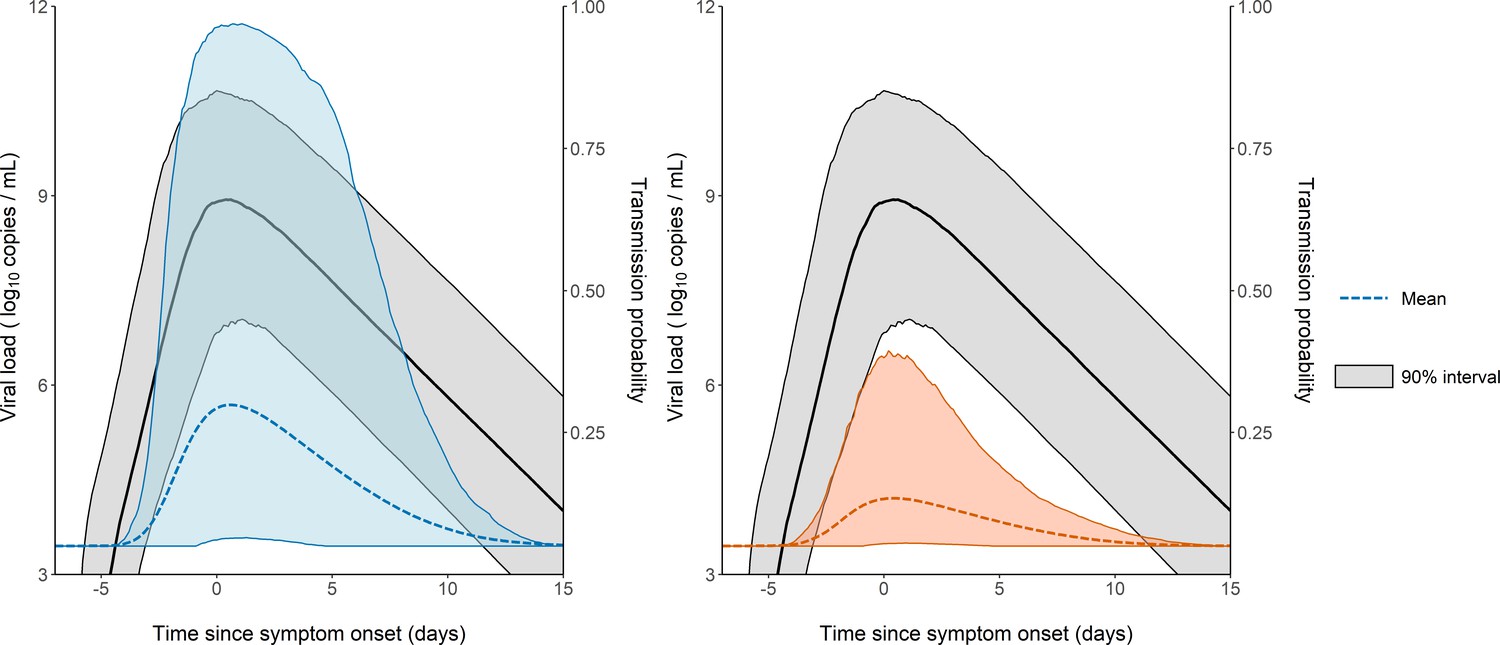
Model-based predictions of the dynamics of viral load and infectiousness over time.
Prediction interval of the viral load (black) and the probability of transmission over time after a high-risk contact obtained from 1000 simulations of the model. The shaded area represents the 90% inter quantile range. Household contacts (Left). Non-household contacts (Right).
Figure 4 with 2 supplements
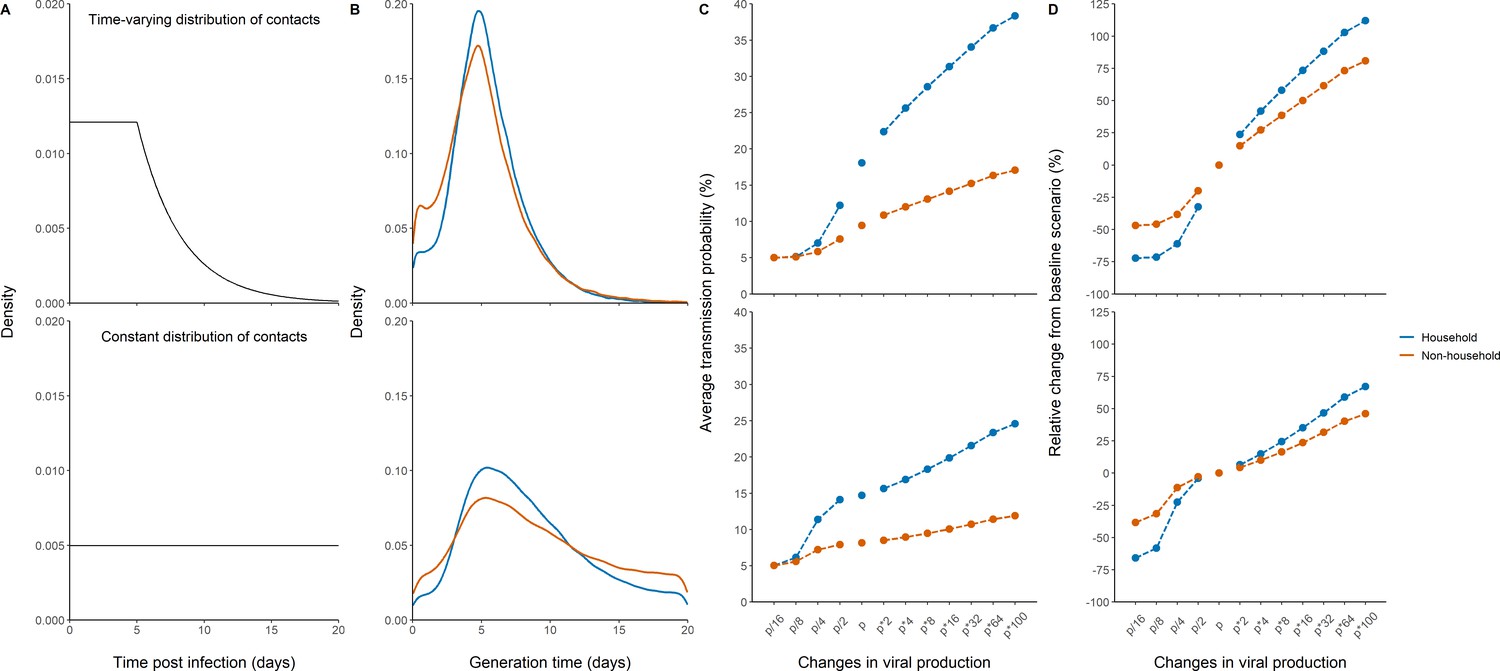
Effects of variants of concern and vaccination on transmission for different distributions of contacts.
(A) We considered a rate of contacts that could either decline after 5 days (top) or remain constant for the whole considered period (bottom). (B) Distribution of the generation interval using model M2 under each scenario. (C) Impact of changes in viral production on the average probability of transmission. (D) Impact of changes in viral production on the relative change from the baseline scenario in model M2.
Figure 4—figure supplement 1
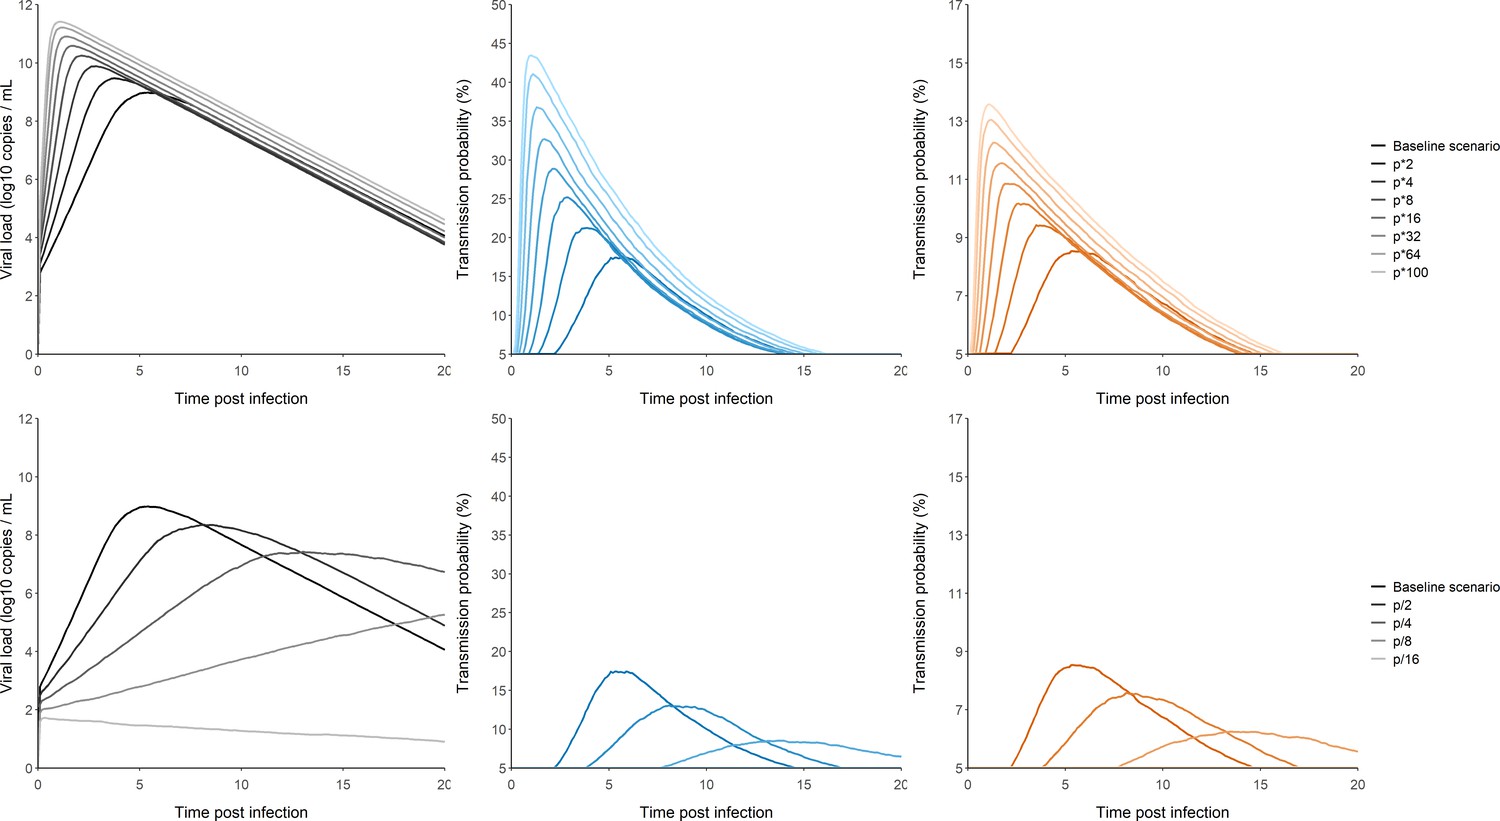
Effect of changes in the viral production on the viral load and transmission probabilities trajectories.
Effect of variants of concern (Top). Effect of vaccination rollout (Bottom). We only displayed the median trajectories over the simulated individuals. Viral load (Black). Transmission probability for household contacts (Blue). Transmission probability for non-household contacts (Orange).
Figure 4—figure supplement 2
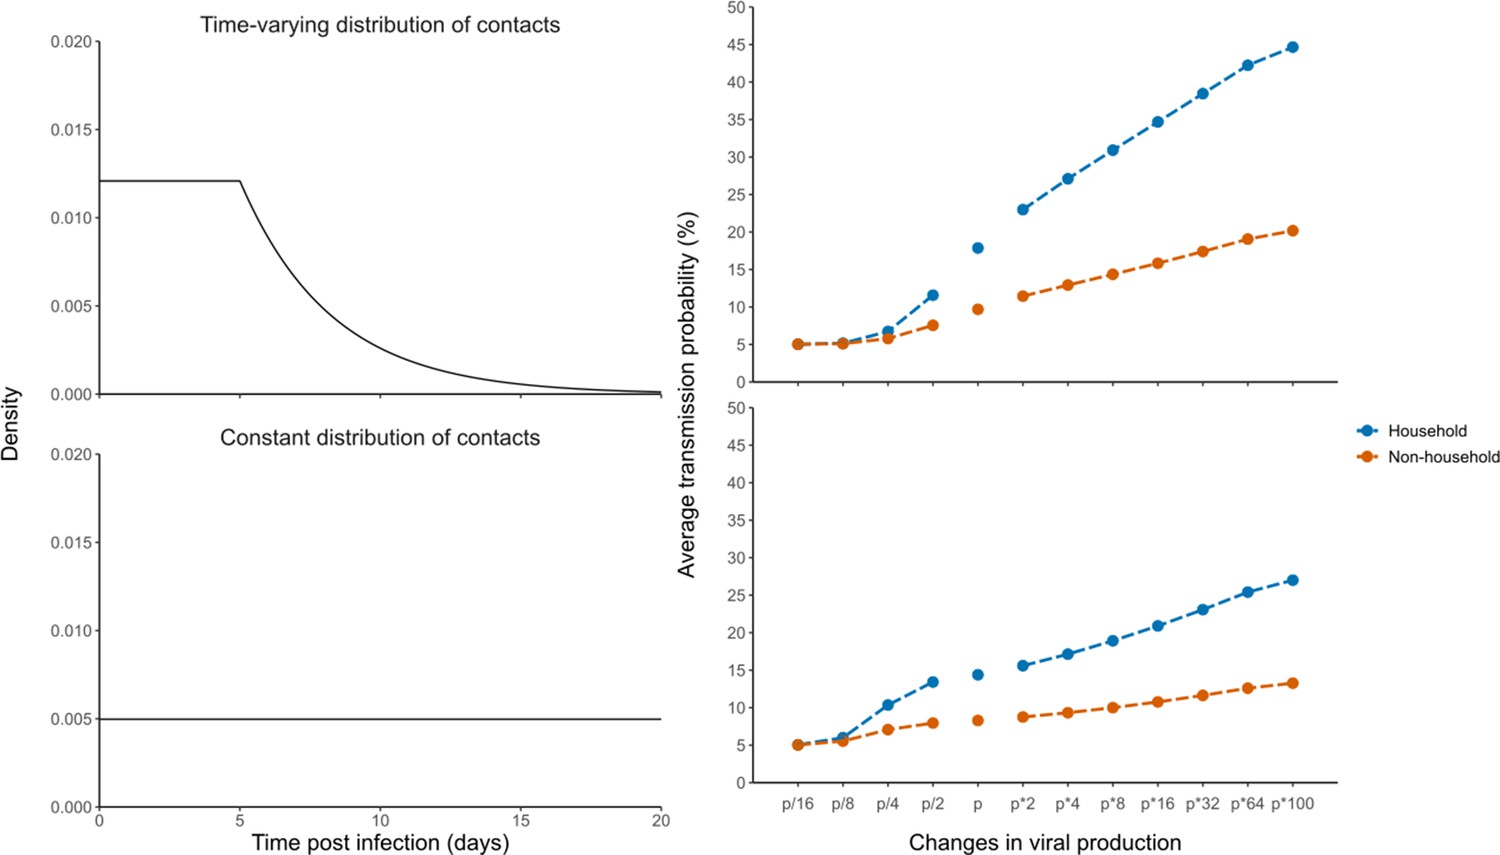
Impact of changes in the viral production rate on the average probability of transmission with model M3.
Using a time-varying distribution of contacts (Top) or a constant distribution of contacts (Bottom).
Tables
Table 1
Parameters estimates of the three candidate models.
, within-host basic reproductive number; , loss rate of infected cells; , rate of viral production; represents the effect of household contacts on the transmission probability; represents the effect of non-household contacts on the transmission probability. M1 assumes that transmission probability does not depend on the viral load. M2 and M3 use different parametric functions to relate the transmission probability to viral load at the time of contact. The distribution of the incubation period was fixed to values from the literature (see Materials and methods).
| Parameter estimates (RSE %) | |||||||
|---|---|---|---|---|---|---|---|
| No effect of viral load (M1) | Logit-Linear (M2) | Log-Linear model (M3) | |||||
| Fixed effect | Random effect SD | Fixed effect | Random effect SD | Fixed effect | Random effect SD | ||
| Incubation period () | 5 | 0.125 | 5 | 0.125 | 5 | 0.125 | |
| 12.20 (14) | 0.32 (34) | 13.60 (15) | 0.38 (21) | 13.40 (22) | 0.423 (35) | ||
| 0.83 (1) | 0.019 (47) | 0.84 (4) | 0.037 (77) | 0.832 (100) | 0.023 (74) | ||
| () | 1.97 × 10⁵ (41) | 2.38 (9) | 2.8 × 10⁵ (50) | 2.35 (8) | 2.40 × 10⁵ (47) | 2.3 (9) | |
| 1.28 (38) | 0.82 (55) | 0.49 (20) | 0.85 (32) | 0.47 (6) | 0.545 (23) | ||
| 0.57 (62) | 0.21 (44) | 0.25 (17) | |||||
| 2502 | 2497 | 2500 | |||||
Additional files
-
Source data 1
Viral load of index cases and list of their high-risk contacts.
- https://cdn.elifesciences.org/articles/69302/elife-69302-data1-v1.xlsx
-
Supplementary file 1
Parameter estimates of models with a fixed incubation period ranging from 4 to 7 days.
- https://cdn.elifesciences.org/articles/69302/elife-69302-supp1-v1.docx
-
Supplementary file 2
Parameters estimates of models with different threshold values below which the transmission is set to 5%.
- https://cdn.elifesciences.org/articles/69302/elife-69302-supp2-v1.docx
-
Supplementary file 3
Parameter estimates of the Model M2 (Left) and the same model without variability in transmission (Right).
- https://cdn.elifesciences.org/articles/69302/elife-69302-supp3-v1.docx
-
Supplementary file 4
Proportion of contacts wearing masks in each category (Left).
Secondary attack rate calculated for each category (Right).
- https://cdn.elifesciences.org/articles/69302/elife-69302-supp4-v1.docx
-
Transparent reporting form
- https://cdn.elifesciences.org/articles/69302/elife-69302-transrepform-v1.docx
Download links
A two-part list of links to download the article, or parts of the article, in various formats.
Downloads (link to download the article as PDF)
Open citations (links to open the citations from this article in various online reference manager services)
Cite this article (links to download the citations from this article in formats compatible with various reference manager tools)
Quantifying the relationship between SARS-CoV-2 viral load and infectiousness
eLife 10:e69302.
https://doi.org/10.7554/eLife.69302


