Quantifying the relationship between SARS-CoV-2 viral load and infectiousness
Abstract
The relationship between SARS-CoV-2 viral load and infectiousness is poorly known. Using data from a cohort of cases and high-risk contacts, we reconstructed viral load at the time of contact and inferred the probability of infection. The effect of viral load was larger in household contacts than in non-household contacts, with a transmission probability as large as 48% when the viral load was greater than 1010 copies per mL. The transmission probability peaked at symptom onset, with a mean probability of transmission of 29%, with large individual variations. The model also projects the effects of variants on disease transmission. Based on the current knowledge that viral load is increased by two- to eightfold with variants of concern and assuming no changes in the pattern of contacts across variants, the model predicts that larger viral load levels could lead to a relative increase in the probability of transmission of 24% to 58% in household contacts, and of 15% to 39% in non-household contacts.
Introduction
After more than 18 months of an unprecedented pandemic, some key aspects of virus transmission remain poorly understood. While respiratory droplets and aerosols have rapidly been demonstrated as a major route of transmission of SARS-CoV-2 (Tang et al., 2020), the role of the viral load as a driver of infectiousness has been established (He et al., 2020) but not quantified. This lack of evidence is due to the fact that high-risk contacts occur mostly before the index has been diagnosed, with no information on the viral load level at the time of the contact. The relationship between viral load and infectiousness determines the timing of transmission, the inter-individual heterogeneity in transmission, and ultimately the impact of interventions (contact, case isolation, vaccination) on transmission. In the context of variants of concern, that are associated with larger viral loads (Teyssou et al., 2021; Liu et al., 2021; Elie et al., 2021; Cosentino et al., 2021; Jones et al., 2021), it becomes even more critical to delineate the contribution of viral load from other factors associated with an increased transmission. Further, as antiviral drugs and vaccine strategies are being implemented, that dramatically reduce the amount of viral shedding (Levine-Tiefenbrun et al., 2021), it is essential to understand how they may contribute to a reduction in virus transmission.
One of the most documented clinical study to address the question of viral load and infectiousness has been obtained through individuals included in a randomised controlled trial conducted in March-April 2020 in Spain, that aimed to assess the efficacy of hydroxychloroquine on SARS-CoV-2 transmission (Mitjà et al., 2021; Marks et al., 2021). Overall, 282 index and their 753 high-risk contacts were frequently monitored to assess their virological and clinical evolution. An association was found between the probability of being infected after a high-risk contact and the viral load measured at the time of diagnosis in the index case (Marks et al., 2021). This suggests that viral load is associated with transmission; however, it does not quantify the role of viral load in disease transmission, as the viral load at the exact time of the contact remains unknown and may greatly differ from that measured, several days later, at the time of diagnosis.
In order to study in detail the role of viral load on the probability of transmission, we reanalysed these data by using a within-host model of viral dynamics (Néant et al., 2021; Gonçalves et al., 2020) to reconstruct the viral load levels of the index cases at the time of contact, and to infer the relationship between viral load and the probability of transmission after a high-risk contact. Further, we used the model to predict the effects of changes in viral load levels on the probability of transmission, representing the effects of infection with a variant of concern or infection in an individual in which vaccine would confer a partial protection against viral replication.
Results
Baseline characteristics
A total of 259 index cases and their 582 high-risk contacts (simply called contacts in the following) were included in our analysis (Figure 1—figure supplement 1).
The majority of index cases were female (72%) with a median age of 42 (90% Inter Quantile Range (IQR): [24, 61]). A total of 544 swab samples were performed at days 0, 3 and 7 days after study inclusion. The first swab was performed after a median time of 4 days (90% IQR: [2, 6]) after symptom onset. The maximum median viral load obtained during follow-up was 8.4 log10 copies per mL (90% IQR:[5.1, 10.6]).
The majority of contacts were female (56%) with a median age of 41 (90% IQR: [20, 65]). The form of contacts was categorized as either household (60%) or non-household (40%).
Overall, 87 household contact led to an infection (proportion of transmission of 24.9%) and 29 non-household contacts led to an infection (proportion of transmission of 12.4%). The majority of contacts (65%) and of infection events (65%) occurred ±1 day from symptom onset of the index cases (Figure 1—figure supplement 2).
Viral dynamic model
We used a target cell limited model to reconstruct the viral load kinetics of the index cases over time, assuming that the incubation period has a log-normal distribution with a mean value of 5 days (Néant et al., 2021; Lauer et al., 2020). Although several models relating viral load to infectiousness were evaluated (see below), they all provided nearly identical fits to the viral load data predicted in the index cases (Figure 1). Additionally, we tested several models with a fixed incubation period ranging from 4 to 7 days, and they all yielded similar results (Supplementary file 1). In the best model (Model M2, see below), the basic within-host reproductive number, , quantifying the number of cell infections that occur from a single infected cell at the beginning, was estimated at 13.6, the loss rate of productively infected cells, , at 0.84 d−1 (corresponding to a half-life of 20 hr) and viral production , at d−1 (Table 1). When reconstructing the viral load profiles, the model predicted that the median peak viral load coincided with symptom onset, with a median peak value of 9.4 log10 copies per mL (90% IQR: [8.0, 10.0]).

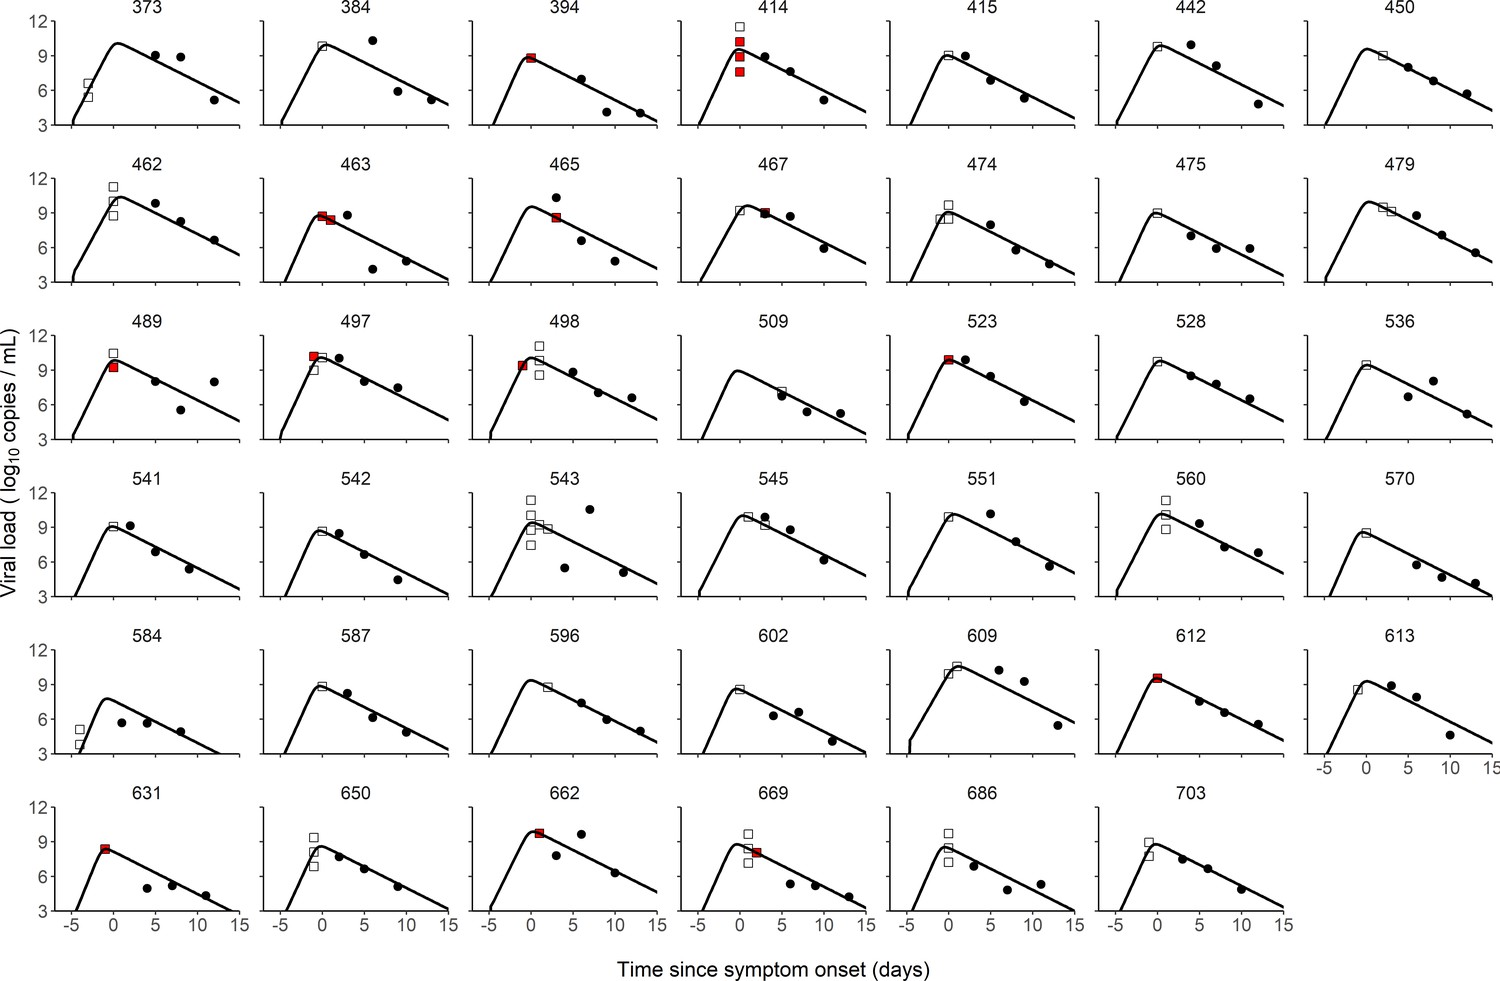
Individual fits of viral dynamics in index cases and occurrence of high-risk contacts.
Black dots represent the measured viral load. Squares indicate documented high-risk contacts, with empty squares representing contacts without transmission, and red squares representing contacts with a subsequent infection. Results obtained in the 41 index cases having three viral load measurements.
We tested several models of probability transmission (see Materials and methods) and estimated the parameters of both viral dynamics and probability of transmission simultaneously. The two model assuming an effect of viral load on the probability of transmission (Model M2 and M3) provided an improvement in BIC as compared to the model M1, supporting an effect of viral load on the probability of infection. In both models, viral load was significantly associated with the probability of transmission after household contact (p<0.01, Wald test on γ1); however, the effect was lower after non-household transmission (p<0.05, Wald test on γ2). Because we fixed the probability of transmission to 5% for viral load levels below six log10 copies/mL, which is generally the threshold for virus culture in vitro (Jones et al., 2021; Néant et al., 2021; van Kampen et al., 2021; Mollan et al., 2021), we tested models with threshold values ranging from 4 to 8 log10 copies/mL and they all yielded similar results (Supplementary file 2).
As a mean to evaluate the model adjustment to data, we also used simulations to compare the observed proportion of transmission in the original data to the mean probability of transmission obtained from the simulated individuals. The model-based simulations showed good agreement with the observed data, and reproduced well the increase in the transmission probability associated with higher viral load level (Figure 2). The model predicted that the mean probability of transmission increased from the fixed nominal value of 5% for viral load levels < 6 log10 copies per mL, to as much as 48% and 20% for viral load ≥ 10 log10 copies per mL for household and non-household contacts, respectively. This is close to the values of 56% and 20% obtained on the predicted individuals. (Figure 2).

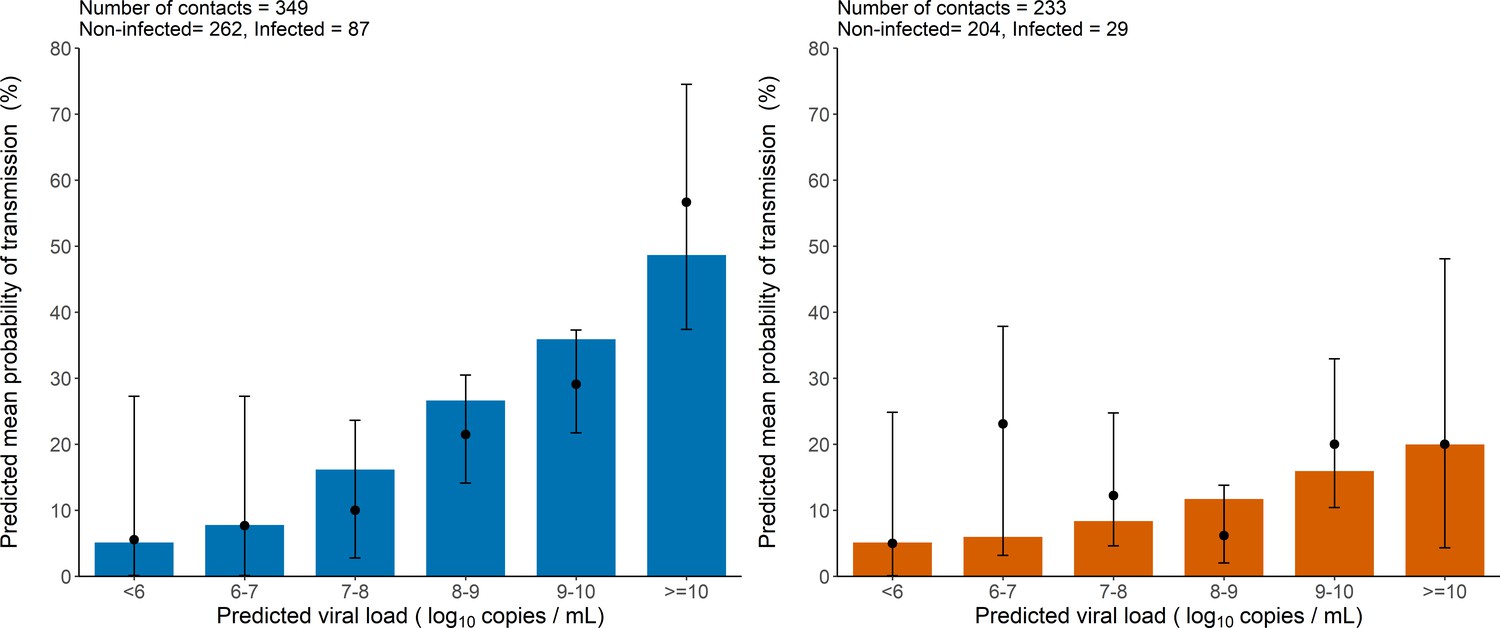
Model-based predictions of the effect of viral load on the risk of transmission and comparison to observed data.
Bars represent the mean predicted probability of transmission obtained from 1000 simulations of the model M2 and stratified by viral load level at the time of contact. Black dots are the proportion of transmission events observed in the data stratified by the predicted viral load of the index cases at the time of contact (along with their 95% confidence intervals). Household contacts (Left). Non-household contacts (Right).
The model considers two levels of individual variability, one on the viral load dynamics (Chen et al., 2021) (as measured by the standard deviation of the associated random effects, and ), and another one on the probability of transmission (with a standard deviation ). Of note, was equal to 85%, indicating that several other factors are involved in the transmission probability, even after adjustment for viral load levels (see Supplementary file 3 for the results obtained with a model assuming a similar value for in all individuals). This variability is shown on Figure 3, where 1000 individuals were sampled in the population distribution to obtain the probability of transmission over time and across individuals. Over the time of infection, the median probability of transmission peaked at the time of symptom onset with a mean value of 29% in household contacts. However, there was large inter-individual variabilities due to both viral load levels and individual characteristics, with a 90% inter quantile range of 6-96% (Figure 3). The peak of transmission was much lower in non-household contacts, with a mean value of 13% (90% IQR: [5, 38]). As a consequence of our assumption that the probability of transmission after a high-risk contact returned to baseline level when viral load dropped below 6 log10 copies per mL, the window for infection was shorter than the duration of viral shedding. The probability of transmission was above 5% for a median duration of 12 days (90% IQR: [9, 15]).

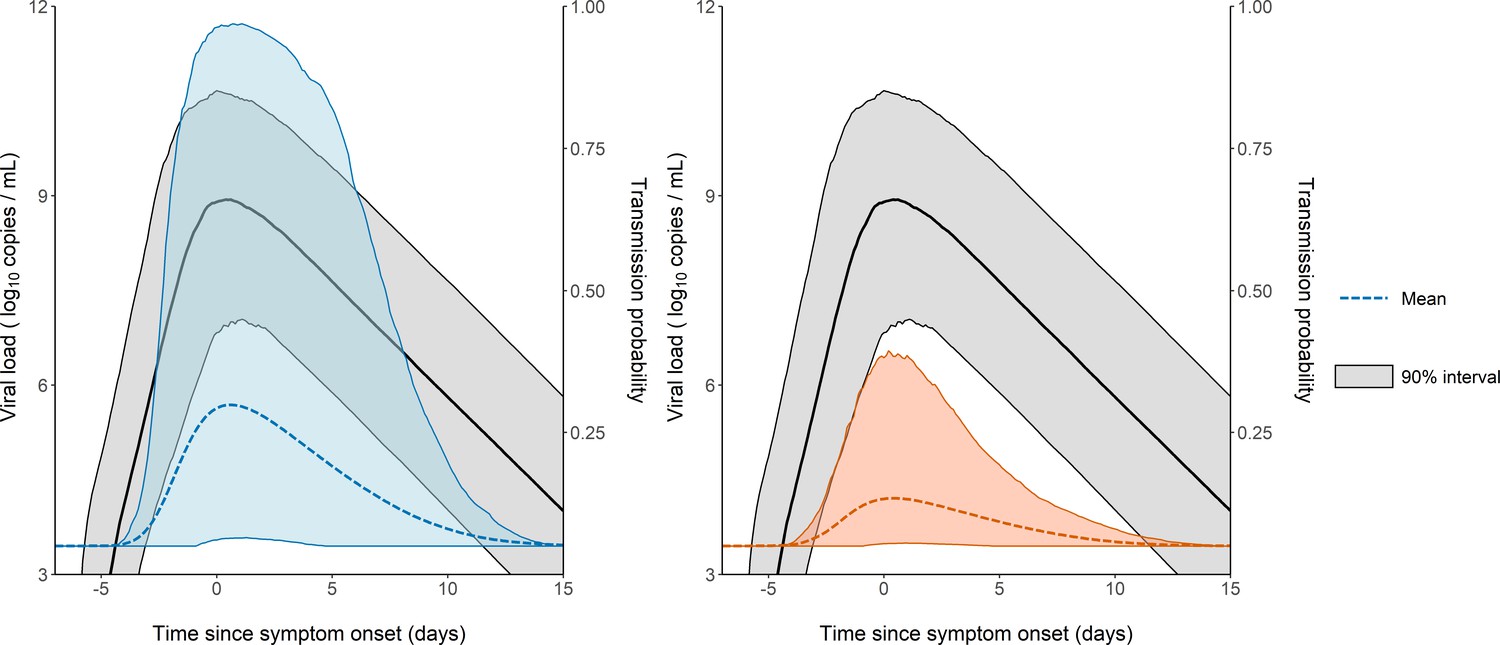
Model-based predictions of the dynamics of viral load and infectiousness over time.
Prediction interval of the viral load (black) and the probability of transmission over time after a high-risk contact obtained from 1000 simulations of the model. The shaded area represents the 90% inter quantile range. Household contacts (Left). Non-household contacts (Right).
Sampling the generation interval
As a mean to validate the model prediction, we also calculated the generation interval, that is the time elapsed between the infection of an individual and the infection of a contact. We considered two potential distributions of contact times, one in which the rate of contacts is constant during the whole considered period, and one in which the rate of contacts decreases rapidly after 5 days, reflecting self-isolation and/or diagnosis (Figure 4A). The median generation interval was estimated to be 5.1 days (90% IQR: [1, 10]) and 4.8 days (90% IQR: [1, 11]) for household and non-household contacts respectively, when a time-varying rate of contacts was used. Those estimates are close, albeit with higher variability, to what has been found in other studies (Cereda et al., 2020; Bi et al., 2020). When using a constant contact rate, we obtained larger estimates of 7.7 days (90% IQR: [2.4, 17]) and 8.2 (90% IQR: [1.6, 18]) in household contacts and non-household contacts, respectively (Figure 4B). Because the time varying contact rate was more realistic (Cereda et al., 2020; Bi et al., 2020; Ferretti et al., 2020; Wu et al., 2020), we used it as our central scenario in what follows.

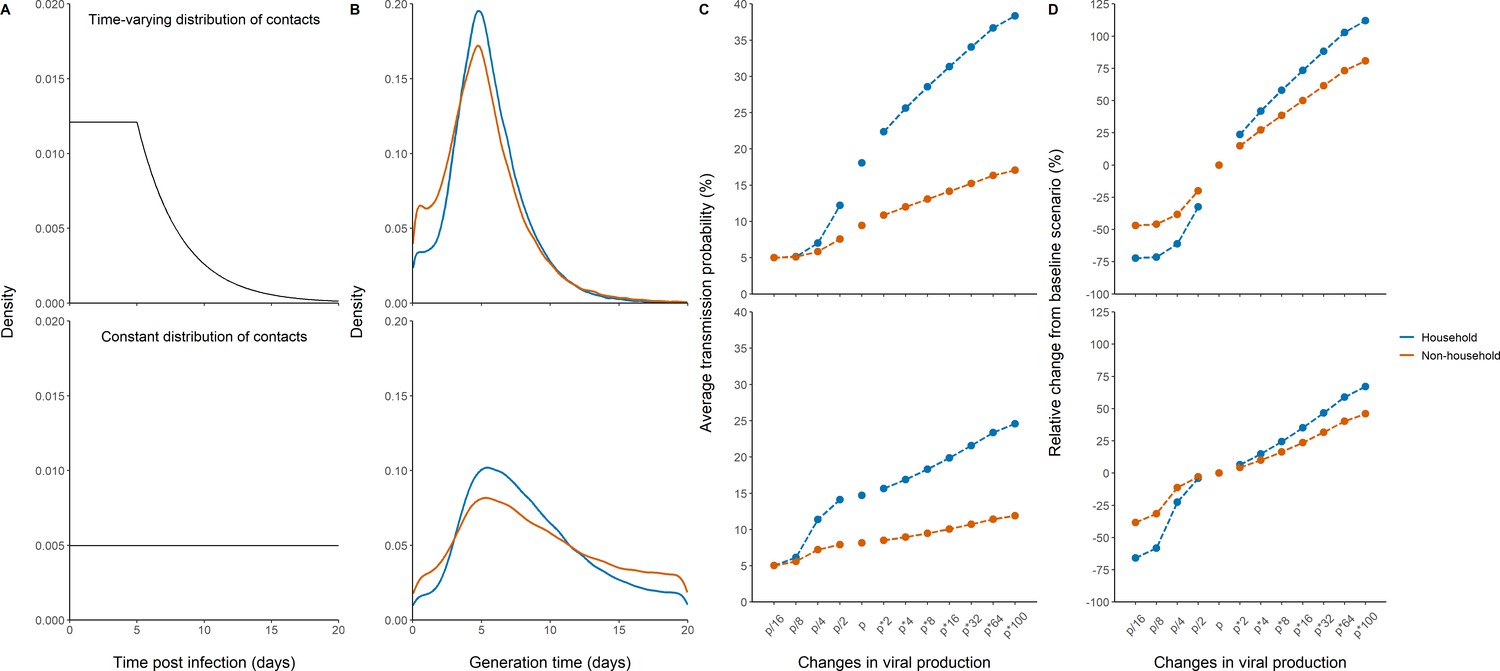
Effects of variants of concern and vaccination on transmission for different distributions of contacts.
(A) We considered a rate of contacts that could either decline after 5 days (top) or remain constant for the whole considered period (bottom). (B) Distribution of the generation interval using model M2 under each scenario. (C) Impact of changes in viral production on the average probability of transmission. (D) Impact of changes in viral production on the relative change from the baseline scenario in model M2.
Impact of variants of concern and vaccination on the probability of transmission
We used the model to characterize the effects of changes of viral load dynamics due to infection with variants of concern. For that purpose, we evaluated the impact of a change in the viral production rate, p, by a fold 2–100, which corresponds to an average increase in viral load of 1–7 cycle thresholds (Ct), at each time point (Figure 4—figure supplement 1). As a metrics of comparison, we calculated in each scenario the average probability of transmission after a high-risk contact in the 20 days following infection (see methods).
For the baseline scenario using the parameters estimated in our population, the average transmission probability was 18% and 9% for household and non-household contacts, respectively.
With an increased value of viral production, p, by a factor 2, which corresponds to the viral load increase caused by B1.1.7 strain in large-scale epidemiological studies (Golubchik et al., 2021; Roquebert et al., 2021; Kidd et al., 2021), the average probability of transmission would increase to 22% and 11% for household and non-household contacts respectively. With a fourfold increase, as suggested elsewhere (Teyssou et al., 2021), the average probability of transmission would increase to 26% and 12% for household and non-household contacts, respectively (Figure 4C). The estimates for the P1 and B1.1.351 variants are less established, with values ranging from a twofold (Teyssou et al., 2021) to a 10-fold increase (Naveca et al., 2021). Assuming an increase by eightfold of the viral load, the average probability of transmission would increase to 29% and 13% for household and non-household contacts, respectively. As compared to the results observed with the historical virus a two-, four-, or eightfold increase in viral production rate would therefore lead to a relative increase in the average transmission probability of 24, 42, or 58% for household contacts, and of 15, 27, or 39% for non-household contacts (Figure 4D). Because increasing the production rate mostly impacts the early viral dynamics and less the post-peak dynamics (Figure 4—figure supplement 1), the effects of VOC is lower when a uniform distribution is used. In other words, self-isolation after symptoms or a positive test implies that more transmission happens early in infection, thus amplifies the impact of the viral production rate on transmission. In this case, we estimated a relative increase in the average transmission probability of 6, 15, or 24% for household contacts, and of 4, 10, or 16% for non-household contacts.
Conversely, we studied the effects of lower levels of viral load, as expected from a partial protection conferred by vaccination. Epidemiological studies in Israel reported a 3-5-fold lower viral load in infected vaccinated individuals as compared to unvaccinated individuals (Levine-Tiefenbrun et al., 2021). Assuming a reduction by a factor 4 of the viral production rate, , would lead to an average probability of transmission of 7% and 6% for household and non-household contacts respectively (Figure 4). In other studies relying on systematic repeated viral testing in both symptomatic and asymptomatic individuals, the effect of vaccine was much more dramatic, with a 30-100-fold reduction in viral load levels (McEllistrem et al., 2021; Thompson et al., 2021; Bailly et al., 2021). Assuming a reduction of 16-fold (~4 Ct) of the viral load, the average probability of transmission would decrease to its nominal value of 5% for both household and non-household contacts. As compared to the results observed with the historical virus, a 4- or 16-fold reduction in viral production rate would lead to a relative decrease in the average transmission probability of 61% or 72% for household contacts and of 38 or 47% for non-household contacts. The effect of vaccination is lower if a uniform distribution of contact is used, with a relative decrease in the average transmission probability of 23 or 66% for household-contacts and of 11 or 38% for non-household contacts (Figure 4).
Results obtained with model M3 were largely consistent and are given in Figure 4—figure supplement 2.
Discussion
Here, we quantified the impact of viral load on infectiousness using data obtained in a prospective cohorts of index and contact cases (Mitjà et al., 2021). The effect of viral load was particularly large in household contacts, with a mean transmission probability that increased to as much as 48% when the viral load was over 10 log10 copies per mL. Consistent with reports suggesting that the probability of transmission (Edwards et al., 2021) greatly vary between individuals, the effect of viral load was individual-dependent. For instance, at the peak of infectiousness, the mean probability of transmission during household contact was 29% with a 90% inter quantile range of 6–96%.
The model also provided information on the effects of variants on disease transmission. We relied on results found in both large-scale epidemiological data and longitudinal evaluation of Ct values (Elie et al., 2021; Cosentino et al., 2021), that reported an average increase of the B1.1.7 virus by 1-2 Ct (Teyssou et al., 2021; Golubchik et al., 2021; Roquebert et al., 2021), which can be reproduced in our model by assuming that viral production increases by a factor 2-4. Alternatively, as only the product p × T0 can be identified, this could also be due to B1.1.7 being able to infect twice as much target cells, as suggested by the fact that the N501Y substitution improved the affinity of the viral spike protein (Liu et al., 2021). Regardless of the origin of this increased viral load, we estimated that an increase of viral load by a factor of 2, 4, or 8 would lead to a relative increase in the average transmission probability of 24, 42, or 58% in household contacts and of 15, 27, or 39% for non-household contact. As raised by one of the reviewers, it is important to recognize that the association between VOC and viral load levels relies on observational studies, with data mostly collected after symptom onset, both factors limiting a formal causation. In fact, another modelling study performed in a small population of frequently sampled individuals diagnosed early in their infection did not find an effect of B1.1.7 on viral kinetics (Ke et al., 2021).
Conversely, vaccination rollout is expected to confer a large level of protection, partly due to lower virus carriage in infected individuals. The exact magnitude of this decrease is difficult to quantify, and depends on the design of the study that relied on systematic testing or included only symptomatic individuals. This may explain the variability in the reports from the literature from 5- to 100-fold reduction in viral load levels (McEllistrem et al., 2021). Whatever the exact value, our predictions indicate that reductions of fourfold or more will dramatically reduce the probability of transmission carried by vaccinated infected individuals.
Our study has important limitations. First, the reporting of high-risk contacts is prone to several biases. One of them is the fact that at the time where the study was conducted, the role of pre-symptomatic transmission was not known. This could explain why a large number of high-risk household contact were reported to occur the day of symptom onset (Figure 1—figure supplement 2). Also, it is possible that recollection bias leads to an overestimation of contacts reporting on the day of symptom onset. Because this will equally affect contacts that resulted in a transmission event and those that did not lead to a transmission event, it is unlikely that our estimates of transmission will be affected by this bias. To address a potential overestimation of the contacts occurring at symptom onset, we used two theoretical distributions of contacts in our simulations, assuming either a constant distribution of contact during the infectious period, or a more realistic scenario in which most contacts occurred during the first 5 days after infection. Also, we assumed the same patterns of contacts in our different scenarios. Although there are no data on these aspects yet, it is possible that larger levels of viral shedding could lead to a more severe infection or, inversely, that lower viral load could produce milder infections, thereby modifying the incubation period and more generally the patterns of contact. Another important limitation is that household contacts may not be unique and could occur multiple times. Because we had no information on these contacts, we did not conduct specific analyses on repeated contacts, but this is something that future epidemiological studies will need to investigate. Finally, it is always possible that infection observed in contacts individuals did not originate from the identified index case. In most infected contacts, we did not have data on the time of symptom onset, making it difficult to detect unplausible transmission event. However, the temporality of symptoms would not be sufficient to bring a decisive information on the infection event. Indeed, the study was conducted during the first epidemic wave in Spain, where most individuals, including in hospital settings, had not yet applied social distancing and masking, causing dozens of thousands of individuals infected every day. Both the possibility of repeated contacts in household and infection of contacts outside the identified contact network may have led us to overestimate the difference in the probability of transmission between household and non-household contacts. Specifically, infections outside of the identified probability contact would flatten the estimated relationship between viral load and transmission compared to the true relationship. It is also important to note that viral load data in index cases were collected on average 3–4 days after symptom onset, in the declining phase of viral load, several days after most of the contacts had occurred. Although our population parameters were estimated with a reasonable precision (Table 1), it nonetheless brings uncertainty on the predictions of individual trajectories. This limitation is inherent to the nature of SARS-CoV-2, where the peak viral load coincides with symptom onset, making difficult to obtain data during the replicating phase of the virus where individuals are largely asymptomatic.
Parameters estimates of the three candidate models.
, within-host basic reproductive number; , loss rate of infected cells; , rate of viral production; represents the effect of household contacts on the transmission probability; represents the effect of non-household contacts on the transmission probability. M1 assumes that transmission probability does not depend on the viral load. M2 and M3 use different parametric functions to relate the transmission probability to viral load at the time of contact. The distribution of the incubation period was fixed to values from the literature (see Materials and methods).
Parameter estimates (RSE %) | |||||||
---|---|---|---|---|---|---|---|
No effect of viral load (M1) | Logit-Linear (M2) | Log-Linear model (M3) | |||||
Fixed effect | Random effect SD | Fixed effect | Random effect SD | Fixed effect | Random effect SD | ||
Incubation period () | 5 | 0.125 | 5 | 0.125 | 5 | 0.125 | |
12.20 (14) | 0.32 (34) | 13.60 (15) | 0.38 (21) | 13.40 (22) | 0.423 (35) | ||
0.83 (1) | 0.019 (47) | 0.84 (4) | 0.037 (77) | 0.832 (100) | 0.023 (74) | ||
() | 1.97 × 10⁵ (41) | 2.38 (9) | 2.8 × 10⁵ (50) | 2.35 (8) | 2.40 × 10⁵ (47) | 2.3 (9) | |
1.28 (38) | 0.82 (55) | 0.49 (20) | 0.85 (32) | 0.47 (6) | 0.545 (23) | ||
0.57 (62) | 0.21 (44) | 0.25 (17) | |||||
2502 | 2497 | 2500 |
Beside viral load, several factors are associated with a transmission event. One important one is face masking, for both the index and the contact. In the original analysis of Marks et al., 2021, the use of face mask by contacts was not found associated with a decreased viral load, but this probably reflects the lack of more detailed data on the type of mask, the use of other personal protective equipment and infection control practices. It is also important to recall that face masking was poorly reported and was missing in about 35% of contacts, limiting statistical power (Supplementary file 4). The use of face mask by index cases was not collected in the original study. This information might be of a greater importance as it has a far more substantial effect on viral shedding and thus on transmission. Collecting this information in future studies should probably contribute to a reduction in the variance of the random effect parameter associated with transmission ().
To conclude, our study quantifies the probability of infection according to viral load level after a high-risk contact. This relationship can be used to predict the effects of changes in virus paradigm, caused by the emergence of new variants and/or the rollout of vaccination. We estimate that two- to eightfold increase in viral load level observed with variants of concern could lead to an increase in the probability of transmission by 24–58% in household contacts.
Materials and methods
Data collection
Request a detailed protocolData used come from a cluster-randomised trial which included individuals with PCR-confirmed COVID-19 and their close contacts, and evaluated the efficacy of hydroxychloroquine as a pre- or post-exposure prophylaxis. The trial was conducted between March, 17 and April 28, 2020 in three out of nine health-care area in Catalonia, Spain. More details on the study protocol and main results can be found in the original publication (Mitjà et al., 2021).
Study participants
Request a detailed protocolAll index cases were individuals aged 18 years or older, identified by the Catalan epidemiological surveillance system, with no hospitalisation, nasopharyngeal PCR positive results at baseline and mild symptoms onset within 5 days of inclusion and had no reported symptoms of SARS-CoV-2 infections in their accommodation or workplace within the 14 days before enrolment. High-risk contacts were adults with a recent history of exposure (i.e. >15 min within 2 m up to 7 days before enrolment) and absence of COVID-19 like symptoms within the 14 days preceding enrolment, and who had an increased risk of infection (e.g. health care worker a household contact, a nursing-home worker, or a nursing-home resident). Contacts were quarantined upon enrolment to the study. In the original study, 282 index cases and the resulting 753 contacts were enrolled (Marks et al., 2021); here we did not include three index individuals (and their corresponding 25 contacts) for which no viral load data was available, eight index individuals (19 contacts) for which no viral load was detected at any time point, and 12 index cases (127 contacts) for which no date of contact was available. Thus, our analysis was performed on 259 index and 582 contacts (Figure 1—figure supplement 1). In 12 index cases, the date of symptoms onset was not known and was imputed to 4 days before their first swab sampling, which corresponds to the median value observed in the population study. Type of contact was considered as household or non-household, the latter included nursing home contacts, health-care worker and other undefined contacts.
Reconstructing viral load in index cases using a viral kinetic model
Request a detailed protocolWe used a target cell-limited model to reconstruct nasopharyngeal viral kinetics in index cases (Néant et al., 2021; Madelain et al., 2018; Baccam et al., 2006). The model includes three populations of cells, namely Target cells , infected cells in their eclipse phase and productively infected cells . Target cells are infected at a constant rate by infectious virus . Infected cells enter an eclipse phase at a rate before becoming productively infected cells . We assumed productively infected cells have a constant loss rate . Virions are released from productively infected cells at a rate and are loss at a rate . A proportion µ of produced viruses are infectious and the remaining are non-infectious viruses , both are cleared at a rate . The model can be written as follows:
Based on this model, the basic reproduction number, , defined as the number of newly infected cells by one infected cell at the beginning of the infection (Best et al., 2017) is, . Given the absence of any antiviral effect of hydroxychloroquine against SARS-CoV-2 (Mitjà et al., 2021; Maisonnasse et al., 2020; Boulware et al., 2020), we did not consider any effect of hydroxychloquine in the model.
Assumptions on parameter values
View detailed protocolSome parameters were fixed to ensure identifiability. The clearance rate was fixed at and the eclipse phase to based on previous work (Néant et al., 2021; Gonçalves et al., 2020; Gonçalves et al., 2021). The proportion of infectious virus µ was assumed constant over time and was fixed to 10−4 as observed in animal model (Gonçalves et al., 2021). The initial number of target cells, , was fixed to (more details in Néant et al., 2021). We assumed that at the moment of infection there was exactly one productively infected cell in the upper respiratory tract. Hence, at ,.
We assumed that the incubation period was lognormally distributed around 5 days before symptoms onset with a standard deviation of 0.125 days, corresponding to 90% of individuals having an incubation period varying between 4 and 6 days (Jones et al., 2021; Lauer et al., 2020).
Statistical model for viral kinetics
Request a detailed protocolParameter estimations were performed using non-linear mixed-effect model. The structural model used to describe the observed viral load is , where is the observation of index at time with and with the number of index and is the number of observations for index . is the function describing the total viral load dynamics predicted by the model at time . The vector of viral kinetic parameters for index is noted and is the additive residual Gaussian error term of constant standard deviation . The vector of individual parameters depends on a fixed effects vector and on an individual random effects vector, which follows a normal centred distribution with a diagonal variance-covariance matrix . To ensure positivity, the individual parameters follow a lognormal distribution.
Probability of transmission
We noted the outcome of the contact of index case (i.e. if the contact resulted in transmission and 0 otherwise) and , with the number of contacts of index . The probability of transmission depends on the time of contact , the nature of contact, namely household or not , and the vector of individual parameters , which contains the viral parameters and individual transmission parameters . Three models of transmission were tested (M1-M3), described as follows:
Model M1
Request a detailed protocolNo effect of viral load.
where: with (resp. ) the effect of household contact (resp. non-household) on the probability of transmission, and is an individual random effect assumed to follow a Gaussian distribution of variance The baseline probability of transmission was fixed to 5% ().
Model M2
Request a detailed protocolLogit-linear effect of viral load.
where: with (resp. ) the effect of viral load on the probability of transmission in household contact (resp. non-household), and a Gaussian individual random effect with variance . The baseline probability of transmission was fixed to 5% () for viral load lower than 6 log10 copies per mL, which corresponds to the threshold for viral culture (Néant et al., 2021; Ke et al., 2020) (see Supplementary file 2 for additional scenarios with different threshold values).
Model M3
Request a detailed protocolLog-linear effect of viral load.
where: the effect of viral load on the probability of transmission in household contact (resp. non-household), and a Gaussian individual random effect with variance . The baseline probability of transmission was fixed to 5% () and the probability was bounded to 1.
Parameter estimation
Request a detailed protocolFor each model, we estimated simultaneously the vector of individual parameter , which depends on both the parameters of the viral kinetic model and the parameters of the transmission model . The model providing the lowest BIC was retained. All parameters were estimated by computing the maximum-likelihood estimator using the stochastic approximation expectation-maximization (SAEM) algorithm implemented in Monolix Software 2020R1 (http://www.lixoft.eu/) (Comets et al., 2017; Delyon et al., 1999; Monolix version 2020R1, 2019).
Simulations settings
View detailed protocolWe provided prediction intervals for viral load and transmission probability over time, depending on the nature of contact, namely household or not . We sampled individual from the estimated population distribution and we calculated the predicted viral load and the predicted transmission probability according to the type of contact for all individuals. We derived the mean transmission probability over the simulated individuals at all times, as well as the 90% inter quantile range to provide prediction intervals.
All simulations were performed using the Simulx package on R.3.6.0.
Calculating the average probability of transmission
Request a detailed protocolUsing our model, we also aimed to visualise the impact of a therapeutic intervention or a virus mutation on the probability of transmission. To this purpose, we defined several scenarios of simulation by modifying the corresponding parameters in the viral dynamic model. First, we increased the viral production parameter, , by a factor of 2 to 100 corresponding to observed increases of 1-7 value for different variants (Teyssou et al., 2021; Roquebert et al., 2021; Kidd et al., 2021). Second, we decreased the production parameters by a factor of 2, 4, 8, and 16 as well (Liu et al., 2021) to emulate the impact of vaccination (Levine-Tiefenbrun et al., 2021; McEllistrem et al., 2021; Figure 4—figure supplement 1).
We used as a metrics of the effect of variants the average probability of transmission during the contact period, defined as
where is the probability of infection after a high-risk contact occurring at time given the parameters of individual . We considered two possible distributions of contacts , (i) a constant function during the first five days following infection, followed by a decreasing function afterwards, reflecting the time-decreasing likelihood of contacts due to detection and/or symptom onset; (ii) a constant function during the first 20 days following infection (e.g. uniform distribution of the contact).
Generation interval
Request a detailed protocolAs a means to validate the model predictions, we also calculated the generation interval, defined as the time between the infection of the index and the infection of the contact. Given the difficulty to account for random effects, the generation time was calculated by simulations as follows.
We first sampled a vector of individual parameter in the simulated population distribution. We then sampled a time of contact in the contact distribution. Finally, the contact outcome (i.e. infection or not) was obtained by drawing in the binomial distribution of parameter . We repeated these steps 500,000 times to obtain the distribution of the generation time.
Data availability
All data used in this study have been included in the supporting files. The dataset can be found in Marks et al, The Lancet, 2021.
References
-
Kinetics of influenza A virus infection in humansJournal of Virology 80:7590–7599.https://doi.org/10.1128/JVI.01623-05
-
A randomized trial of hydroxychloroquine as postexposure prophylaxis for Covid-19New England Journal of Medicine 383:517–525.https://doi.org/10.1056/NEJMoa2016638
-
Parameter estimation in nonlinear mixed effect models using saemix, an R implementation of the SAEM algorithmJournal of Statistical Software 80:1–41.https://doi.org/10.18637/jss.v080.i03
-
SARS-CoV-2 viral dynamics in infections with alpha and beta variants of concern in the french communityThe Journal of Infection S0163-4453:00374-1.https://doi.org/10.1016/j.jinf.2021.07.031
-
Convergence of a stochastic approximation version of the EM algorithmThe Annals of Statistics 27:94–128.https://doi.org/10.1214/aos/1018031103
-
Timing of antiviral treatment initiation is critical to reduce SARS-CoV-2 viral loadCPT: Pharmacometrics & Systems Pharmacology 9:509–514.https://doi.org/10.1002/psp4.12543
-
SARS-CoV-2 viral dynamics in non-human primatesPLOS Computational Biology 17:e1008785.https://doi.org/10.1371/journal.pcbi.1008785
-
S-variant SARS-CoV-2 lineage B1.1.7 is associated with significantly higher viral loads in samples tested by ThermoFisher TaqPath RT-qPCRThe Journal of Infectious Diseases 223:1666–1670.https://doi.org/10.1093/infdis/jiab082
-
Transmission of COVID-19 in 282 clusters in Catalonia, Spain: a cohort studyThe Lancet Infectious Diseases 21:629–636.https://doi.org/10.1016/S1473-3099(20)30985-3
-
Single dose of a mRNA SARS-CoV-2 vaccine is associated with lower nasopharyngeal viral load among nursing home residents with asymptomatic COVID-19Clinical Infectious Diseases 73:ciab263.
-
A Cluster-Randomized trial of hydroxychloroquine for prevention of Covid-19New England Journal of Medicine 384:417–427.https://doi.org/10.1056/NEJMoa2021801
-
Aerosol transmission of SARS-CoV-2? Evidence, prevention and controlEnvironment International 144:106039.https://doi.org/10.1016/j.envint.2020.106039
-
Prevention and attenuation of Covid-19 with the BNT162b2 and mRNA-1273 vaccinesNew England Journal of Medicine 385:320–329.https://doi.org/10.1056/NEJMoa2107058
Decision letter
-
Sarah E CobeyReviewing Editor; University of Chicago, United States
-
Jos W Van der MeerSenior Editor; Radboud University Medical Centre, Netherlands
In the interests of transparency, eLife publishes the most substantive revision requests and the accompanying author responses.
Acceptance summary:
This study carefully evaluates the relationship between viral load and infectiousness by coupling data on viral load with information from epidemiological contact tracing. The quantification of household and non-household transmission as a function of viral load is an important advance in SARS-CoV-2 epidemiology with implications for other respiratory pathogens.
Decision letter after peer review:
Thank you for submitting your article "Quantifying the relationship between SARS-CoV-2 viral load and infectiousness" for consideration by eLife. Your article has been reviewed by 2 peer reviewers, and the evaluation has been overseen by a Reviewing Editor and Jos van der Meer as the Senior Editor. The reviewers have opted to remain anonymous.
The reviewers have discussed their reviews with one another, and the Reviewing Editor has drafted this to help you prepare a revised submission.
Essential revisions:
The reviewers and the editors find these results interesting and a potentially valuable contribution, assuming they can be shown to be robust to several modeling assumptions and limitations of the data, and these caveats more directly conveyed in the text. The following major suggestions emerged from the reviews and consultation session:
1. Data on contacts and viral loads are particularly weak during the time during which most transmission takes place, i.e., during the presymptomatic and early symptomatic period. How do the results change with other methods of extrapolating peak viral load, including allowing variation in the incubation period? Are the results impacted if participants are assumed to report contacts most faithfully around the day of symptom onset?
2. Mask use was recorded and surely affects the "effective" viral load for infectiousness. Does accounting for it change the results?
3. Reviewer 2 highlighted ambiguity about the importance of variation in infectiousness between individuals v. over time. Do the data support real differences between people (after accounting for mask use and contacts)?
4. Both reviewers also expressed skepticism about the strength of evidence underlying VOC viral loads.
I'd like to clarify that the main suggestion here is for a more careful analysis. If the results change (assuming key parameters remain identifiable), this paper can still make a useful contribution.
Please see the two reviews for more detailed suggestions.
Reviewer #1:
The study of Marc et al., evaluated the relationship between viral load and infectiousness using a set of data containing both viral load and epidemiological contact tracing information collected from infected individuals during the first wave of SARS-CoV-2 outbreak in Spain (i.e. March-April, 2020). A subset of individuals where both longitudinal viral load measurements and high-risk of contacts were reported. The authors first fit a viral dynamic model, i.e. a type of model describing viral infection process in infected individuals, to longitudinal viral load data. This model gives predictions of viral load trajectories over time including the viral load at the time of the high-risk contacts. Then regression models were used to assess how the probability of transmission changes with viral loads. The authors found that the risk of transmission differs between house-hold contacts and non-house hold contacts; and for both types of contacts, the risk increases with increases in Log viral load. The authors also use the model to evaluate the transmissibility of the variant B117 assuming B117 causes a 2-4 fold higher viral load.
This is an interesting and novel study that addresses an important question: how viral load is related to transmission. An accurate understanding of this question will help to understand how the transmission patterns at the epidemiological level are driven by viral progression at the individual level and to predict impacts of interventions that reduce viral loads on transmission.
There are several limitations in the datasets and model predictions (as the authors have already rightly pointed out). Some of these limitations may potentially impact the conclusion. Rigorous robustness analyses need to be performed to test whether the conclusions are sensitive to the assumptions in the model or limitations in the datasets.
First, limitation in the contact tracing data. Supplementary Figure 2 shows that a high level of contacts occurred at the time of symptom onset. This is a strong signal of certain biases in the survey data. Usually, one would expect that either contacts are roughly uniformly distributed (in the case of mildly symptomatic cases) or the number of contacts is higher before symptom onset and lower after symptom onset (for severely symptomatic cases). The data shown in supplementary Figure 2 clearly do not follow any of these patterns, i.e. it shows that the number of contacts suddenly become high on the day of symptom onset and decreased afterwards. One potential explanation of this observation is that when people start to have symptoms, they are more aware of the contacts they made on the day of symptom onset and a few days before and afterwards. This could influence the results in the study.
Second, limitation in the predicted viral loads at the time of high-risk contacts. It seems that there are 3 viral load measurements per infected individual in general, and these measurements were made approximately 4 days post symptom onset. In contrast, the transmission events and contacts were mostly occurred before or at symptom onset, i.e. several days before the first viral load data is available. Therefore, the viral load at the time of contacts were back extrapolated from data. Statistically speaking, back extrapolation using 3 data points would work well if the underlying function is a straight line; however, viral load kinetics seem to be more complicated. It is not clear to me whether this back extrapolation is accurate. Furthermore, as the authors pointed out, the model assumes a fixed incubation period of 5 days. However, the incubation period ranges widely between 1-14 days as most frequently quoted. All these uncertainties need to be formally addressed (by testing different scenarios) before we can be sure that the predicted viral loads at the time of contacts are accurate and thus the inferred relationship are reliable.
Third, limitation in understanding of the viral load time course of the B117 strain. The authors' analysis assumes that the strain has a 2-4 fold higher viral load than WT (or non-B117) strain. I am not very convinced by these assumptions. How the viral load trajectories of B117 differ from other strains are not well established due to lack of longitudinal data. These estimates seem to be made mostly based on cross sectional studies, where the viral loads measured in cross sectional studies can be influenced by many factors (for example, the stage of the epidemic) in addition to true differences in viral load trajectories. In addition, transmission potential is influenced by multiple factors (in addition to viral load), such as the resulting severity of infection, the ability to initiate an infection etc. Therefore, I think the predictions concerning the transmission potential of this strain is premature.
To address the first limitation, this potential bias in the contact tracing data shall be accounted before the data is used to calculate how the risk of transmission is related to viral load, unless the authors provide a convincing explanation/argument for the observed pattern.
To address the second limitation, one suggestion I have is to run a simulation study to test accuracy of the predicted viral load at symptom onset (when the assumptions in the model are relaxed). For example, in the simulations, incubation period ranges between 1-14 days, and synthetic data are collected after day 4 post symptom onset (with certain measurement noise). One can fit the model to the synthetic data assuming a 5-day incubation period and test how accurate the inferred viral load at the time of the contacts compared to the viral load in the simulations that generated the data.
Reviewer #2:
Using data from a cluster-randomised trial of the use of hydroxychloroquine as prophylaxis in the prevention of SARS-CoV-2 infection among exposed close contacts [Mitja et al., NEJM 2021] and continuing their investigation on factors affecting transmissibility including viral shedding (load) of the index cases [Marks et al., Lancet Inf Dis 2021], in this manuscript, Marc et al. attempted to define the quantitative relationship between viral shedding of the index cases and the transmission probability to close contacts using joint models. It was done by first modelling the viral kinetics of the index using a within-host (target cell-limited) model, and then using probabilistic models with data on observed viral load and secondary transmission events to estimate the parameters of viral dynamics and transmission probability. Their results suggested (1) higher viral load was associated with higher transmission probability (but was not a linear relationship); (2) the effect of viral load on transmission probability was more prominent in households than other settings such as healthcare settings or nursing homes, with as much as 37% when viral load was >10 log10 copies/mL; (3) transmission probability peaked at symptom onset of the index; and (4) based on viral shedding data of different variants, one may estimate the transmission probability of emerging variants such as B1.1.7. The authors suggested/ concluded that such analytic approach could help inform the effects of virus evolution or vaccination on transmission probability.
Authors state in their introduction that "…the role of the viral load as a driver of infectiousness has been suspected but not formally established". However, this statement is incorrect as the link between viral load and infectiousness has been known for more than a year for example as reported by He et al., (Nat Med 2020), among others. Authors reproduced this observation and therefore this work does not appear to make a substantial contribution to knowledge. On the other hand, this manuscript is well-written, using a unique dataset, earlier publications provided detailed description of the data used, the analytical approach used in this manuscript was clearly described with data used made available allowing reproducibility, and limitations adequately acknowledged. Unfortunately, the limitations described below, some of which also acknowledged by the authors, would suggest that the reliability of the identified quantitative relationship between viral load and transmission probability in this manuscript is unclear.
The manuscript seems has confused over two separate issues. First, viral loads in the respiratory tract are known to peak at around the time of symptom onset and then decline, consistent with the overall trajectory in contagiousness. Second, there is variability in viral loads between individuals, for example suggested by Chen et al., (eLife 2021, https://elifesciences.org/articles/65774), but it is not clear whether the individuals with higher viral loads are more contagious. Authors do seem to allow for person-to-person variability in their analysis, but it is not clear to this reviewer whether the person-to-person variability is necessary to explain contagiousness. What I believe authors should have done is fitted a model with temporal variability in shedding, and compared to this a model with temporal and person-to-person variability, to determine whether the person-to-person variability is correlated with transmission. In other words, do people with higher peak viral load (or longer duration in shedding) have higher contagiousness?
Measuring virus in respiratory swabs only and use it as a proxy of viral shedding/ infectiousness of the host as a whole is also unlikely to tell the full story. Prior research such as those by Milton et al., (PNAS 2018) and Leung et al., (Nat Med 2020) have shown, depending on the respiratory virus studied, there is a possibility of relatively weak correlation between viral loads in respiratory swabs versus in exhaled aerosols. Depending on the relative importance of different modes of transmission, the different viral shedding at different 'sites' may have implications on the relationship between viral shedding and host's contagiousness.
Therefore, although authors noted on page 8 that "several other factors are involved in transmission, besides viral load", I would posit one factor would be individual variation in viral load that does not seem to have been taken into account, and a second factor would be the difference between viral load in exhaled breath versus viral load in respiratory swab. Both of these factors would actually count as "viral load" factors, rather than "factors … besides viral load".
In addition, although in Marks et al., (Lancet Inf Dis 2021) the use of facemasks by contacts was not identified as a significant factor associated with transmission, the effect of the use of facemasks by index was not assessed despite the data was collected as described in the study protocol from Mitja et al., (NEJM 2021). This is likely an important factor on "effective" viral shedding of the index [Leung et al., Nat Med 2020] which was not accounted for in the present analyses, and based on the data that around 60% of contacts reported routine use of masks [Mitja et al., NEJM 2021], it was likely that a substantial proportion of index would have worn masks too.
Authors go on to extrapolate to VOCs, and note "In the context of variants of concern, that are likely associated with larger viral loads, it becomes even more critical to delineate the contribution of viral shedding from other suspected factors associated with an increased transmission.", although the relationship between different strains and respiratory swab viral load is still unclear, and no available data so far on viral load in exhaled aerosols for different virus strains.
Additional limitations included (1) the unknown timing of the effective contact between the index and exposed contact leading to transmission, due to the unrecognised risk of pre-symptomatic transmission at the time the study was conducted so that most (household) contacts were reported to have happened on the day of symptom onset, and the inability to single-out the contact episode among several repeated contact episodes that actually led to transmission; and (2) the difficult in identifying the viral load during the presymptomatic phase of the index due to lack of data. Overall, I agree with the authors that to identify the quantitative relationship between viral shedding and transmissibility probability for SARS-CoV-2 in the present study (or any future studies) is challenging due to the difficulty in collecting viral shedding data during the presymptomatic transmission phase of SARS-CoV-2.
[Editors' note: further revisions were suggested prior to acceptance, as described below.]
Thank you for submitting your article "Quantifying the relationship between SARS-CoV-2 viral load and infectiousness" for consideration by eLife. Your article has been reviewed by 2 peer reviewers, and the evaluation has been overseen by a Reviewing Editor and Jos Van der Meer as the Senior Editor. The reviewers have opted to remain anonymous.
The reviewers have discussed their reviews with one another, and the Reviewing Editor has drafted this to help you prepare a revised submission.
Essential revisions:
This study evaluates the relationship between viral load and infectiousness and is of potential interest to infectious disease modelers and policy makers. The work reaches similar conclusions to other recent studies, although significant uncertainties remain.
The revisions have greatly improved the manuscript, and the reviewers and I ask only that small changes be made for clarity, to help future readers.
1) As suggested by reviewer 2, please mention the lack of information on face mask usage in index cases and the impact this might have on the results.
2) As suggested by reviewer 1 (point 2), please reconsider whether the data have sufficient power to demonstrate saturation and revise accordingly.
3) Please also consider the conflicting evidence on B.1.1.7 viral loads (reviewer 1, point 3).
Reviewer #1:
I would like to thank the authors for their efforts to address my comments and concerns. The additional analyses are sufficient and rigorous enough. I still have some concerns with respect to how the results of the study is interpreted and discussed. I would like to recommend publication if these points below are sufficiently addressed.
1. In the revised model fitting, the authors assumed a log-normal distribution for the incubation period (instead of a fixed number). This is a MUCH MORE realistic assumption. However, I still think there are large uncertainties in predicting the viral load at the time of transmission event, especially given that only 3 data points taken on days after transmission events are available. For example, in Figure 1, it seems that the model predicts that the peak viral load occurs in most individuals and the peak viral load is on a back extrapolation of a line from the three data points. It is well known viral load data are very noisy. This extrapolation is unlikely to be very accurate. Although this limitation is partially discussed in lines 241 and 243, I feel this is the uncertainties in predicting pre-peak and peak viral load (where transmission events occurred) that shall be discussed more thoroughly.
2. In line 192-193, it is stated: 'Unlike what has been suggested by theoretical models, the probability of transmission increased continuously with viral load and no saturation effects were visible at high viral loads.' I do not find strong evidence in the manuscript to rule out the possibility that transmission saturates with high viral loads. The saturation effect was not formally tested, because none of the 3 models in the manuscript include the saturation effect. The similar BIC values in Table 1 seem to suggest that this dataset may not be sufficient to test whether a saturation effect exists.
3. For the assumption of increased peak viral load for B.1.1.7, I agree with the authors several cross-sectional studies indicate this VOC had high viral loads. However, as I mentioned in my original review, these studies (including the Jones et al., Science study) are mostly from clinical studies where individuals are enrolled days after symptom onset. The type of dataset is not well reliable in predicting peak viral loads of an infection (related to point 1). On the contrary, a recent longitudinal study shows that there is no difference in peak viral loads (most relevant for transmission) between the wild-type and the B.1.1.7 strain (Ke et al., medRxiv; DOI: 10.1101/2021.07.12.21260208). Infectiousness inferred from cell culture data suggests no difference between the wild-type and B.1.1.7 either. Therefore, I do not think there exists a consensus as why B.1.1.7 is more transmissible -factors other than viral load may be important. Having said that, I agree with the authors that the analysis is very useful for VOCs in general, given that some VOCs may have a high viral load as a transmission advantage. Therefore, I feel that the analysis is very valuable, but the conflict findings of B.1.1.7 viral loads shall be fully acknowledged. Currently, the manuscript seems to indicate that it is certain that B.1.1.7 gains transmission advantage through higher viral loads.
4. One complication in the prediction of increased transmissibility of VOCs is that the overall transmission is influenced by both infectiousness (arising from viral loads) and pattern of contacts. The analysis in the manuscript implicitly assumes the contact patterns are the same across these different groups whereas in reality this may not be true. For example, some VOCs may cause more severe infections whereas vaccinated individuals will have milder infections and thus less changes in the number of contacts. The assumption is ok (without data on contact patterns); but it is better to state this assumption clearly in the abstract and the discussed in the Discussion, so that the uncertainties/assumptions are transparent to the general readers.
5. Typo: 'different' is repeated in the first sentence in the caption of Figure 4.
https://doi.org/10.7554/eLife.69302.sa1Author response
Essential revisions:
1. Data on contacts and viral loads are particularly weak during the time during which most transmission takes place, i.e., during the presymptomatic and early symptomatic period. How do the results change with other methods of extrapolating peak viral load, including allowing variation in the incubation period? Are the results impacted if participants are assumed to report contacts most faithfully around the day of symptom onset?
Thank you for this comment. It is correct that we do not have viral load data during the presymptomatic phase where most contacts occurred, as pointed out in Figure 1 —figure supplement 2.
Per your comment, we have relaxed our assumption of a fixed and similar incubation duration. We now use in all our models a lognormal distribution with a mean value of 5 days and a standard deviation of 0.125 days, representing the fact that 90% of the incubation times are between 4 and 6 days1,2. Additionally, we have extended in the supplementary materials our sensitivity analyses by assuming a fixed incubation period and tested values ranging from 4 days to 7 days. All models yielded similar results, showing a significant effect of the viral load on the transmission for both non-household and household contacts (Supplementary File 1).
We have modified the description of the model accordingly in the methods and updated all our results in the revised version of the manuscript.
2. Mask use was recorded and surely affects the "effective" viral load for infectiousness. Does accounting for it change the results?
Unfortunately, the study did not contain detailed information on the mask use by the index cases. As reported in Marks et al.3 the information collected was the routine use of face mask by contacts when in close proximity to the index case, and this was not found associated with transmission3. This may be due to several reasons, including the poor reporting of this information, that was missing for 35% of contacts (Supplementary Table 3 and more discussion in Marks et al.,).
Given these limitations, we have decided not to include mask use in our model but we now clearly add this as a limitation in the discussion:
“Beside viral load, several factors are associated with a transmission event. One important one is face masking, for both the index and the contact. In the original analysis of Marks et al.3, the use of face mask by contacts was not found associated with a decreased viral load, but this probably reflects the lack of more detailed data on the type of mask, the use of other personal protective equipment and infection control practices. It is also important to recall that face masking was poorly reported and was missing in about 35% of contacts, limiting statistical power (Supplementary file 4). Collecting this information in future studies should probably contribute to a reduction in the variance of the random effect parameter associated with transmission ().”
3. Reviewer 2 highlighted ambiguity about the importance of variation in infectiousness between individuals v. over time. Do the data support real differences between people (after accounting for mask use and contacts)?
It is important to realize that our model allows variability on both the viral dynamics and the individual risk of transmission after adjustment on viral load. This is accounted by the parameter in all 3 models of transmission tested. This allows, in other words, two index cases having similar viral load to have nonetheless different probability of transmission, that could be due to many individual or behavioral factors not represented in the model.
Per your comment, we have also tested a model without variability in transmission, and this yields to similar estimates of the viral load parameters but increased parameter linking viral load and infectiousness (Supplementary file 2). The effect of the viral load is still significant in both household and non-household contacts (wald test p-value <0.01) but the loglikelihood is increased by more than 10 points, leading to model rejection over a model with variability.
We clarified this aspect in the Results:
“The model considers two levels of individual variability, one on the viral load dynamics4 (as measured by the standard deviation of the associated random effects, and ), and another one on the probability of transmission (with a standard deviation ). Of note, was equal to 85%, indicating that several other factors are involved in the transmission probability, even after adjustment for viral load levels (see Supplementary file 3 for the results obtained with a model assuming a similar value for in all individuals).” 4. Both reviewers also expressed skepticism about the strength of evidence underlying VOC viral loads.
We respectfully disagree with the reviewer on that aspect. Data have accumulated on the effects of VOC on viral load. Most studies indeed rely on large cross sectional studies 5–8 but our group has also been involved in studies with longitudinal follow-up9,10 ; our results confirmed that B1.1.7 is associated with a higher viral load, with an estimate of a 2 to 4-fold higher viral load (corresponding to a difference of 1 to 2 Ct values compared to the historical variant). In the recent study from Christian Drosten group, an even higher estimate was found, with a 1 log10 higher viral load in individuals infected with B1.1.7 virus compared to the historical variant2,8,11. The estimates for the P1 and B1.1.351 are much less well established, with values ranging from a 2-fold8 to a 10-fold11 increase. We do not mention recent reports of a 1000-fold increase caused by δ virus, that have not been yet confirmed by other studies12.
Given the rapidly changing landscape of VOC and the uncertainty on the magnitude of current and future VOC, we provided predictions with a large range of scenarios, that could be relevant with other emerging VOC.
I'd like to clarify that the main suggestion here is for a more careful analysis. If the results change (assuming key parameters remain identifiable), this paper can still make a useful contribution.
Please see the two reviews for more detailed suggestions.
Reviewer #1:
[…]To address the first limitation, this potential bias in the contact tracing data shall be accounted before the data is used to calculate how the risk of transmission is related to viral load, unless the authors provide a convincing explanation/argument for the observed pattern.
We agree that contact tracing does not prevent from recollection biases, and this could explain the over representation of contacts at symptom onset shown in Figure 1 —figure supplement 2. As recollection bias equally affects contacts that have led to an infection from those that did not lead to an infection, this creates a mechanisms of data missingness called “missing at random”, which does not bias the parameter estimation for the relationship between viral load and transmission.
However, it is correct that a potential over-representation of the contacts at symptom onset in the original data set may create bias in the prediction of the effects of VOC on transmission, that depends on the assumption made for the distribution of contacts.
Following reviewer’s comments, we have redone all our simulations to consider two more realistic scenarios for the contact distribution: (i) a constant function during the first five days following infection, followed by a decreasing function afterwards, reflecting the time-decreasing likelihood of contacts due to detection and/or symptom onset. (ii) a constant function during the first 20 days following infection (eg, uniform distribution of the contact). Of note, scenario (i) reflects the fact that contacts are less likely to occur after 5 days, which corresponds to the typical duration of the incubation period. Given the absence of data on the relationship between symptom onset and contacts, the distribution of symptom onset and the distribution of contacts were considered as independent.
All results have been modified accordingly.
To address the second limitation, one suggestion I have is to run a simulation study to test accuracy of the predicted viral load at symptom onset (when the assumptions in the model are relaxed). For example, in the simulations, incubation period ranges between 1-14 days, and synthetic data are collected after day 4 post symptom onset (with certain measurement noise). One can fit the model to the synthetic data assuming a 5-day incubation period and test how accurate the inferred viral load at the time of the contacts compared to the viral load in the simulations that generated the data.
We thank you for this important comment. We have now relaxed the assumption of a fixed and similar incubation period and we now assume a log-normal distribution of the incubation period with a mean value of 5 days and a standard deviation for the random effect of 0.125 days, to ensure a 90% probability that the incubation time is between 4 and 6 days1,2. To ensure the consistency of our results, we also provided in the supplementary the results of models assuming a fixed incubation period ranging from 4 days to 7 days. All models yielded similar results, showing a significant effect of the viral load on the transmission for both non-household and household contacts (Supplementary file 1).
Third, limitation in understanding of the viral load time course of the B117 strain. The authors' analysis assumes that the strain has a 2-4-fold higher viral load than WT (or non-B117) strain. I am not very convinced by these assumptions. How the viral load trajectories of B117 differ from other strains are not well established due to lack of longitudinal data. These estimates seem to be made mostly based on cross sectional studies, where the viral loads measured in cross sectional studies can be influenced by many factors (for example, the stage of the epidemic) in addition to true differences in viral load trajectories. In addition, transmission potential is influenced by multiple factors (in addition to viral load), such as the resulting severity of infection, the ability to initiate an infection etc. Therefore, I think the predictions concerning the transmission potential of this strain is premature.
We respectfully disagree with the reviewer on that aspect. Data have accumulated on the effects of VOC on viral load. Most studies indeed rely on large cross sectional studies 5–8 but our group has also been involved in studies with longitudinal follow-up9,10 ; our results confirmed that B1.1.7 is associated with a higher viral load, with an estimate of a 2 to 4-fold higher viral load (corresponding to a difference of 1 to 2 Ct values compared to the historical variant). In the recent study from Christian Drosten group, an even higher estimate was found, with a 1 log10 higher viral load in individuals infected with B1.1.7 virus compared to the historical variant2,8,11. The estimates for the P1 and B1.1.351 are much less well established, with values ranging from a 2-fold8 to a 10-fold11 increase. We do not mention recent reports of a 1000-fold increase caused by delta virus, that have not been yet confirmed by other studies12.
Given the rapidly changing landscape of VOC and the uncertainty on the magnitude of current and future VOC, we provided predictions with a large range of scenarios, that could be relevant with other emerging VOC.
Reviewer #2:
[…]
Authors state in their introduction that "…the role of the viral load as a driver of infectiousness has been suspected but not formally established". However, this statement is incorrect as the link between viral load and infectiousness has been known for more than a year for example as reported by He et al., (Nat Med 2020), among others.
We have clarified our wording:
“While respiratory droplets and aerosols have been rapidly demonstrated to be a major route of transmission of SARS-CoV-21, the role of the viral load as a driver of infectiousness has been established but not formally quantified.”
Authors reproduced this observation and therefore this work does not appear to make a substantial contribution to knowledge. On the other hand, this manuscript is well-written, using a unique dataset, earlier publications provided detailed description of the data used, the analytical approach used in this manuscript was clearly described with data used made available allowing reproducibility, and limitations adequately acknowledged. Unfortunately, the limitations described below, some of which also acknowledged by the authors, would suggest that the reliability of the identified quantitative relationship between viral load and transmission probability in this manuscript is unclear.
The manuscript seems has confused over two separate issues. First, viral loads in the respiratory tract are known to peak at around the time of symptom onset and then decline, consistent with the overall trajectory in contagiousness. Second, there is variability in viral loads between individuals, for example suggested by Chen et al., (eLife 2021, https://elifesciences.org/articles/65774), but it is not clear whether the individuals with higher viral loads are more contagious. Authors do seem to allow for person-to-person variability in their analysis, but it is not clear to this reviewer whether the person-to-person variability is necessary to explain contagiousness. What I believe authors should have done is fitted a model with temporal variability in shedding, and compared to this a model with temporal and person-to-person variability, to determine whether the person-to-person variability is correlated with transmission. In other words, do people with higher peak viral load (or longer duration in shedding) have higher contagiousness?
Thank you for this relevant reference, which has been added.
It is important to realize that our model allows variability on both the viral dynamics and the individual risk of transmission after adjustment on viral load. This is accounted by the parameter βi in all 3 models of transmission tested. This allows, in other words, two index cases having similar viral load to have nonetheless different probability of transmission, that could be due to many individual or behavioral factors not represented in the model.
Per your comment, we have also tested a model without variability in transmission, and this yields to similar estimates of the viral load parameters but increased parameter linking viral load and infectiousness (Supplementary Table 2). The effect of the viral load is still significant in both household and non-household contacts (wald test p-value <0.01) but the loglikelihood is increased by more than 10 points, leading to model rejection over a model with variability.
We clarified this aspect in the Results:
“The model considers two levels of individual variability, one on the viral load dynamics4 (as measured by the standard deviation of the associated random effects, and ), and another one on the probability of transmission (with a standard deviation ). Of note, was equal to 85%, indicating that several other factors are involved in the transmission probability, even after adjustment for viral load levels (see Supplementary file 3 for the results obtained with a model assuming a similar value for in all individuals).”
References
1. Lauer, S. A., Grantz, K. H., Bi, Q., Jones, F. K., Zheng, Q., Meredith, H. R., Azman, A. S., Reich, N. G. and Lessler, J. The Incubation Period of Coronavirus Disease 2019 (COVID-19) From Publicly Reported Confirmed Cases: Estimation and Application. Ann Intern Med 172, 577–582 (2020).
2. Jones, T. C. et al., Estimating infectiousness throughout SARS-CoV-2 infection course. Science eabi5273 (2021) doi:10.1126/science.abi5273.
3. Marks, M., Millat-Martinez, P., Ouchi, D., Roberts, C. h, Alemany, A., Corbacho-Monné, M., Ubals, M., Tobias, A., Tebé, C., Ballana, E., Bassat, Q., Baro, B., Vall-Mayans, M., G-Beiras, C., Prat, N., Ara, J., Clotet, B. and Mitjà, O. Transmission of COVID-19 in 282 clusters in Catalonia, Spain: a cohort study. The Lancet Infectious Diseases 0, (2021).
4. Chen, P. Z., Bobrovitz, N., Premji, Z., Koopmans, M., Fisman, D. N. and Gu, F. X. Heterogeneity in transmissibility and shedding SARS-CoV-2 via droplets and aerosols. eLife 10, e65774 (2021).
5. Kidd, M., Richter, A., Best, A., Cumley, N., Mirza, J., Percival, B., Mayhew, M., Megram, O., Ashford, F., White, T., Moles-Garcia, E., Crawford, L., Bosworth, A., Atabani, S. F., Plant, T. and McNally, A. S-variant SARS-CoV-2 lineage B1.1.7 is associated with significantly higher viral loads in samples tested by ThermoFisher TaqPath RT-qPCR. The Journal of Infectious Diseases (2021) doi:10.1093/infdis/jiab082.
6. Calistri, P., Amato, L., Puglia, I., Cito, F., Di Giuseppe, A., Danzetta, M. L., Morelli, D., Di Domenico, M., Caporale, M., Scialabba, S., Portanti, O., Curini, V., Perletta, F., Cammà, C., Ancora, M., Savini, G., Migliorati, G., D’Alterio, N. and Lorusso, A. Infection sustained by lineage B.1.1.7 of SARS-CoV-2 is characterised by longer persistence and higher viral RNA loads in nasopharyngeal swabs. Int J Infect Dis 105, 753–755 (2021).
7. Roquebert, B., Haim-Boukobza, S., Trombert-Paolantoni, S., Lecorche, E., Verdurme, L., Foulongne, V., Burrel, S., Alizon, S. and Sofonea, M. T. SARS-CoV-2 variants of concern are associated with lower RT-PCR amplification cycles between January and March 2021 in France. medRxiv 2021.03.19.21253971 (2021) doi:10.1101/2021.03.19.21253971.
8. Teyssou, E. et al., The 501Y.V2 SARS-CoV-2 variant has an intermediate viral load between the 501Y.V1 and the historical variants in nasopharyngeal samples from newly diagnosed COVID-19 patients. Journal of Infection 0, (2021).
9. Elie, B., Lecorche, E., Sofonea, M. T., Trombert-Paolantoni, S., Foulongne, V., Guedj, J., Haim-Boukobza, S., Roquebert, B. and Alizon, S. Inferring SARS-CoV-2 variant within-host kinetics. medRxiv 2021.05.26.21257835 (2021) doi:10.1101/2021.05.26.21257835.
10. Cosentino, G., Bernard, M., Ambroise, J., Giannoli, J.-M., Guedj, J., Débarre, F. and Blanquart, F. SARS-CoV-2 viral dynamics in infections with variants of concern in the French community. (2021).
11. Naveca, F. G. et al., COVID-19 in Amazonas, Brazil, was driven by the persistence of endemic lineages and P.1 emergence. Nature Medicine 1–9 (2021) doi:10.1038/s41591-021-01378-7.
12. Viral infection and transmission in a large well-traced outbreak caused by the Delta SARS-CoV-2 variant - SARS-CoV-2 coronavirus / nCoV-2019 Genomic Epidemiology. Virological https://virological.org/t/viral-infection-and-transmission-in-a-large-well-traced-outbreak-caused-by-the-delta-sars-cov-2-variant/724 (2021).
13. Mollan, K. R. et al., Infectious SARS-CoV-2 Virus in Symptomatic COVID-19 Outpatients: Host, Disease, and Viral Correlates. medRxiv 2021.05.28.21258011 (2021) doi:10.1101/2021.05.28.21258011.
14. Néant, N. et al., Modeling SARS-CoV-2 viral kinetics and association with mortality in hospitalized patients from the French COVID cohort. PNAS 118, (2021).
15. van Kampen, J. J. A. et al., Duration and key determinants of infectious virus shedding in hospitalized patients with coronavirus disease-2019 (COVID-19). Nat Commun 12, 267 (2021).
[Editors' note: further revisions were suggested prior to acceptance, as described below.]
Essential revisions:
This study evaluates the relationship between viral load and infectiousness and is of potential interest to infectious disease modelers and policy makers. The work reaches similar conclusions to other recent studies, although significant uncertainties remain.
The revisions have greatly improved the manuscript, and the reviewers and I ask only that small changes be made for clarity, to help future readers.
1) As suggested by reviewer 2, please mention the lack of information on face mask usage in index cases and the impact this might have on the results.
We have added this information in the discussion:
“The use of face mask by index cases was not collected in the original study. This information might be of a greater importance as it has a far more substantial effect on viral shedding and thus on transmission.”
2) As suggested by reviewer 1 (point 2), please reconsider whether the data have sufficient power to demonstrate saturation and revise accordingly.
We have removed this sentence from the discussion.
3) Please also consider the conflicting evidence on B.1.1.7 viral loads (reviewer 1, point 3).
We have acknowledged the limitation due to observational studies:
“We relied on results found in both large-scale epidemiological data and longitudinal evaluation of Ct values 1,2, that reported an average increase of the B1.1.7 virus by 1-2 Ct3–5, which can be reproduced in our model by assuming that viral production increases by a factor 2-4. […] As raised by one of the reviewers, it is important to recognize that the association between VOC and viral load levels relies on observational studies, with data mostly collected after symptom onset, both factors limiting a formal causation. In fact, another modelling study performed in a small population of frequently sampled individuals diagnosed early in their infection did not find an effect of B1.1.7 on viral kinetics6”
Reviewer #1:
I would like to thank the authors for their efforts to address my comments and concerns. The additional analyses are sufficient and rigorous enough. I still have some concerns with respect to how the results of the study is interpreted and discussed. I would like to recommend publication if these points below are sufficiently addressed.
1. In the revised model fitting, the authors assumed a log-normal distribution for the incubation period (instead of a fixed number). This is a MUCH MORE realistic assumption. However, I still think there are large uncertainties in predicting the viral load at the time of transmission event, especially given that only 3 data points taken on days after transmission events are available. For example, in Figure 1, it seems that the model predicts that the peak viral load occurs in most individuals and the peak viral load is on a back extrapolation of a line from the three data points. It is well known viral load data are very noisy. This extrapolation is unlikely to be very accurate. Although this limitation is partially discussed in lines 241 and 243, I feel this is the uncertainties in predicting pre-peak and peak viral load (where transmission events occurred) that shall be discussed more thoroughly.
We have acknowledged this limitation in the discussion as follows:
“It is also important to note that viral load data in index cases were collected on average 3-4 days after symptom onset, in the declining phase of viral load, several days after most of the contacts had occurred. Although our population parameters were estimated with a reasonable precision (Table 1) it nonetheless brings uncertainty on the predictions of individual trajectories. This limitation is inherent to the nature of SARS-CoV-2, where the peak viral load coincides with symptom onset, making difficult to obtain data during the replicating phase of the virus where individuals are largely asymptomatic.”
2. In line 192-193, it is stated: 'Unlike what has been suggested by theoretical models, the probability of transmission increased continuously with viral load and no saturation effects were visible at high viral loads.' I do not find strong evidence in the manuscript to rule out the possibility that transmission saturates with high viral loads. The saturation effect was not formally tested, because none of the 3 models in the manuscript include the saturation effect. The similar BIC values in Table 1 seem to suggest that this dataset may not be sufficient to test whether a saturation effect exists.
We have removed this part from the discussion.
3. For the assumption of increased peak viral load for B.1.1.7, I agree with the authors several cross-sectional studies indicate this VOC had high viral loads. However, as I mentioned in my original review, these studies (including the Jones et al., Science study) are mostly from clinical studies where individuals are enrolled days after symptom onset. The type of dataset is not well reliable in predicting peak viral loads of an infection (related to point 1). On the contrary, a recent longitudinal study shows that there is no difference in peak viral loads (most relevant for transmission) between the wild-type and the B.1.1.7 strain (Ke et al., medRxiv; DOI: 10.1101/2021.07.12.21260208). Infectiousness inferred from cell culture data suggests no difference between the wild-type and B.1.1.7 either. Therefore, I do not think there exists a consensus as why B.1.1.7 is more transmissible -factors other than viral load may be important. Having said that, I agree with the authors that the analysis is very useful for VOCs in general, given that some VOCs may have a high viral load as a transmission advantage. Therefore, I feel that the analysis is very valuable, but the conflict findings of B.1.1.7 viral loads shall be fully acknowledged. Currently, the manuscript seems to indicate that it is certain that B.1.1.7 gains transmission advantage through higher viral loads.
We have taken into account the point made by reviewer 1 in the discussion:
“We relied on results found in both large-scale epidemiological data and longitudinal evaluation of Ct values 1,2, that reported an average increase of the B1.1.7 virus by 1-2 Ct3–5, which can be reproduced in our model by assuming that viral production increases by a factor 2-4. […] As raised by one of the reviewers, it is important to recognize that the association between VOC and viral load levels relies on observational studies, with data mostly collected after symptom onset, both factors limiting a formal causation. In fact, another modelling study performed in a small population of frequently sampled individuals diagnosed early in their infection did not find an effect of B1.1.7 on viral kinetics6”
4. One complication in the prediction of increased transmissibility of VOCs is that the overall transmission is influenced by both infectiousness (arising from viral loads) and pattern of contacts. The analysis in the manuscript implicitly assumes the contact patterns are the same across these different groups whereas in reality this may not be true. For example, some VOCs may cause more severe infections whereas vaccinated individuals will have milder infections and thus less changes in the number of contacts. The assumption is ok (without data on contact patterns); but it is better to state this assumption clearly in the abstract and the discussed in the Discussion, so that the uncertainties/assumptions are transparent to the general readers.
Reviewer 1 is absolutely right, we assumed the contact pattern to be the same across all VOC, which may not be true. This has been acknowledged in the abstract and in the discussion:
Abstract: “Based on the current knowledge that viral load is increased by 2 to 8-fold with variants of concern and assuming no changes in the pattern of contacts across variants, the model predicts that larger viral load levels could lead to a relative increase in the probability of transmission of 24 to 58% in household contacts, and of 15 to 39% in non-household contacts.”
Discussion: “Also, we assumed the same patterns of contacts in our different scenarios. Although there are no data on these aspects yet, it is possible that larger levels of viral shedding could lead to a more severe infection or, inversely, that lower viral load could produce milder infections, thereby modifying the incubation period and more generally the patterns of contact.”
5. Typo: 'different' is repeated in the first sentence in the caption of Figure 4.
This has been corrected.
References
1. Elie, B., Lecorche, E., Sofonea, M. T., Trombert-Paolantoni, S., Foulongne, V., Guedj, J., Haim-Boukobza, S., Roquebert, B. and Alizon, S. Inferring SARS-CoV-2 variant within-host kinetics. medRxiv 2021.05.26.21257835 (2021) doi:10.1101/2021.05.26.21257835.
2. Cosentino, G., Bernard, M., Ambroise, J., Giannoli, J.-M., Guedj, J., Débarre, F. and Blanquart, F. SARS-CoV-2 viral dynamics in infections with variants of concern in the French community. (2021).
3. Teyssou, E. et al., The 501Y.V2 SARS-CoV-2 variant has an intermediate viral load between the 501Y.V1 and the historical variants in nasopharyngeal samples from newly diagnosed COVID-19 patients. Journal of Infection 0, (2021).
4. Early analysis of a potential link between viral load and the N501Y mutation in the SARS-COV-2 spike protein | medRxiv. https://www.medrxiv.org/content/10.1101/2021.01.12.20249080v1.
5. Roquebert, B., Haim-Boukobza, S., Trombert-Paolantoni, S., Lecorche, E., Verdurme, L., Foulongne, V., Burrel, S., Alizon, S. and Sofonea, M. T. SARS-CoV-2 variants of concern are associated with lower RT-PCR amplification cycles between January and March 2021 in France. medRxiv 2021.03.19.21253971 (2021) doi:10.1101/2021.03.19.21253971.
6. Daily sampling of early SARS-CoV-2 infection reveals substantial heterogeneity in infectiousness | medRxiv. https://www.medrxiv.org/content/10.1101/2021.07.12.21260208v1.
https://doi.org/10.7554/eLife.69302.sa2Article and author information
Author details
Funding
Bill and Melinda Gates Foundation (INV-017335)
- Jeremie Guedj
French National Research Agency (ANR-20-COVI-0018)
- Jeremie Guedj
European Research Council (ERC Starting Grant under the European Union's Horizon 2020 research and innovation programme)
- Oriol Mitjà
YoMeCorono (Crowdfunding campaign)
- Oriol Mitjà
Generalitat de Catalunya
- Oriol Mitjà
The funders had no role in study design, data collection and interpretation, or the decision to submit the work for publication.
Acknowledgements
The study has received financial support from the National Research Agency (ANR) through the ANR-Flash call for COVID-19 (Grant ANR-20-COVI-0018) and the Bill and Melinda Gates Foundation under Grant Agreement INV-017335. The original trial was funded by a crowdfunding campaign YoMeCorono (https://www.yomecorono.com/), and Generalitat de Catalunya with support for laboratory equipment from Foundation Dormeur. The sponsors had no role in the conduct of the trial, the analysis, or the decision to submit the manuscript for publication. The trial protocol and subsequent amendments were approved by the institutional review board at Hospital Germans Trias i Pujol and the Spanish Agency of Medicines and Medical Devices. All the participants provided written informed consent. (https://www.nejm.org/doi/10.1056/NEJMoa2021801).We thank Samuel Alizon, Xavier Duval and Xavier de Lamballerie for helpful discussions.
Ethics
Clinical trial registration NCT04304053.
Human subjects: The trial was supported by the crowd funding campaign YoMeCorono (https://www.yomecorono. com/), Generalitat de Catalunya, Zurich Seguros, Synlab Diagnósticos, Laboratorios Rubió, and Laboratorios Gebro Pharma. Laboratorios Rubiódonated and supplied the hydroxychloroquine (Dolquine). The sponsors had no role in the conduct of the trial, the analysis, or the decision to submit the manuscript for publication. The trial protocol and subsequent amendments were approved by the institutional review board at Hospital Germans Trias i Pujol and the Spanish Agency of Medicines and Medical Devices. All the participants provided written informed consent. (https://www.nejm.org/doi/10.1056/NEJMoa2021801).
Senior Editor
- Jos W Van der Meer, Radboud University Medical Centre, Netherlands
Reviewing Editor
- Sarah E Cobey, University of Chicago, United States
Version history
- Received: April 11, 2021
- Preprint posted: May 8, 2021 (view preprint)
- Accepted: September 1, 2021
- Version of Record published: September 27, 2021 (version 1)
- Version of Record updated: November 17, 2021 (version 2)
Copyright
© 2021, Marc et al.
This article is distributed under the terms of the Creative Commons Attribution License, which permits unrestricted use and redistribution provided that the original author and source are credited.
Metrics
-
- 9,436
- Page views
-
- 529
- Downloads
-
- 60
- Citations
Article citation count generated by polling the highest count across the following sources: Crossref, Scopus, PubMed Central.
Download links
Downloads (link to download the article as PDF)
Open citations (links to open the citations from this article in various online reference manager services)
Cite this article (links to download the citations from this article in formats compatible with various reference manager tools)
Further reading
-
- Biochemistry and Chemical Biology
- Microbiology and Infectious Disease
Diverse chemical modifications fine-tune the function and metabolism of tRNA. Although tRNA modification is universal in all kingdoms of life, profiles of modifications, their functions, and physiological roles have not been elucidated in most organisms including the human pathogen, Mycobacterium tuberculosis (Mtb), the causative agent of tuberculosis. To identify physiologically important modifications, we surveyed the tRNA of Mtb, using tRNA sequencing (tRNA-seq) and genome-mining. Homology searches identified 23 candidate tRNA modifying enzymes that are predicted to create 16 tRNA modifications across all tRNA species. Reverse transcription-derived error signatures in tRNA-seq predicted the sites and presence of nine modifications. Several chemical treatments prior to tRNA-seq expanded the number of predictable modifications. Deletion of Mtb genes encoding two modifying enzymes, TruB and MnmA, eliminated their respective tRNA modifications, validating the presence of modified sites in tRNA species. Furthermore, the absence of mnmA attenuated Mtb growth in macrophages, suggesting that MnmA-dependent tRNA uridine sulfation contributes to Mtb intracellular growth. Our results lay the foundation for unveiling the roles of tRNA modifications in Mtb pathogenesis and developing new therapeutics against tuberculosis.
-
- Cell Biology
- Microbiology and Infectious Disease
Communication is crucial for organismic interactions, from bacteria, to fungi, to humans. Humans may use the visual sense to monitor the environment before starting acoustic interactions. In comparison, fungi, lacking a visual system, rely on a cell-to-cell dialogue based on secreted signaling molecules to coordinate cell fusion and establish hyphal networks. Within this dialogue, hyphae alternate between sending and receiving signals. This pattern can be visualized via the putative signaling protein Soft (SofT), and the mitogen-activated protein kinase MAK-2 (MakB) which are recruited in an alternating oscillatory manner to the respective cytoplasmic membrane or nuclei of interacting hyphae. Here, we show that signal oscillations already occur in single hyphae of Arthrobotrys flagrans in the absence of potential fusion partners (cell monologue). They were in the same phase as growth oscillations. In contrast to the anti-phasic oscillations observed during the cell dialogue, SofT and MakB displayed synchronized oscillations in phase during the monologue. Once two fusion partners came into each other’s vicinity, their oscillation frequencies slowed down (entrainment phase) and transit into anti-phasic synchronization of the two cells’ oscillations with frequencies of 104±28 s and 117±19 s, respectively. Single-cell oscillations, transient entrainment, and anti-phasic oscillations were reproduced by a mathematical model where nearby hyphae can absorb and secrete a limited molecular signaling component into a shared extracellular space. We show that intracellular Ca2+ concentrations oscillate in two approaching hyphae, and depletion of Ca2+ from the medium affected vesicle-driven extension of the hyphal tip, abolished the cell monologue and the anti-phasic synchronization of two hyphae. Our results suggest that single hyphae engage in a ‘monologue’ that may be used for exploration of the environment and can dynamically shift their extracellular signaling systems into a ‘dialogue’ to initiate hyphal fusion.