Sleep-dependent upscaled excitability, saturated neuroplasticity, and modulated cognition in the human brain
- Department of Psychology and Neurosciences, Leibniz Research Centre for Working Environment and Human Factors, Germany
- International Graduate School of Neuroscience, Ruhr-University Bochum, Germany
- Department of Neuropsychology, Institute of Cognitive Neuroscience, Faculty of Psychology, Ruhr University Bochum, Germany
- Department of Toxicology, Leibniz Research Centre for Working Environment and Human Factors, Germany
- Department of Neurology, University Medical Hospital Bergmannsheil, Germany
Figures
Figure 1
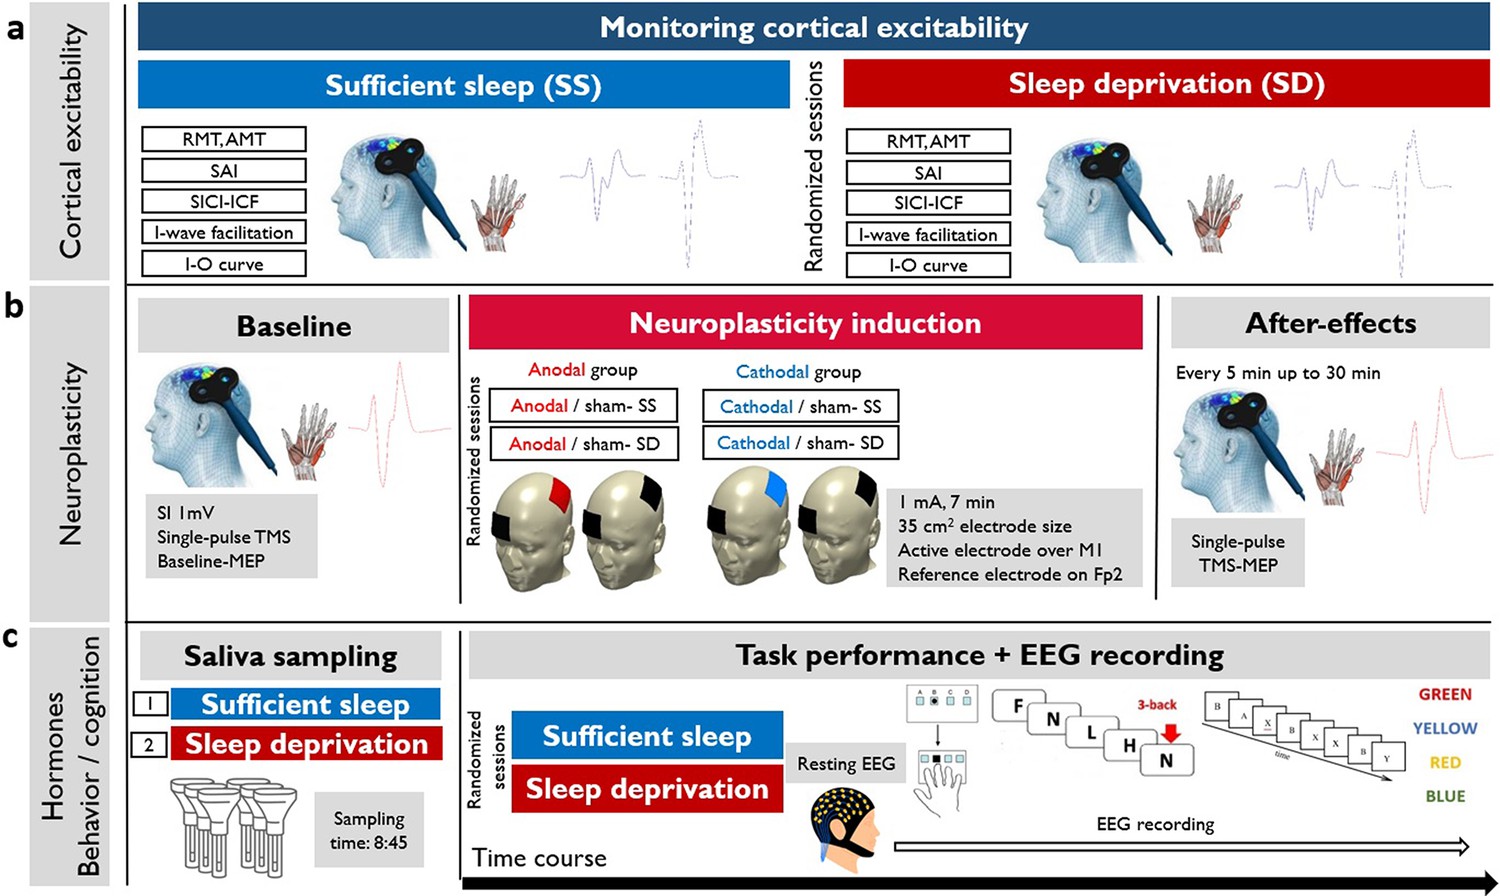
The course of the experiment.
We recruited 30 young healthy participants to attend two experimental sessions in a randomized order (sufficient sleep and overnight sleep deprivation). (a) Using single-pulse and double-pulse transcranial magnetic stimulation (TMS) protocols, corticospinal and corticocortical excitability were measured after sleep deprivation or sufficient sleep. RMT: resting motor threshold; AMT: active motor threshold; SAI: short-latency afferent inhibition; SICI-ICF: short-latency intracortical inhibition and facilitation; I-O curve: input-output curve. (b) Neuroplasticity was induced with anodal and cathodal stimulation in two parallel groups (anodal vs cathodal group) after sufficient sleep (SS) vs sleep deprivation (SD). SI1 mv: stimulation intensity to elicit a motor evoked potential (MEP) amplitude of 1 mV, M1: primary motor cortex; Fp2: right supraorbital area. (c) Saliva samples were taken at 8:45 in each session. Following the resting-EEG acquisition, participants performed motor learning, working memory, and attention tasks at the beginning of each experimental session (sufficient sleep vs sleep deprivation) while their EEG was recorded. SRTT: serial reaction time task, AX-CPT: AX continuous performance task.
Figure 2

Corticospinal and corticocortical excitability after sufficient sleep vs sleep deprivation.
(a) There is a trend of higher corticospinal excitability after the sleep deprivation session compared to sufficient sleep, especially at 150% of resting motor threshold (RMT) intensity. The red asterisk refers to significant effects of sleep condition (p=0.034) and transcranial magnetic stimulation (TMS) intensity (p<0.001). (b) Cortical inhibition significantly decreased after sleep deprivation as compared with sufficient sleep (tISI2=4.24, p<0.001; tISI3=4.50, p<0.001). In contrast, cortical facilitation is significantly upscaled after sleep deprivation compared with sufficient sleep (tISI10=7.69, p<0.001; tISI15=6.66, p<0.001). (c) I-wave peaks were significantly facilitated for early and middle inter-stimulus intervals (ISIs) after both, sufficient sleep and sleep deprivation, and for late ISIs only after sleep deprivation. For all ISIs, I-wave peaks were significantly more upscaled after sleep deprivation vs sufficient sleep (tearly=3.90, p<0.001; tmiddle=3.91, p<0.001; tlate=4.40, p<0.001), indicative of less cortical inhibition. (d) Cortical inhibitory effect of peripheral nerve stimulation on motor cortical excitability was observed only after sufficient sleep (tISI20=4.53, p<0.001; tISI40=4.25, p<0.001), whereas the inhibitory effect of peripheral stimulation turned to excitatory effects after sleep deprivation (tISI20=2.54, p=0.035; tISI40=4.55, p<0.001). Motor-evoked potential (MEP) amplitude was significantly upscaled after sleep deprivation vs sufficient sleep (tISI20=7.08, p<0.001; tISI40=8.83, p<0.001). All pairwise comparisons were calculated using the Bonferroni correction for multiple comparisons (n=30). All error bars represent the s.e.m. Filled symbols represent a significant difference in MEP amplitudes compared to the respective test pulses (for short-latency intracortical inhibition and intracortical facilitation [SICI-ICF], I-wave, short-latency afferent inhibition [SAI]) or MEP at RMT intensity (for input-output curve [I-O curve]). Asterisks represent statistically significant comparisons between sleep conditions. ms: milliseconds.
Figure 3
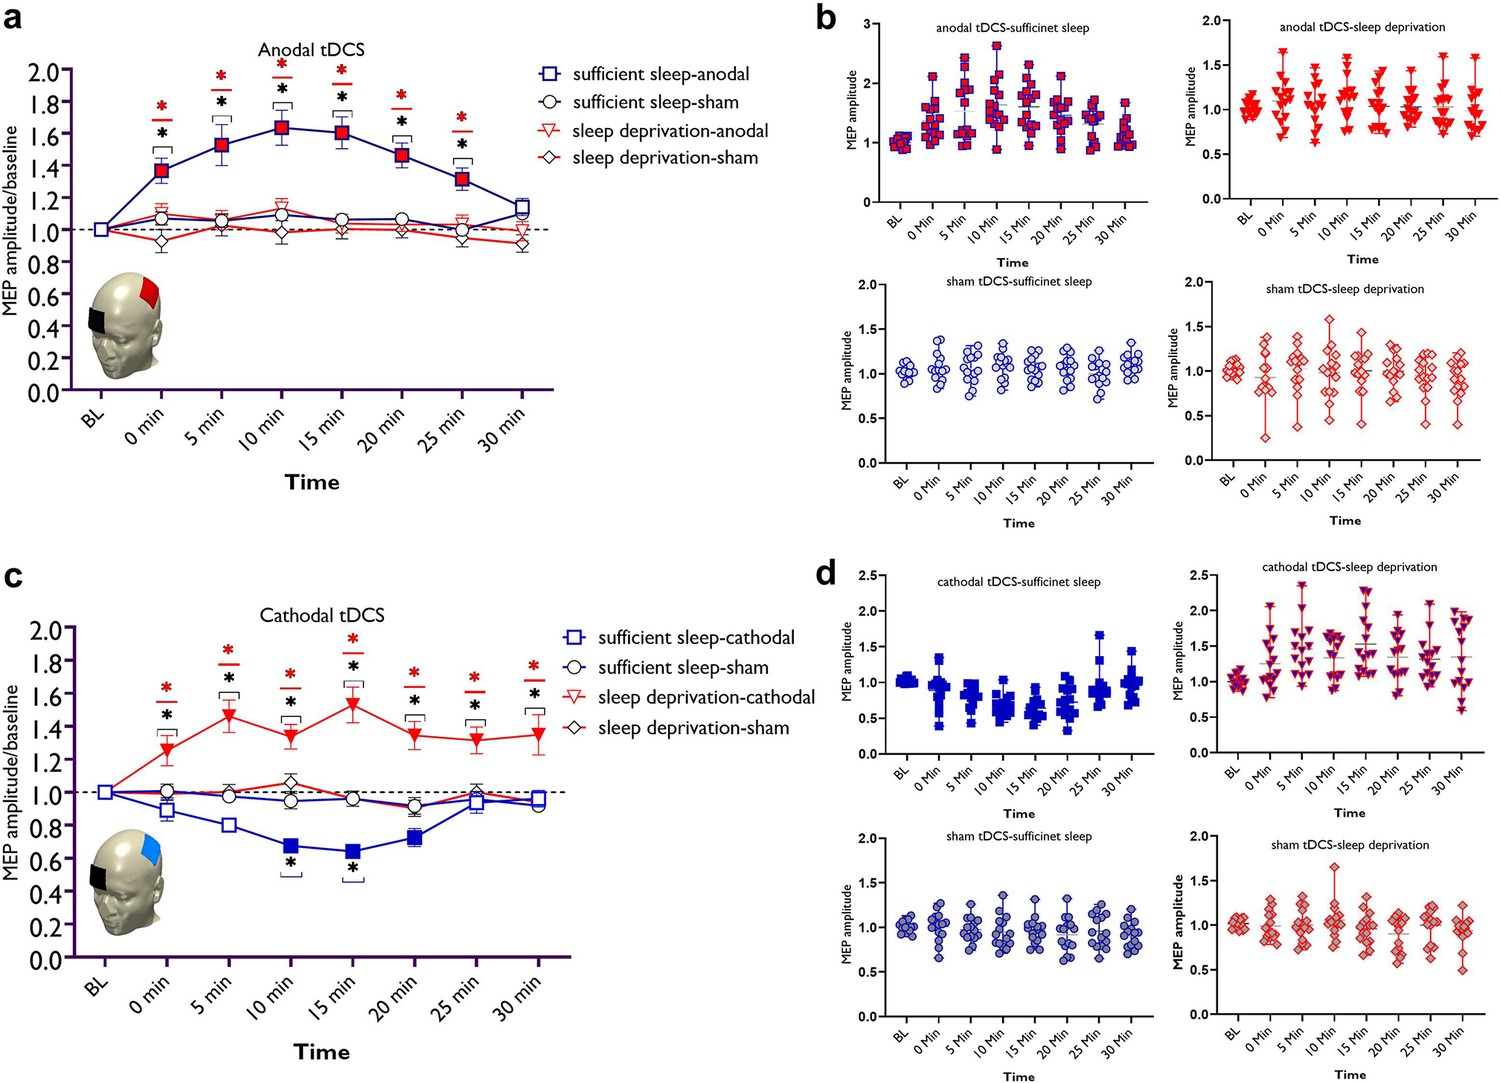
LTP/LTD-like plasticity induction after sufficient sleep vs sleep deprivation.
(a) Cortical excitability alterations after inducing LTP-like plasticity with anodal transcranial direct current stimulation (tDCS) sleep conditions. Post hoc comparisons (Bonferroni-corrected) of motor-evoked potential (MEP) amplitudes to respective baseline values, the sham condition, and sleep conditions are marked by symbols in the figures. (b) Cortical excitability alterations after inducing LTD-like plasticity with cathodal tDCS under sleep conditions. Sham stimulation after both, sufficient sleep and sleep deprivation did not induce any significant change in cortical excitability. Filled symbols indicate a significant difference of cortical excitability against the respective baseline values. The black asterisks (*) indicate a significant difference between the real vs sham tDCS conditions, and the red asterisks (*) indicate a significant difference between respective timepoints of tDCS conditions after sufficient sleep vs sleep deprivation. All error bars represent the s.e.m. (c,d) Individual mean MEPs variability obtained from tDCS conditions after sufficient sleep and sleep deprivation. The X-axis represents timepoint (Bl, 0, 5, 10, 15, 20, 25, 30 min) and the Y-axis represents mean MEP amplitudes. n=30 (15 per group).
Figure 4
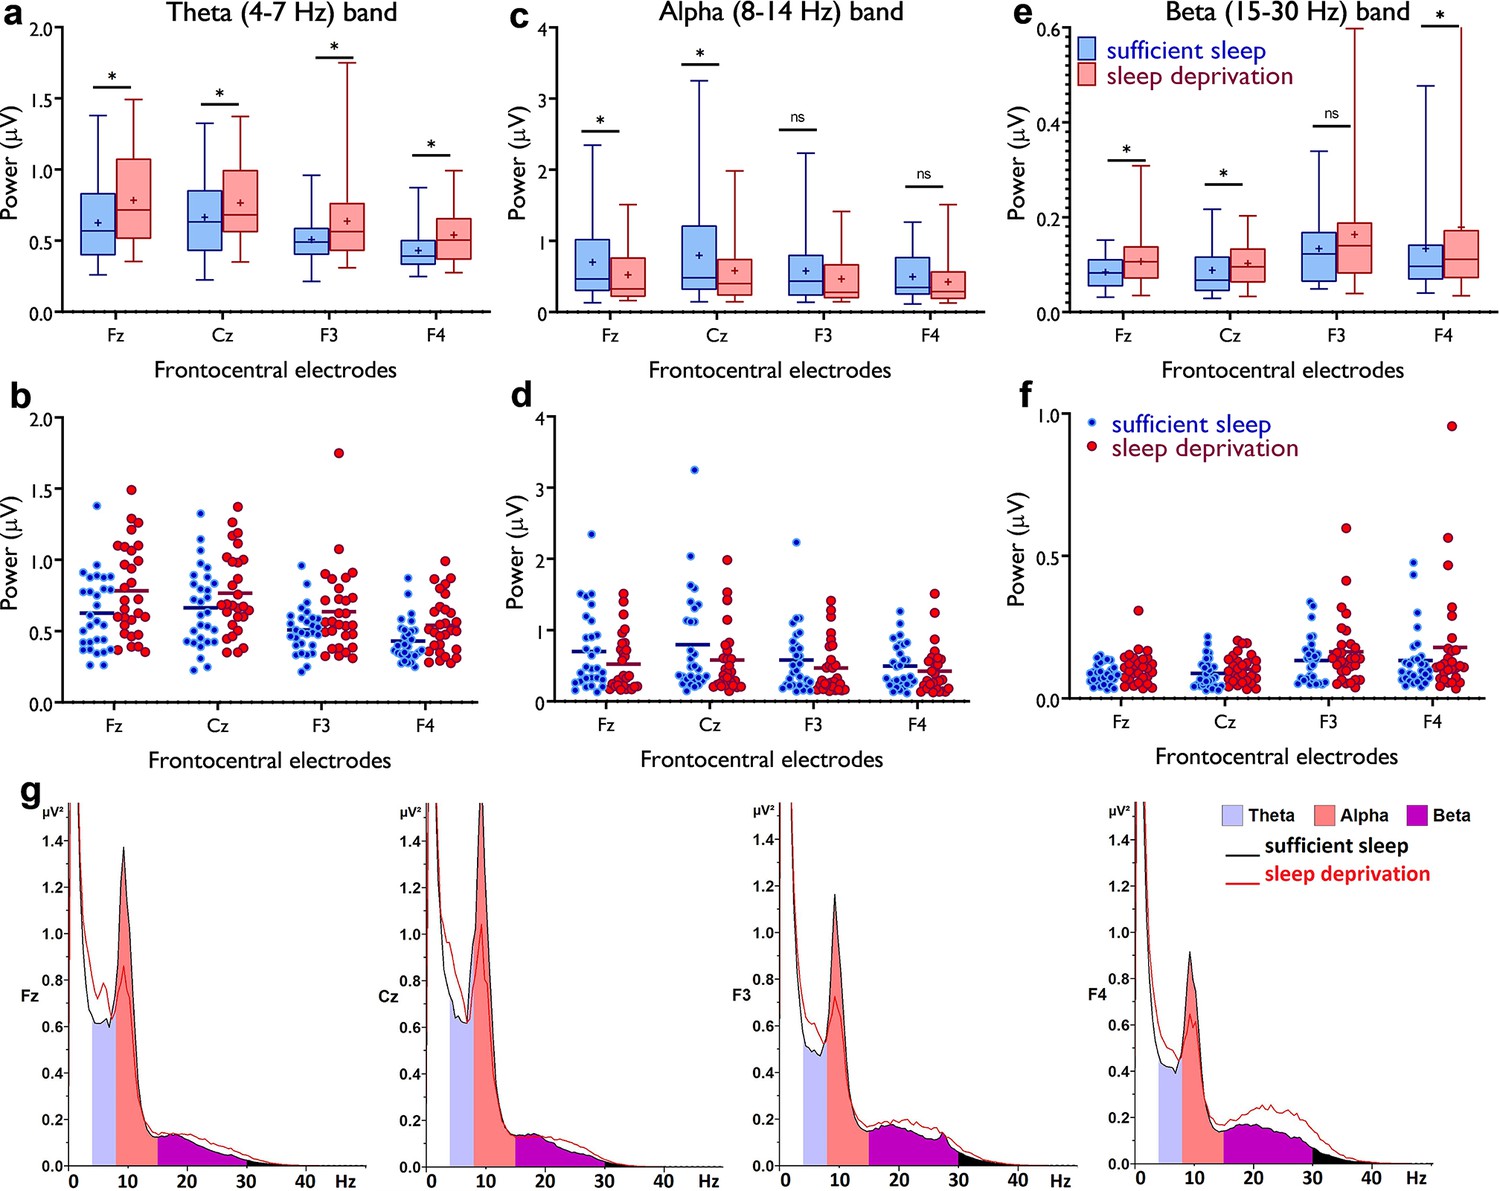
Resting-state theta, alpha, and beta oscillations at electrodes Fz, Cz, F3, and F4.
(a,b) Theta band activity was significantly higher after the sleep deprivation vs sufficient sleep condition (tFz=4.61, p<0.001; tCz=2.22, p=0.034; tF3=2.93, p=0.007; tF4=4.78, p<0.001). (c,d) Alpha band activity was significantly lower at electrodes Fz and Cz (tFz=2.39, p=0.023; tCz=2.65, p=0.013) after the sleep deprivation vs the sufficient sleep condition. (e,f) Beta band activity was significantly higher at electrodes Fz, Cz, and F4 after sleep deprivation compared with the sufficient sleep condition (tFz=3.06, p=0.005; tCz=2.38, p=0.024; tF4=2.25, p=0.032). (g) Power spectrum including theta (4–7 Hz), alpha (8–14 Hz), and beta (15–30 Hz) bands at the electrodes Fz, Cz, F3, and F4, respectively. Data of one participant were excluded due to excessive noise. All pairwise comparisons for each electrode were calculated via post hoc Student’s t-tests (paired, p<0.05). n=29. Error bars represent s.e.m. ns: nonsignificant; asterisks (*) indicate significant differences. Boxes indicate the interquartile range that contains 50% of values (range from the 25th to the 75th percentile) and whiskers show the 1st–99th percentiles.
Figure 5 with 3 supplements
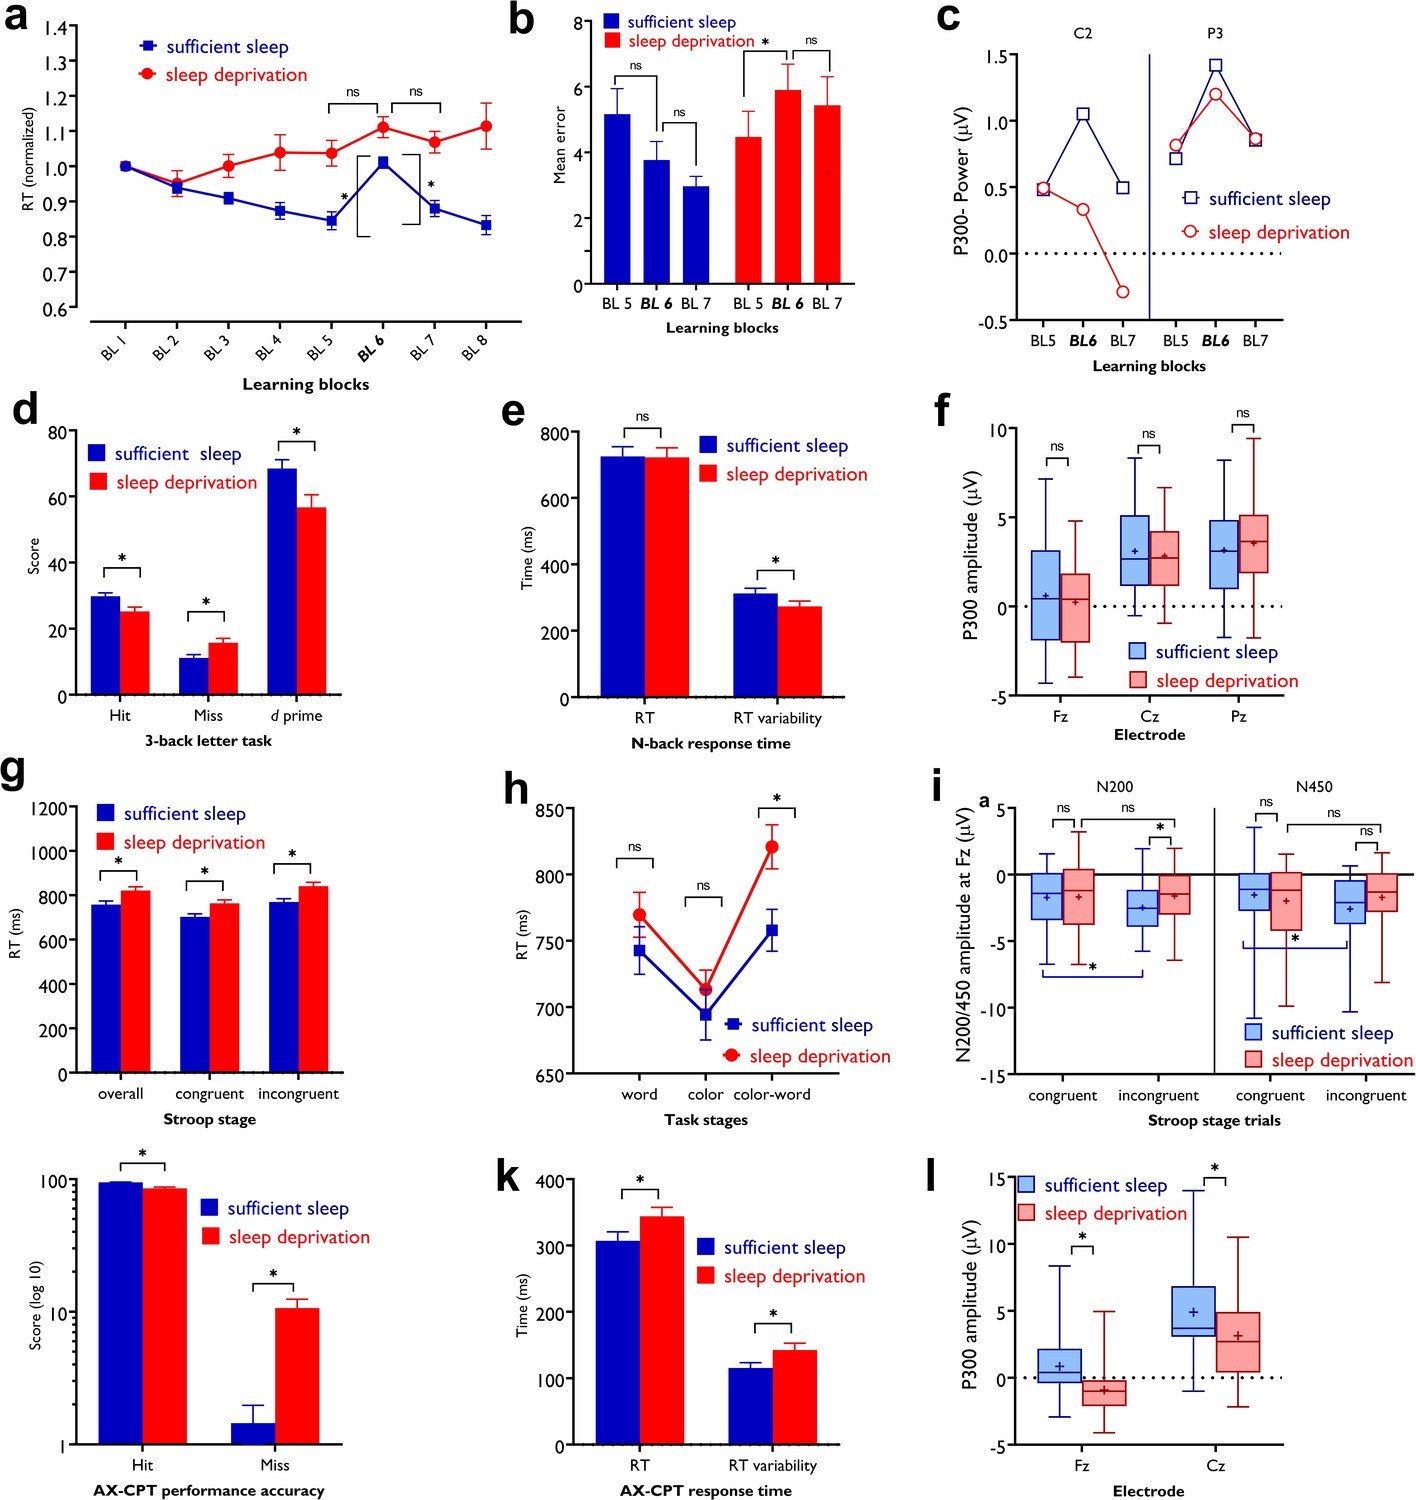
Impact of sleep deprivation on sequence learning, working memory, and attention.
(a) The reaction time (RT) difference of block (BL) 6–5 (learning acquisition) and BL 6–7 (learning retention) was significant only after sufficient sleep (BL 6–5: t=3.73, p<0.001; BL 6–7: t=2.95, p=0.003) but not sleep deprivation (BL 6–5: t=1.67, p=0.094; BL 6–7: t=0.95, p=0.337).( b) Performance was more erroneous after sleep deprivation. Asterisks (*) represent significant differences between learning block RTs (BL 6–5, BL 6–7). n=30.(c) For both P3 and C2 electrodes, the P300 amplitude (250–500 ms) was significantly larger in block 6 vs BL5 and 7 only after sufficient sleep (P3: t6-5=3.50, p<0.001, t6-7=3.30, p=0.003; C2: t6-5=2.74, p=0.010, t6-7=2.64, p=0.013) marked by the filled symbol. n=30. (d) Participants had more correct responses (t=3.56, p<0.001) and a higher d index (t=3.43, p=0.002) after having sufficient sleep vs sleep deprivation. (e) Performance speed was not significantly different but was more variable after sufficient sleep. n=30. (f) The P300 amplitude (300–600 ms) did not significantly differ across sleep conditions at electrodes Fz, Pz, and Cz. n=29. (g) RT of the congruent, incongruent, and overall trials in the Stroop task was significantly slower after sleep deprivation. (h) Participants displayed a significantly stronger Stroop interference effect (RTincongruent-RTcongruent) after sleep deprivation vs sufficient sleep (t=2.63, p=0.009). n=29. (i) The N200 (200–300 ms) at electrode Fz was significantly larger for incongruent trials, but not congruent trials, after sufficient sleep vs sleep deprivation. Both N200 and N450 (400–550 ms) were significantly larger for incongruent vs congruent trials only after sufficient sleep. (j,k) Participants were less accurate in identifying AX trials (t=5.30, p<0.001), had slower RT (t=3.29, p=0.003), and showed a larger variability of RT (t=3.13, p=0.004) after sleep deprivation vs sufficient sleep. (l) The P300 (300–600 ms) amplitude was significantly larger after sufficient sleep at electrodes Fz and Cz. n=27. All pairwise comparisons were calculated via post hoc Student’s t-tests (paired, p<0.05). Error bars represent s.e.m. ns: nonsignificant; Asterisks (*) indicate significant differences. Boxes indicate interquartile range that contains 50% of values (25th–75th) and whiskers show 1st–99th percentiles. See also Figure S1-S3.
Figure 5—figure supplement 1
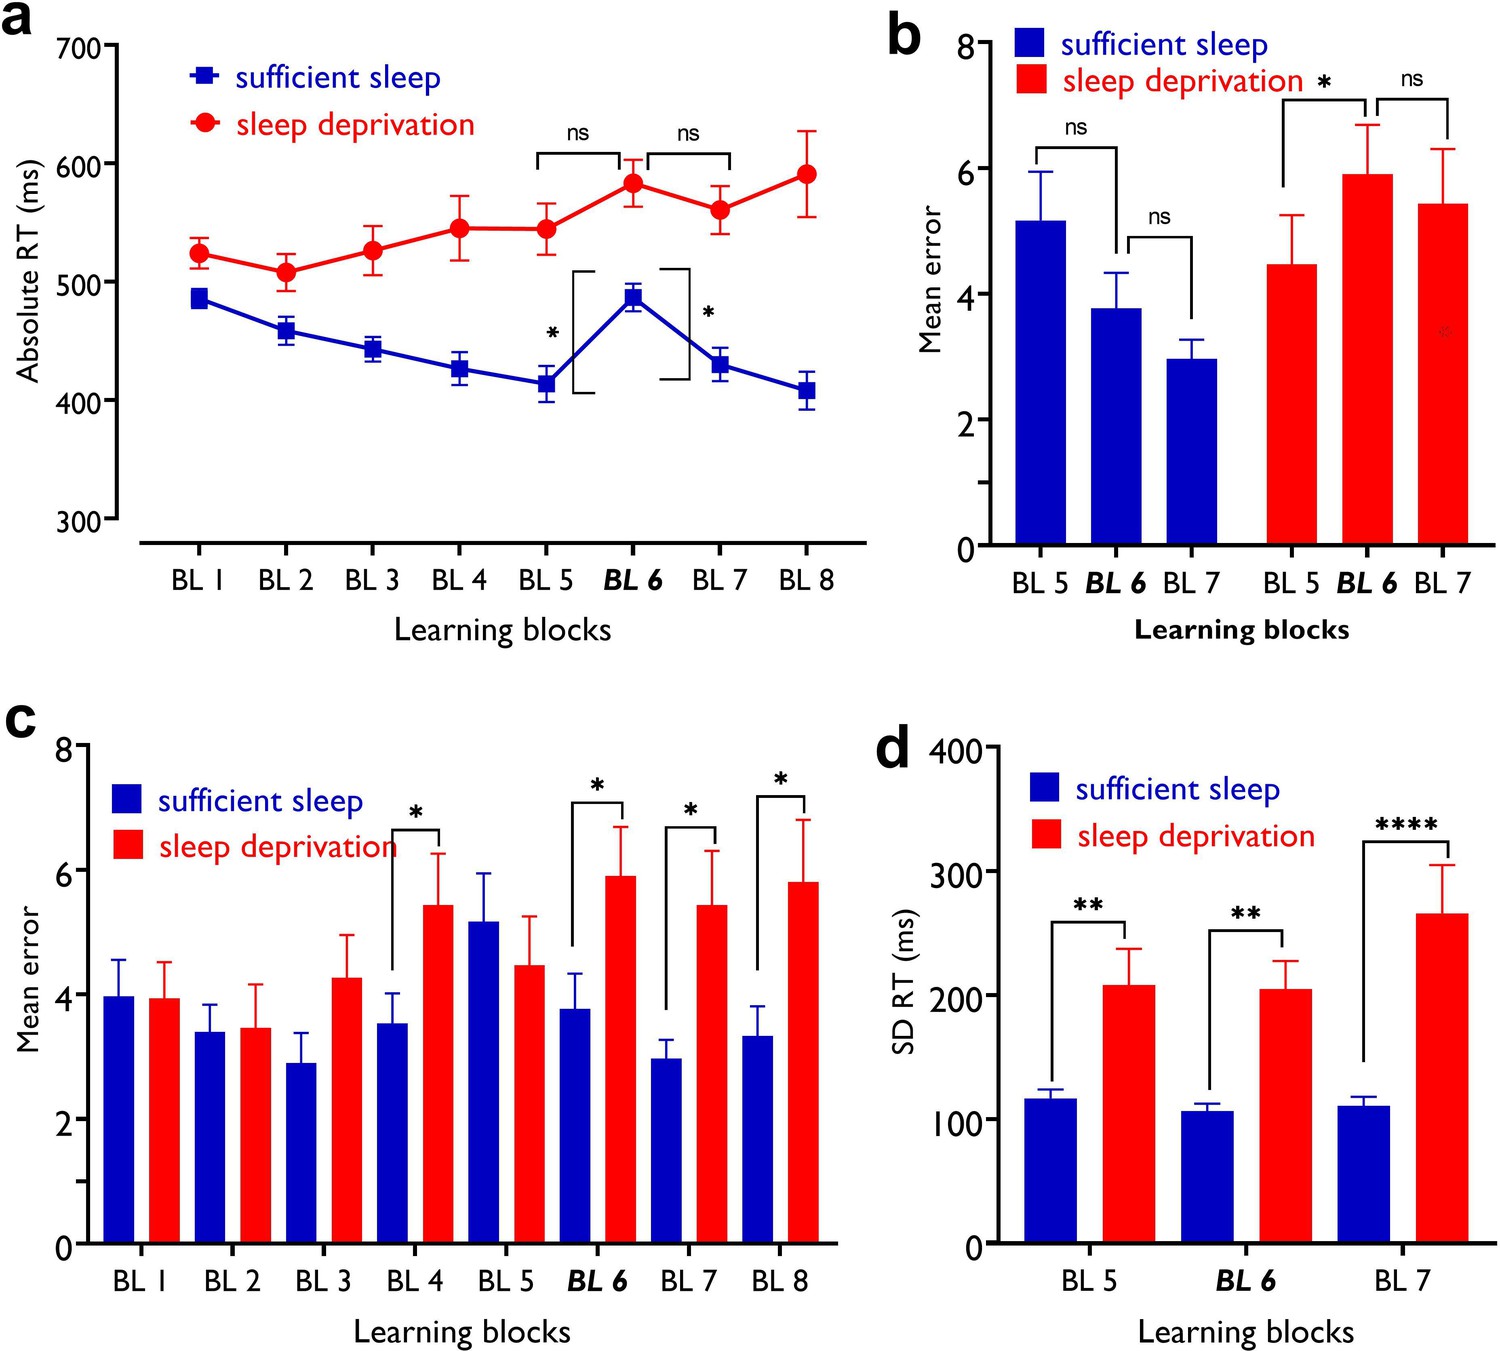
The impact of sleep deprivation on motor learning performance.
(a) Block (BL) 5–6 absolute reaction time (RT) difference represents sequence learning and was significant only after sufficient sleep (t=2.78, p=0.005) but not sleep deprivation (t=1.47, p=0.141). The BL 6–7 RT difference represents learning retention and was again significant only after sufficient sleep (t=2.16, p=0.031) but not sleep deprivation (t=0.86, p=0.392). Asterisks (*) represent statistically significant differences between learning blocks RT (BL 6–5, BL 6–7). The brackets refer to RT difference between blocks 6 vs 5 and 6 vs 7. (b) After sleep deprivation, participants committed more errors at block 6 compared to block 5 (t=2.38, p=0.024) but not 7 (t=0.70, p=0.489). (c), Block-specific error rate was, however, significantly higher after sleep deprivation in BL 6 (t=3.80, p<0.001), 7 (t=3.12, p=0.004), and also BL 4 (t=2.41, p=0.022) and 8 (t=3.09, p=0.004), as compared to the sufficient sleep condition. (d), Participants showed higher RT variability after sleep deprivation, in all learning blocks including block 5 (t=3.17, p=0.004), block 6 (t=4.43, p<0.001), and block 7 (t=3.89, p<0.001). All pairwise comparisons are calculated using post hoc Student’s t-tests (paired, p<0.05). n=30. Error bars represent s.e.m. Asterisks (*) indicate significant differences.
Figure 5—figure supplement 2
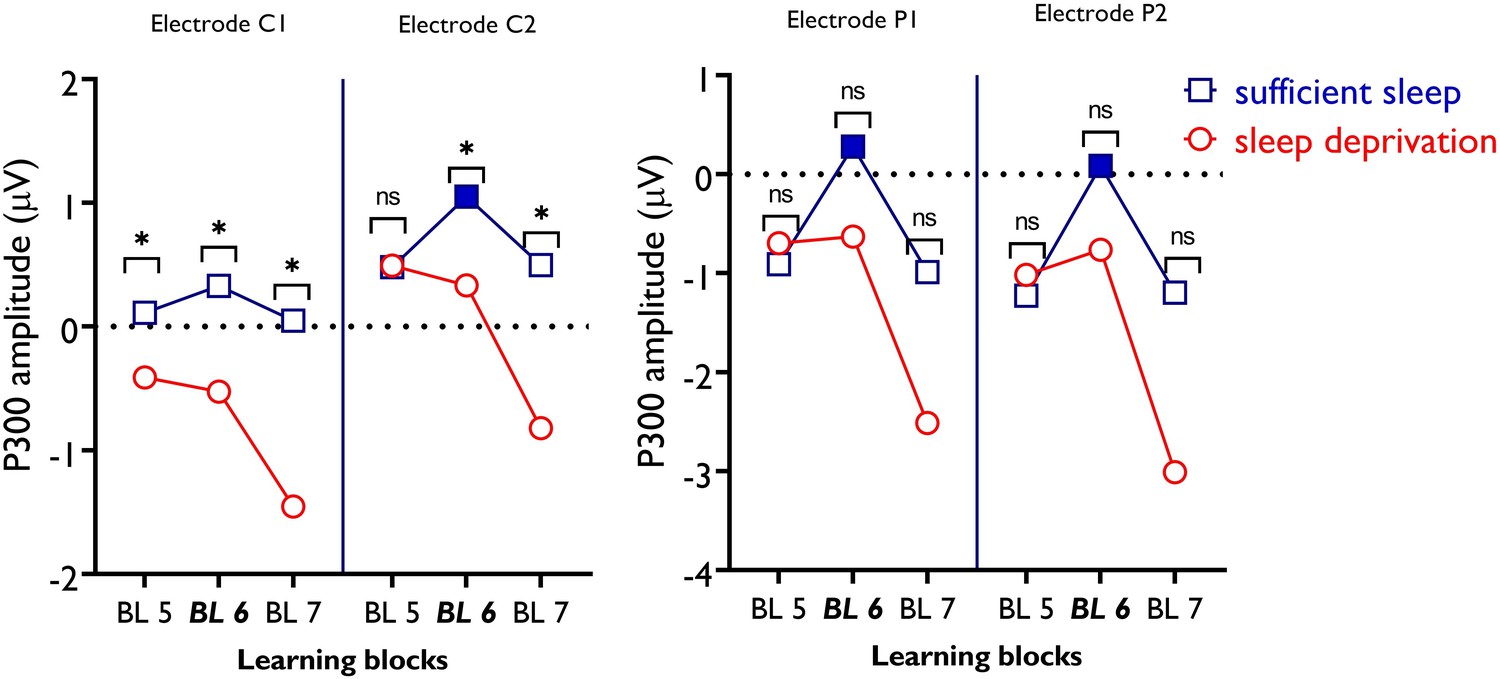
P300 amplitudes of electrodes C1, C2, P1, and P2 during motor sequence learning across sleep conditions.
For electrode C1, there was no significant difference between learning blocks across sleep conditions. However, between-condition comparisons show significantly larger P300 amplitudes in all learning blocks after sufficient sleep compared to sleep deprivation. For electrode C2, pairwise comparisons show a significantly larger P300 amplitude in block 6 compared to blocks 5 and 7 only after sufficient sleep as compared to sleep deprivation. Between-condition comparisons of respective blocks show a significantly higher P300 amplitude at blocks 6 and 7 in the sufficient sleep condition. For electrode P1, there was no significant difference between individual learning blocks across sleep conditions (i.e. sufficient sleep vs sleep deprivation). However, within-condition comparisons show a significantly higher P300 amplitude in block 6 vs 5 and block 6 vs 7 only after sufficient sleep. The same pattern of response was found for electrode P2. All pairwise comparisons are calculated using post hoc t-tests (paired, p<0.05). n=30. (*/ns) indicates significant/nonsignificant differences between each block across sleep conditions. Filled symbols represent significant differences between BL 6–5 and BL 6–7. ns: nonsignificant.
Figure 5—figure supplement 3
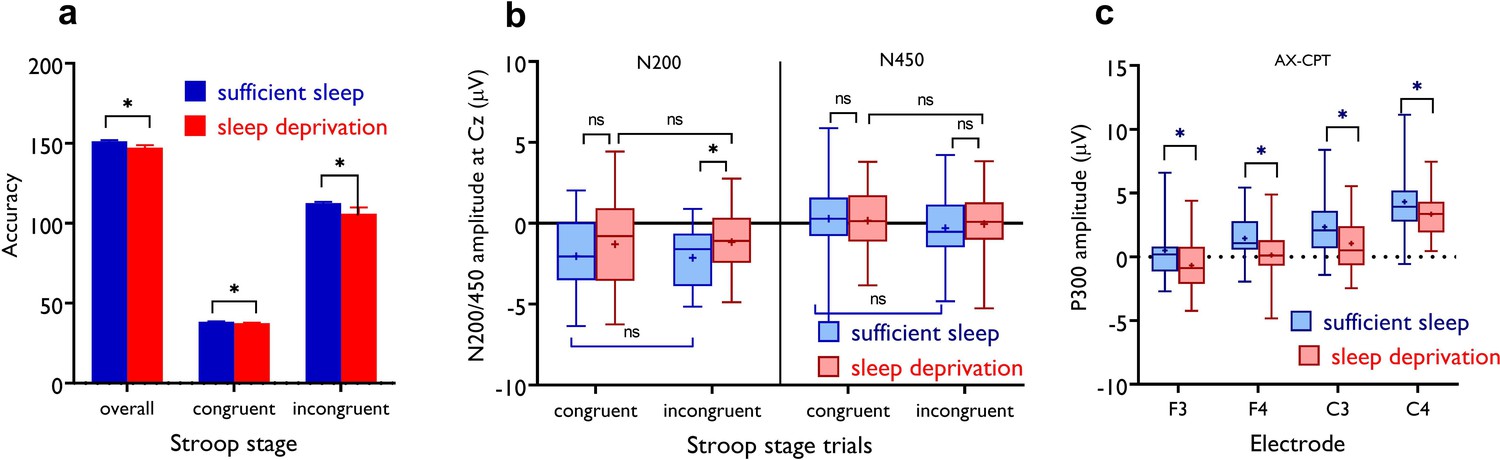
The impact of sleep deprivation on Stroop accuracy.
(a) Participants had less correct responses in overall trials of the Stroop stage (t=2.51, p=0.018), incongruent trials (t=2.30, p=0.029) and congruent trials (t=2.18, p=0.037) after sleep deprivation compared to sufficient sleep. n=29. (b) N200 and N450 ERP components of Stroop task performance across sleep conditions for electrode Cz. The N200 component was significantly larger for the incongruent trials, but not congruent trials, after sufficient sleep vs sleep deprivation for the electrodes Cz (t=3.51, p=0.002). The N450 did not significantly differ during incongruent vs congruent trials across sleep sessions. n=28. (c) The P300 amplitude was significantly larger after sufficient sleep at electrodes F3 (t=2.18, p=0.038), F4 (t=2.66, p=0.013), C3 (t=4.93, p<0.001), and C4 (t=2.75, p=0.011). The temporal window of 250–650 ms including the P300 amplitude (300–600 ms). n=27. Error bars represent s.e.m. ns: nonsignificant; Asterisks (*) indicate significant differences. All pairwise comparisons were calculated via post hoc Student’s t-tests (paired, p<0.05).
Figure 6
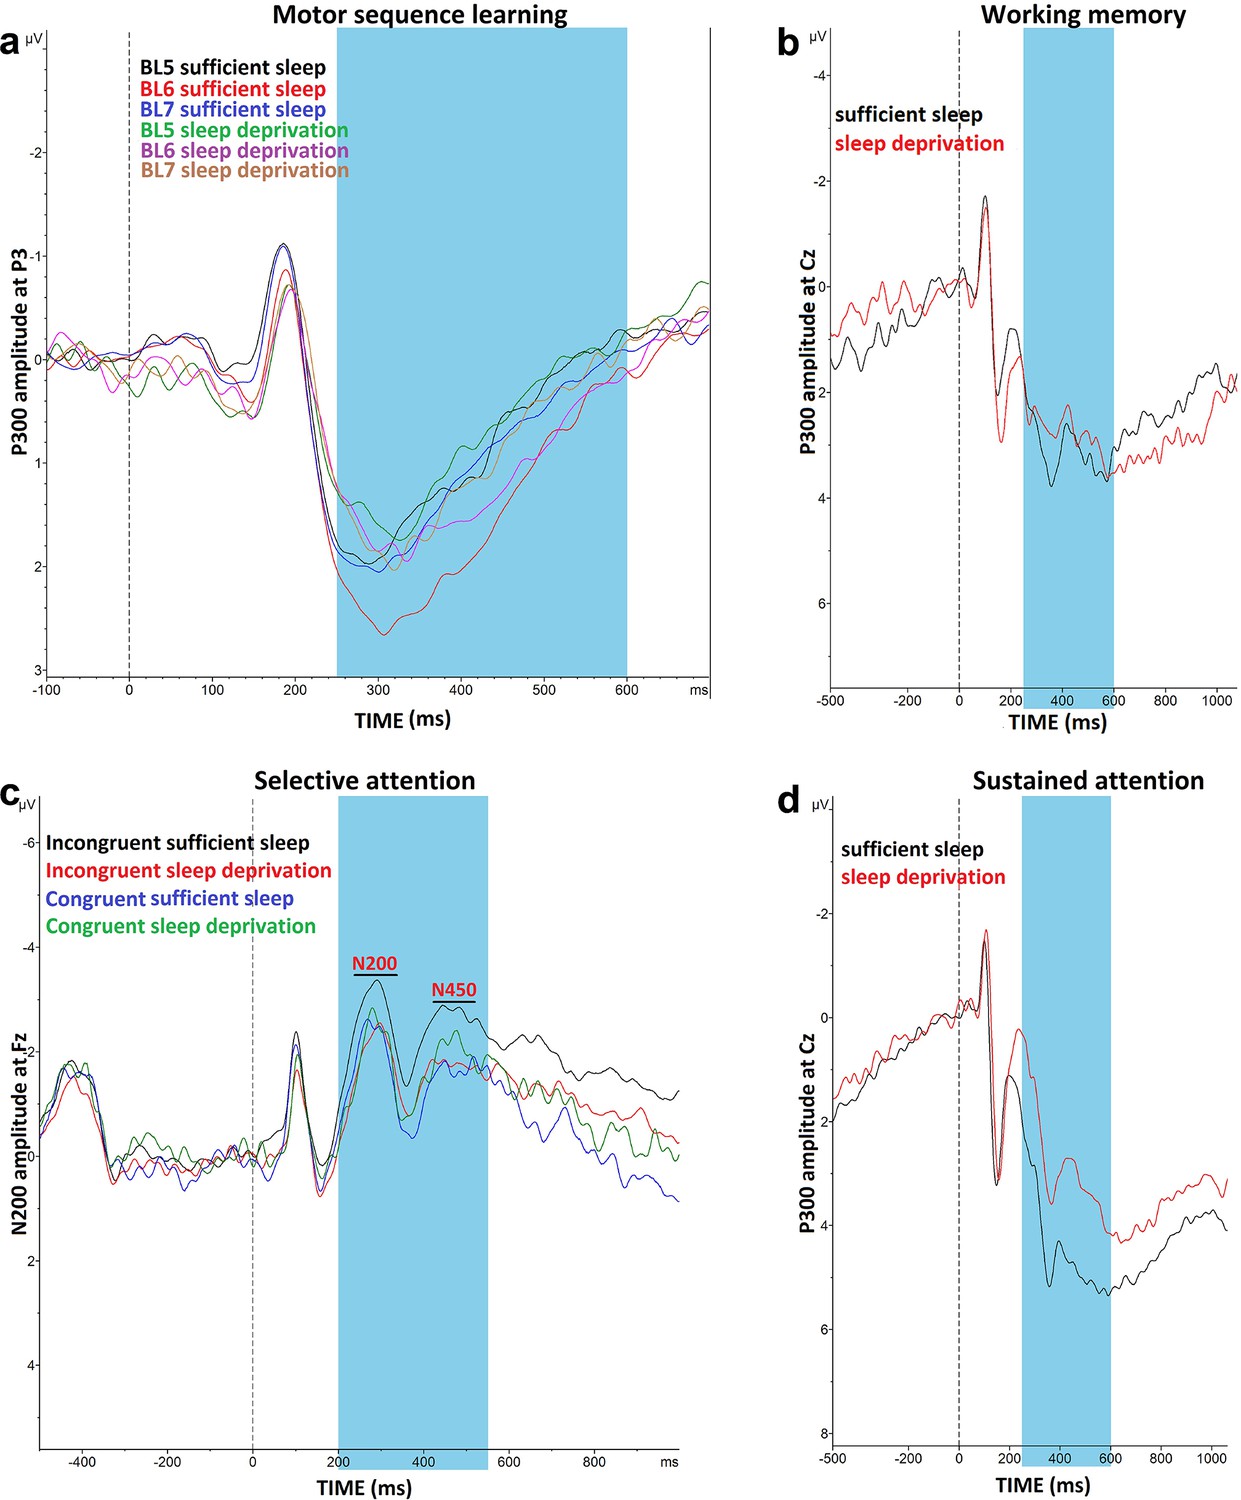
Impact of sleep deprivation on ERP components of sequence learning, working memory, and attention.
(a) P300 amplitude (250–500 ms) at electrode P3 is significantly larger in block 6 vs blocks 5 and 7 only after sufficient sleep during motor sequence learning task. (b) P300 amplitude (300–600 ms) at electrode Cz for the n-back hits. (C) N200 (200–300 ms) and N450 (400–550 ms) amplitude at electrode Fz during selective attention task is significantly larger after sufficient sleep. (d) P300 amplitude (300–600 ms) during sustained attention task is significantly larger for hit trials at electrode Cz after sufficient sleep. ms: milliseconds. Note: In working memory ERP analysis (n=1), Stroop behavioral (n=1) ERP analyses (n=2), and AX-CPT ERP analyses (n=3), the data of some participants were excluded from the analysis due to excessive noise.
Figure 7
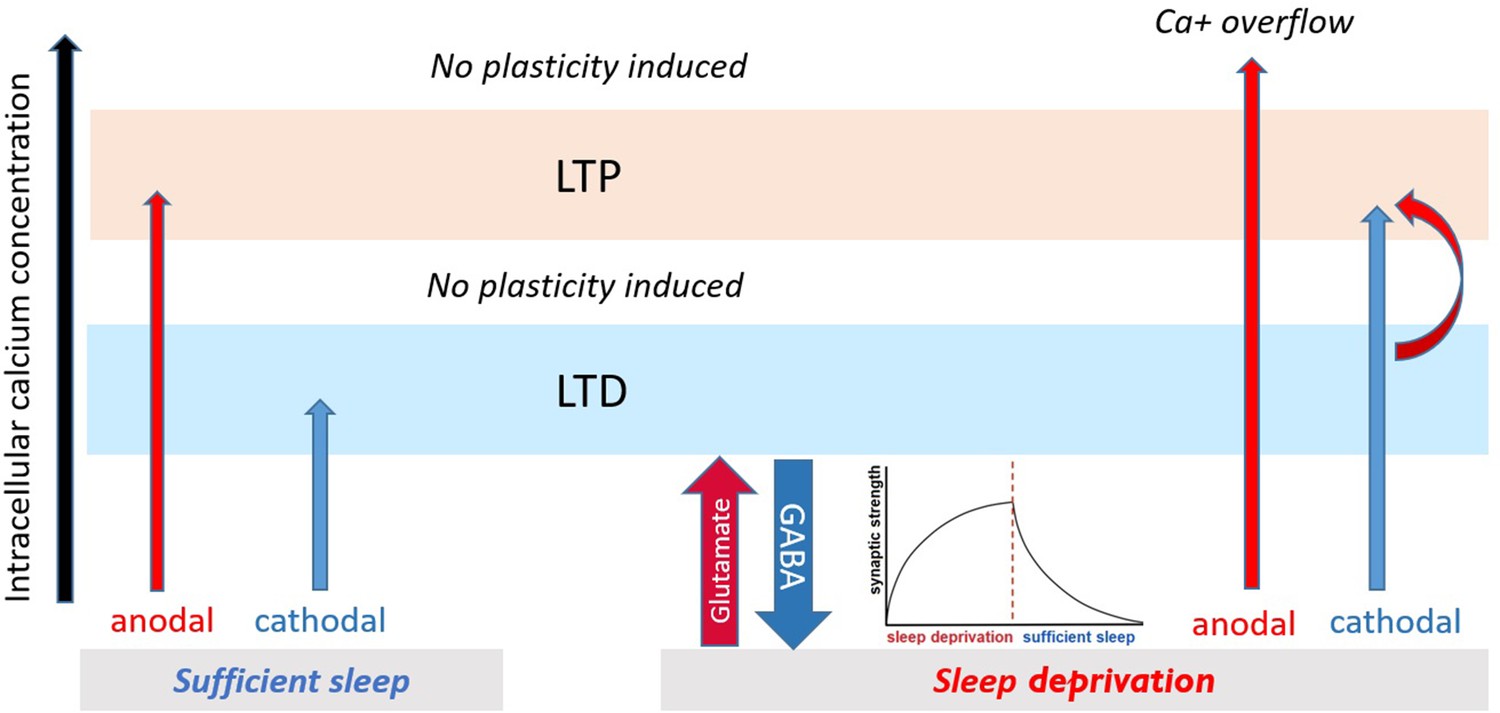
Proposed mechanism for plasticity induction.
The intracellular calcium concentration (x-axis) determines directionality of plasticity (Lisman, 2001). It can be assumed that intracellular calcium concentration under no sleep pressure (sufficient sleep) is at an optimal level leading to stronger tDCS-induced LTP/LTD-like plasticity. Under sleep deprivation, LTP-like plasticity induction via anodal tDCS is prevented due to calcium overflow, and LTD-like plasticity via cathodal tDCS is converted to LTP-like plasticity possibly via (a) enhanced baseline calcium (due to upscaled excitability) which makes minor calcium increase obtained from cathodal stimulation to be sufficient to induce LTP-like plasticity and (b) gradual downregulating upscaled cortical excitability and opening some synaptic space for LTP-related plasticity induction.
Tables
Table 1
Mixed-model ANOVA results for the effect of tDCS on MEP amplitudes after sufficient sleep and sleep deprivation.
| Factor | df | F | p | ηp2 |
|---|---|---|---|---|
| Group | 1 | 11.74 | 0.002 | 0.296 |
| Sleep condition | 1 | 0.735 | 0.399 | 0.026 |
| Stimulation state | 1 | 37.09 | <0.001 | 0.570 |
| Timepoint | 4.90 | 5.76 | <0.001 | 0.171 |
| Sleep condition × group | 1 | 61.97 | <0.001 | 0.689 |
| Stimulation state × group | 1 | 3.600 | 0.068 | 0.114 |
| Timepoint × group | 4.90 | 6.48 | <0.001 | 0.188 |
| Sleep condition × timepoint | 5.18 | 0.445 | 0.822 | 0.016 |
| Stimulation state × timepoint | 5.08 | 2.91 | 0.015 | 0.094 |
| Sleep condition × stimulation state | 1 | 5.28 | 0.029 | 0.159 |
| Sleep condition × stimulation state × group | 1 | 57.99 | <0.001 | 0.674 |
| Sleep condition × timepoint × group | 5.18 | 9.40 | <0.001 | 0.251 |
| Stimulation state × timepoint × group | 5.08 | 3.68 | 0.003 | 0.116 |
| Sleep condition × stimulation state × timepoint | 5.35 | 1.09 | 0.369 | 0.037 |
| Group × sleep condition × stimulation state × timepoint | 5.35 | 12.14 | <0.001 | 0.301 |
-
Note: tDCS: transcranial direct current stimulation; MEP: motor-evoked potentials. Significant effects are marked in bold (where p<0.05), n=30 (15 per group).
Additional files
-
Supplementary file 1
Note: MEP: motor-evoked potentials; SI1mv (%): maximum stimulator output (%MSO) required for the SI1mV MEP amplitude; I-O curve: input-output curve; SICI-ICF: short-latency intracortical inhibition and facilitation; SAI: short-latency afferent inhibition; RMT: resting motor threshold; AMT: active motor threshold.
- https://cdn.elifesciences.org/articles/69308/elife-69308-supp1-v2.docx
-
Supplementary file 2
Note: MEP: motor-evoked potentials; sleep condition: =sufficient sleep and sleep deprivation; SI1mv (%): maximum stimulator output (%MSO) required for the SI1mV MEP amplitude; I-O curve: input-output curve; SICI-ICF: short-latency intracortical inhibition and facilitation; SAI: short-latency afferent inhibition; RMT: =resting motor threshold; AMT: active motor threshold.
- https://cdn.elifesciences.org/articles/69308/elife-69308-supp2-v2.docx
-
Supplementary file 3
Note: tDCS: transcranial direct current stimulation; MEP:motor-evoked potentials; SI1mv (%): maximum stimulator output (%MSO) required for the SI1mV MEP amplitude.
- https://cdn.elifesciences.org/articles/69308/elife-69308-supp3-v2.docx
-
Supplementary file 4
The presence and intensity of the side-effects were rated on a numerical scale ranging from 0 to 5, 0 representing no and 5 extremely strong sensations.
Data are presented as mean ± SD.
- https://cdn.elifesciences.org/articles/69308/elife-69308-supp4-v2.docx
-
Supplementary file 5
The presence and intensity of reported side-effects during tDCS were analyzed by repeated measures mixed-model ANOVAs with sleep condition (sufficient sleep vs sleep deprivation) and tDCS state (active vs sham) as the within-subject factors and group (anodal, cathodal) as the between-subject factor.
Pairwise comparisons are calculated using Student’s t-test. n=30 (15 per group).
- https://cdn.elifesciences.org/articles/69308/elife-69308-supp5-v2.docx
-
Transparent reporting form
- https://cdn.elifesciences.org/articles/69308/elife-69308-transrepform1-v2.docx
Download links
A two-part list of links to download the article, or parts of the article, in various formats.
Downloads (link to download the article as PDF)
Open citations (links to open the citations from this article in various online reference manager services)
Cite this article (links to download the citations from this article in formats compatible with various reference manager tools)
Sleep-dependent upscaled excitability, saturated neuroplasticity, and modulated cognition in the human brain
eLife 11:e69308.
https://doi.org/10.7554/eLife.69308


