Pathway dynamics can delineate the sources of transcriptional noise in gene expression
- School of BioSciences, University of Melbourne, Australia
- Department of Mathematics and Statistics, La Trobe University, Australia
- School of Mathematics and Statistics, University of Melbourne, Australia
Figures
Figure 1
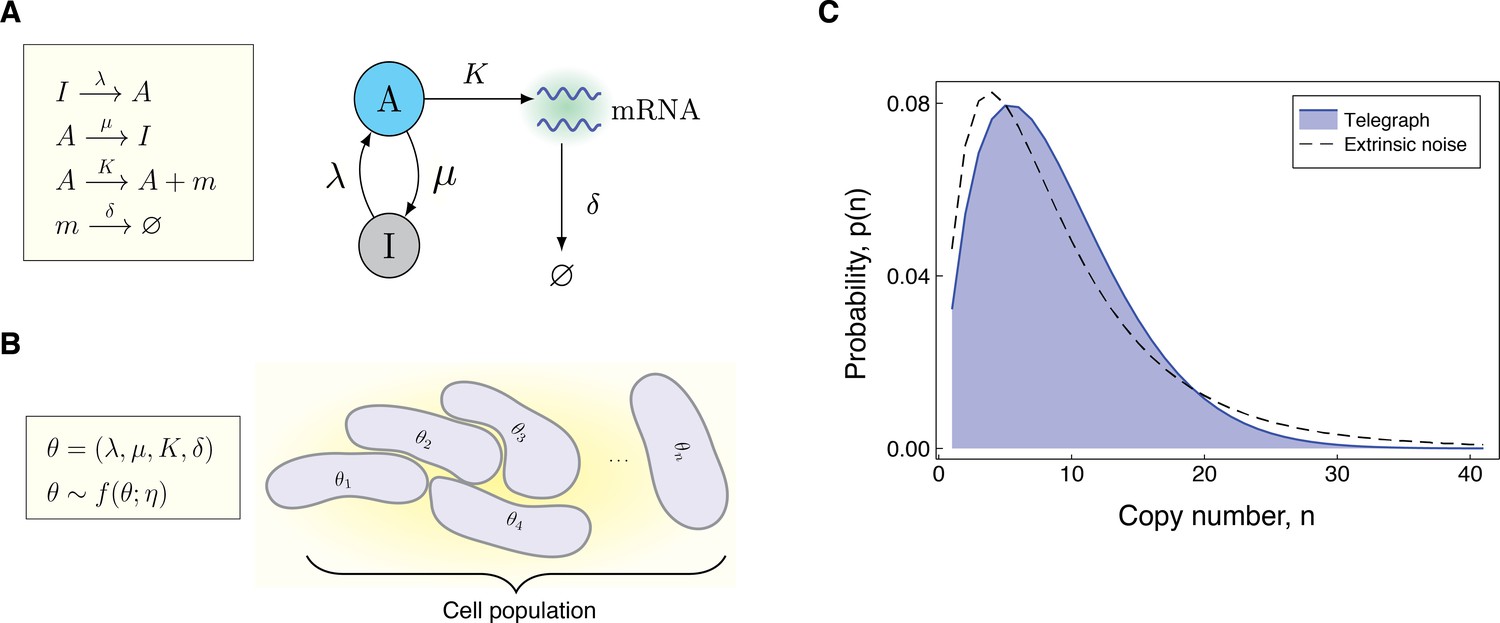
Modeling the effects of both intrinsic and extrinsic noise.
(A) A schematic of the Telegraph process, with nodes (active) and (inactive) representing the state of the gene. Transitions between the states and occur stochastically at rates μ and λ, respectively. The parameter is the mRNA transcription rate, and δ is the degradation rate. (B) The compound model incorporates extrinsic noise by assuming that parameters θ of the Telegraph model vary across an ensemble of cells, according to some probability distribution . (C) Variation in the parameters across the cell population leads to greater variability in the mRNA copy number distribution.
Figure 2
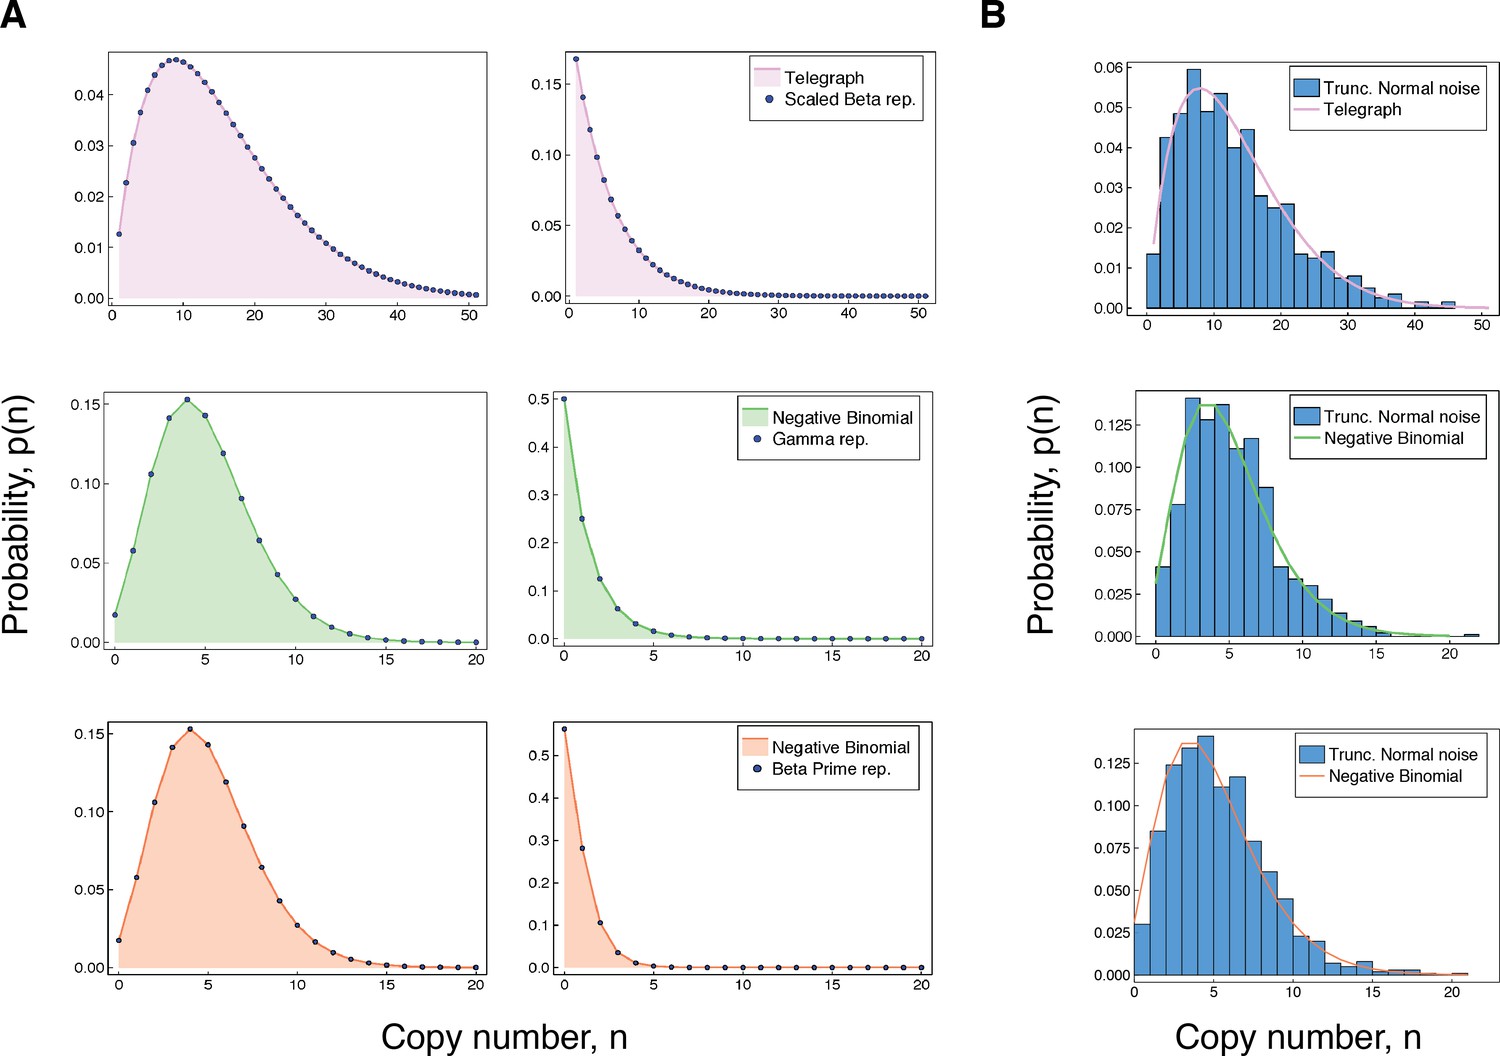
Accuracy of our integral representations for the Telegraph and negative binomial distribution.
(A) For each of the results in (3 - 5), we compare the (fixed-parameter) Telegraph and negative binomial distributions with their respective compound representations for two different sets of parameter values. The top panel (pink) shows comparisons for (3), with parameter values (left) , , , , and , and (right) , , , and . The middle panel (green) gives comparisons for (4), with parameter values (left) , , and and (right) , , and . The bottom panel (coral) gives comparisons for (5). The parameter values (left) are , and and (right) are , and . (B) The top figure compares a distribution with samples from a compound Telegraph distribution with normal noise on the transcription rate parameter. The middle figure compares a with samples from a compound Telegraph distribution with normal noise on the transcription rate parameter. The bottom figure compares a distribution with samples from a compound negative binomial distribution with normal noise on the burst intensity parameter.
Figure 3
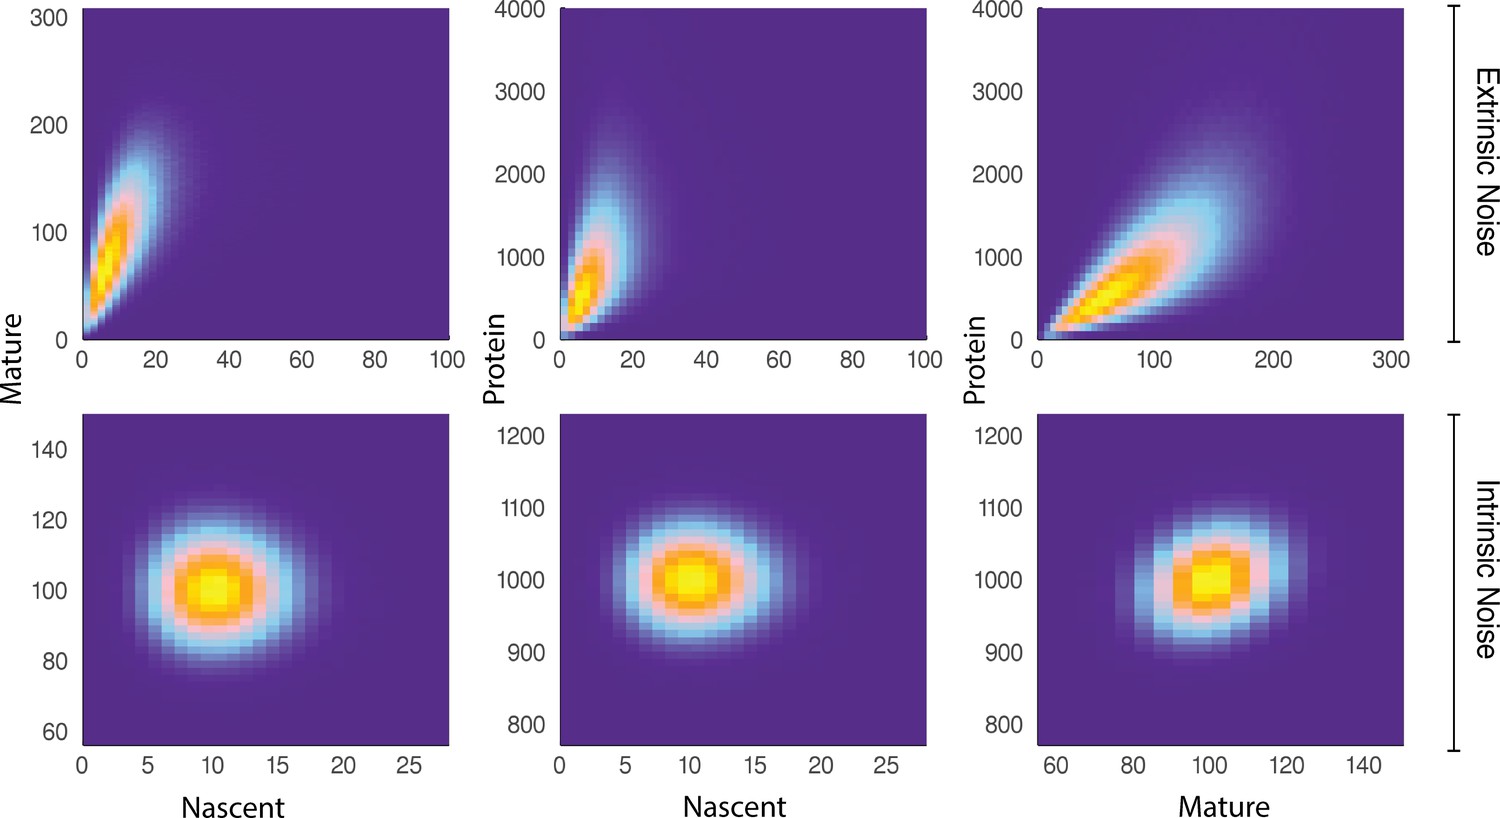
A comparison of joint distributions in the case of moderate extrinsic noise and no extrinsic noise.
The plots are generated from a three-stage model of gene transcription, incorporating the production of nascent mRNA, mature mRNA and protein. Details of the model can be found in Figure 4 (model ) and the associated text. The top panel shows nascent-mature, nascent-protein and mature-protein joint distributions in the case of extrinsic noise, while the bottom panel displays the corresponding plots in the case of no extrinsic noise. Extrinsic noise produces a visibly more correlated joint distribution, which forms the basis of the pathway-reporter method.
Figure 4

Stochastic models of gene expression.
(A) The model is the simplest model of mRNA maturation. Here, nascent (unspliced) mRNA are shown in red/blue wavy lines; the blue segments represent introns and the red segments represent the exons. Nascent mRNA are synthesised at the rate , and spliced into mature mRNA (blue wavy lines) at rate . Degradation of the mature mRNA occurs at rate . The model is the well-known two-stage model of gene expression. The model is the extension of the two-stage model to include promoter switching. The nodes (active) and (inactive) represent the state of the gene, with transitions between states occurring at rates λ and μ. The remaining parameters are the same as those in the model . The model extends the model by incorporating mRNA maturation. Here, is the transcription rate parameter, and is the maturation rate. All other parameters are the same as in . (B) Time series simulation of the copy number and activity state of a gene modelled by . For ease of visualisation, the parameters were artificially chosen as , , , , and , with all parameters scaled relative to . (C) As λ approaches 0, we see a higher correlation in the copy numbers of nascent mRNA, mature mRNA and protein. Again, the parameters are artificially chosen to be , , , , and , with all parameters scaled relative to .
Figure 5 with 1 supplement
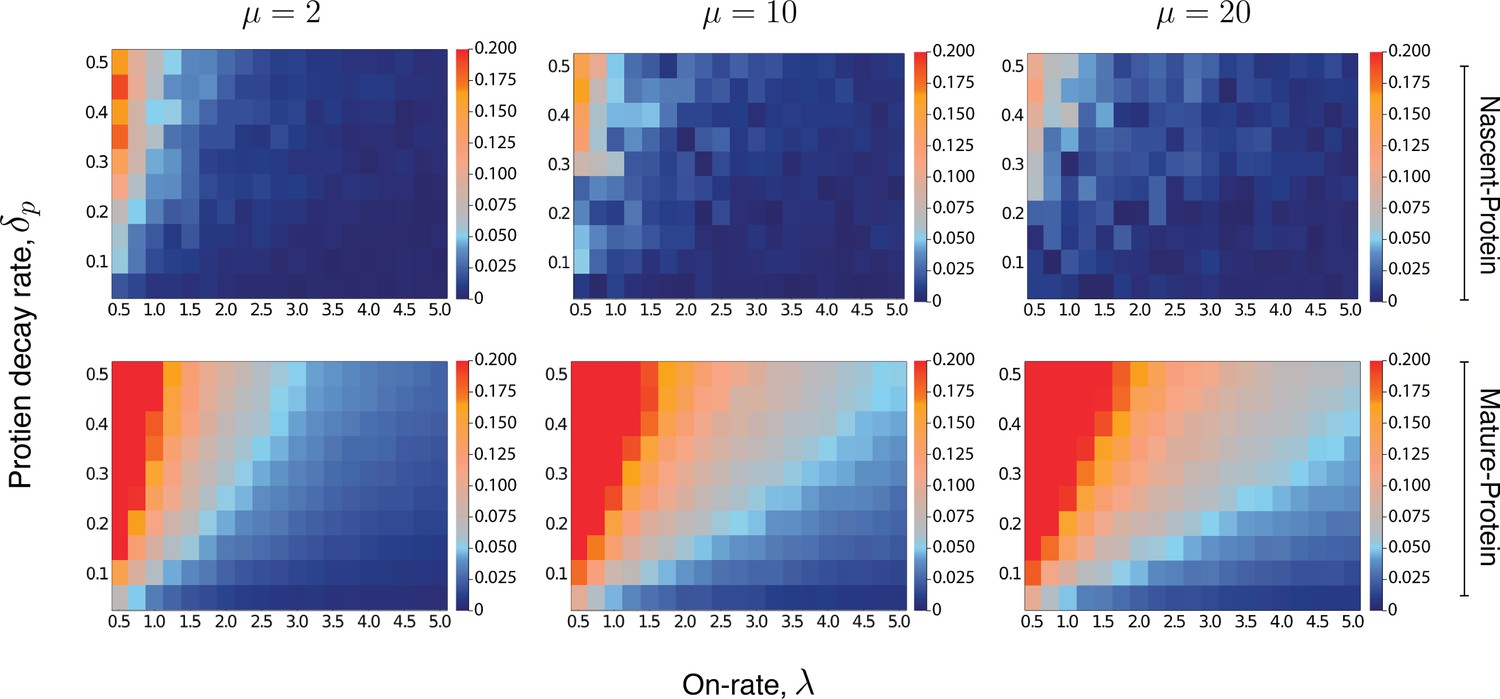
Heatmaps for the intrinsic contribution to the covariance.
These heatmaps estimate the level of overshoot in the pathway-reporter approach for the nascent-protein and mature-protein reporters; blue regions show an overshoot of less than .
Here, the intrinsic contribution is calculated using stochastic simulations of the model . For the mature-protein and nascent-protein reporters, we consider three different values of the parameter μ, specifically , , and . In all cases, the parameter and the on-rate λ are varied between 0.01 and 0.5, and 0.5 and 5, respectively. The parameters of the model are scaled so that . The maturation rate is fixed at 20, with the parameters and chosen to produce a mean protein level of 1000, a mean nascent mRNA level of 5 and a mean mature mRNA level of 50. Each individual pixel is generated from a sample of size 3000, although there is still some instability in the convergence for the nascent-protein reporter, particularly as the overshoot estimation starts to increase, and particularly as μ is larger. To produce more accurate values, the case of was averaged over two full experiments while was averaged over three. This was also done for the mature-protein reporter, however for these images there was almost no visible difference between the various runs of the experiment and their averages. Each of the three μ values takes approximately 7–10 hr of computation, depending on lead in time before sampling within a simulation. Figure 5—figure supplement 1 gives a heatmap for the overshoot in the pathway-reporter approach for nascent-mature pathway reporters.
Figure 5—figure supplement 1
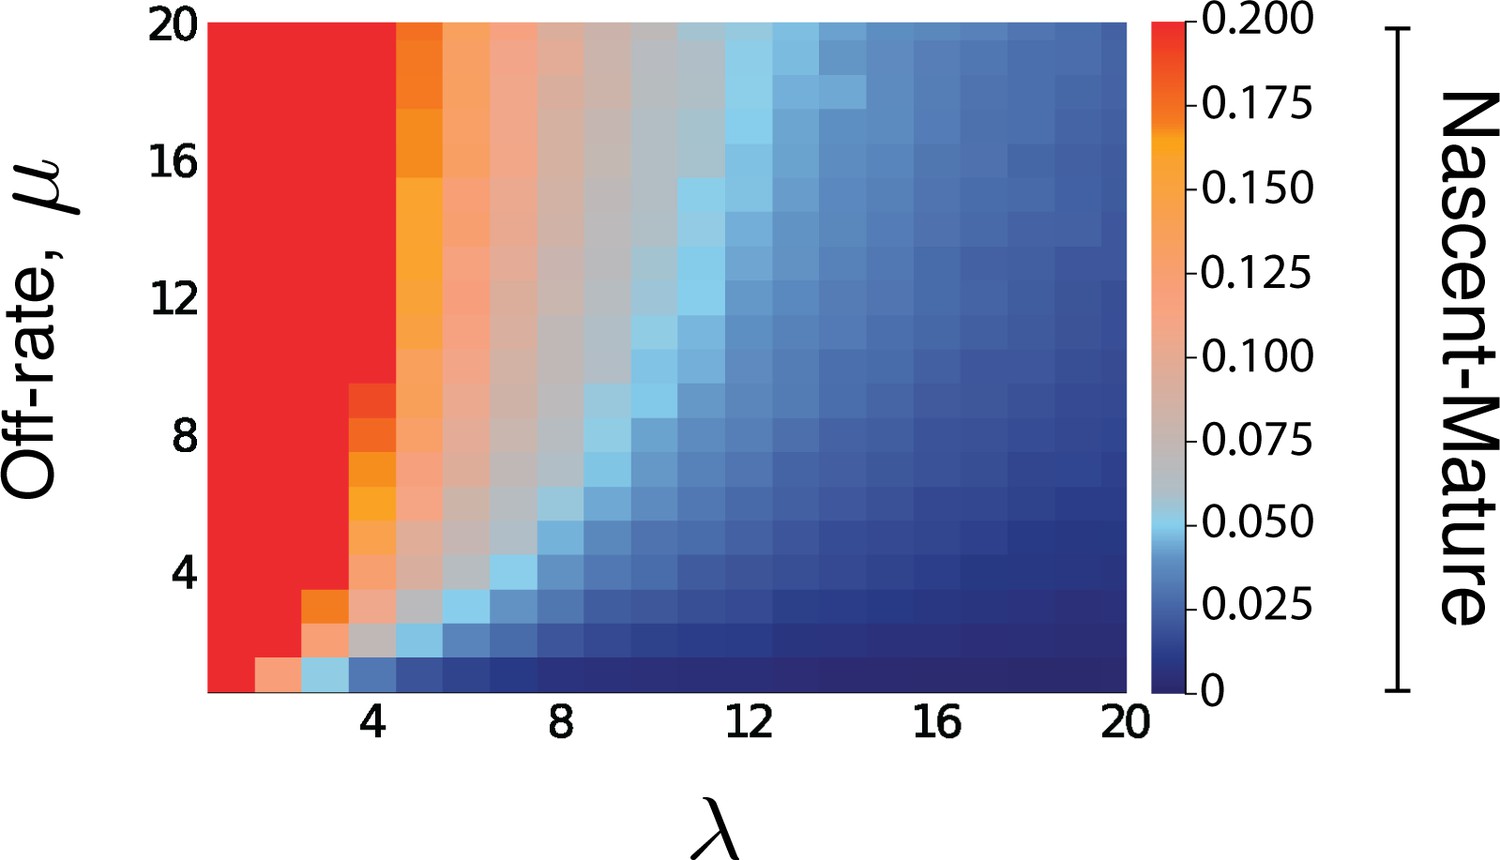
Heatmap for the intrinsic contribution to the covariance for nascent-mature pathway reporters.
The nascent-mature reporter concerns only mRNA and so is independent of all protein-related parameters. The heatmap shows the intrinsic contribution for values of λ and μ between 0.1 and 20, with the same parameter selections for , as in Figure 5 of the main text. Similar simulations for average nascent mRNA levels of 3 and of 8, and mature mRNA levels of 30 and of 160 produced almost identical heatmaps.
Figure 6
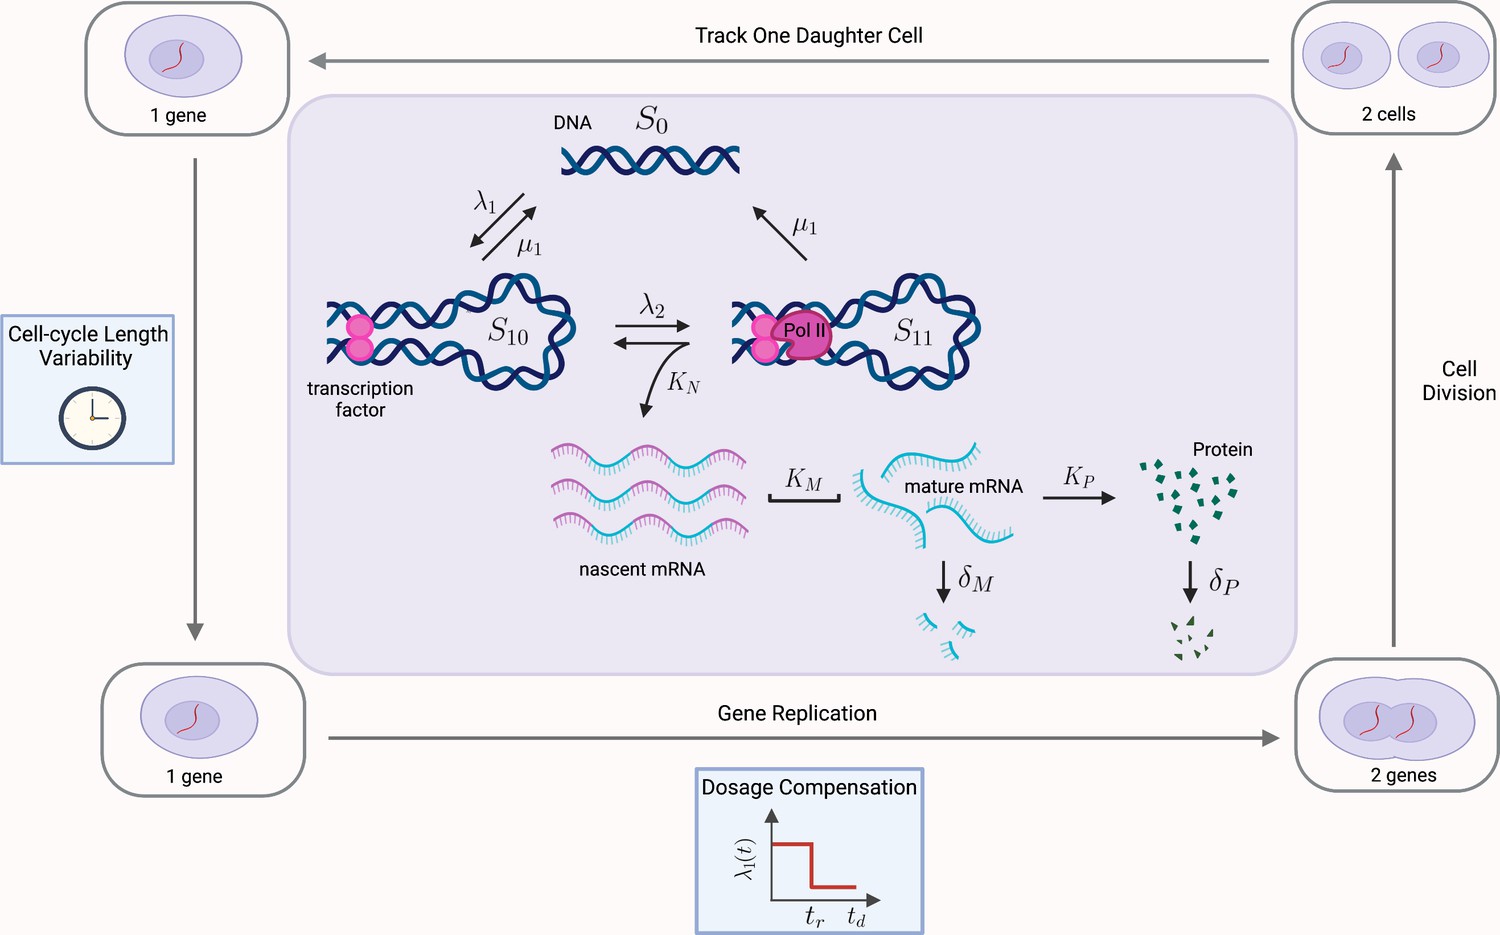
Multiscale model of transcriptional bursting with additional features of the cell cycle.
In this model, the gene stochastically switches between three states: two active states, S10 and S11, and one inactive state S0. Gene activation occurs in two steps, initially by the binding of transcription factors (at rate , reversible at rate ), and then as a secondary step by the binding and pause of the mRNA polymerase (at rate ). Transitions from S11 to S0 also occur at rate , due to detachment of both the transcriptional factors and polymerase. Transcription of nascent mRNA (at rate ) occurs only in state S11 and results in immediate transition to state S10. Nascent mRNA mature at rate , and are subsequently translated into protein at rate . Degradation of mRNA and protein occur with rates and , respectively. We verify our pathway reporter method on three variations of the multiscale model. First, we assume all reactions are first-order Poisson processes (Case (2) in the main text). We then incorporate further details of the mRNA maturation process, where nascent mRNA occurs after a fixed amount of time (Case (3)). Finally, we incorporate features of the cell-cycle such as gene replication, dosage compensation, cell division, and cell-cycle length variability, as well as incorporating more realistic Erlang distributed maturation times (Case (4)).
Appendix 4—figure 1
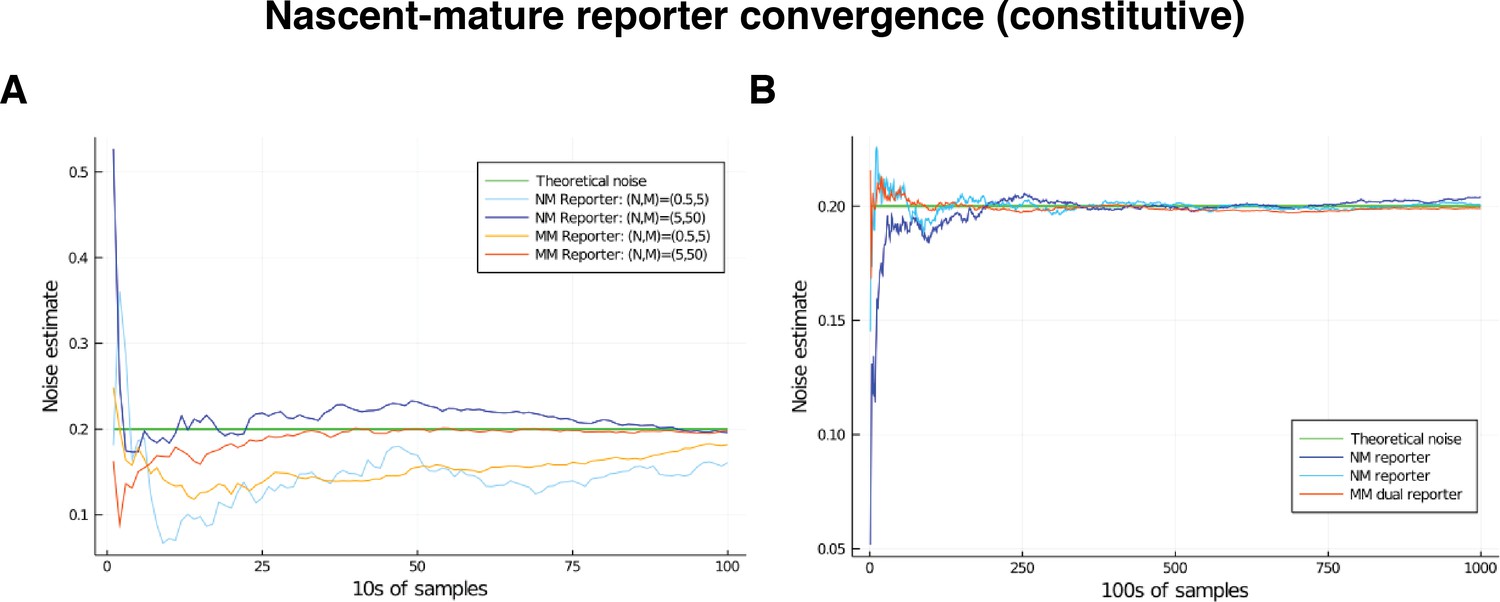
Comparison of convergence of estimates for low and high mRNA levels by way of nascent-mature reporters and mature-mature reporters.
Low level corresponds to mean nascent mRNA level of 0.5, and mean mature mRNA level of 5. High level corresponds to mean nascent mRNA level of 5, and mean mature mRNA level of 50. In both cases, the simulated genes are constitutive and noise is on all parameters except for . The green line gives the squared coefficient of variation for , set to 0.2, which is the value the various reporters are expected to estimate. (A) Convergence of the estimate over the first 2000 samples in the low- and high-output genes. (B) Convergence of the estimate over samples in the low-output gene only.
Appendix 4—figure 2
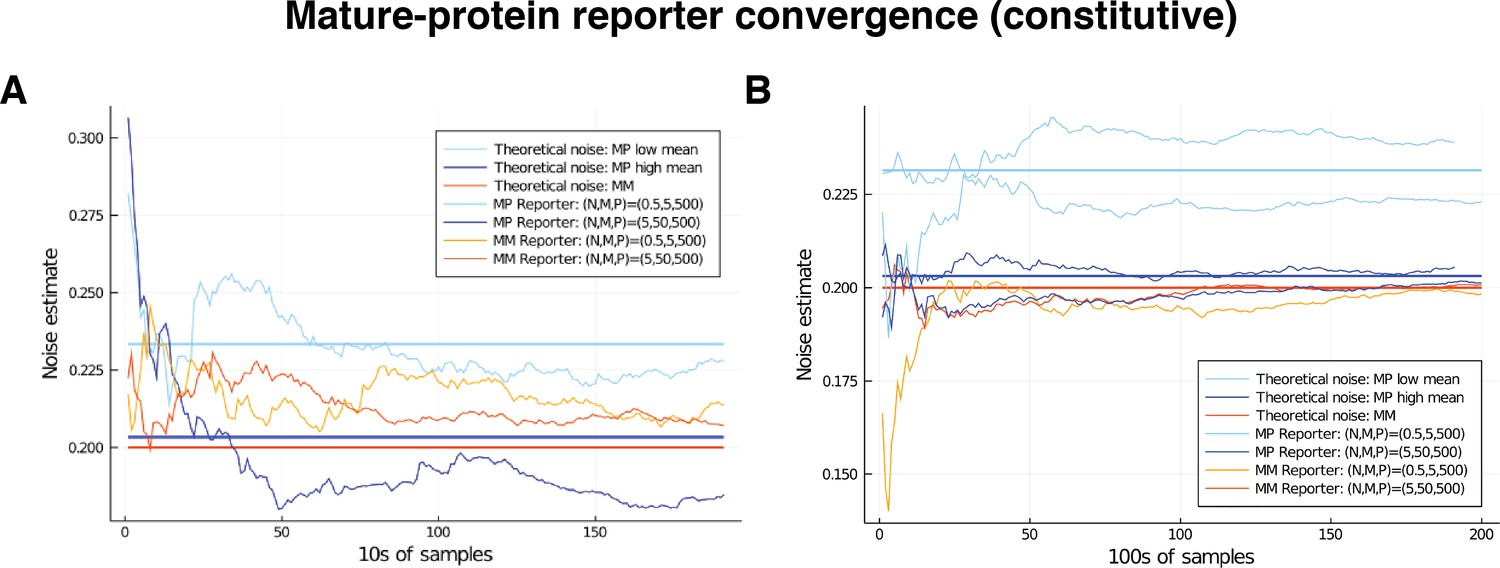
Comparison of convergence for low and high mRNA levels by way of mature-protein and mature-mature reporters.
Low level corresponds to mean nascent mRNA level of 0.5, and mean mature mRNA level of 5. High level corresponds to mean nascent mRNA level of 5, and mean mature mRNA level of 50. In both cases the simulated genes are constitutive and noise is on all parameters except for . The noise on has squared coefficient of variation equal to 0.2, which is shown as the red horizontal line. Our theory shows that mature-protein reporters will return an overshoot that is negligible in the high-output gene (the blue horizontal line), but larger in the low output gene (light blue horizontal line); these values are calculated in the text. (A) Comparison of convergence for low and high mRNA levels over the first 2000 samples. (B) Convergence of the estimate over samples in the case of the low-output gene only. Two examples of each are given, to show the variation in behaviour.
Appendix 4—figure 3
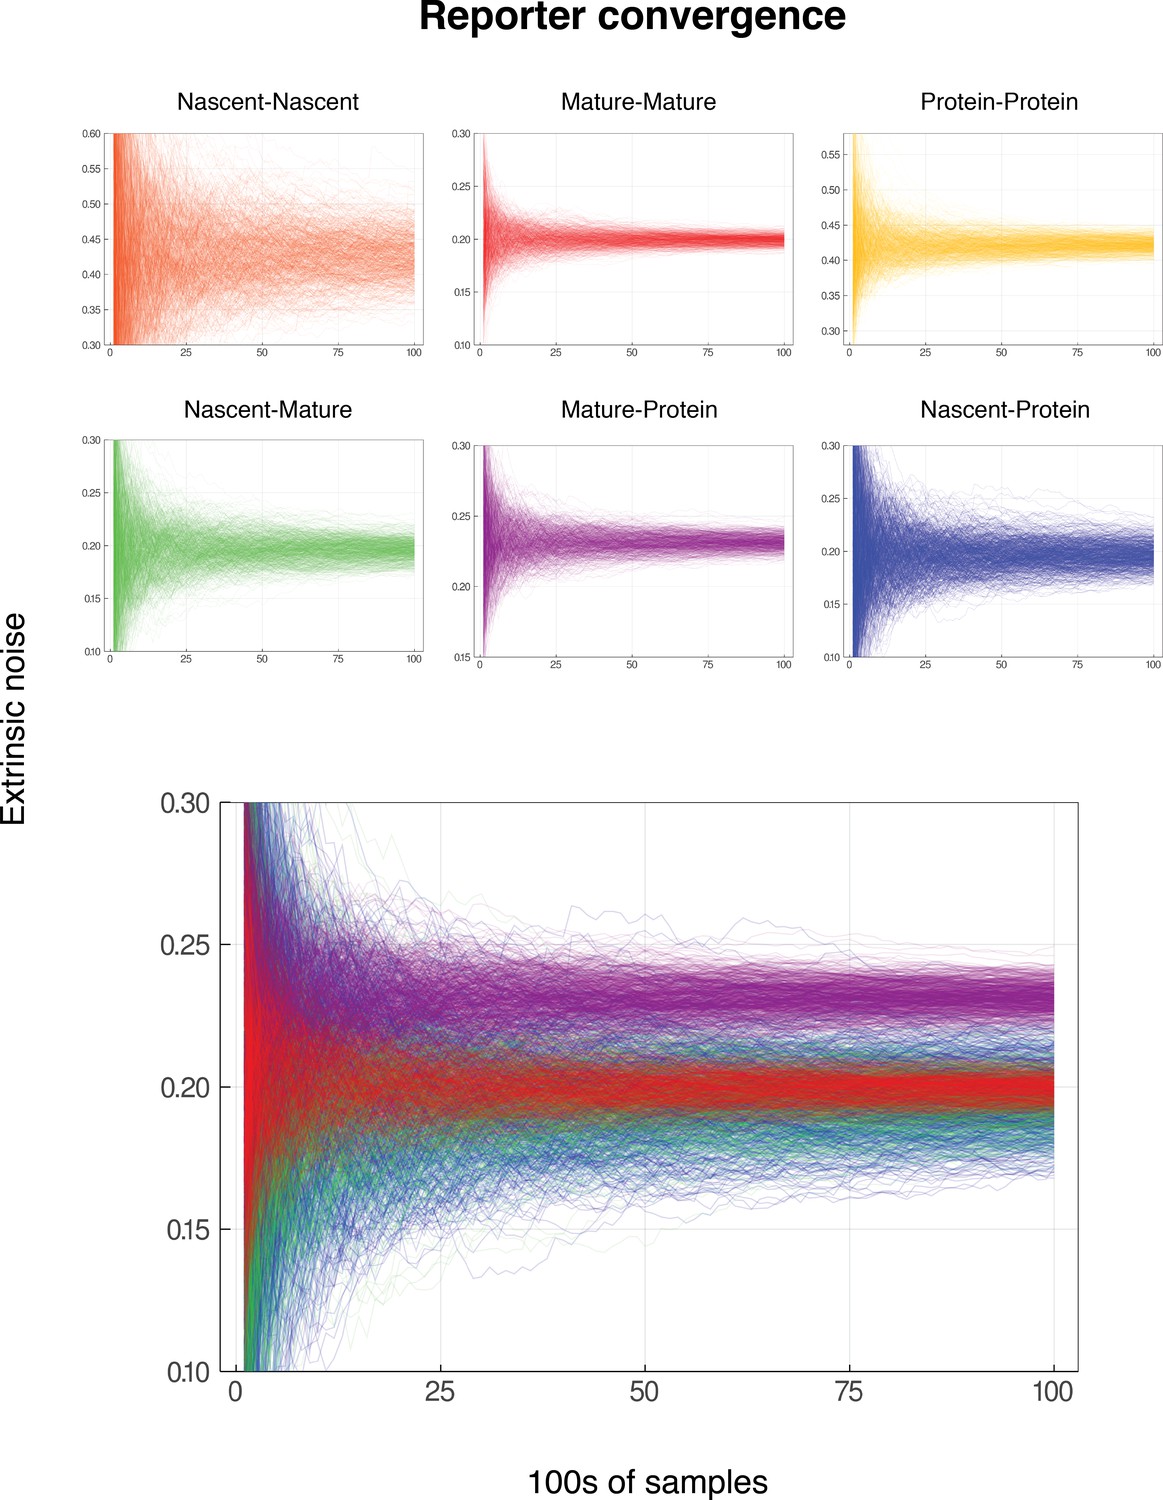
Convergence for reporter pairs for low gene activity.
In each case, the mean nascent mRNA level is 0.5, the mean mature mRNA level of 5, and the mean protein level is 500. The simulated genes are constitutive and noise is on all parameters except for . Each graph shows the convergence of 600 individual reporter simulations, for each combination of reporters from nascent mRNA, mature mRNA and protein. Each reporter simulation is from samples, with the reporter estimates calculated at intervals of 100. The noise on has squared coefficient of variation equal to 0.2, which should be identified by both the nascent-mature reporter and mature-mature dual reporter. As in Figure Convergence of Pathway and Dual Reporters, the mature-protein reporter should converge to an estimate of approximately 0.2315. Nascent-nascent and protein-protein reporters identify combined noise on more parameters, so do not converge to 0.2. The lower graph shows each of nascent-mature, mature-mature, mature-protein and nascent-protein in the same plot for direct comparison.
Tables
Table 1
Summary of the non-identifiability results.
in lines 1, 3, and 5 are our contributions, while the remaining representations (lines 2 and 4) are known and can be obtained as special cases of our results. Note that here we use to denote a Telegraph distribution with parameters . In lines 3 and 4, the parameter can be chosen freely and determines the mean burst intensity in the resulting compound system. In line 5, the parameters are again mean burst intensities, and can be chosen freely in the determination of the distribution of θ.
| Copy no. distribution | Underlying distribution | Noise distribution |
|---|---|---|
Table 2
A comparison of the pathway-reporter method and the dual-reporter method for constitutive expression under the model .
Here, PR (NM) gives the results of the nascent and mature pathway reporters, while DR (Mat) gives the results of dual reporters calculated from the mature mRNA. We considered noise on both the transcription rate () and the maturation rate (). The decay rate is fixed at one, with the other parameters scaled accordingly. In each case, the maturation rate is varied according to a distribution, which has coefficient of variation 0.125. The values given are the average of 100 simulations, each calculated from 500 copy number samples, and the errors are ± one standard deviation. Our theory predicts that pathway-reporters will identify the noise on the nascent transcription rate (). The noise distribution parameters are chosen to produce an average nascent mRNA copy number of approximately five and an average mature mRNA copy number of approximately 50.
| Theory | Simulation | ||
|---|---|---|---|
| (r)1-2 | Noise () | Pr (NM) | DR (Mat) |
| 0.00 | |||
| 0.10 | |||
| 0.20 | |||
| 0.50 | |||
-
Table 2—source data 1
This is an Excel spreadsheet containing the data used to produce the final values in Table 2.
- https://cdn.elifesciences.org/articles/69324/elife-69324-table2-data1-v2.xlsx
Table 3
A comparison of the pathway-reporter method and the dual-reporter method for constitutive expression under the model .
Here PR (MP) gives the results of the mRNA-protien pathway reporters, while DR (Mat) gives the results of dual reporters calculated from the mature mRNA. We considered noise on the transcription rate (), the protein synthesis rate (), and the protein decay rate (). The mRNA decay rate is fixed at one. In each case, we varied according to a distribution and according to a distribution; the corresponding noise strengths are 0.20 and 0.125, respectively. We considered different noise distributions on , which produce a range of noise strengths. The noise distribution parameters are selected to produce a mean mRNA of approximately 50 and a mean number of approximately 1000 proteins in each simulation. The values given are the average of 100 simulations, each calculated from 500 copy number samples, and the errors are ± one standard deviation. As our theory predicts, the mRNA-protein reporters identify the noise on the transcription rate parameter ().
| Theory | Simulation | ||
|---|---|---|---|
| (r)1-2 | Noise () | Pr (MP) | DR (Mat) |
| 0.00 | 0.00 ± 0.00 | ||
| 0.10 | 0.10 ± 0.01 | ||
| 0.20 | |||
| 0.50 | |||
-
Table 3—source data 1
This is an Excel spreadsheet containing the data used to produce the final values in Table 3.
- https://cdn.elifesciences.org/articles/69324/elife-69324-table3-data1-v2.xlsx
Table 4
A comparison of the pathway-reporter method and dual-reporter method for bursty expression.
Here PR (NP) gives the results of the nascent and protein pathway reporters, PR (MP) gives the results of the mRNA and protein reporters, while DR (Mat) gives the results of the dual reporters calculated from the mature mRNA. We consider noise on all of the parameters except for and ; see discussion in main text. The values given are the average of 100 simulations, each calculated from 500 copy number samples, and the errors are ± one standard deviation. Our theory predicts that pathway-reporters will identify the noise at both the promoter level () and transcriptional level (); the total extrinsic noise in each case is given by . As before, the noise distribution parameters are chosen to produce an average nascent mRNA copy number of 5 and an average mature mRNA copy number of 50, and an average number of 1000 proteins.
| Mean | Simulation | ||||||
|---|---|---|---|---|---|---|---|
| (r)1-5 λ | μ | Pr (MP) | Pr (NP) | DR (Mat) | |||
| 0.5 | 1 | 150 | 2 | 0.1 | |||
| 1 | 2 | 150 | 2 | 0.1 | |||
| 1 | 20 | 1050 | 2 | 0.1 | |||
| 2 | 2 | 100 | 6 | 0.3 | |||
| 2 | 20 | 550 | 6 | 0.3 | |||
| 10 | 10 | 100 | 6 | 0.3 | |||
-
Table 4—source data 1
This is an Excel spreadsheet containing the data used to produce the final values in Table 4.
- https://cdn.elifesciences.org/articles/69324/elife-69324-table4-data1-v2.xlsx
Appendix 5—table 1
A comparison of the pathway-reporter method and dual-reporter method for constitutive gene expression with Erlang-distributed maturation times (Case (1)A).
Here, PR (NP) gives the results of the nascent and protein pathway reporters, PR (MP) gives the results of the mRNA and protein reporters, while DR (Mat) gives the results of the dual reporters calculated from the mature mRNA. The maturation time is chosen to be Erlang distributed with mean length , and 0.1, respectively. We consider the rate parameters for the remaining exponentially distributed times to be constant, so that there is no extrinsic noise. The pathway-reporters correctly identify the zero extrinsic noise contribution.
| Parameters | Simulation | ||||||
|---|---|---|---|---|---|---|---|
| (r)1-6 | Pr(NM) | Pr (MP) | Pr (NP) | DR (Mat) | |||
| 300 | 0.1 | ||||||
| 200 | 0.05 | 1 | 0.1 | ||||
| 100 | 0.1 | 2 | 0.1 | ||||
Appendix 5—table 2
A comparison of the pathway-reporter method and dual-reporter method for constitutive gene expression and fixed maturation time (Case (1)B).
For each of the parameters we selected a scaled distribution, with squared coefficient of variation ; the scaling is chosen in each case to achieve a mean value equal to the parameter value. The parameter is given the noise distribution , which has a slightly higher coefficient of variation . In order to benchmark against dual reporters, the maturation time was fixed in each case. The extrinsic noise contribution predicted by the pathway-reporters matches well with the dual reporter values.
| Mean | Simulation | ||||||
|---|---|---|---|---|---|---|---|
| (r)1-4 | Pr(NM) | Pr (MP) | Pr (NP) | DR (Mat) | |||
| 0.05 | 200 | 1 | 0.1 | ||||
| 0.1 | 100 | 2 | 0.1 | ||||
Appendix 5—table 3
A comparison of the pathway-reporter method and dual-reporter method for the multiscale model (Case (2)A above).
We consider fixed parameters values (that is, no extrinsic noise). As our theory predicts, the pathway-reporters correctly identify zero extrinsic noise.
| Parameters | Simulation | |||||||
|---|---|---|---|---|---|---|---|---|
| (r)1-6 | Pr (MP) | Pr (NP) | DR (Mat) | |||||
| 2 | 2 | 400 | 20 | 2 | 0.1 | |||
| 4 | 20 | 1210 | 20 | 2 | 0.1 | |||
Appendix 5—table 4
A comparison of the pathway-reporter method and dual-reporter method for the multiscale model (Case 2.B).
For each of the parameters we selected a scaled distribution, with squared coefficient of variation ; the scaling is chosen in each case to achieve a mean value equal to the parameter value. The parameter is given the noise distribution , which has a slightly higher coefficient of variation . In order to benchmark against dual reporters, the maturation rate was fixed at 20. As our theory suggests, the extrinsic noise contribution predicted by the pathway reporters matches well with the dual-reporter values.
| Mean | Simulation | ||||||
|---|---|---|---|---|---|---|---|
| (r)1-5 | Pr (MP) | Pr (NP) | DR (Mat) | ||||
| 2 | 2 | 400 | 2 | 0.1 | |||
| 4 | 20 | 1210 | 2 | 0.1 | |||
Appendix 5—table 5
A comparison of the pathway-reporter method and dual-reporter method for the multiscale model with a fixed duration of maturation (Case (3)A).
Here the time to maturation is chosen to be consistent with the mean of the stochastic maturation time used in our other models (where the maturation time is exponentially distributed). We consider all rate parameters to be constant, that is, there is no extrinsic noise. Pathway-reporters correctly identify the zero extrinsic noise contribution.
| Parameters | Simulation | |||||||
|---|---|---|---|---|---|---|---|---|
| (r)1-6 | Pr (MP) | Pr (NP) | DR (Mat) | |||||
| 2 | 2 | 400 | 0.05 | 2 | 0.1 | |||
| 4 | 20 | 1210 | 0.05 | 2 | 0.1 | |||
Appendix 5—table 6
A comparison of the pathway-reporter method and dual-reporter method for the multiscale model with a fixed duration of maturation (Case (3)B).
Here the maturation time, , is set to 0.05. For each of the parameters , we selected a scaled distribution, with squared coefficient of variation ; the scaling is chosen in each case to achieve a mean value equal to the parameter value. The parameter is given the noise distribution , which has a slightly higher coefficient of variation . The extrinsic noise values given by pathway reporters match well with those obtained by dual reporters.
| Mean | Simulation | ||||||
|---|---|---|---|---|---|---|---|
| (r)1-5 | Pr (MP) | Pr (NP) | DR (Mat) | ||||
| 2 | 2 | 400 | 2 | 0.1 | |||
| 4 | 20 | 1210 | 2 | 0.1 | |||
Appendix 5—table 7
A comparison of the pathway-reporter method and dual-reporter method for the multiscale model with Erlang-distributed maturation times and cell-cycle effects (Case (4)A).
Here, the time to maturation, , is chosen to be consistent with the mean of the stochastic maturation time used in our other models (where the maturation time is exponentially distributed). Specifically, we choose , with mean length , matching our earlier benchmarking using exponentially-distributed maturation time, with mean length 0.05. We consider the rate parameters for the remaining exponentially distributed times to be constant, that is, there is no extrinsic noise beyond that contributed by the cell-cycle effects.
| Parameters | Simulation | ||||||
|---|---|---|---|---|---|---|---|
| (r)1-5 | Pr (MP) | Pr (NP) | DR (Mat) | ||||
| 2 | 2 | 400 | 2 | 0.1 | |||
| 4 | 20 | 1210 | 2 | 0.1 | |||
Appendix 5—table 8
A comparison of the pathway-reporter method and dual-reporter method for the multiscale model with Erlang-distributed maturation times and cell-cycle effects (Case (4)B).
The Erlang distributed maturation time is chosen as in Appendix 5—tables 7. For each of the parameters , we selected a scaled distribution, with squared coefficient of variation ; the scaling is chosen in each case to achieve a mean value equal to the parameter value. The parameter is given the noise distribution , which has a slightly higher coefficient of variation .
| Means | Simulation | |||||||
|---|---|---|---|---|---|---|---|---|
| (r)1-6 | Pr (MP) | Pr (NP) | DR (Mat) | |||||
| 2 | 2 | 400 | 0.05 | 2 | 0.1 | |||
| 4 | 20 | 1210 | 0.05 | 2 | 0.1 | |||
Additional files
-
Supplementary file 1
Simulation results of the pathway-reporter method for constitutive genes across 60 different parameter values.
We consider noise on all of the parameters except mRNA decay in a constitutive model with mRNA maturation and protein translation. Refer to the excel spreadsheet ConstitutiveaResults.xlsx for full details of the simulation, including the chosen noise distributions and parameters.
- https://cdn.elifesciences.org/articles/69324/elife-69324-supp1-v2.xlsx
-
Supplementary file 2
Simulation results for the overshoot estimate in the pathway-reporter method for bursty genes across 448 different parameter values.
Refer to the excel spreadsheet NoiseFreeaResults.xlsx for full details of the simulation, including the chosen noise distributions and parameters.
- https://cdn.elifesciences.org/articles/69324/elife-69324-supp2-v2.xlsx
-
Transparent reporting form
- https://cdn.elifesciences.org/articles/69324/elife-69324-transrepform-v2.pdf
Download links
A two-part list of links to download the article, or parts of the article, in various formats.
Downloads (link to download the article as PDF)
Open citations (links to open the citations from this article in various online reference manager services)
Cite this article (links to download the citations from this article in formats compatible with various reference manager tools)
Pathway dynamics can delineate the sources of transcriptional noise in gene expression
eLife 10:e69324.
https://doi.org/10.7554/eLife.69324


