The entorhinal cortex modulates trace fear memory formation and neuroplasticity in the mouse lateral amygdala via cholecystokinin
- Departments of Neuroscience and Biomedical Sciences, City University of Hong Kong, China
- Centre for Regenerative Medicine and Health, Hong Kong Institute of Science & Innovation, Chinese Academy of Sciences, China
- City University of Hong Kong Shenzhen Research Institute, China
Figures
Figure 1 with 1 supplement
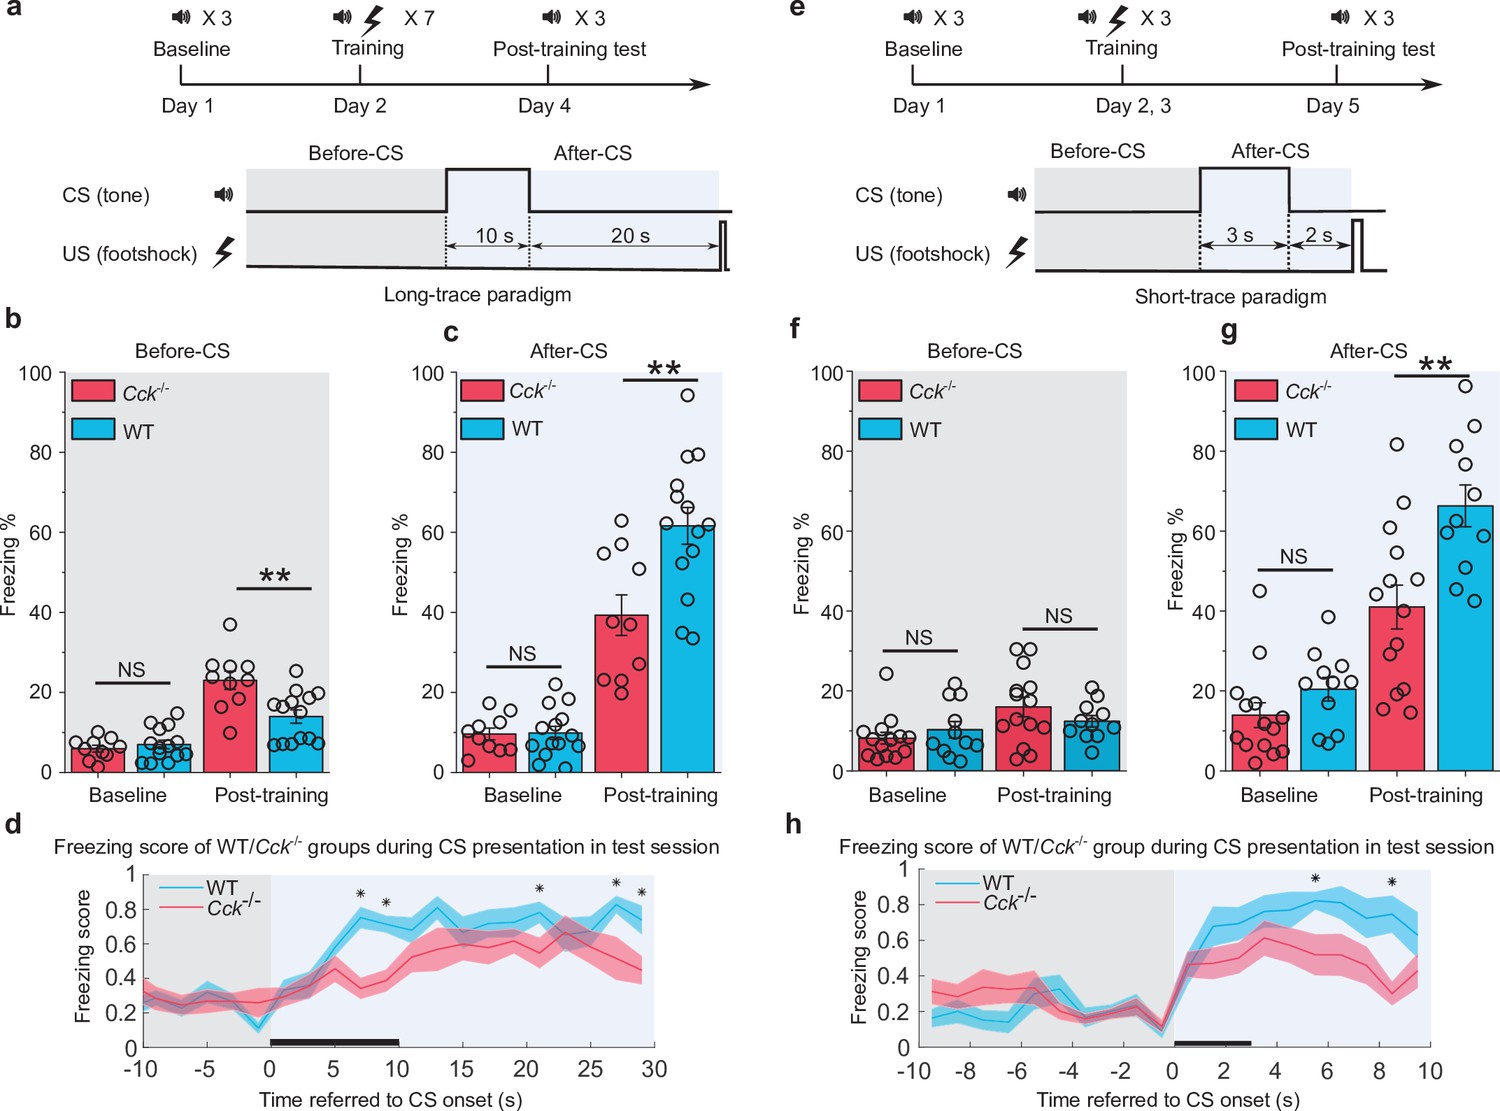
Trace fear memory formation deficit in Cck-/- mice.
(a) Schematic diagram of the fear conditioning paradigm with a long trace interval of 20 s. Gray and light blue shadowed areas indicate the time frames before and after the onset of the CS (before-CS, after-CS). CS, conditioned stimulus; US, unconditioned stimulus. (b–c) Freezing percentages before (b) and after (c) the CS. Freezing percentages were recorded at baseline on the pre-conditioning day and post-training on the post-conditioning day. WT, wildtype, N = 14; Cck-/-, CCK-knockout, N = 10. *p < 0.05; **p < 0.01; ***p < 0.001; NS, not significant. Statistical significance was determined by two-way RM ANOVA with Bonferroni post hoc pairwise comparison. RM ANOVA, repeated-measures analysis of variance. (d) Freezing score plot of the two groups of mice during the testing session. The freezing score was binned in a 2 s interval. Solid lines indicate the mean value, and shadowed areas indicate the SEM. The black bar indicates the presence of the CS from 0 to 10 s. Two-way RM ANOVA with a Greenhouse-Geisser correction, interaction significant, F(8.214, 180.716) = 2.149, p < 0.05; post hoc Bonferroni multiple pairwise comparisons between two groups in each bin, *p < 0.05. SEM, standard error of the mean. (e) Schematic diagram of the fear conditioning paradigm with a short-trace interval of 2 s. (f–g) Freezing percentages before (f) and after (g) the CS. WT, N = 11; Cck-/-, N = 14. (h) Freezing score plot of the two groups of mice during the testing session. Freezing score was binned in a 1 s interval. The black bar indicates the presence of the CS from 0 to 3 s. Two-way RM ANOVA with a Greenhouse-Geisser correction, interaction significant, F(8.093, 186.145) = 2.499, p < 0.05; post hoc Bonferroni multiple comparisons in each bin, *p < 0.05.
-
Figure 1—source data 1
Summary of freezing percentage in long and short trace fear conditioning.
- https://cdn.elifesciences.org/articles/69333/elife-69333-fig1-data1-v2.xlsx
Figure 1—figure supplement 1
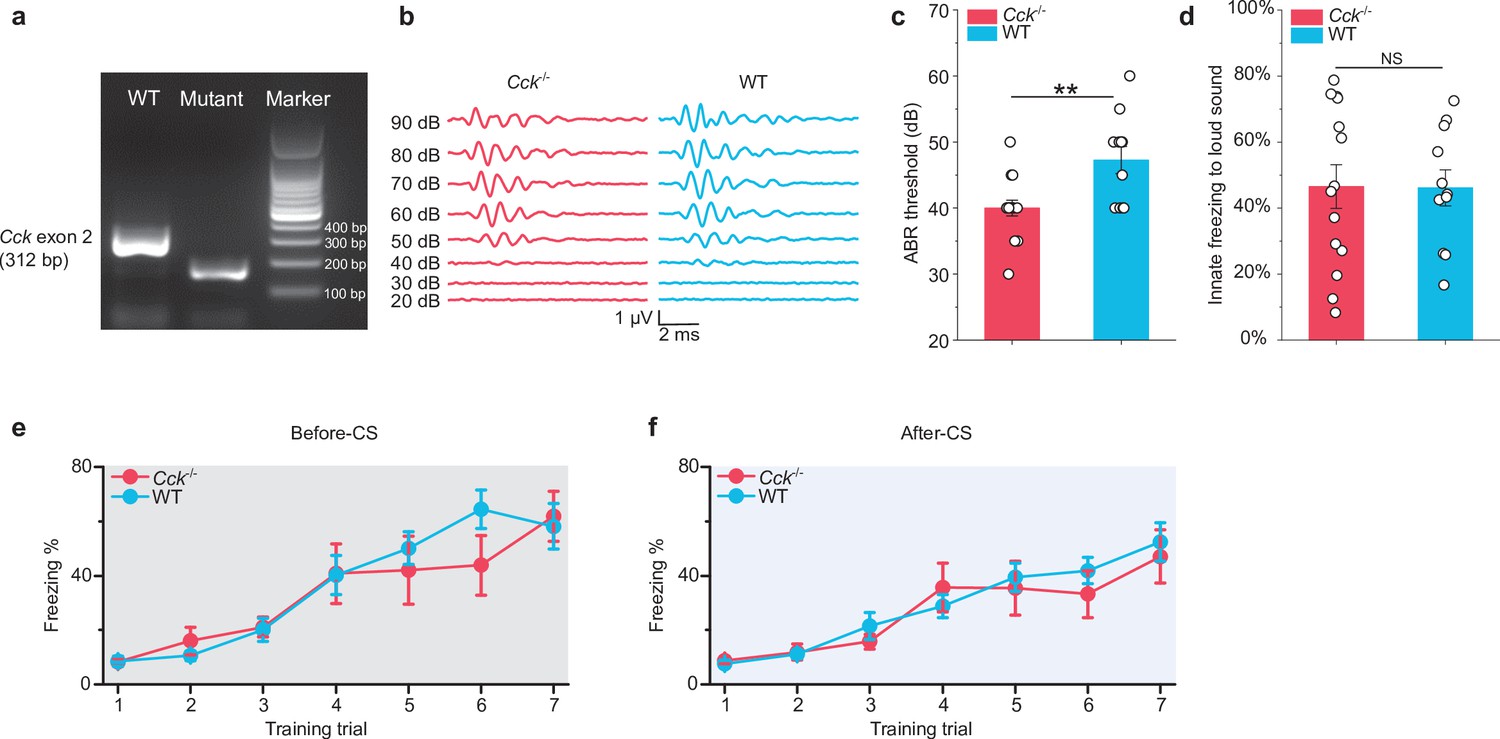
Genetic and behavioral examination of Cck-/- mice.
(a) PCR-based genotyping results showing the absence of the Cck exon 2 (312 bp) fragment in the mutant sample. The band in the mutant sample is a fragment of the CreER gene. (b) Representative auditory brainstem response (ABR) traces from a Cck-/- mouse and a wildtype (WT) mouse, respectively. (c) ABR thresholds in WT (N = 11) and Cck-/- (N = 15) mice. **p < 0.01; two-sample t-test. (d) Innate freezing levels in WT (N = 14) and Cck-/- (N = 10) mice. NS, not significant; p > 0.05; two-sample t-test. (e–f) Trial-by-trial freezing percentage before (e) and after (f) CS presentation during training session in long-trace fear conditioning parading between Cck-/- (N = 10) and WT (N = 14) mice. After, and even before, the CS presentation, both Cck-/- and WT mice developed a progressive increase in freezing behavior. These acquisition curves indicate a gradual reduction in the mobility of mice from two groups during the training, which is most likely due to the mice’s helplessness or exhaustion.
Figure 2 with 1 supplement

Neural plasticity deficit in the LA of Cck-/- mice and the rescuing effect of exogenous cholecystokinin (CCK).
(a) Schematic diagram of in vivo recording in the LA. EC, entorhinal cortex; LA, lateral amygdala. STI, stimulation. REC, recording. (b) Post hoc verification of electrode tracks and recording area. (c) Representative AEP traces in response to different levels of noise stimulus. AEP, auditory evoked potential. (d) Representative traces of multiunit spikes to different levels of noise stimulus. (e) Representative input/output (I/O) curve of the slope of AEP vs. noise intensity. fEPSP, field excitatory postsynaptic potential. (f) Schematic diagram of the pairing protocol to induce LTP of AEP via theta-burst stimulation (TBS). LTP, long-term potentiation; ES, electrical stimulation; AS, auditory stimulation. (g) Time course plot of the normalized AEP slope during LTP. The wildtype (WT) group is indicated in black, and the Cck-/- in red. Representative traces of the AEP before (dotted line) and after (solid line) TBS are shown in inset panels for both groups. The average normalized slopes 10 min before pairing (−10–0 min, before) and 10 min after pairing (50–60 min, after) in the two groups of mice are shown on the right. **p < 0.01; two-way RM ANOVA with post hoc Bonferroni pairwise comparison; RM ANOVA, repeated-measures analysis of variance; NS, not significant. (h) Immunofluorescent staining of CCK B receptor (CCKBR) in brain slices from WT, Cck-/-, CCKBR-KO, and CCKAB-KO mice. Magnified images are shown on the right. CCKBR-KO, CCK B receptor knock-out mouse; CCKAB-KO, CCK A receptor and B receptor double knock-out mouse. (i) Experimental timeline for (j–o). (j) Schematic diagram of the CS-US presentation. Gray and light blue shadowed areas indicate the time frames before and after CS presentation (before-CS, after-CS). (k–l) Freezing percentages before (k) and after (l) the CS during fear conditioning training on training day. Animals underwent six trials during a 2-day training (days 2 and 3). Two-way RM ANOVA with Bonferroni pairwise comparison, *p < 0.05. (m–n) Freezing percentages before (m) and after (n) the CS on the pre-training day (baseline) and the post-training day. CCK-4, N = 6; VEH, N = 7; *p < 0.05; NS, not significant; two-way RM ANOVA with Bonferroni post hoc pairwise test; RM ANOVA, repeated-measures analysis of variance. (o) Freezing score plot of the two groups of mice during the testing session on day 5. Solid lines indicate the mean value, and shadowed areas indicate the SEM. The black bar indicates the presence of the CS from 0 to 3 s. Two-way RM ANOVA with a Huynh-Feldt correction, interaction significant, F(17.22, 189.417) = 1.932, p = 0.017 < 0.05; post hoc Bonferroni multiple comparisons, *p < 0.05.
-
Figure 2—source data 1
AEP-LTP induction in WT and CCK-KO mice.
- https://cdn.elifesciences.org/articles/69333/elife-69333-fig2-data1-v2.xlsx
Figure 2—figure supplement 1
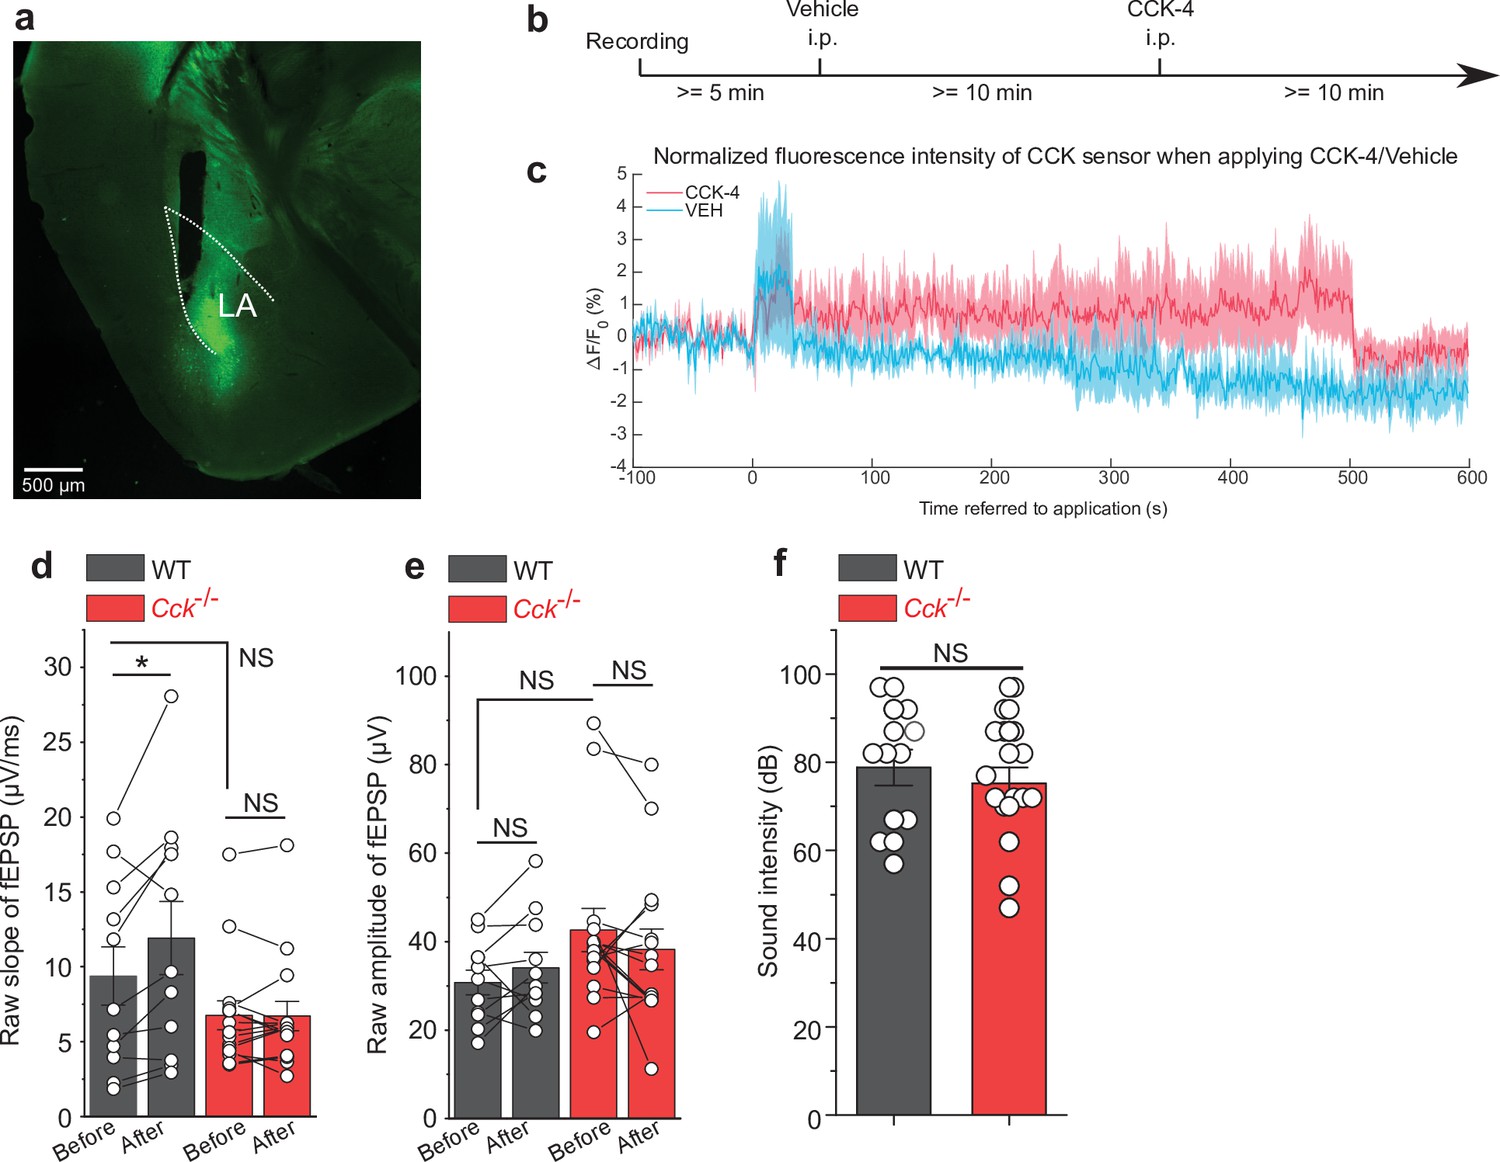
Exogenous cholecystokinin-tetrapeptide (CCK-4) activates CCK B receptor (CCKBR) in the lateral nuclei of the amygdala (LA).
(a) Verification of CCK-sensor2.0 expression and the optic fiber track in the LA. (b) Timeline of the experiment. (c) Traces of fluorescence signal of the CCK-sensor before and after the peripheral application (intraperitoneal injection) of CCK-4 (5 mM, 200 μL, N = 3) or vehicle (VEH, N = 3). Fluorescence signal was measured by fiber photometry with an implanted optical fiber in the LA. Data was shown as the mean value in solid line and SEM in shadow area. Fluorescent signal had a gradual decrease across time due to the photobleaching effect. The short-term increase of the fluorescence immediately after the saline or CCK-4 injection was interpreted as the injection artifact. (d-e) The raw slope (d) and amplitude (e) before and after LTP induction in Figure 2. Raw slope was significantly higher after LTP induction, while the change in raw amplitude was not statistically significant. Both amplitude and slope had no statistical difference between two groups before LTP induction. *p < 0.05, NS, not significant, two-way RM ANOVA with Bonferroni pairwise comparison. (f) The sound intensity used in each AEP recording before and after LTP induction in Figure 2. NS, not significant, two-sample t-test.
Figure 3 with 1 supplement
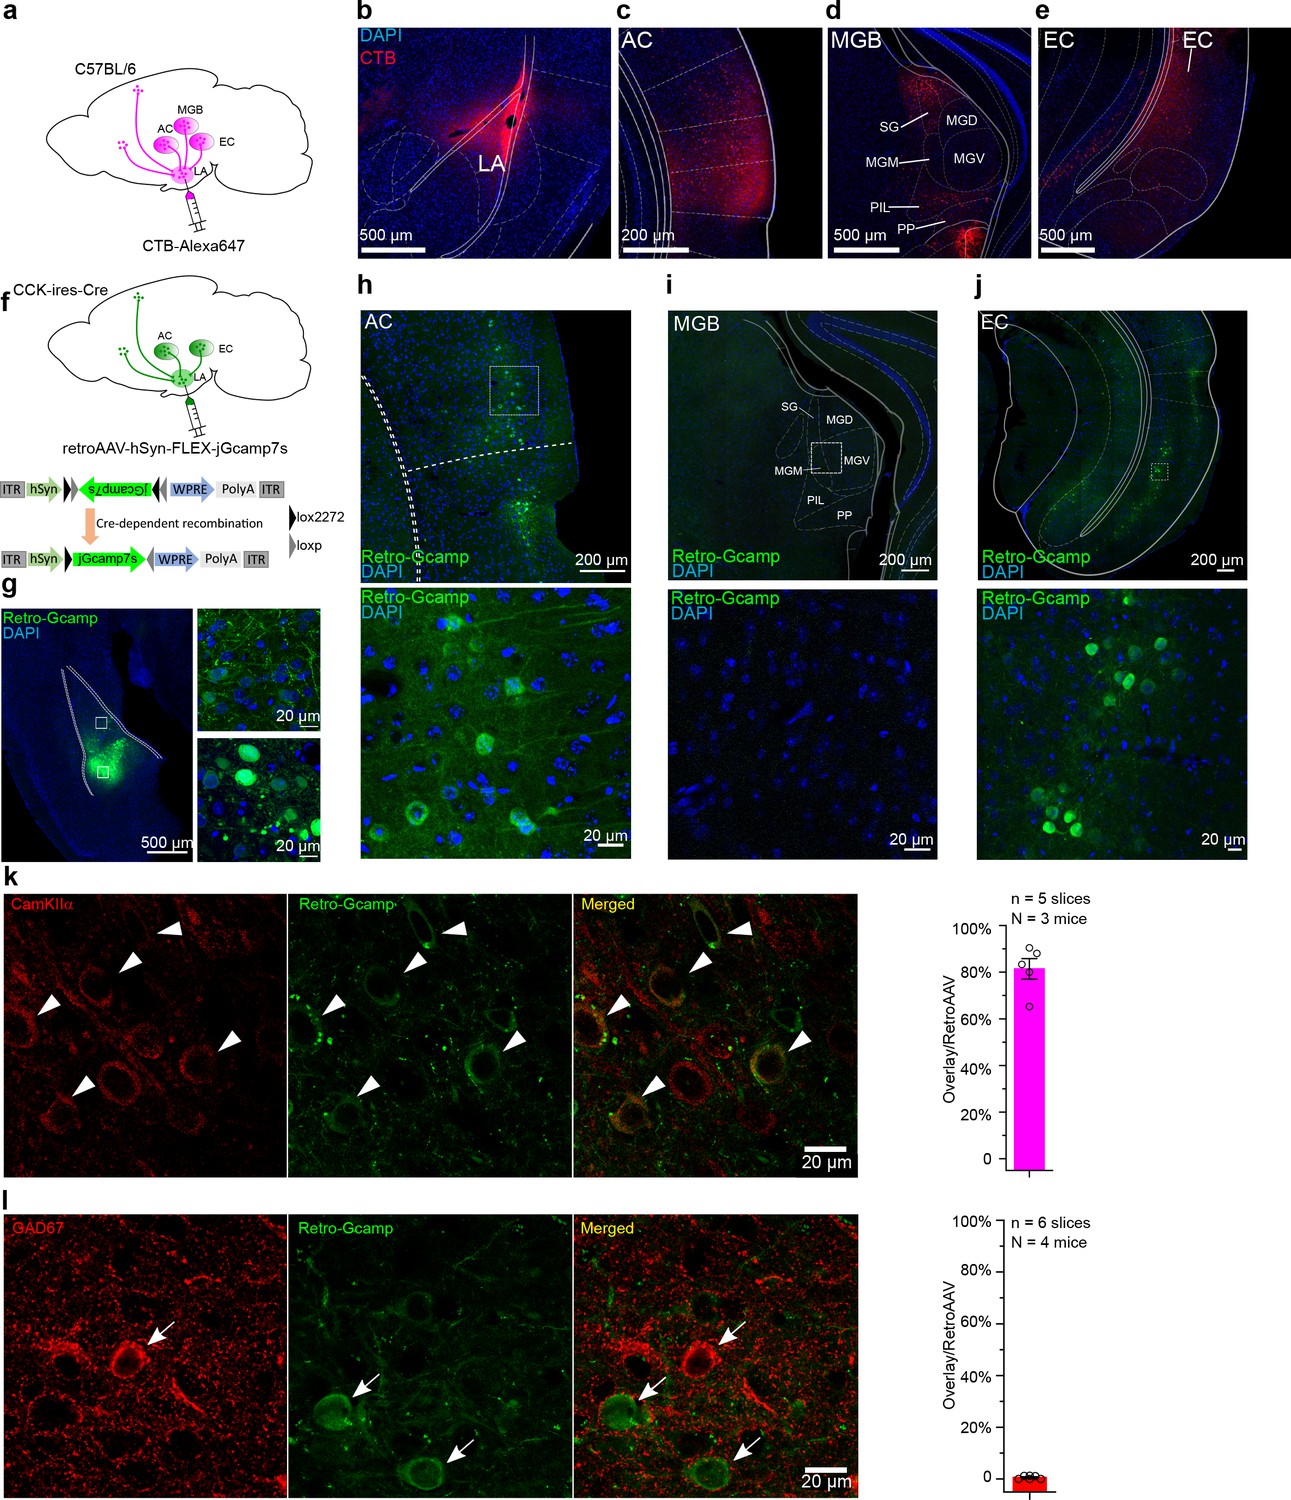
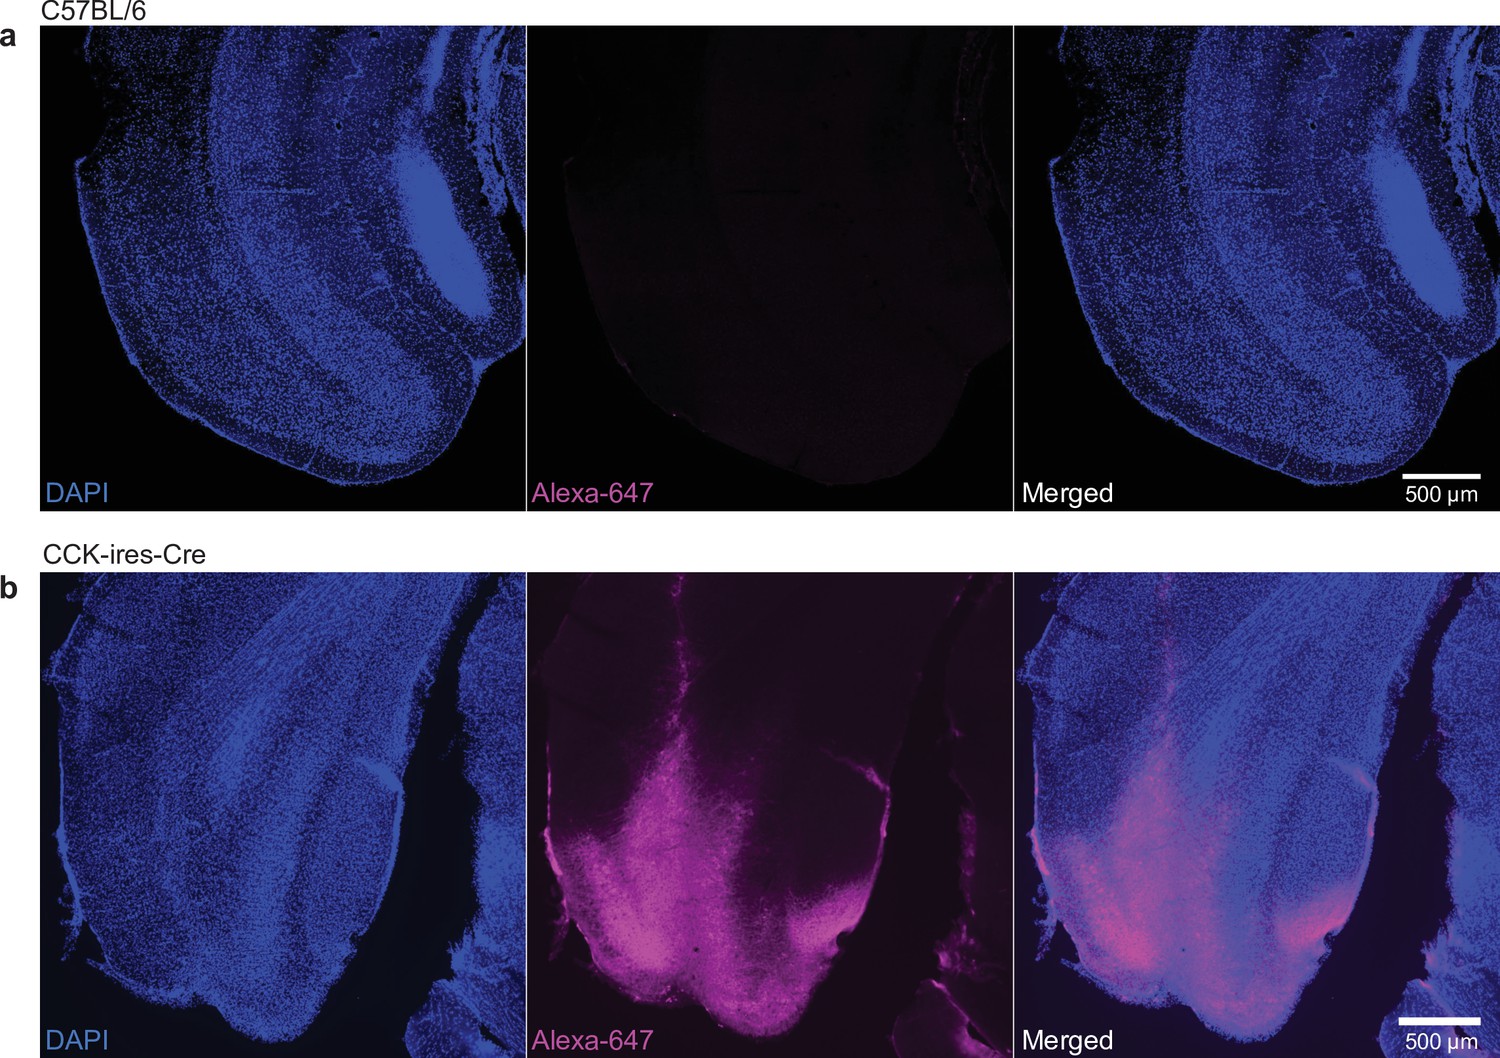
Dissection of inputs of the lateral nuclei of the amygdala (LA) with retrograde tracer and virus.
(a) Schematic diagram of retrograde tracing with Alexa647-conjugated cholera toxin subunit B (CTB). (b–e) Representative fluorescent images of the injection site of the CTB tracer (b), the canonical upstream regions, including the auditory cortex (c) and the auditory thalamus (d), and the non-canonical entorhinal cortex (e). AC, auditory cortex; MGB, medial geniculate body; SG, suprageniculate thalamic nucleus; MGM, medial MGB; PIL, posterior intralaminar thalamic nucleus; PP, peripeduncular nucleus; EC, entorhinal cortex. (f) Schematic diagram of cell type-specific retrograde tracing with Cre-dependent retrograde AAV (retroAAV-hSyn-FLEX-jGcamp7s). (g) Verification of the injection site in the LA. Magnified images are shown in insets on the right. Retro-Gcamp, retrograde jGcamp7s signal. (h–j) Retrograde signals in the AC (h), MGB (i), and EC (j). Magnified images are shown in the bottom insets. (k–l) Co-immunofluorescent staining of retrograde tracing of the LA with either the excitatory neuronal marker CamKIIα (k) or the inhibitory neuronal marker GAD67 (l). Bar charts showing the proportion of CamKIIα or GAD67-positive neurons in retroAAV-labeled ones are placed in the right panel accordingly.
-
Figure 3—source data 1
Summary of colocalization between Retro-Gcamp and CamKIIα or GAD67.
- https://cdn.elifesciences.org/articles/69333/elife-69333-fig3-data1-v2.xlsx
Figure 3—figure supplement 1
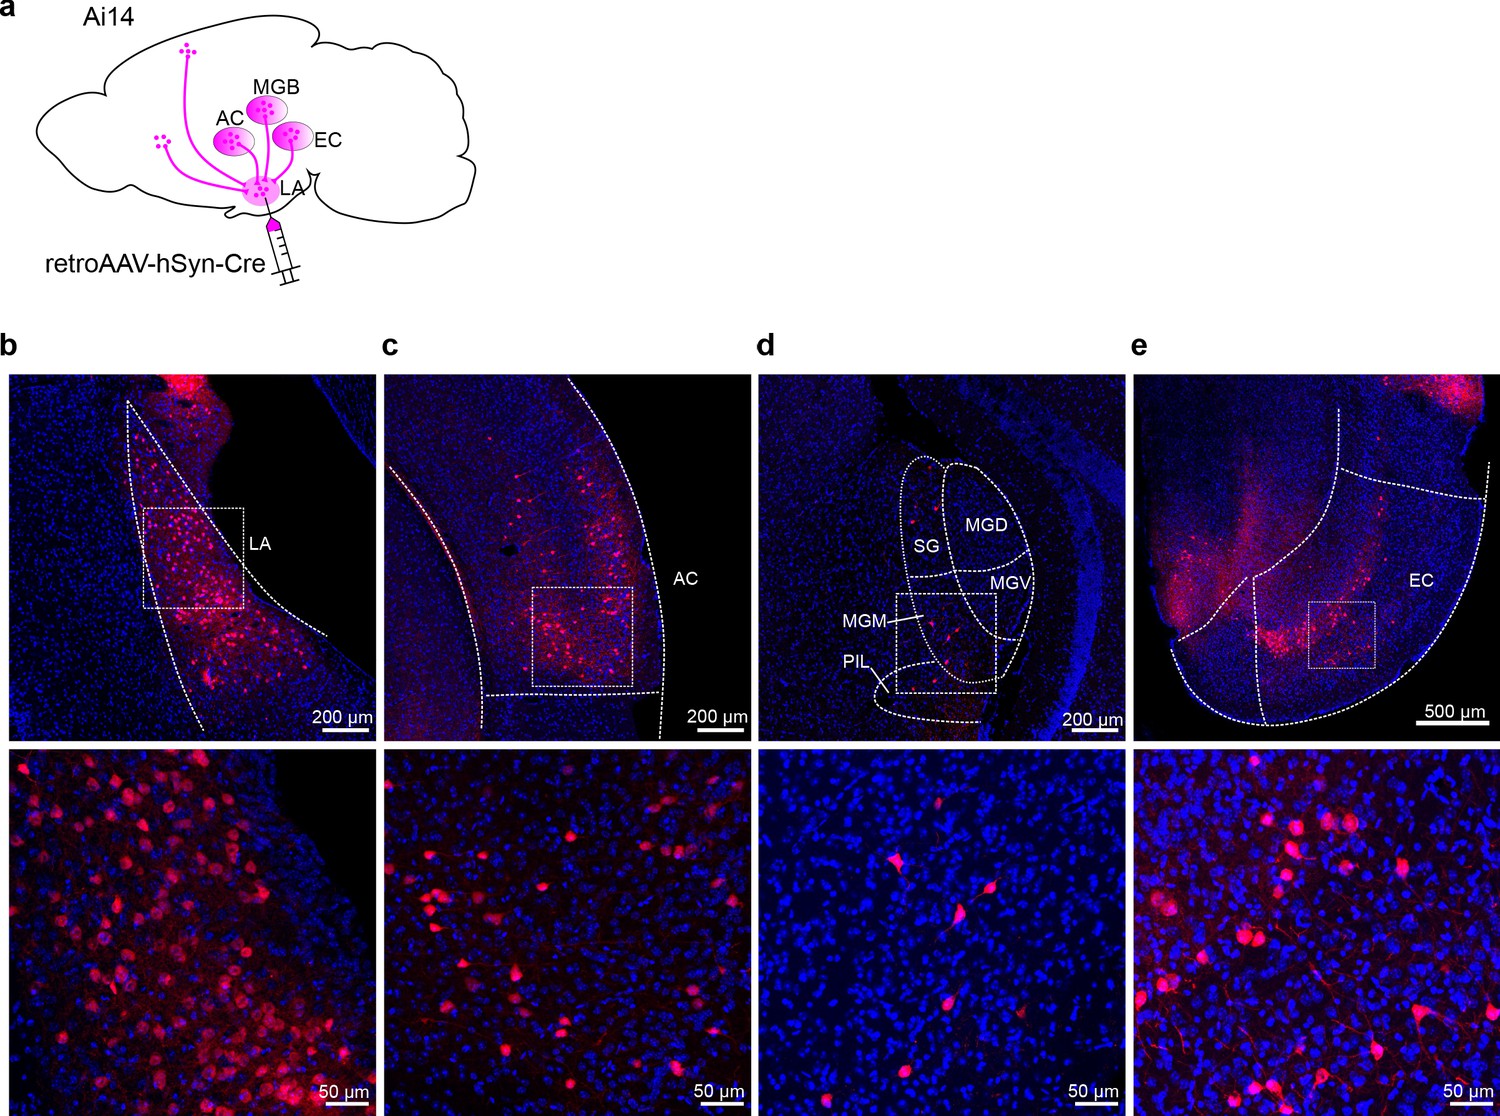
Retrograde labeling of inputs of the lateral nuclei of the amygdala (LA).
(a) Schematic diagram of retrograde labeling by injecting RetroAAV carrying Cre recombinase in Ai14 Cre-dependent tdTomato reporter mice. (b–e) Representative fluorescent images of the injection site of the retroAAV (b), the canonical upstream regions, including the auditory cortex (c) and the auditory thalamus (d), and the non-canonical entorhinal cortex (e). AC, auditory cortex; MGB, medial geniculate body; SG, suprageniculate thalamic nucleus; MGD, dorsal part of MGB; MGV, ventral part of MGB; MGM, medial part of MGB; PIL, posterior intralaminar thalamic nucleus; PP, peripeduncular nucleus; EC, entorhinal cortex.
Figure 4 with 1 supplement
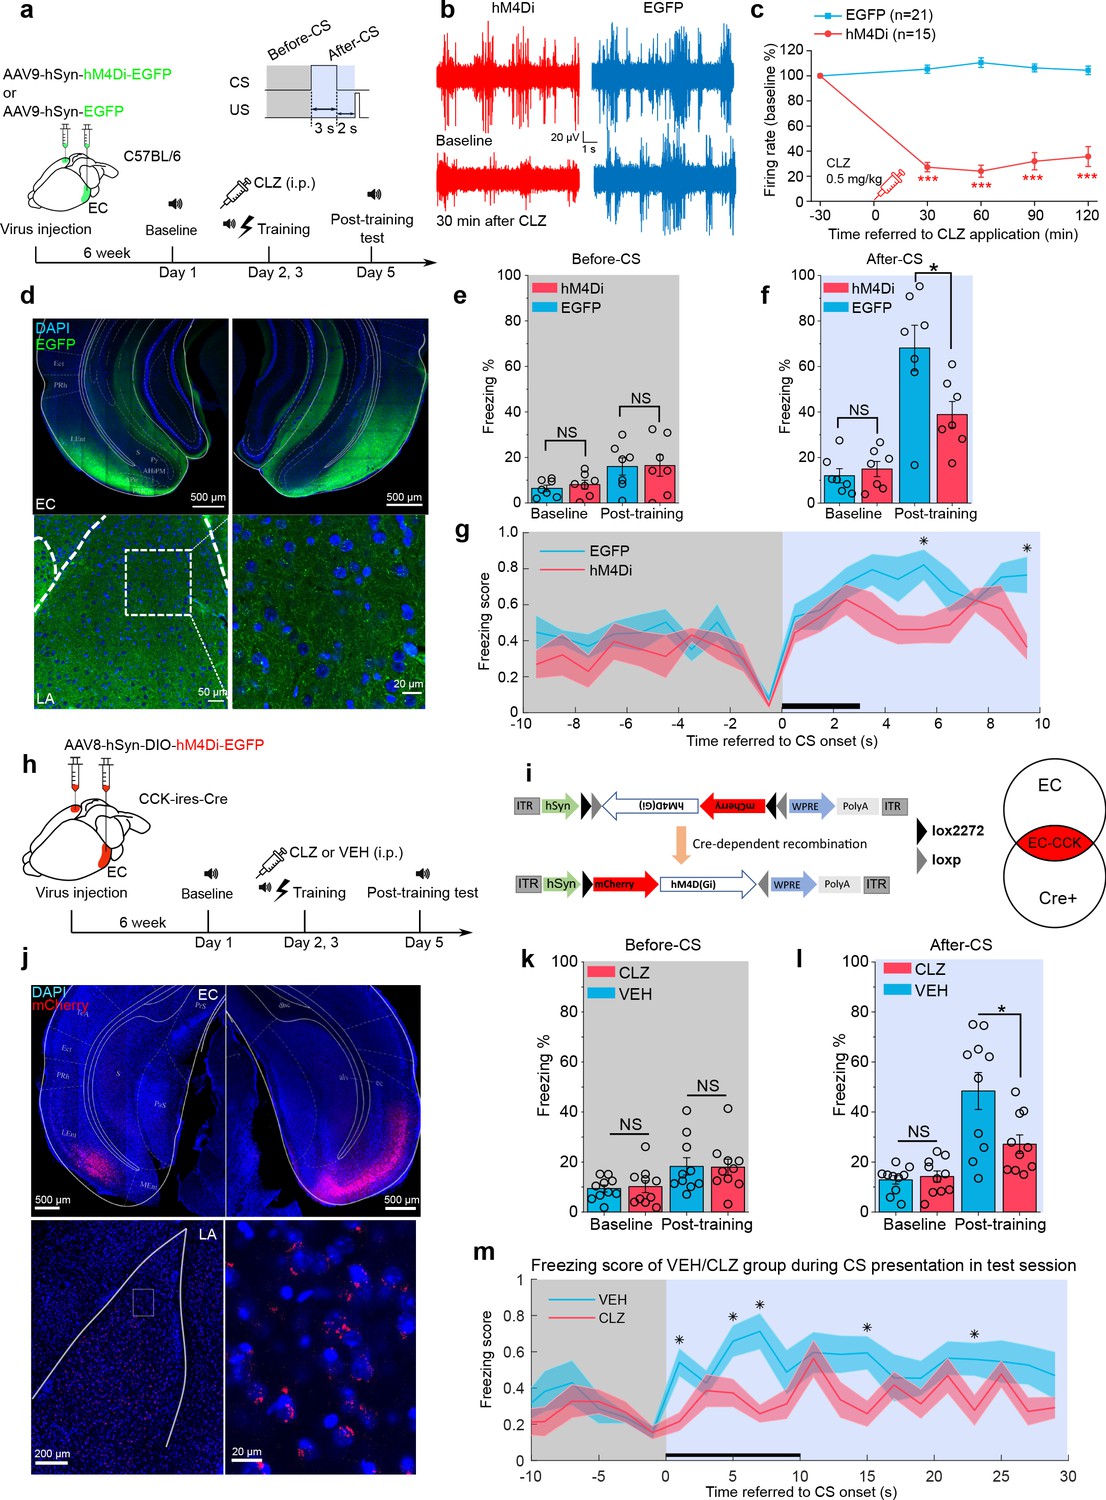
Formation of trace fear memory is suppressed by chemogenetic inhibition of the entorhinal cortex (EC) and cholecystokinin (CCK)-positive EC neurons.
(a) Schematic diagram of trace fear conditioning and chemogenetic inhibition of the EC. EC, entorhinal cortex; hM4Di, inhibitory designer receptors exclusively activated by designer drugs (DREADD) receptor; CLZ, clozapine. (b) Representative traces of extracellular recording in the EC before and after systemic application of CLZ in hM4Di-expressing (red) and EGFP-expressing mice (blue). (c) Normalized firing rate of the EC neurons before and after systemic CLZ application. ***p < 0.001; two-sample t-test. (d) Verification of viral expression in the bilateral EC (top panel) and the EC-LA projection (bottom left panel). A magnified image of the EC-LA projection is shown in the bottom right inset. (e–f) Freezing percentages before (e) and after (f) the conditioned stimulus (CS) during the testing session in hM4Di-expressing (N = 7) or EGFP-expressing mice (N = 7). *p < 0.05; NS, not significant; two-way RM ANOVA with Bonferroni post hoc pairwise test; RM ANOVA, repeated-measures analysis of variance. (g) Freezing score plot of hM4Di-expressing and EGFP-expressing mice during the testing session. Solid lines indicate the mean value and shadowed areas indicate the SEM. The black bar indicates the presence of the CS from 0 to 3 s. *p < 0.05, two-way RM ANOVA with post hoc Bonferroni multiple pairwise comparisons; SEM, standard error of the mean. (h–i) Schematic diagrams of chemogenetic CCK inhibition in the EC. Cre-dependent hM4Di was expressed in CCK-Cre mice. After Cre-mediated recombination, CCK neurons in the EC were transfected with hM4Di. (j) Verification of viral expression in the bilateral EC (top panel) and the EC-LA projection (bottom left panel). A magnified image of the EC-LA projection is shown in the bottom right inset. (k–l) Freezing percentages before (k) and after (l) the CS during the testing session in mice treated with CLZ or vehicle (VEH). *p < 0.05, two-way RM ANOVA with Bonferroni post hoc pairwise test; NS, not significant. (m) Freezing score plot of CLZ- and VEH-treated mice during the testing session. The black bar indicates the presence of the CS from 0 to 10 s. *p < 0.05, two-way RM ANOVA with post hoc Bonferroni multiple pairwise comparisons; SEM, standard error of the mean.
-
Figure 4—source data 1
Summary of freezing percentage in mice with chemogenetic inhibition of the EC and EC-CCK neurons.
- https://cdn.elifesciences.org/articles/69333/elife-69333-fig4-data1-v2.xlsx
Figure 4—figure supplement 1
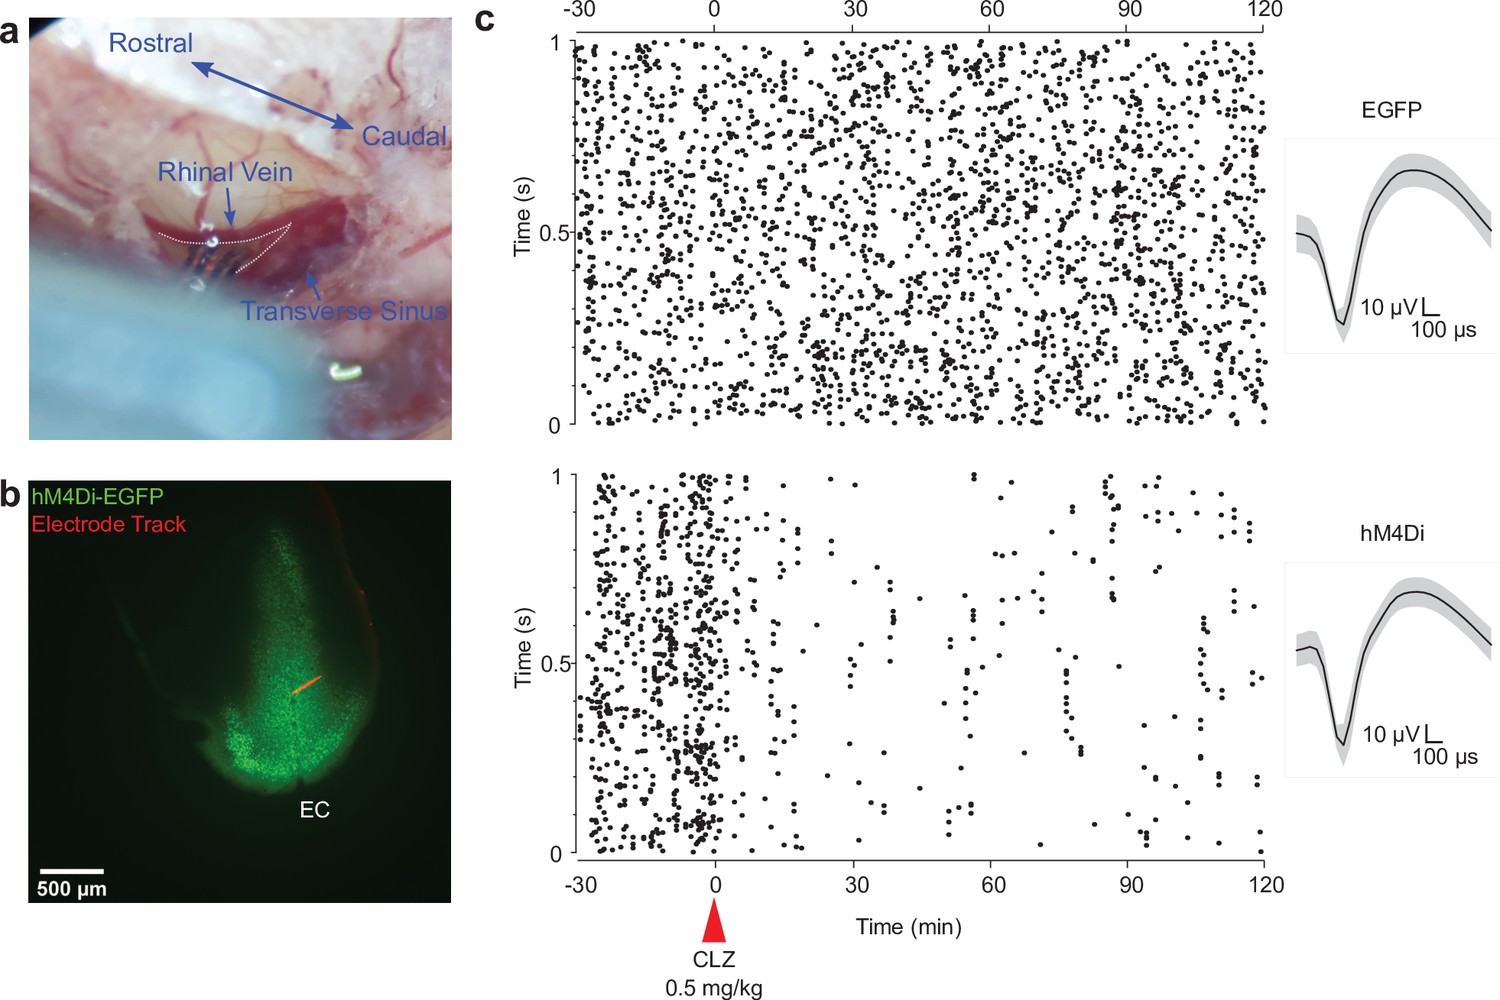
Verification of chemogenetic suppression in the entorhinal cortex (EC) via in vivo electrophysiological recording.
(a) Image showing the location of the in vivo recording in the mouse. The caudal rhinal vein and the transverse sinus were landmarks. The triangular area between these two veins (area defined by gray dotted line) was used to target the EC. (b) Post hoc verification of hM4Di-EGFP viral expression and the electrode track, which was visualized using Alexa594-conjugated cholera toxin subunit B (CTB). (c) Representative raster plots of single-unit firings in the EC before and after intraperitoneal clozapine (CLZ) application in hM4Di-expressing (hM4Di, bottom) and EGFP-expressing (EGFP, up) mice. Waveforms of these two representative units are shown on the right.
Figure 5
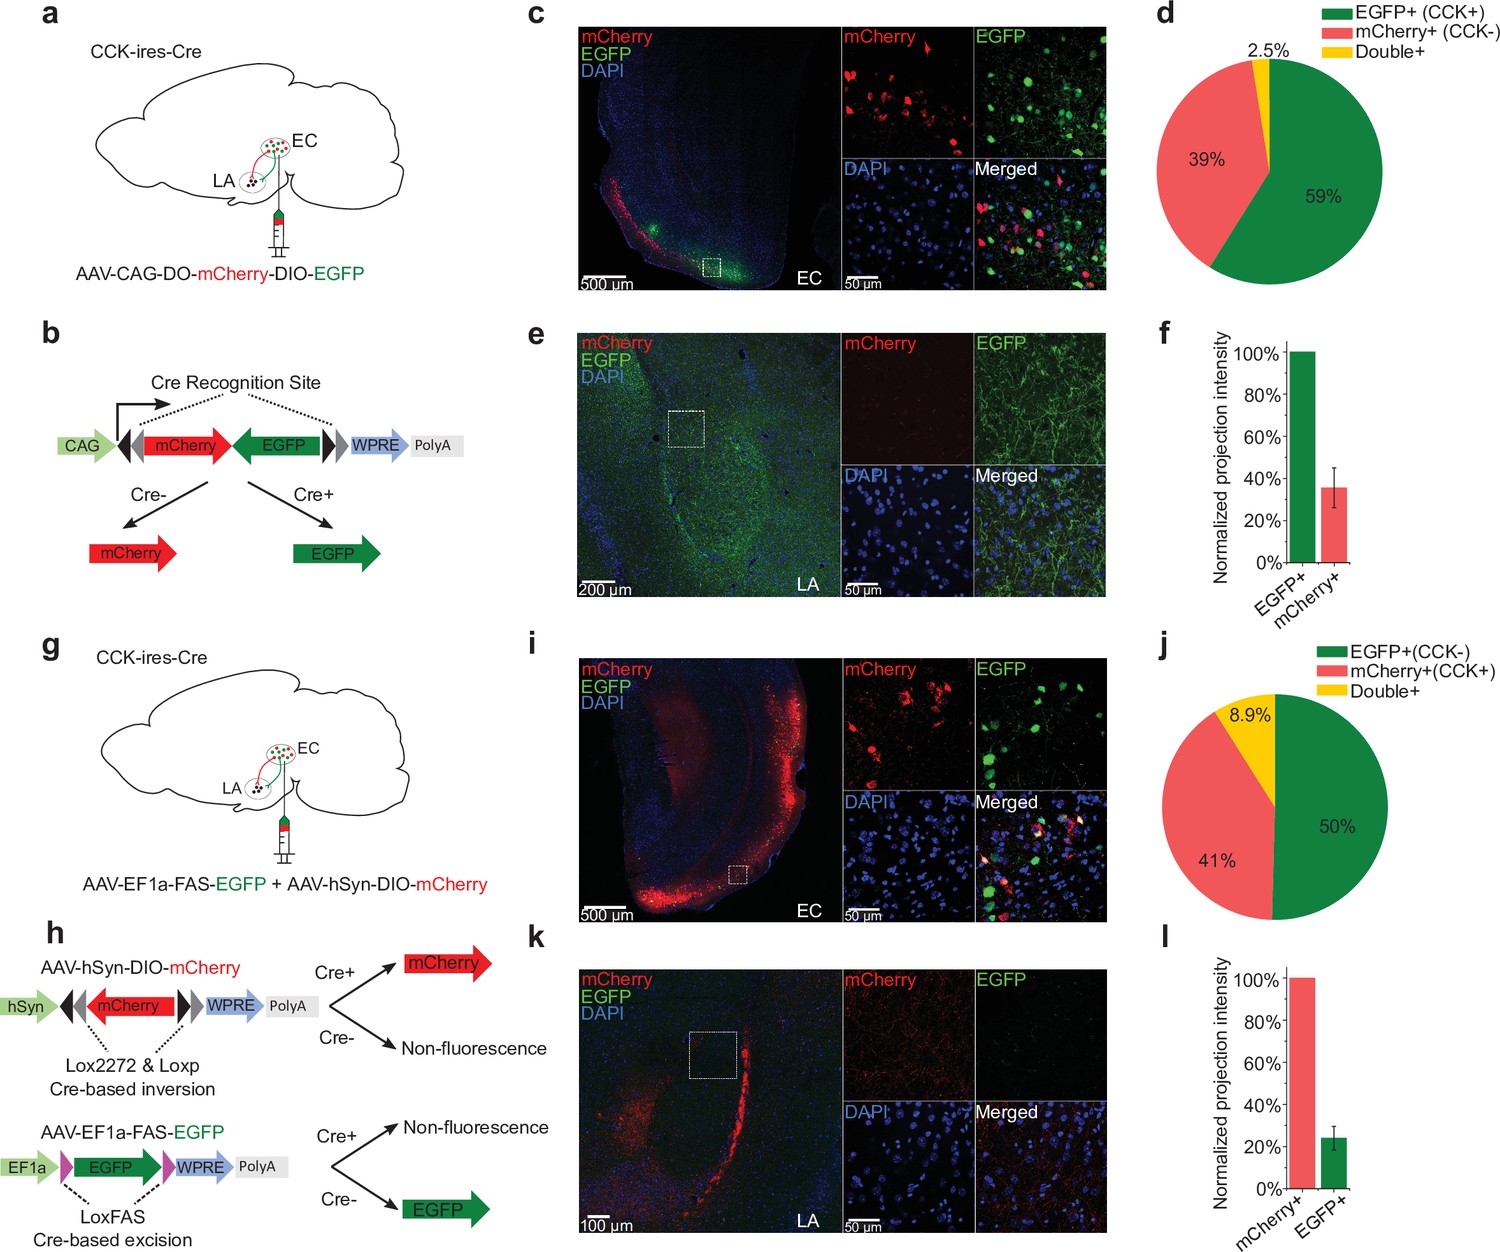
Cholecystokinin (CCK)-expressing projections predominate in the entorhinal cortex (EC)-lateral nuclei of the amygdala (LA) pathway.
(a–b) Schematic diagram of Cre-dependent color-switch labeling in the EC-LA pathway. AAV-CAG-DO-mCherry-DIO-EGFP was injected in the EC. Using this labeling scheme, EGFP is expressed in CCK+ neurons, and mCherry is expressed in CCK– neurons. (c–d) Visualization (c) and quantification (d) of viral expression in the EC. Representative immunofluorescent images in the EC 7 weeks after viral injection (c). Scale bar = 500 μm (left). Magnified images are shown in insets on the right. Scale bar = 50 μm. Percentages of EGFP+ (CCK+), mCherry+ (CCK–), and double-positive neurons (d). No statistical differences were observed. p = 0.08; one-way RM ANOVA, repeated-measures analysis of variance. (e–f) Visualization (e) and quantification (f) of EGFP-expressing (CCK+) and mCherry-expressing (CCK–) afferents in the amygdala stemming from the EC. The fluorescent intensity of neuronal projections was normalized to the EGFP+ signal, which was approximately threefold stronger than the mCherry+ signal (35.6% ± 9.5%). (g–h) Schematic diagram of Cre-dependent color-switch labeling in the EC-LA pathway. A mixture of AAV-hSyn-DIO-mCherry and AAV-EF1α-FAS-EGFP was injected into the EC. Using this labeling scheme, mCherry is expressed in CCK+ neurons, and EGFP is expressed in CCK– neurons. (i–j) Visualization (i) and quantification (j) of viral expression in the EC. Representative immunofluorescent images in the EC 7 weeks after viral injection (c). Scale bar = 500 μm (left). Magnified images are shown in insets on the right. Scale bar = 50 μm. Percentages of mCherry+ (CCK+), EGFP+ (CCK–), and double-positive neurons (j). No statistical differences were observed. p = 0.55; one-way RM ANOVA; Wilks’ lambda = 0.94; F(1,6) = 0.39. (k–l) Visualization (k) and quantification (l) of EGFP-expressing (CCK+) and mCherry-expressing (CCK–) afferents in the amygdala stemming from the EC. The fluorescent intensity of neuronal projections was normalized to the mCherry+ signal, which was approximately fourfold stronger than the EGFP+ signal (24.0% ± 5.6%).
-
Figure 5—source data 1
Quantification of viral expression and projection strength.
- https://cdn.elifesciences.org/articles/69333/elife-69333-fig5-data1-v2.xlsx
Figure 6
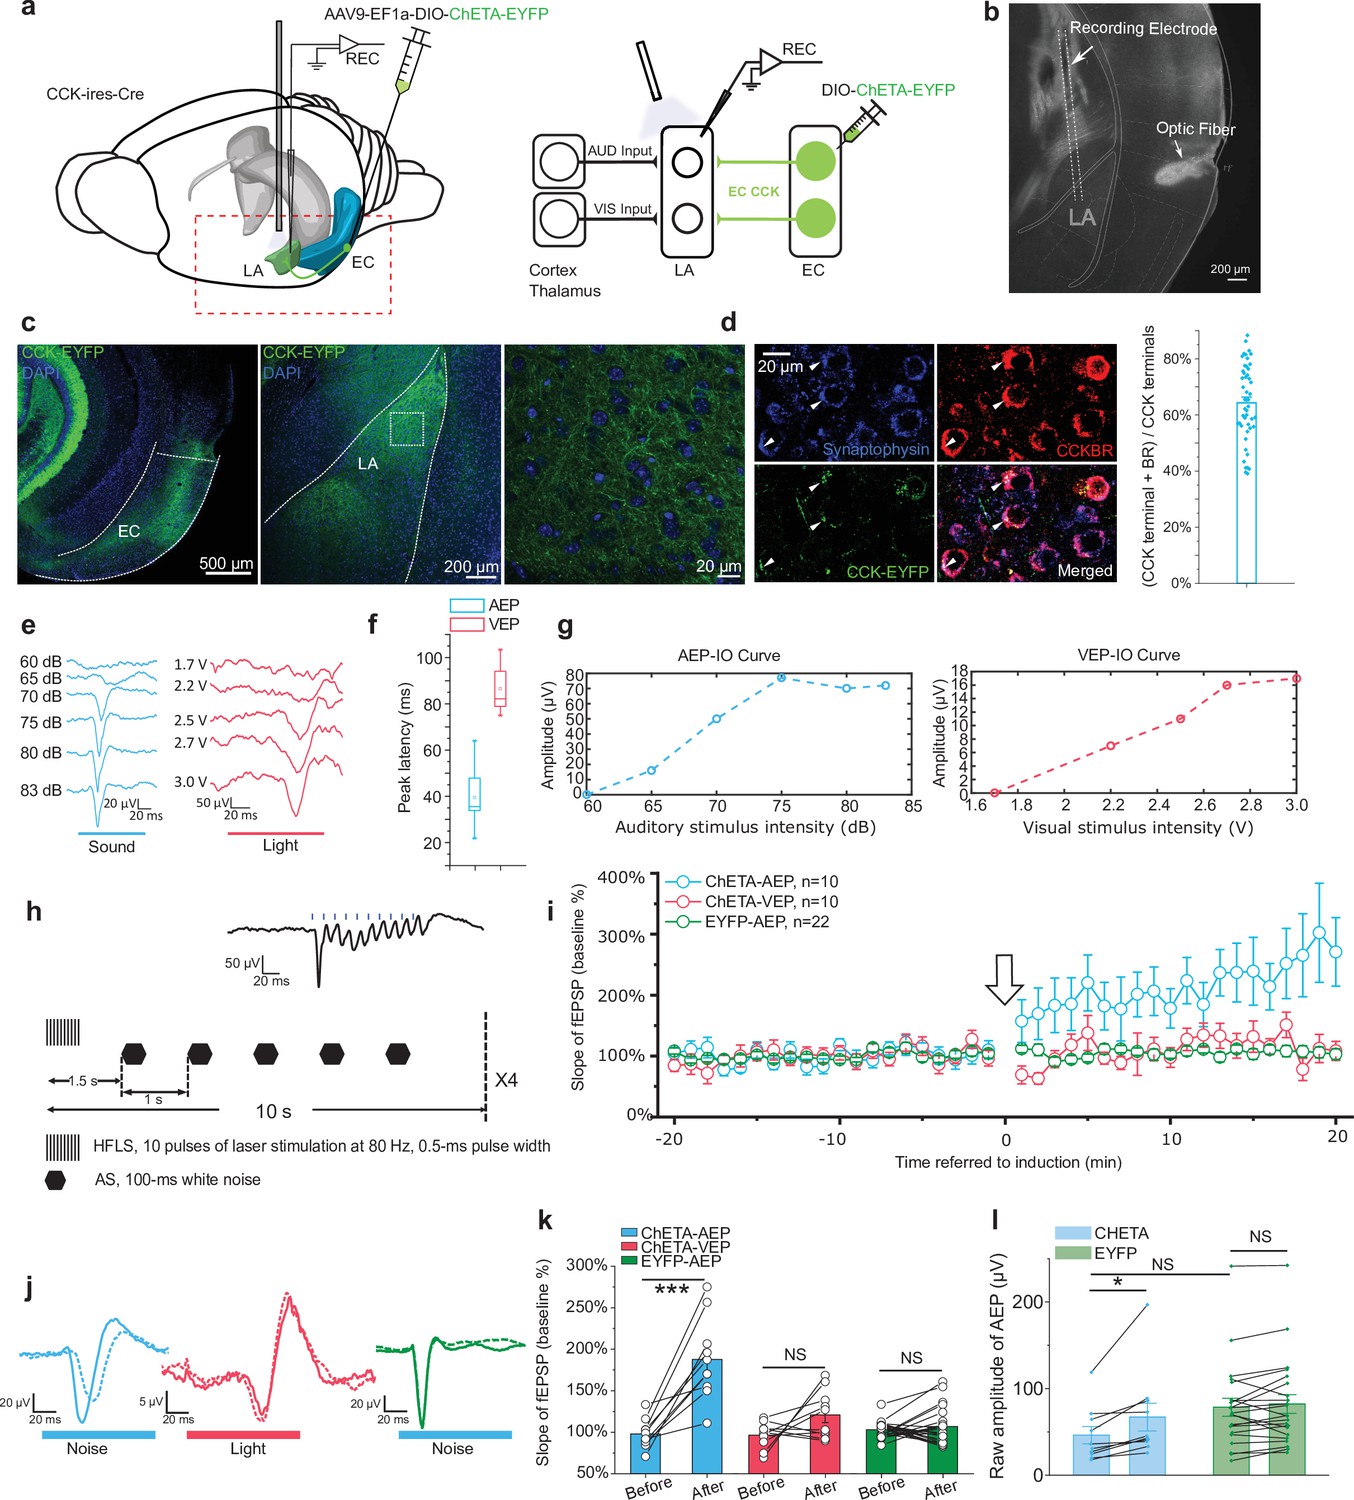
High-frequency activation of the ECCCK+ pathway induces long-term potentiation (LTP) of auditory evoked potential (AEP) in the lateral nuclei of the amygdala (LA).
(a) Schematic diagram of the experiment. The Cre-dependent high-frequency-responsive opsin ChETA was expressed in the EC of cholecystokinin (CCK)-Cre mice. Electrodes were inserted into the LA, and blue light was used to illuminate the recording area. The red rectangle in the left panel is magnified in the right panel to illustrate the neural pathways that are recruited during recording. AUD, auditory stimulus; VIS, visual stimulus; LA, lateral amygdala; EC, entorhinal cortex; REC, recording. (b) Post hoc verification of the electrode tracks and optic fiber placement. (c) Post hoc verification of viral expression in the EC (left) and in CCK-positive projections in the LA (middle). A magnified image is shown in the right panel and corresponds to the boxed area of the middle panel. (d) Co-immunofluorescent staining of the CCK-positive fiber (EYFP), the axon terminal (synaptophysin), and CCK B receptor (CCKBR) in the LA. The white arrowhead indicates a triple-positive neural terminal. Quantification of the CCK and CCKBR double-positive neural terminals out of all CCK-positive terminals (right). (e) Representative traces of AEP and visual evoked potential (VEP) at different sound and light intensities. (f) AEP and VEP peak latency. (g) Representative input/ouput (IO) curves for AEP (left) and VEP (right). (h) Detailed pairing protocol to induce LTP. Representative averaged fEPSP trace evoked by HFLS is shown in the inset. HFLS, high-frequency laser stimulation; AS, auditory stimulation. (i) Time course plot of the normalized slope of AEP and VEP during LTP. The arrow indicates the application of LTP induction. (j) Representative traces of averaged AEP/VEP before (–10 to 0 min, dotted line) and after (10–20 min, solid line) induction from the three groups. (k) The average normalized slopes 10 min before pairing (–10 to 0 min, before) and 10 min after pairing (10–20 min, after) in the three groups. ***p < 0.001, NS, not significant; two-way RM ANOVA with Bonferroni post hoc pairwise comparison. (l) The raw amplitude before (–10 to 0 min) and after (10–20 min) pairing in CHETA and EYFP groups. *p < 0.05, NS, not significant; two-way RM ANOVA with Bonferroni post hoc pairwise comparison.
-
Figure 6—source data 1
AEP-LTP induction with HFLS on CCK+ projection from the EC to the LA.
- https://cdn.elifesciences.org/articles/69333/elife-69333-fig6-data1-v2.xlsx
Figure 7 with 1 supplement
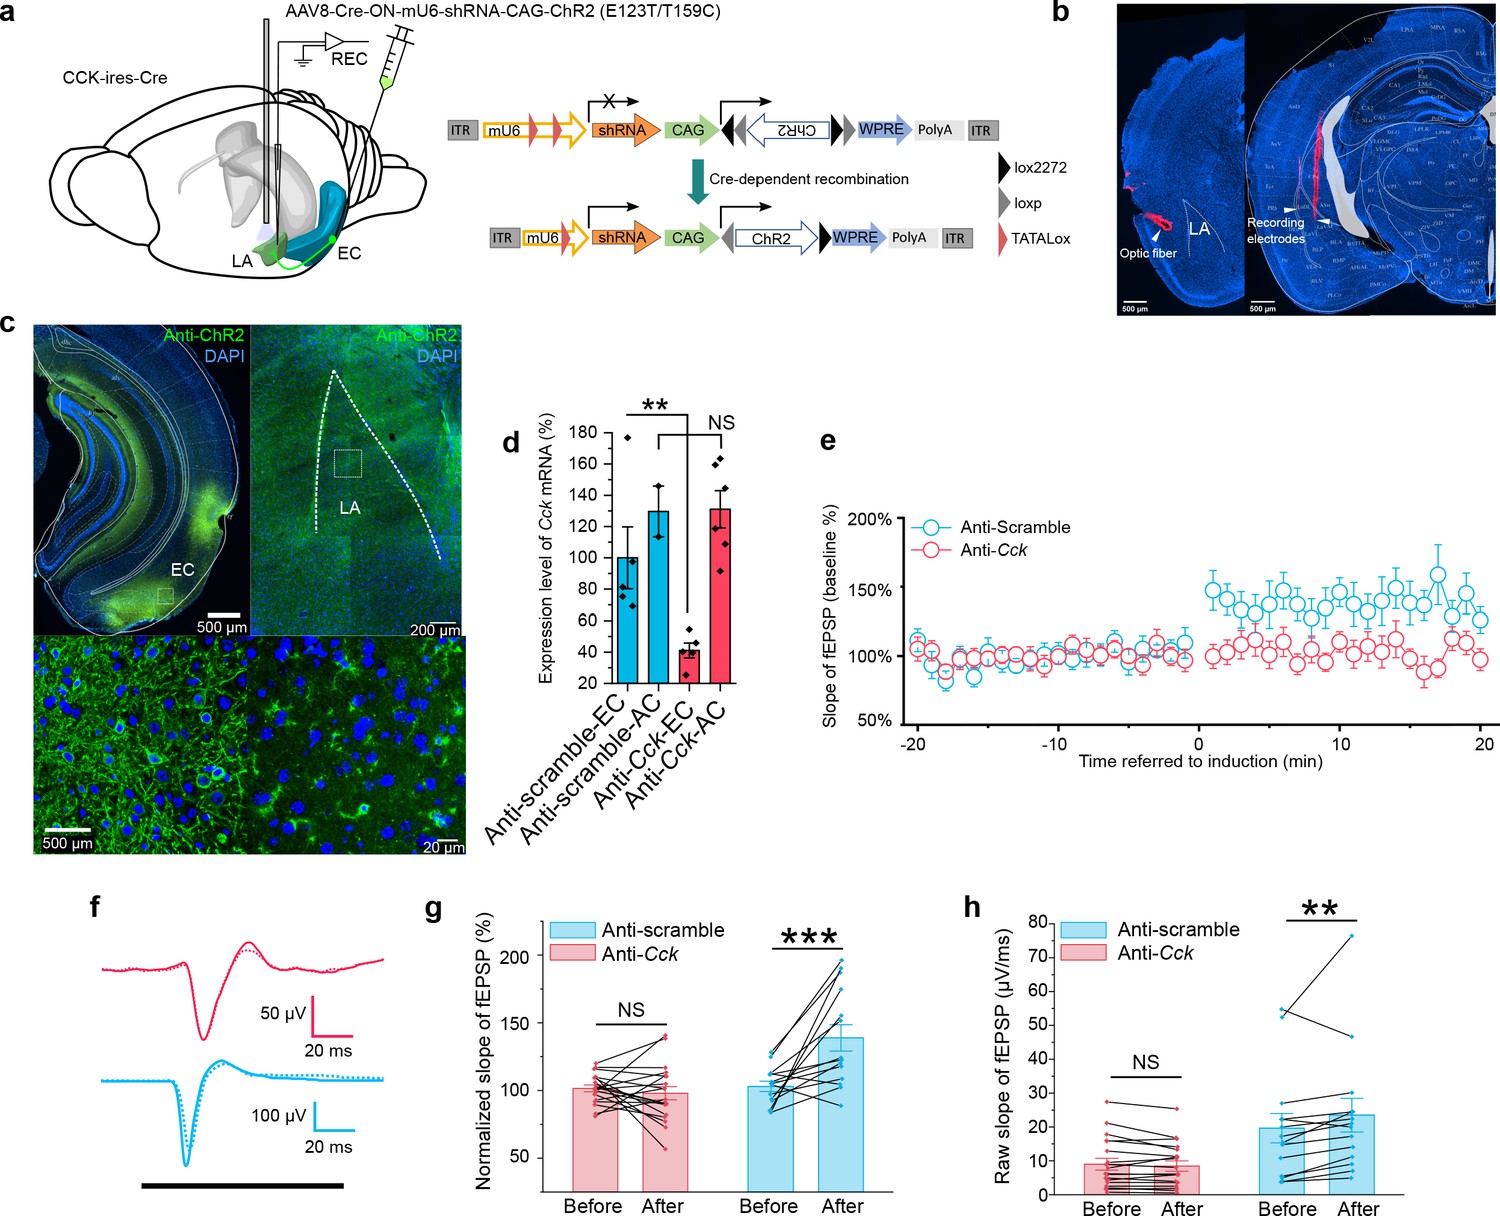
In vivo knockdown of Cck expression blocks auditory evoked potential (AEP)-long-term potentiation (LTP) induction in the LA.
(a) Schematic diagram of the experiment. CCK-Cre mice were injected in the EC with an AAV expressing short hairpin RNA (shRNA) (anti-Cck or anti-Scramble) and ChR2. In vivo recording was conducted in the LA (left). After Cre-mediated recombination, EC-CCK neurons were transfected with shRNA targeting Cck (anti-Cck) or nonsense sequence (anti-Scramble) as well as the excitatory opsin ChR2 variant E123T/T159C (right). AAV, adeno-associated virus; EC, entorhinal cortex; LA, lateral amygdala; REC, recording; ITR, inverted terminal repeat; mU6, mouse U6 promoter; CAG, CMV enhancer, chicken β-actin promoter; WPRE, woodchuck hepatitis virus (WHP) posttranscriptional regulatory element. (b) Post hoc verification of the electrode tracks and optic fiber. (c) Post hoc immunofluorescent staining targeting ChR2 in the EC (left) as well as in the CCK-positive projections distributed in the LA (right). Magnified images are shown in the bottom insets. (d) Quantification of the expression of Cck mRNA in CCK-Cre mice injected with anti-Cck or anti-Scramble shRNA in the EC. Samples with extremely low RNA concentration (<26.7 ng/μL) were discarded. **p < 0.01, NS, not significant, two-way RM ANOVA with post hoc Bonferroni pairwise comparison. EC in anti-scramble group, N = 5; AC in anti-scramble group, N = 2; EC in anti-Cck group, N = 5; AC in anti-Cck group, N = 6. (e) Time course plot of the normalized AEP slope before and after pairing in mice expressing anti-Cck (n = 19) or anti-Scramble (n = 14) shRNA. (f) Representative traces of the averaged AEP before (–10 to 0 min, dotted line) and after (10–20 min, solid line) induction in the two groups. Anti-Scramble is indicated in blue, and anti-Cck is indicated in red. (g) The average normalized slopes 10 min before pairing (–10 to 0 min, before) and 10 min after pairing (10–20 min, after) in the two groups. ***p < 0.001, two-way RM ANOVA with Bonferroni post hoc pairwise test; RM ANOVA, repeated-measures analysis of variance; NS, not significant; fEPSP, field excitatory postsynaptic potential. (h) The average raw slopes 10 min before pairing (–10 to 0 min, before) and 10 min after pairing (10–20 min, after) in the two groups. **p < 0.01, two-way RM ANOVA with Bonferroni post hoc pairwise test.
-
Figure 7—source data 1
AEP-LTP induction in mice with knockdown of Cck expression in the EC.
- https://cdn.elifesciences.org/articles/69333/elife-69333-fig7-data1-v2.xlsx
Figure 7—figure supplement 1
Verification Cre dependency of adeno-associated virus (AAV) carrying short hairpin RNA (shRNA) and ChR2.
(a) AAV8-Cre-ON-mU6-shRNA-CAG-ChR2 (E123T/T159C) was injected into the entorhinal cortex (EC) of C57 mice. Post hoc immunohistochemical staining targeting ChR2 did not detect any immuno-positive signals. (b) Same AAV was injected into the EC of cholecystokinin (CCK)-Cre mice. ChR2 immuno-positive signal was detected in EC. These results suggest a reliable Cre dependency of this AAV.
Figure 8 with 1 supplement
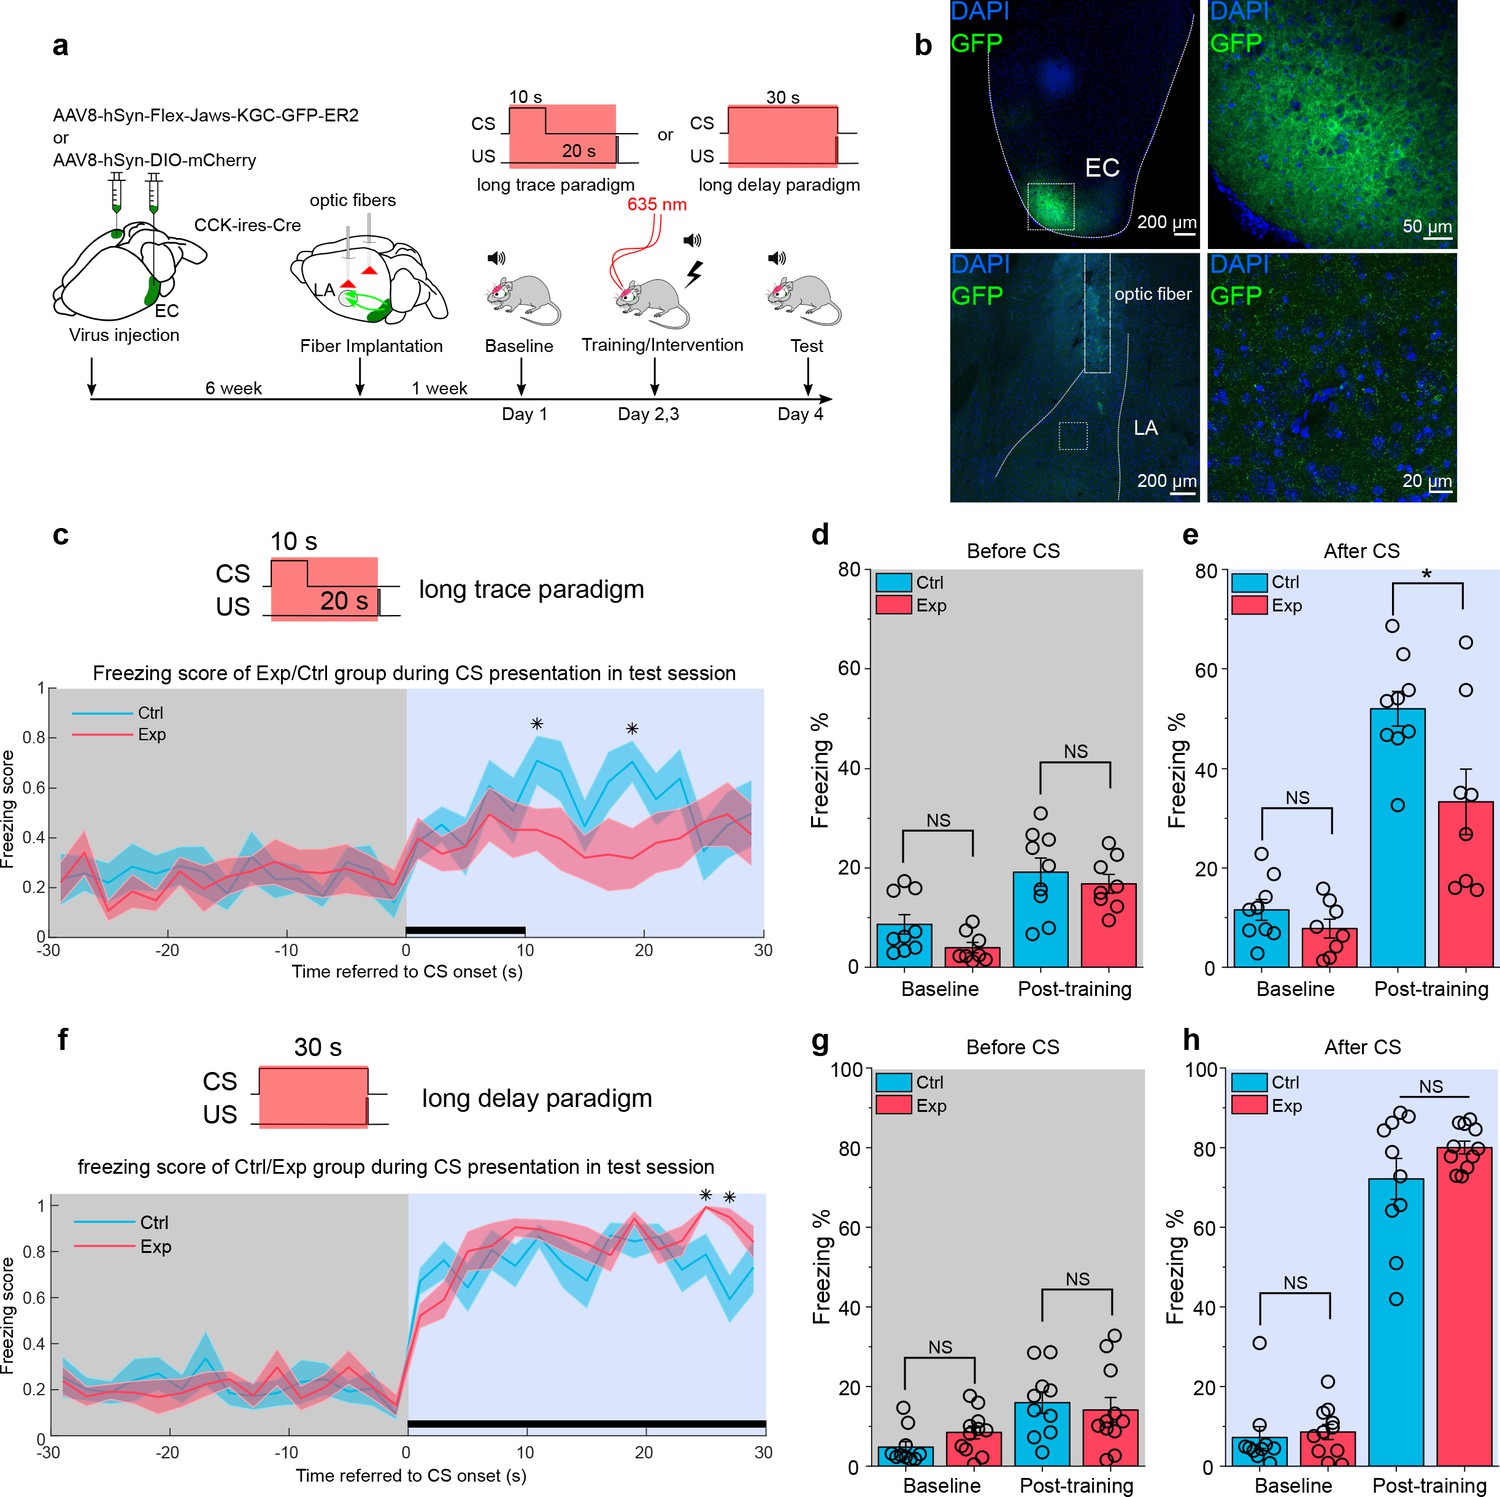
Real-time inhibition of the ECCCK+ pathway impairs long-trace but not long-delay fear memory formation.
(a) Schematic diagram of the experiment. The Cre-dependent inhibitory opsin Jaws or control was expressed in the EC of cholecystokinin (CCK)-Cre mice. Optic fibers were implanted targeted to the LA to illuminate and inhibit the CCK-positive projections from the EC to the LA during auditory-cued fear conditioning. Long-trace (10 s CS + 20 s trace +0.5 s US) and long-delay (30 s CS co-terminated with 0.5 s US) paradigms were used in current experiment. The inset at the top right shows the timing of 635 nm laser illumination. EC, entorhinal cortex; LA, lateral amygdala; CS, conditioned stimulus; US, unconditioned stimulus. (b) Post hoc verification of viral expression in the EC (top left) and of the optic fiber track in the LA (bottom left). Magnified images in the right panels show the transfected EC-CCK neurons (top right) and the CCK-positive EC-LA fibers (bottom right). (c) Freezing score across time during test session after long-trace fear conditioning. Mice expressed Jaws (‘Exp’, N = 8) had a relatively higher freezing score than mice expressed control virus (‘Ctrl’, N = 9). For all panels in this figure, *p < 0.05; NS, not significant; two-way RM ANOVA with Bonferroni pairwise comparison. (d–e) Freezing percentages before (d) and after (e) the CS in two groups of mice on pre-training day (baseline) and post-training day. (g) Freezing score across time during test session after long-delay fear conditioning. (h–i) Freezing percentages before (h) and after (i) the CS in two groups of mice on pre-training day (baseline) and post-training day.
-
Figure 8—source data 1
Summary of freezing percentage in mice with opto-inhibition in long trace and long delay conditioning.
- https://cdn.elifesciences.org/articles/69333/elife-69333-fig8-data1-v2.xlsx
Figure 8—figure supplement 1
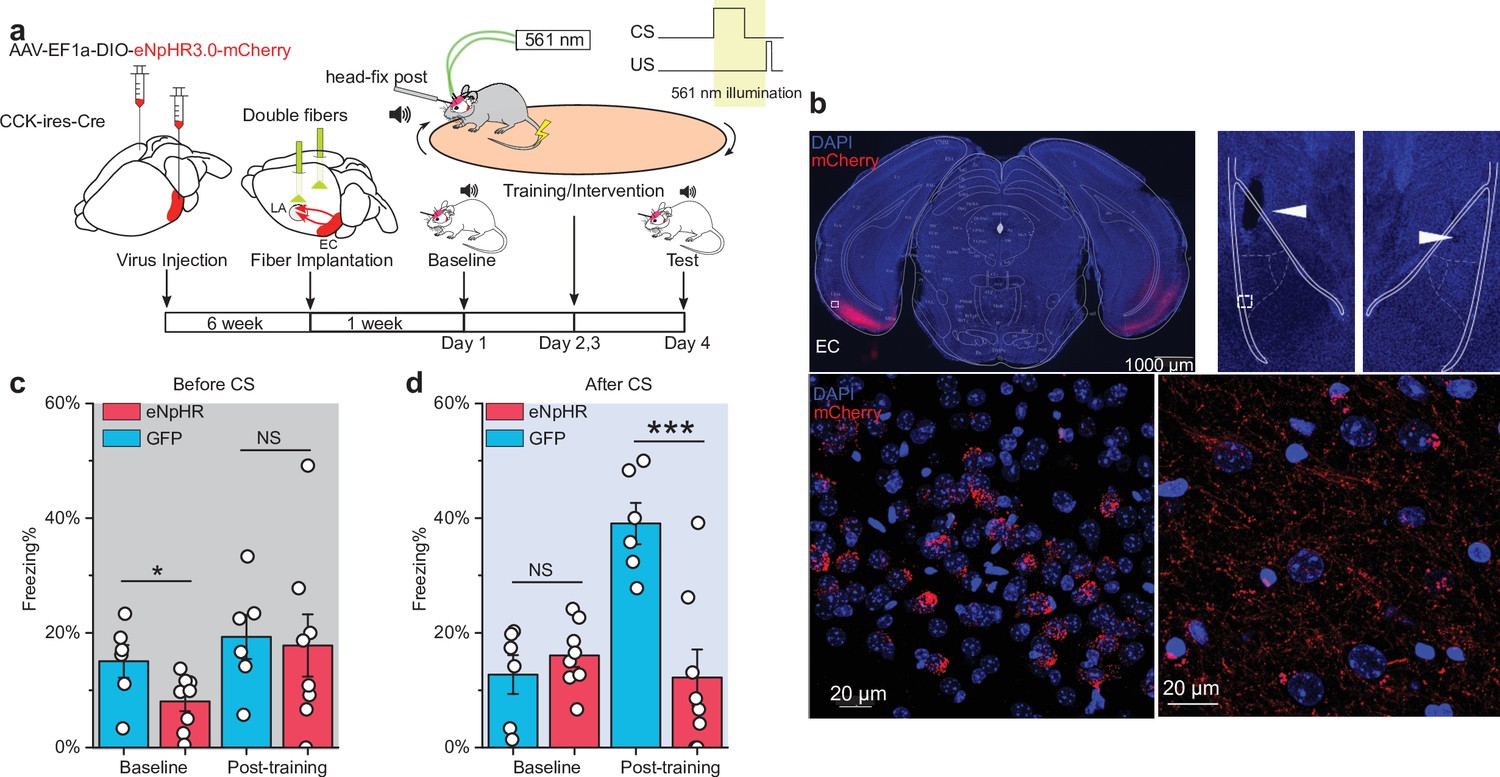
Real-time inhibition of the ECCCK+ pathway also impairs short-trace fear memory formation.
(a) Schematic diagram of the experiment. The Cre-dependent inhibitory opsin eNpHR3.0 was expressed in the entorhinal cortex (EC) of cholecystokinin (CCK)-Cre mice. Optic fibers were implanted targeting the lateral nuclei of the amygdala (LA) to illuminate the CCK-positive projections from the EC to the LA during the auditory-cued trace fear conditioning. The inset at the top right shows the timing of illumination, which covers the conditioned stimulus (CS) presentation and trace interval. (b) Post hoc verification of viral expression in the EC (top left) and of the optic fiber track in the LA (top right). The white rectangle in the top right panel is magnified in the bottom right panel. Magnified images show the transfected EC-CCK neurons (bottom left) and the CCK-positive EC-LA fibers (bottom right). (c–d) Freezing percentages before (c) and after (d) the CS in eNpHR-expressing mice (red, N = 8/3 cages) and GFP-expressing control mice (blue, N = 6/2 cages) on pre-training day (baseline) and post-training day. *p < 0.05, ***p < 0.001; NS, not significant; two-way RM ANOVA with Bonferroni post hoc pairwise test; RM ANOVA, repeated-measures analysis of variance.
Videos
Video 1
Freezing response of wildtype (WT) mice to the conditioned stimulus (CS) in the test session after long-trace fear conditioning paradigm, related to Figure 1b–c.
WT mice showed significant freezing response to the CS after training.
Video 2
Freezing response of Cck-/- mice to the conditioned stimulus (CS) in the test session after long-trace fear conditioning paradigm, related to Figure 1b–c.
Cck-/- mice showed impaired freezing response to the CS after training.
Video 3
Freezing response of wildtype (WT) mice to the conditioned stimulus (CS) in the test session after short-trace fear conditioning paradigm, related to Figure 1f–g.
WT mice showed significant freezing response to the CS after training.
Video 4
Freezing response of Cck-/- mice to the conditioned stimulus (CS) in the test session after short-trace fear conditioning paradigm, related to Figure 1f–g.
Cck-/- mice showed impaired freezing response to the CS after training.
Video 5
Freezing response to the conditioned stimulus (CS) of Cck-/- mice treated with cholecystokinin tetrapeptide (CCK-4) in the test session after short-trace fear conditioning paradigm, related to Figure 2m–n.
CCK-4-treated mice showed significant freezing response to the CS after training.
Video 6
Freezing response to the conditioned stimulus (CS) of Cck-/- mice treated with vehicle in the test session after short-trace fear conditioning paradigm, related to Figure 2m–n.
Vehicle-treated mice showed impaired freezing response to the CS after training.
Video 7
Freezing response to the conditioned stimulus (CS) of EGFP-expressing mice treated with clozapine (CLZ) in the test session after short-trace fear conditioning paradigm, related to Figure 4e–f.
EGFP mice showed significant freezing response to the CS after training.
Video 8
Freezing response to the conditioned stimulus (CS) of hM4Di-expressing mice treated with clozapine (CLZ) in the test session after short-trace fear conditioning paradigm, related to Figure 4e–f.
hM4Di mice showed impaired freezing response to the CS after training.
Video 9
Freezing response to the conditioned stimulus (CS) of hM4Di-expressing cholecystokinin (CCK)-Cre mice treated with vehicle in test session after long-trace fear conditioning paradigm, related to Figure 4k–l.
Vehicle-treated mice showed significant freezing response to the CS after training.
Video 10
Freezing response to the conditioned stimulus (CS) of hM4Di-expressing cholecystokinin (CCK)-Cre mice treated with clozapine (CLZ) in test session after long-trace fear conditioning paradigm, related to Figure 4k–l.
CLZ-treated mice showed impaired freezing response to the CS after training.
Video 11
Freezing response to the conditioned stimulus (CS) of Jaws-expressing mice (Exp) in test session after long-trace fear conditioning along with opto-inhibition, related to Figure 8c–e.
Exp mice showed impaired freezing response to the CS after training.
Video 12
Freezing response to the conditioned stimulus (CS) of mCherry-expressing mice (Ctrl) in test session after long-trace fear conditioning along with opto-inhibition, related to Figure 8c–e.
Ctrl mice showed significant freezing response to the CS after training.
Video 13
Freezing response to the conditioned stimulus (CS) of Jaws-expressing mice (Exp) in test session after long-delay fear conditioning along with opto-inhibition, related to Figure 8f–h.
Exp mice showed significant freezing response to the CS after training.
Video 14
Freezing response to the conditioned stimulus (CS) of mCherry-expressing mice (Ctrl) in test session after long-delay fear conditioning along with opto-inhibition, related to Figure 8f–h.
Ctrl mice showed significant freezing response to the CS after training.
Video 15
Conditioned flight response to the conditioned stimulus (CS) of GFP-expressing cholecystokinin (CCK)-Cre mice illuminated with green light during short-trace fear conditioning.
Mice showed apparent flight response in training trial 3.
Video 16
Conditioned flight response to the conditioned stimulus (CS) of eNpHR-expressing cholecystokinin (CCK)-Cre mice illuminated with green light during short-trace fear conditioning.
Flight response was blocked.
Video 17
Freezing response to the conditioned stimulus (CS) of GFP-expressing cholecystokinin (CCK)-Cre mice in the test session after short-trace fear conditioning paradigm, related to Figure 8—figure supplement 1c-d.
GFP mice showed significant freezing response to CS after training.
Video 18
Freezing response to the conditioned stimulus (CS) of eNpHR-expressing cholecystokinin (CCK)-Cre mice in the test session after short-trace fear conditioning paradigm, related to Figure 8—figure supplement 1c-d.
eNpHR mice showed impaired freezing response to CS after training.
Tables
Key resources table
| Reagent type (species) or resource | Designation | Source or reference | Identifiers | Additional information |
|---|---|---|---|---|
| Antibody | Anti-CCKBR (Rabbitpolyclonal) | Thermo Fisher Scientific | Cat# PA3-201, RRID:AB_10979062 | IF (1:1000) |
| Antibody | Anti-CCKBR (Mouse monoclonal) | Santa Cruz Biotechnology | Cat# sc-166690, RRID:AB_2070487 | IF (1:200) |
| Antibody | Anti-Synaptophysin (Mouse monoclonal) | Sigma-Aldrich | Cat# S5768, RRID:AB_477523 | IF (1:500) |
| Antibody | Anti-CamKIIα (Rabbit monoclonal) | Abcam | Cat# Ab52476, RRID:AB_868641 | IF (1:500) |
| Antibody | Anti-GAD67 (Mouse monoclonal) | Millipore | Cat# MAB5406, RRID:AB_2278725 | IF (1:500) |
| Antibody | Anti-ChR2 (Mouse monoclonal) | American Research Products | Cat# 03–651180 | IF (1:2000) |
| Antibody | Anti-mouse IgG Alexa 647 (Donkey polyclonal) | Jackson ImmunoResearch Labs | Cat# 715-605-150, RRID:AB_2340862 | IF (1:500) |
| Antibody | Anti-rabbit IgG Alexa 647 (Donkey polyclonal) | Jackson ImmunoResearch Labs | Cat# 711-605-152, RRID:AB_2492288 | IF (1:500) |
| Antibody | Anti-mouse IgG DyLight 594 (Goat polyclonal) | Thermo Fisher Scientific | Cat# 35511, RRID:AB_1965950 | IF (1:500) |
| Antibody | Anti-mouse IgG Alexa 488 (Donkey polyclonal) | Jackson ImmunoResearch Labs | Cat# 715-545-150, RRID:AB_2340846 | IF (1:500) |
| Antibody | Anti-mouse IgG Alexa 594 (Goat polyclonal) | Jackson ImmunoResearch Labs | Cat# 111-585-144, RRID:AB_2307325 | IF (1:500) |
| Recombinant DNA reagent | AAV-Ef1α-DIO-ChETA-EYFP | Addgene | RRID:Addgene_26968 | |
| Recombinant DNA reagent | AAV-EF1α-DIO-EYFP | BrainVTA | N/A | N/A |
| Recombinant DNA reagent | AAV-hSyn-FLEX-GFP | BrainVTA | N/A | N/A |
| Recombinant DNA reagent | AAV-hSyn-hM4Di-EGFP | BrainVTA | N/A | N/A |
| Recombinant DNA reagent | AAV-hSyn-EGFP | Addgene | RRID:Addgene_105539 | N/A |
| Recombinant DNA reagent | AAV-hSyn-DIO-hM4D(Gi)-mCherry | Addgene | RRID:Addgene_44362 | N/A |
| Recombinant DNA reagent | AAV-hSyn-DIO-mCherry | Addgene | RRID:Addgene_50459 | N/A |
| Recombinant DNA reagent | AAV-EF1α-DIO-eNpHR3.0-mCherry | BrainVTA | N/A | N/A |
| Recombinant DNA reagent | AAV-EF1α-FAS-EGFP | Taitool | N/A | N/A |
| Recombinant DNA reagent | AAV-CAG-DO-mCherry-DIO-EGFP | This paper | N/A | AAV virus expressing Cre-On EGFP and Cre-Off mCherry |
| Recombinant DNA reagent | AAV8-Cre-ON-ChR2-antiCck | This paper | N/A | AAV virus expressing Cre-dependent ChR2 and Cre-dependent shRNA targeting Cck |
| Recombinant DNA reagent | AAV8-Cre-ON-ChR2-antiScramble | This paper | N/A | AAV virus expressing Cre-dependent ChR2 and Cre-dependent shRNA targeting nonsense Scramble |
| Recombinant DNA reagent | retroAAV-hSyn-FLEX-jGcamp7s | Addgene | RRID:Addgene_104491 | N/A |
| Recombinant DNA reagent | AAV-hSyn-CCK2.0 | Vigene Bioscience, Jing et al., 2019 | Construct is from Prof. Yulong Li’s Lab at Peking University | |
| Recombinant DNA reagent | pAAV-CAG-Flex-tdTomato | Addgene | RRID:Addgene_28306 | N/A |
| Recombinant DNA reagent | PUC57-mU6 with TATALox | BGI, Ventura et al., 2004 | N/A | |
| Recombinant DNA reagent | PUC57-CAG-DIO-ChR2(E123T/T159C)-Flag | Addgene | RRID:Addgene_35509; Addgene_101766 | N/A |
| Recombinant DNA reagent | pUC57-CAG-DIO-mCherry- EYFP (inverted) | Addgene | RRID:Addgene_34582; Addgene_98750 | N/A |
| Recombinant DNA reagent | AAV8-hSyn-FLEX-Jaws-GFP | UNC, Chuong et al., 2014 | N/A | |
| Sequence-based reagent | Cck | BGI | shRNA Target | GACTCCCAGACCTAATGTTGC |
| Sequence-based reagent | Scramble | BGI | shRNA Target | GTTGGCTCCTAGCAGATCCTA |
| Sequence-based reagent | Primers for genotyping Cck-/- mice | BGI | PCR primers | 5'-ATGCAGGCAAATTTTGGTGT-3';5'-GAGCGGACACCCTTACCTTT-3';5'-GACTTCTGTGTGCGGGACTT-3 |
| Sequence-based reagent | Gapdh (Forward) | BGI | qPCR primer | 5'-AGGTCGGTGTGAACGGATTTG-3' |
| Sequence-based reagent | Gapdh (Reverse) | BGI | qPCR primer | 5'-TGTAGACCATGTAGTTGAGGTCA-3' |
| Sequence-based reagent | Cck (Forward) | BGI | qPCR primer | 5'-ATCTGTCCAGAGTGTGCAATGC-3' |
| Sequence-based reagent | Cck (Reverse) | BGI | qPCR primer | 5'-TGAGGGGCAGAAGGAAATCTCT-3' |
| Chemical compound, drug | Urethane | Sigma-Aldrich | Cat# U2500 | N/A |
| Chemical compound, drug | Pentobarbital | Alfasan International B.V. | 20% Dorminal | |
| Chemical compound, drug | CCK-4 | Abcam, Cambridge, UK | Cat# ab141328 | N/A |
| Chemical compound, drug | Dil Stain | Thermo Fisher Scientific | Cat# D282 | N/A |
| Chemical compound, drug | Clozapine | Sigma-Aldrich | Cat# C6305 | N/A |
| Peptide, recombinant proteins | Alexa Fluor 647-conjugated Cholera Toxin Subunit B | Thermo Fisher Scientific | Cat# C34778 | N/A |
| Genetic reagent (Mus musculus) | Mouse: C57BL/6 | The Laboratory Animal Services Centre, Chinese University of Hong Kong | N/A | N/A |
| Genetic reagent (Mus musculus) | Mouse: C57BL/6 | Laboratory Animal Research Unit, City University of Hong Kong | N/A | N/A |
| Genetic reagent (Mus musculus) | Mouse: CCK-ires-Cre | Jackson Laboratories | Stock# 012706 | N/A |
| Genetic reagent (Mus musculus) | Mouse: CCK-CreER | Jackson Laboratories | Stock# 012710 | N/A |
| Genetic reagent (Mus musculus) | Mouse: CCK-ABKO | Jackson Laboratories | Stock# 006365 | N/A |
| Genetic reagent (Mus musculus) | Mouse: CCK-BR KO | Jackson Laboratories | Stock# 006369 | N/A |
| Software, algorithm | Origin 2018 | OriginLab | https://www.originlab.com/2018 | N/A |
| Software, algorithm | Matlab R2020a | Mathworks | https://www.mathworks.com/products/new_products/release2020a.html | N/A |
| Software, algorithm | Fiji | Schindelin et al., 2012 | https://imagej.net/Fiji | N/A |
| Software, algorithm | TDT OpenEX | Tucker-Davis Technologies | https://www.tdt.com/component/openex-software-suite/ | N/A |
| Software, algorithm | Photoshop CC | Adobe | https://www.adobe.com/products/photoshop.html | N/A |
| Software, algorithm | Excel | Microsoft | https://www.microsoft.com/en-us/microsoft-365/excel | N/A |
| Software, algorithm | Inkscape | N/A | https://inkscape.org/ | N/A |
| Software, algorithm | Offline Sorter | Plexon | https://plexon.com/products/offline-sorter/ | N/A |
| Software, algorithm | NeuroExplorer | Plexon | https://plexon.com/products/neuroexplorer/ | N/A |
| Software, algorithm | Bonsai | Lopes et al., 2015 | https://bonsai-rx.org/ | N/A |
| Software, algorithm | CellProfiler | McQuin et al., 2018 | https://cellprofiler.org/ | N/A |
Additional files
Download links
A two-part list of links to download the article, or parts of the article, in various formats.
Downloads (link to download the article as PDF)
Open citations (links to open the citations from this article in various online reference manager services)
Cite this article (links to download the citations from this article in formats compatible with various reference manager tools)
The entorhinal cortex modulates trace fear memory formation and neuroplasticity in the mouse lateral amygdala via cholecystokinin
eLife 10:e69333.
https://doi.org/10.7554/eLife.69333


