mRNA vaccination in people over 80 years of age induces strong humoral immune responses against SARS-CoV-2 with cross neutralization of P.1 Brazilian variant
- Institute of Immunology and Immunotherapy, University of Birmingham, United Kingdom
- Clinical Lead, Quinton and Harborne PCN, Ridgacre House Surgery, United Kingdom
- Vaccine Taskforce, Department for Business, Energy and Industrial Strategy, United Kingdom
- National infection Service, Public Health England, United Kingdom
- National infection Service, Public Health England, Porton Down, United Kingdom
- Oxford Immunotec Ltd, United Kingdom
Figures
Figure 1 with 1 supplement
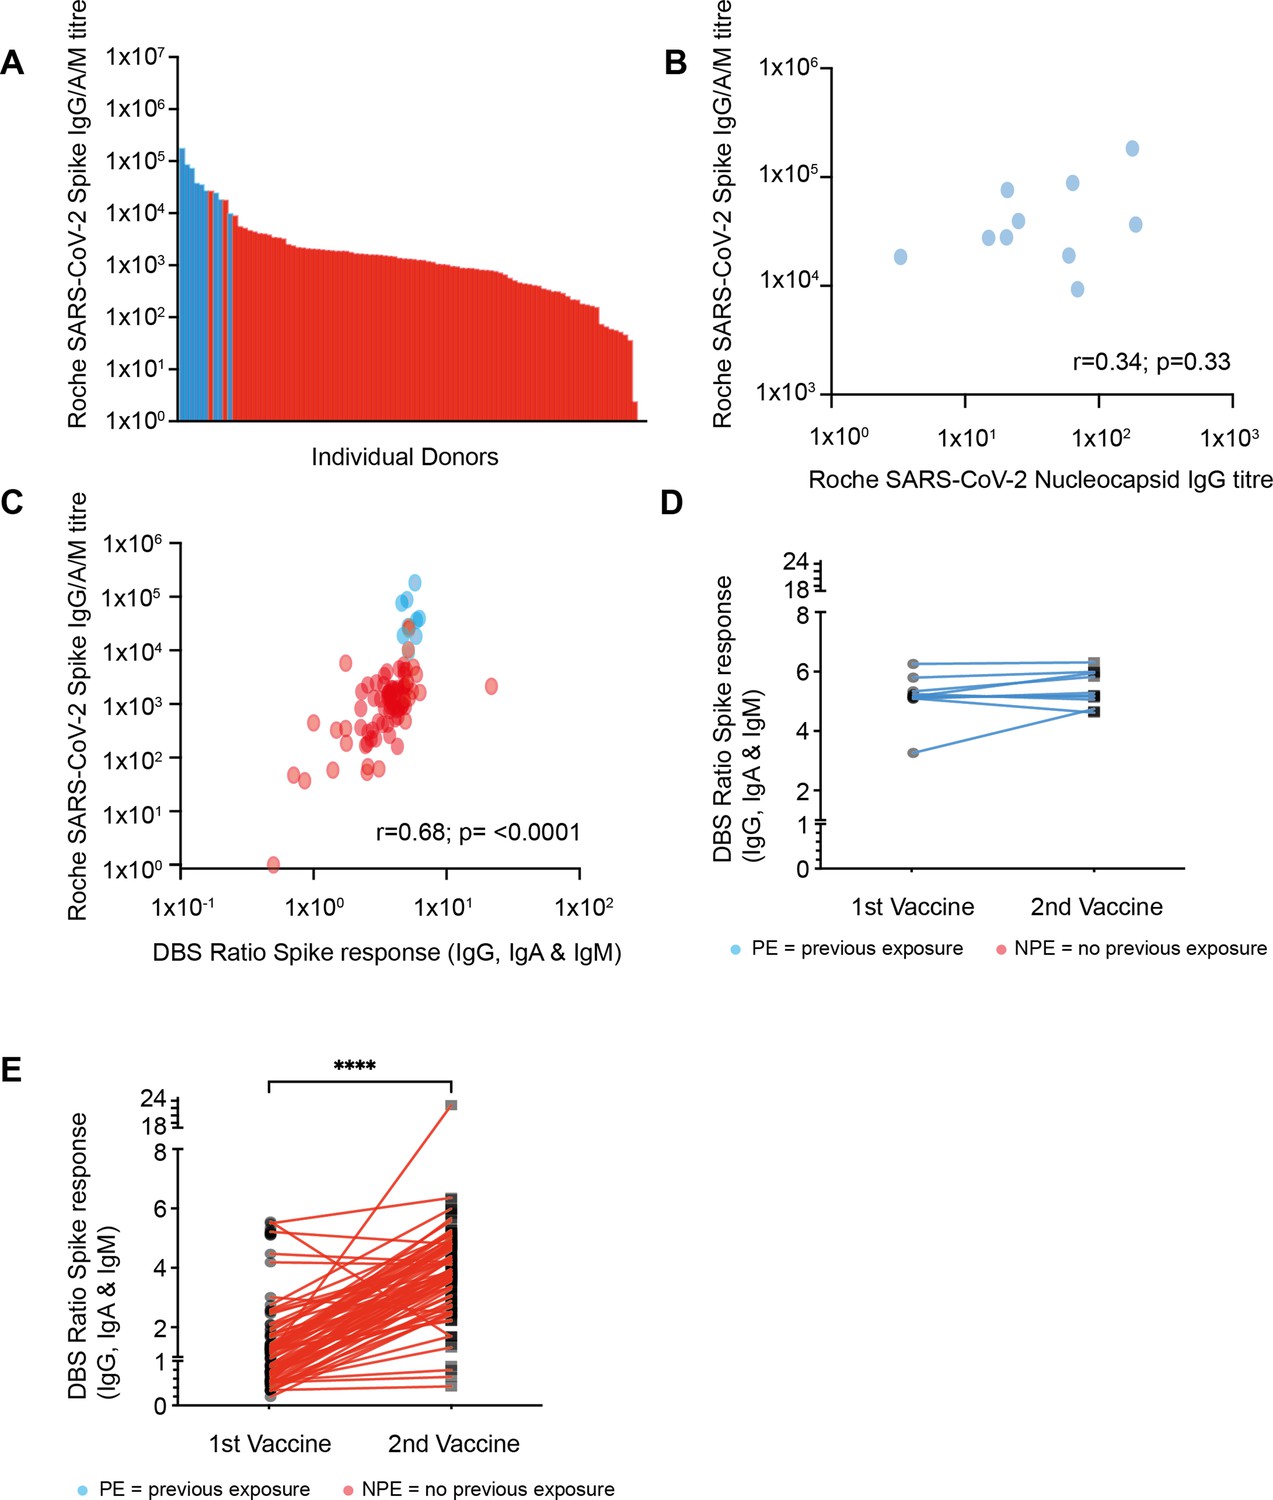
Strong antibody responses develop after vaccination with higher antibody levels seen in those with previous natural infection.
(A) SARS-CoV-2 spike (S)-specific whole antibody titer after double vaccination. Blue bars represent participants where positive nucleocapsid (N)-specific serology indicates previous natural infection. (B) Comparison of S-specific and N-specific whole antibody titer after double vaccination amongst those with natural infection (R=0.34; p=033). (C) Comparison of S-specific whole antibody titer in serum with eluate ratio from dried blood spot (DBS). Blue dots represent participants where positive nucleocapsid (N)-specific serology indicates previous natural infection (r=0.68; p≤0.0001). (D) S-specific antibody response measured by DBS after the first and second vaccine dose amongst donors with evidence of natural infection. (E) S-specific antibody response by DBS after the first and second vaccine dose amongst donors with no evidence of previous natural infection (p≤0.0001).
-
Figure 1—source data 1
Serum immunoglobulin isotype concentration in relation to spike-specific antibody response.
- https://cdn.elifesciences.org/articles/69375/elife-69375-fig1-data1-v2.xlsx
Figure 1—figure supplement 1
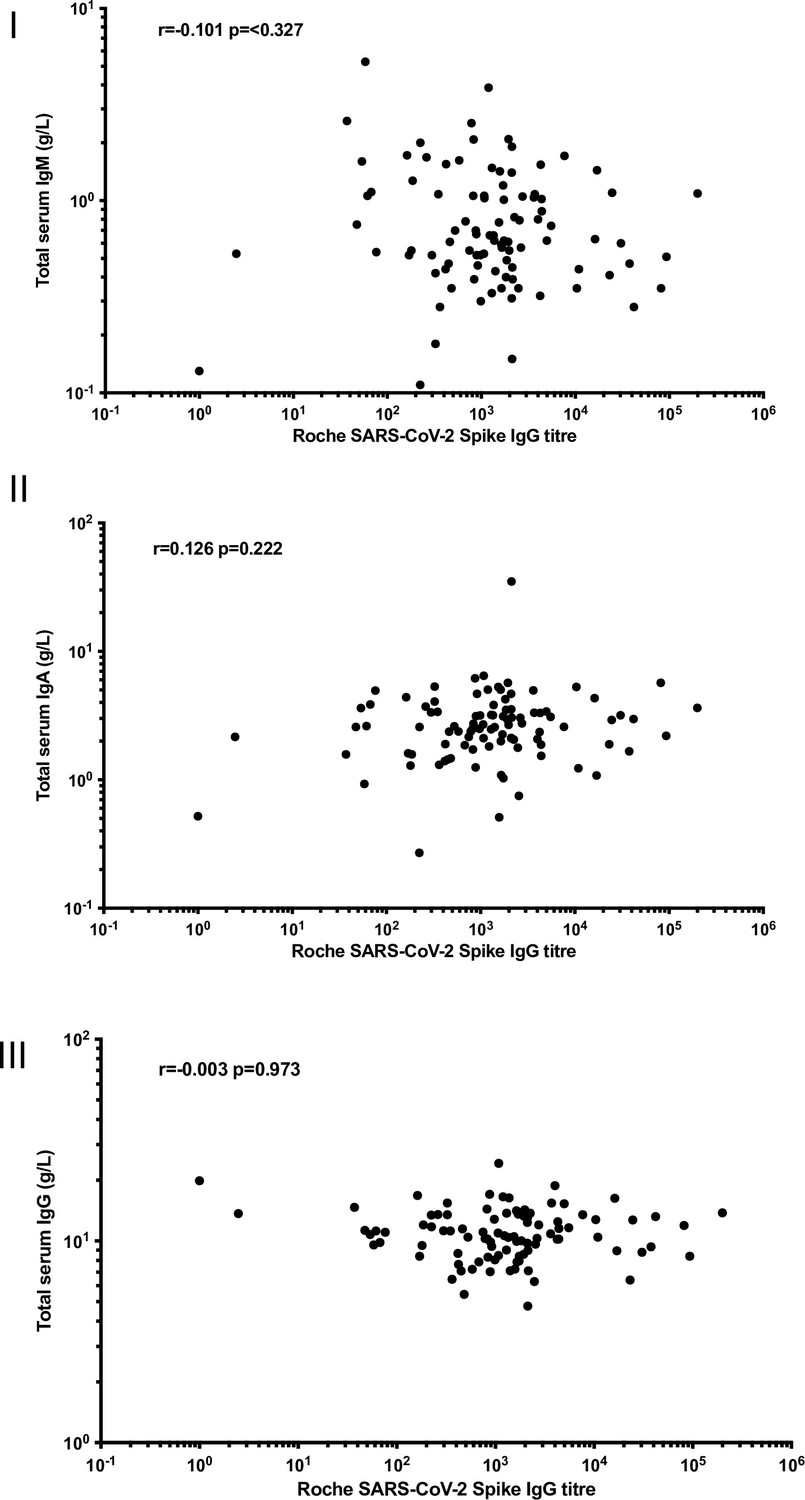
Serum immunoglobulin isotype concentration in relation to spike-specific antibody response.
Figure 2
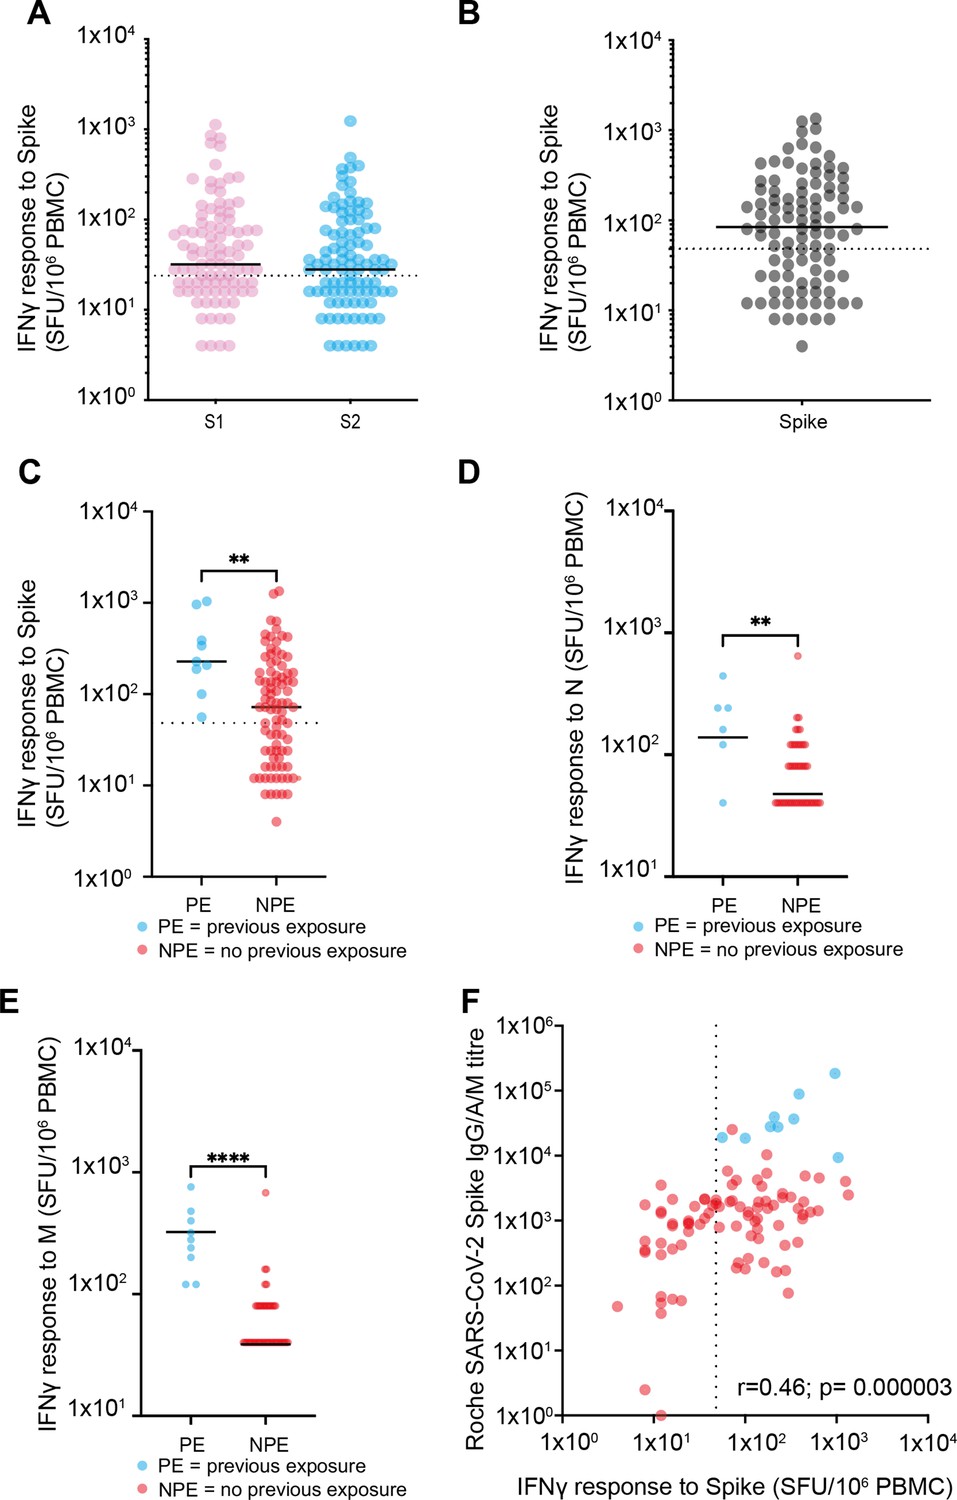
Spike-specific T cell responses after vaccination.
(A) T cell responses against S1 domain and S2 domain as defined by IFNγ ELISpot assay. Black solid line indicates the median value of 32 against S1 and 28 against S2. Dotted line indicates cutoff for a positive response of 24 spots/million PBMC (n=98) (p=0.35). (B) Total spike-specific T cell responses as defined by IFNγ ELISpot assay. Black solid line indicates the median value of 84. Positive response defined as 48 spots/million (n=98). (C) T cell responses against spike by IFNγ ELISpot assay in relation to the history of previous natural infection. Blue indicates previous exposure (PE) (median 228 spots/million PBMC) and red indicates no previous exposure (NPE) (median 72 spots/million PBMC). Black solid line indicates the median value (n=98). Dotted line indicates cutoff for positive response. Solid black line indicates the median (p=0.0033). (D) T cell response against the nucleocapsid domain measured by IFNγ ELISpot assay in relation to the history of previous natural infection (p=0.049). (E) T cell response against the membrane domain measured by IFNγ ELISpot assay in relation to the history of previous natural infection (p≤0.0001). (F) Relationship of spike-specific whole antibody response by ELISA and spike-specific cellular response by ELISpot. Blue indicates PE and red indicates NPE. Dotted line indicates cutoff for ELISpot (r=0.46; p=0.000003). PBMC, peripheral blood mononuclear cell.
-
Figure 2—source data 1
Spike-specific T cell responses after vaccination.
- https://cdn.elifesciences.org/articles/69375/elife-69375-fig2-data1-v2.xlsx
Figure 3
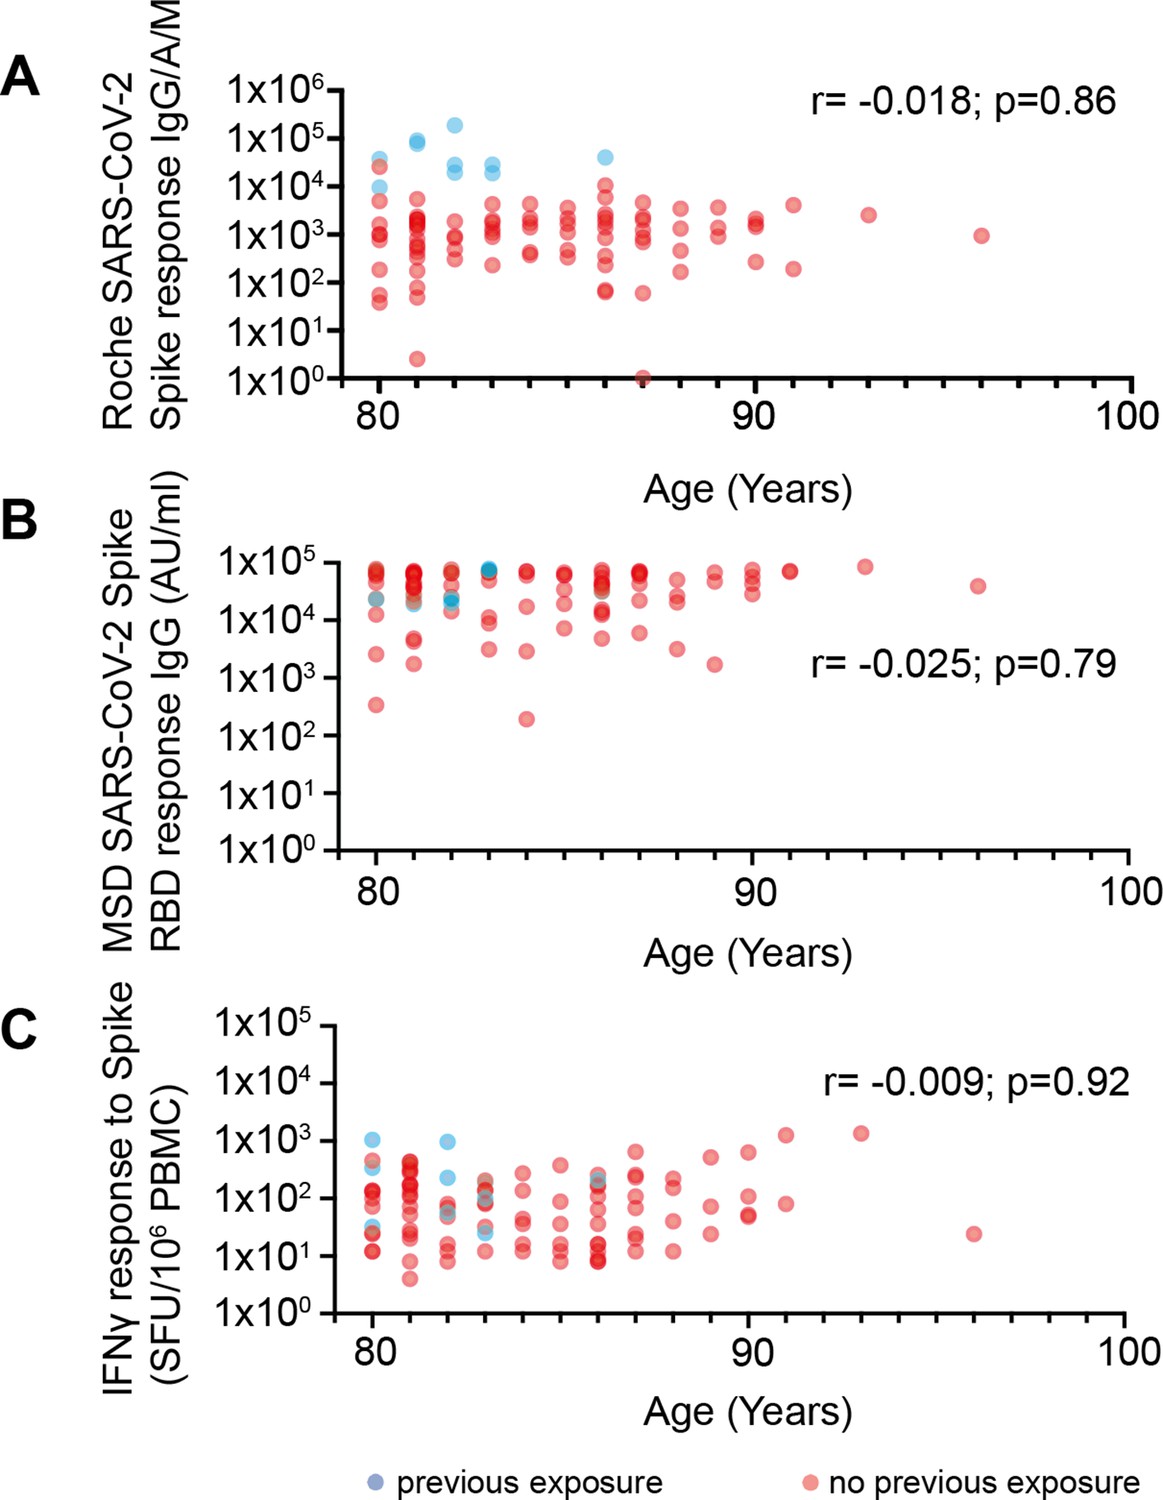
No correlation between age and vaccine response in donors 80–96 years of age.
(A) Spike-specific whole antibody response using Roche ELISA in relation to age. Blue data points indicate previous exposure (PE) and red indicates no previous exposure (NPE) (r=–0.018; p=0.86). (B) RBD-specific IgG response (MSD) in relation to age. Blue data points indicate PE and red indicates NPE (r=–0.025; p=0.79). (C) Spike-specific cellular response by ELISpot in relation to age. Blue data points indicate PE and red indicates NPE (r=–0.009; p=0.92).
-
Figure 3—source data 1
Cellular immune response to vaccination.
- https://cdn.elifesciences.org/articles/69375/elife-69375-fig3-data1-v2.xlsx
Figure 4
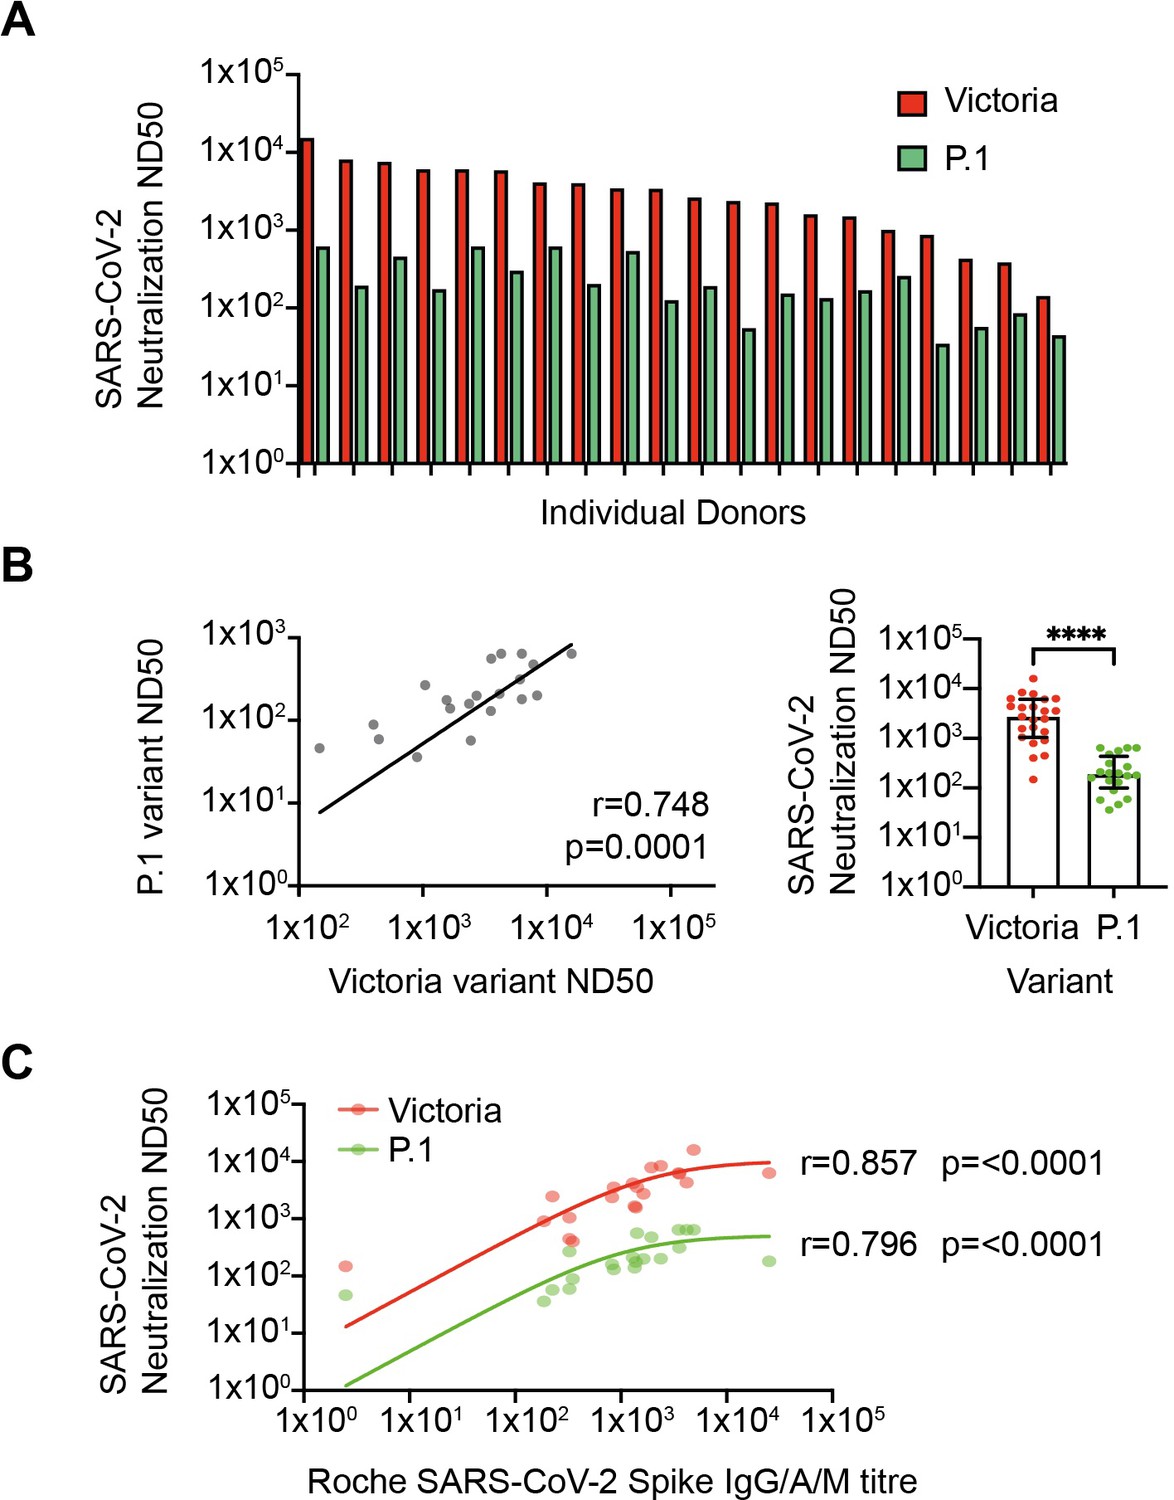
Neutralization of SARS-CoV-2 variants in vitro.
(A) SARS-CoV-2 neutralization in vitro. Red bars represent neutralization against the Victoria variant and green bars show neutralization against the P.1 variant (n=20). (B) Relationship between neutralization of Victoria and P.1 variants (r=0.748; p=0.0001; n=20, respectively; p≤0.0001). (C) Correlation between spike-specific IgG titer and viral neutralization against Victoria and P.1 variants (r=0.857; p≤0.0001 and r=0.796; p≤0.0001, respectively).
-
Figure 4—source data 1
Neutralization of SARS-CoV-2 variants in vitro.
- https://cdn.elifesciences.org/articles/69375/elife-69375-fig4-data1-v2.xlsx
Additional files
Download links
A two-part list of links to download the article, or parts of the article, in various formats.
Downloads (link to download the article as PDF)
Open citations (links to open the citations from this article in various online reference manager services)
Cite this article (links to download the citations from this article in formats compatible with various reference manager tools)
mRNA vaccination in people over 80 years of age induces strong humoral immune responses against SARS-CoV-2 with cross neutralization of P.1 Brazilian variant
eLife 10:e69375.
https://doi.org/10.7554/eLife.69375


