HspB8 prevents aberrant phase transitions of FUS by chaperoning its folded RNA-binding domain
- Max Planck Institute of Molecular Cell Biology and Genetics, Germany
- Dewpoint Therapeutics GmbH, Germany
- University of Konstanz, Department of Biology, Germany
- Konstanz Research School Chemical Biology, University of Konstanz, Germany
- Max Planck Institute for the Physics of Complex Systems, Germany
- Biotechnology Center, Technische Universität Dresden, Germany
- Department of Biomedical, Metabolic and Neural Sciences, University of Modena and Reggio Emilia, Italy
- Center for Systems Biology Dresden (CSBD), Germany
Figures
Figure 1 with 1 supplement
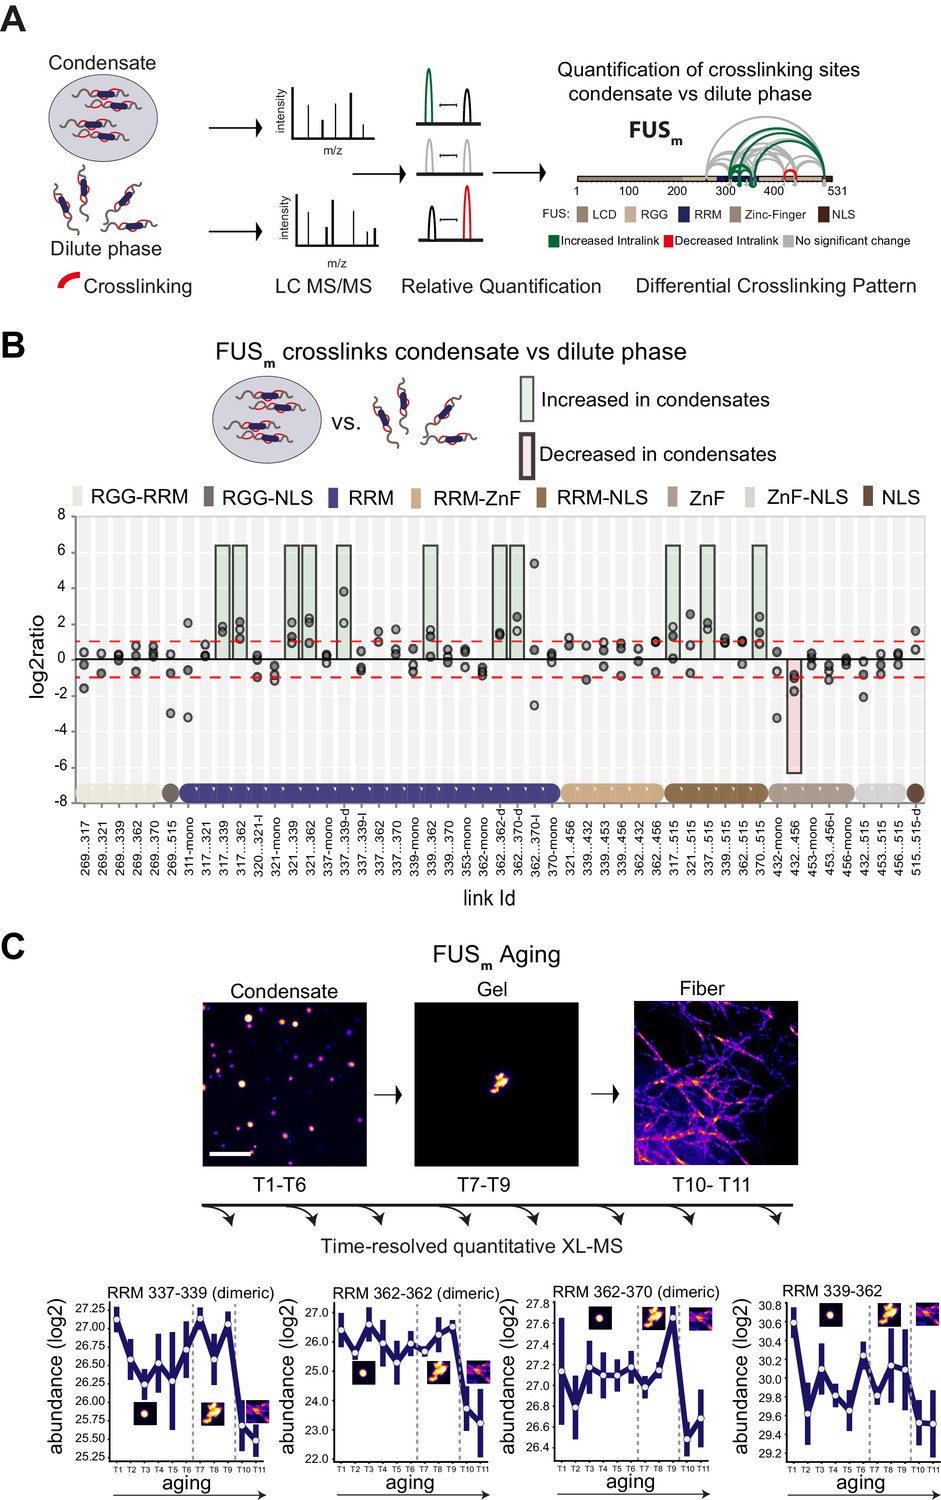
Domain-specific changes in crosslink abundances underlying condensate formation and molecular aging.
(A) Workflow of quantitative crosslinking coupled to mass spectrometry (qXL-MS) of FUSm condensates. (B) Crosslink abundance plot from reconstituted FUSm condensates. Plotted are the relative enrichment (droplet vs. non-droplet) for each unique crosslinking site (y-axis) sorted according to the known domain structure within FUSm (x-axis). Shown are only high confidence crosslinking sites (see Materials and methods for details) from three biologically independent sets of experiments (n=3; circles in different shades of gray). Please note that FUSm used throughout this manuscript contains both a C-terminal GFP used for visualization and a 5 AA N-terminal tag used for purification. All uxIDs therefore have an offset of 5 AA compared to the UniProt entry for human FUS (P35637). Crosslinking sites that were consistently upregulated or downregulated twofold or more (log2ratio≥1 or ≤−1 and FDR≤0.05) in at least two out of three biological replicate sets and in addition contained no opposing regulation in any replicate set were considered significant and are highlighted with a green (enriched in droplets) or red background rectangle (decreased in droplets). All other changes in crosslinking abundances were considered insignificant and are shown on gray background. The significance threshold of twofold enrichment is indicated as dashed red line. Dimeric links are indicated by an additional ‘−d’, loop-links by a ‘−l’ and mono-links by an ‘-mono’ at their respective unique crosslinking site. Domain structures within FUSm are color-coded as in (A). RGG refers to AAs 220–289. (C) Upper panel: workflow time-resolved quantitative XL-MS. The conversion of fresh FUSm condensates via the gel state into fibers was monitored by fluorescence microscopy. Scale bar is 10 µm. At indicated time points, aliquots of the stock solution were crosslinked for 5 min, flash-frozen in liquid nitrogen, and subsequently analyzed by MS (see Materials and methods for details). Lower panel: shown are changes of RRM crosslinks during aging that were increased during condensation (B). The logarithmic total MS1 area for each time point during aging is plotted (SDs; n=6). Domain structures within FUSm are color-coded as in (A). RRM, RNA recognition motif.
Figure 1—figure supplement 1
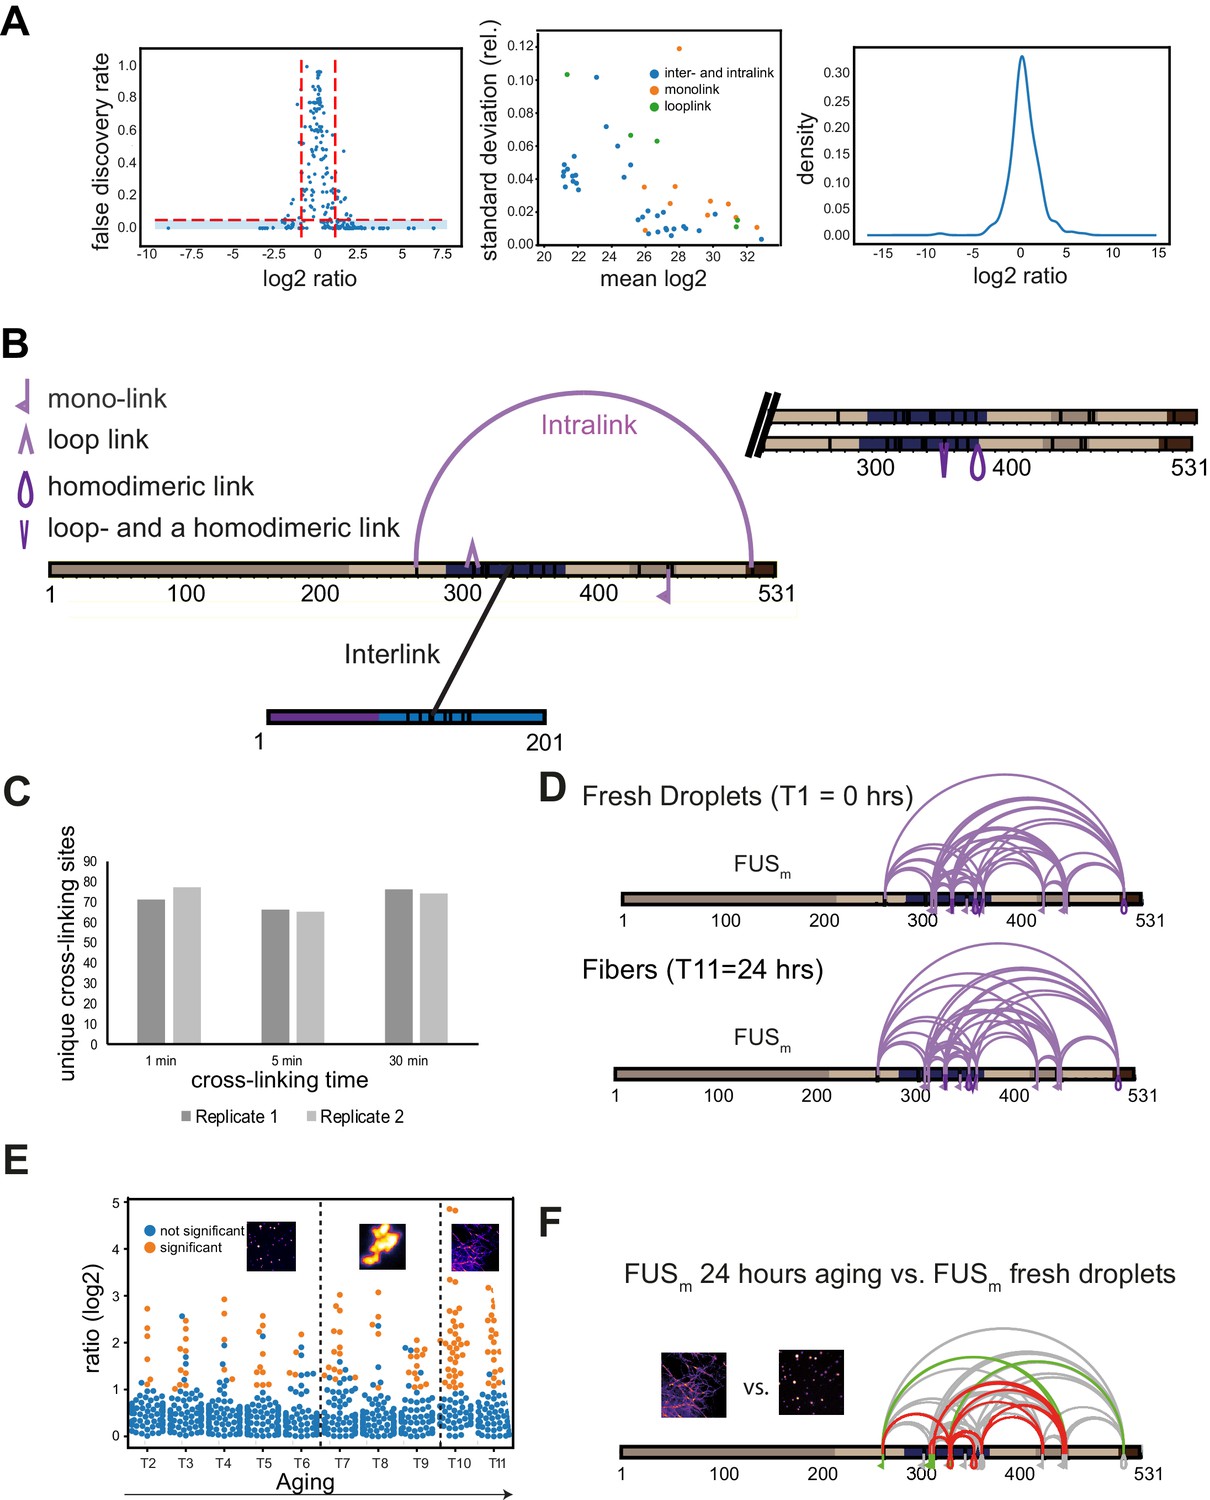
Quantitative and time-resolved XL-MS reveal domain-specific changes in crosslink abundances underlying condensate formation.
(A) Statistical validation of crosslinking data. Left panel shows the relationship between the log2ratio and FDR for qXL-MS data. FDR values are p-values corrected for multiple testing (see Materials and methods for details). Significant crosslinks are shown in the blue-shaded area (log2ratio≥1 or ≤−1 and FDR≤0.05). The majority of crosslinks with a high FDR value are found between the log2ratios of −1 and +1. The middle panel shows that quantifications are highly reproducible within triplicate measurements. Plotted is the absolute mean MS1 peak area per crosslink and experiment in log2-scale (where the mean is made up of the light and heavy state and the biological replicates of a crosslink) (x-axis) versus the relative standard deviation of the mean (y-axis). It increases with a decreasing mean but remains below 10% for virtually all crosslinks. The right panel shows that the overall distribution of log2ratios is centered around 0, confirming that the data has no systematic bias. (B) Disuccinimidyl suberate (DSS) was used to introduce covalent bonds between proximal primary amines in order to link lysine residues within studied proteins. The actual crosslinking sites are subsequently identified by MS and reflect the spatial proximity of regions and protein-domains within a given protein (intra-link) or between different proteins (inter-link). Additionally, the crosslinker can react twice within one peptide (loop-link) or only on one side with the protein and hydrolyze on the other side (mono-link), revealing information on the accessibility of a specific lysine residue. XL-MS cannot readily discriminate if a crosslink has formed within one polypeptide chain (defined as intra-link, vide supra) or between homodimers or even higher oligomers of the same protein. This is usually not a problem, but in the case of the high protein concentrations within condensates it may play a role. However, as we detect all shown intra-links within FUSm and HspB8 also under the relatively low-concentration regime of the dilute phase, it is fair to assume that all of the links are indeed intra-links as usually defined—for example occurring within one FUSm polypeptide chain—as we assume in the current version of the manuscript. For some specific intra-links, we do however know that they must have occurred between different molecules of the same protein; these are crosslinks between overlapping peptides whose sequence is unique within the protein and that must therefore originate from different copies of the same protein (homo-dimeric link). (C) Significantly shorter crosslinking time periods than conventionally used lead to reproducible and sufficient crosslinking yields. A test protein was crosslinked for different time periods (1 min, 5 min, and the standard 30 min) before the reaction was quenched and crosslinks were identified by LC-MS/MS (data for two biological replicates are shown). In order to minimize the induced error rate due to sample handling, a crosslinking period of 5 min was chosen for all time points. (D) Crosslinks of FUSm from fresh droplets (T1=0 hr) (upper panel) and the final fiber state (T11=24 hr) (lower panel) reveal a similar overall crosslinking pattern. Experiments were carried out in triplicates and crosslinks were only considered, if they were identified in two out of three replicates with a deltaS<0.95, a minimum Id score≥20, and an ld score≥25 in at least one replicate (filtering was done on the level of the unique crosslinking site) and an FDR<0.05. (E) Overview plot of all crosslinks consistently quantified over 11 time points during the aging process. Crosslinks with a significant change relative to fresh condensates (T1) (log2ratio≥1 or ≤−1 and FDR≤0.05) were colored orange while non-significantly changed crosslinks were colored blue. (F) Comparison of the overall differential crosslinking pattern from FUSm from the final fiber state (T11=24 hr) versus fresh droplets (T1=0 hr). Crosslinking sites that were upregulated or downregulated twofold or more (log2ratio≥±1.0 and FDR≤0.05) were considered significant and are highlighted in green (i.e., relative enrichment in final fiber state) or red (i.e., relative decrease in final fiber state). All other changes in crosslinking abundances were considered insignificant and are shown in gray background.
Figure 2 with 1 supplement

The small heat shock protein HspB8 partitions into FUS condensates and interacts with the RRM domain.
(A) 0.25 µM Cy3-labeled HspB8, 4.75 µM unlabeled HspB8 (1:20 mix), and 5 µM FUSm-GFP were mixed in low salt buffer and the resulting droplets were imaged in a confocal microscope. Scale bar is 10 µm. (B) Fluorescence intensity plot profile spanning a FUSm-HspB8 droplet in (A). (C) 0.25 µM Cy3-labeled HspB1, 4.75 µM unlabeled HspB1 (1:20 mix), and 5 µM FUSm-GFP were mixed in low salt buffer and imaged in a confocal microscope. Scale bar is 10 µm. (D) Fluorescence intensity plot profile spanning a FUSm-HspB1 droplet in (C). (E) Overall crosslinking pattern of mixtures of FUSm and HspB8 that were crosslinked under condensate-inducing low salt conditions (75 mM) and separated into the dilute phase (left) and dense phase of the condensates (right) by centrifugation. Experiments were carried out in three biologically independent sets of experiments (meaning separate batches of expressed protein). For one set of experiments, each sample was independently crosslinked in triplicates and crosslinks were only considered, if they were identified in two out of three replicates with a deltaS<0.95, a minimum Id score≥20, and an ld score≥25 in at least one replicate (filtering was done on the level of the unique crosslinking site) and an FDR≤0.05. Inter-links are shown in black and the total number of identifications is indicated by the thickness of the connection. Intra-links are shown in violet, mono-links with a flag, loop links with a pointed triangle, and homo-dimeric links with a loop. (F) Representative overview of observed crosslinks between the LCD and RRM domains in FUSm and the IDR and αCD domains in HspB8 in the dilute and the dense phase as detected by XL-MS (based on (E), Figure 2—figure supplement 1F and G). αCD, α-crystallin domain; IDR, intrinsically disordered region; LCD, low complexity domain; RRM, RNA recognition motif.
Figure 2—figure supplement 1
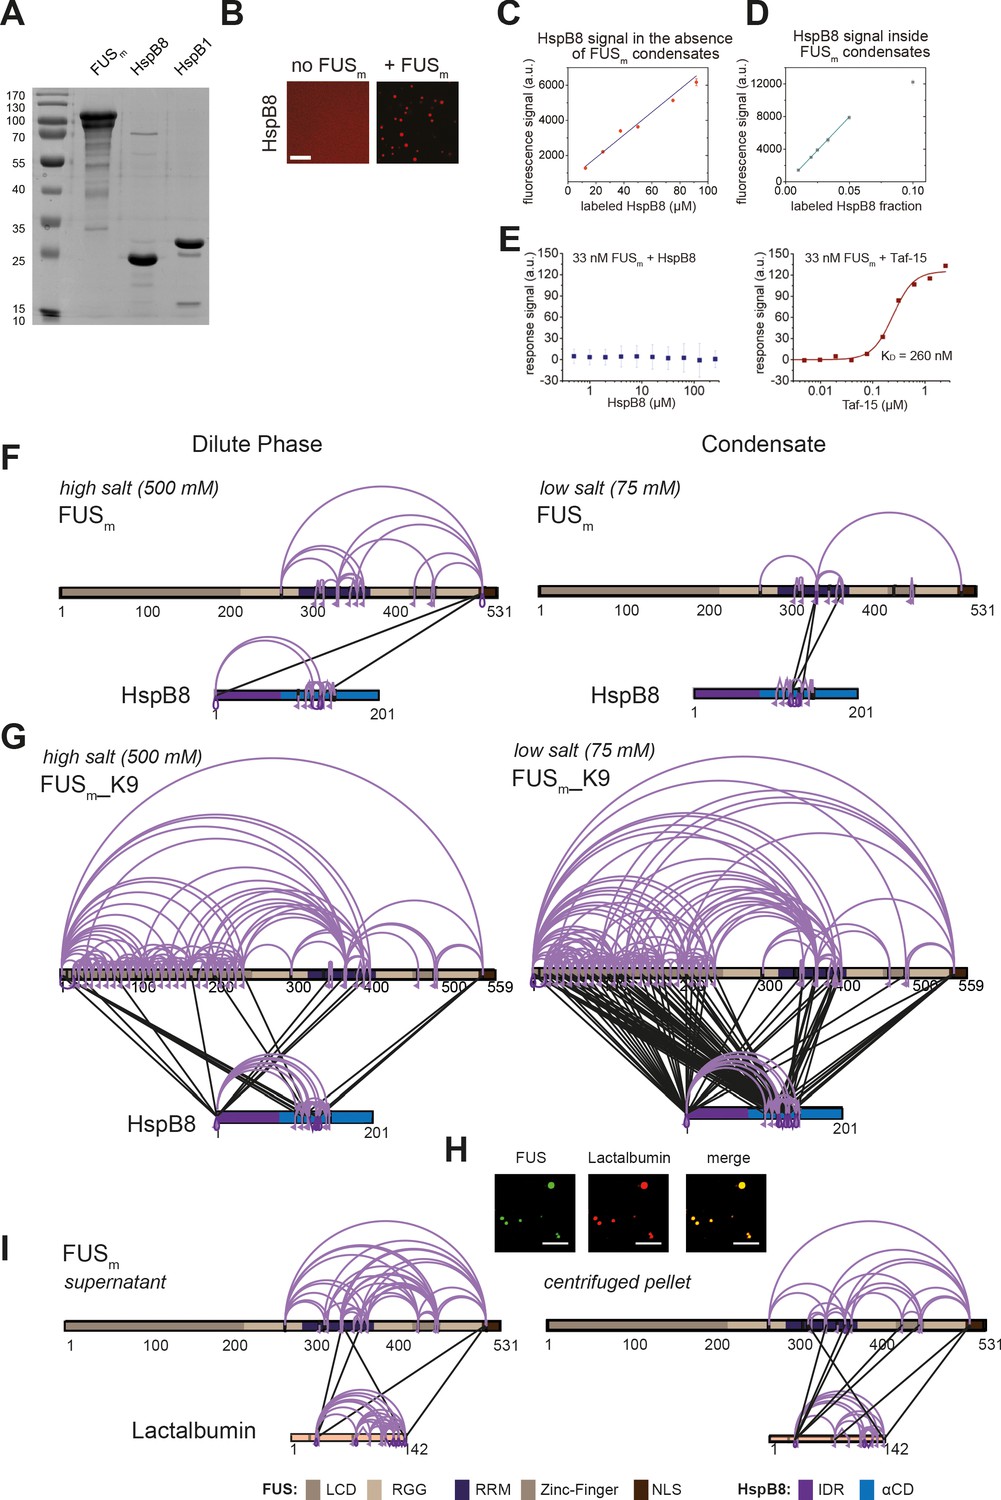
The small heat shock protein HspB8 partitions into FUS condensates and interacts with the RRM domain.
(A) SDS-PAGE of purified FUSm, HspB8, and HspB1 proteins used in this study. (B) 5 µM HspB8 (1:20 mix of Cy3-labeled:unlabeled) in the absence and presence of 5 µM FUSm, Cy3 channel is shown. Scale bar is 10 µm. (C) Calibration curve for pure Cy3-labeled HspB8 in the absence of condensates. (D) Cy3 fluorescence signal inside condensates formed by 5 µM FUSm in the presence of different ratios of Cy3-labeled and unlabeled HspB8. The Cy3 fluorescence signal inside the condensates is linear up to a ratio of 1:20 of labeled:unlabeled HspB8 (labeled HspB8 fraction of 0.05). (E) To test for a potential interaction between HspB8 and FUSm in the dilute phase, protein-protein interactions of 33 nM FUSm and HspB8 (left panel) and Taf-15 (right panel) were assessed under non-phase separating conditions (500 mM KCl) by Microscale Thermophoresis (Jerabek-Willemsen et al., 2011). While FUSm tightly bound to the stress granule protein Taf-15 with a KD of 260 nM, there was no detectable interaction between HspB8 and FUSm, even at a chaperone concentration of 120 µM. (F) Overall crosslinking pattern from mixtures of recombinant FUSm and HspB8 under identical high salt (500 mM NaCl) (left) and condensate inducing low salt (75 mM NaCl) (right) conditions as used for the fluorescence microscopy experiments (Figure 2A and C). (G) Overall crosslinking pattern of mixtures of the recombinant FUSm_K9 variant and HspB8 under high salt (500 mM KCl) (left) and condensate inducing low salt (75 mM KCl) (right) conditions. As FUSm contains no lysine residues within its LCD which are amenable to our NHS-ester crosslinker, we generated a FUSm variant with an additional ‘26’ lysines in the LCD (FUSm_K9), which resembles FUSm in its condensation behavior even though it does not exhibit a similar aging phenotype. We find that in the dense phase of the condensates the number of inter-links between the LCD of FUSm and both the IDR and the αCD of HspB8 was strongly increased, confirming previous results on the role of the LCD during phase separation (Wang et al., 2018). However, only inter-links between the αCD of HspB8 and the RRM of FUSm were exclusively detected inside condensates. (H) Microscopic images of FUSm and lactalbumin under condensate inducing high salt conditions (500 mM NaCl). Scale bar is 10 µm. (I) As a control, we investigated the interaction between FUSm and lactalbumin. Lactalbumin is a molten globule protein that partitions into FUSm condensates likely mediated by unspecific interactions between partially exposed hydrophobic patches in the client and the condensate scaffold protein. Mixtures of FUSm and lactalbumin that were crosslinked under condensate inducing low salt conditions (75 mM) and subsequently separated into the dilute phase (left) and dense phase of the condensates (right) by centrifugation did not show any significant differences in the overall crosslink patterns of dilute and dense phase. This suggests that in contrast to the HspB8: FUSm interaction, partitioning of lactalbumin into FUSm condensates is caused by unspecific interactions. (F, G, I) Samples were independently crosslinked in triplicates and crosslinks were only considered, if they were identified in two out of three replicates with a deltaS<0.95, a minimum Id score≥20, and an ld score≥25 in at least one replicate (filtering was done on the level of the unique crosslinking site) and an FDR≤0.05. Inter-links are shown in black, intra-links are shown in violet, mono-links with a flag, loop links with a pointed triangle, and homo-dimeric links with a loop. Cases where a looplink and a homo-dimeric link were identified on the same lysine are indicated by a triangle pointed downwards. LCD, RGG, RRM, ZnF, and NLS of FUSm are shown in different shades of brown and blue, respectively. The IDR and αCD in HspB8 are colored in dark violet and dark blue, respectively. αCD, α-crystallin domain; IDR, intrinsically disordered region; LCD, low complexity domain; RRM, RNA recognition motif.
-
Figure 2—figure supplement 1—source data 1
Uncropped image for Figure 2—figure supplement 1A.
- https://cdn.elifesciences.org/articles/69377/elife-69377-fig2-figsupp1-data1-v2.pdf
Figure 3 with 1 supplement
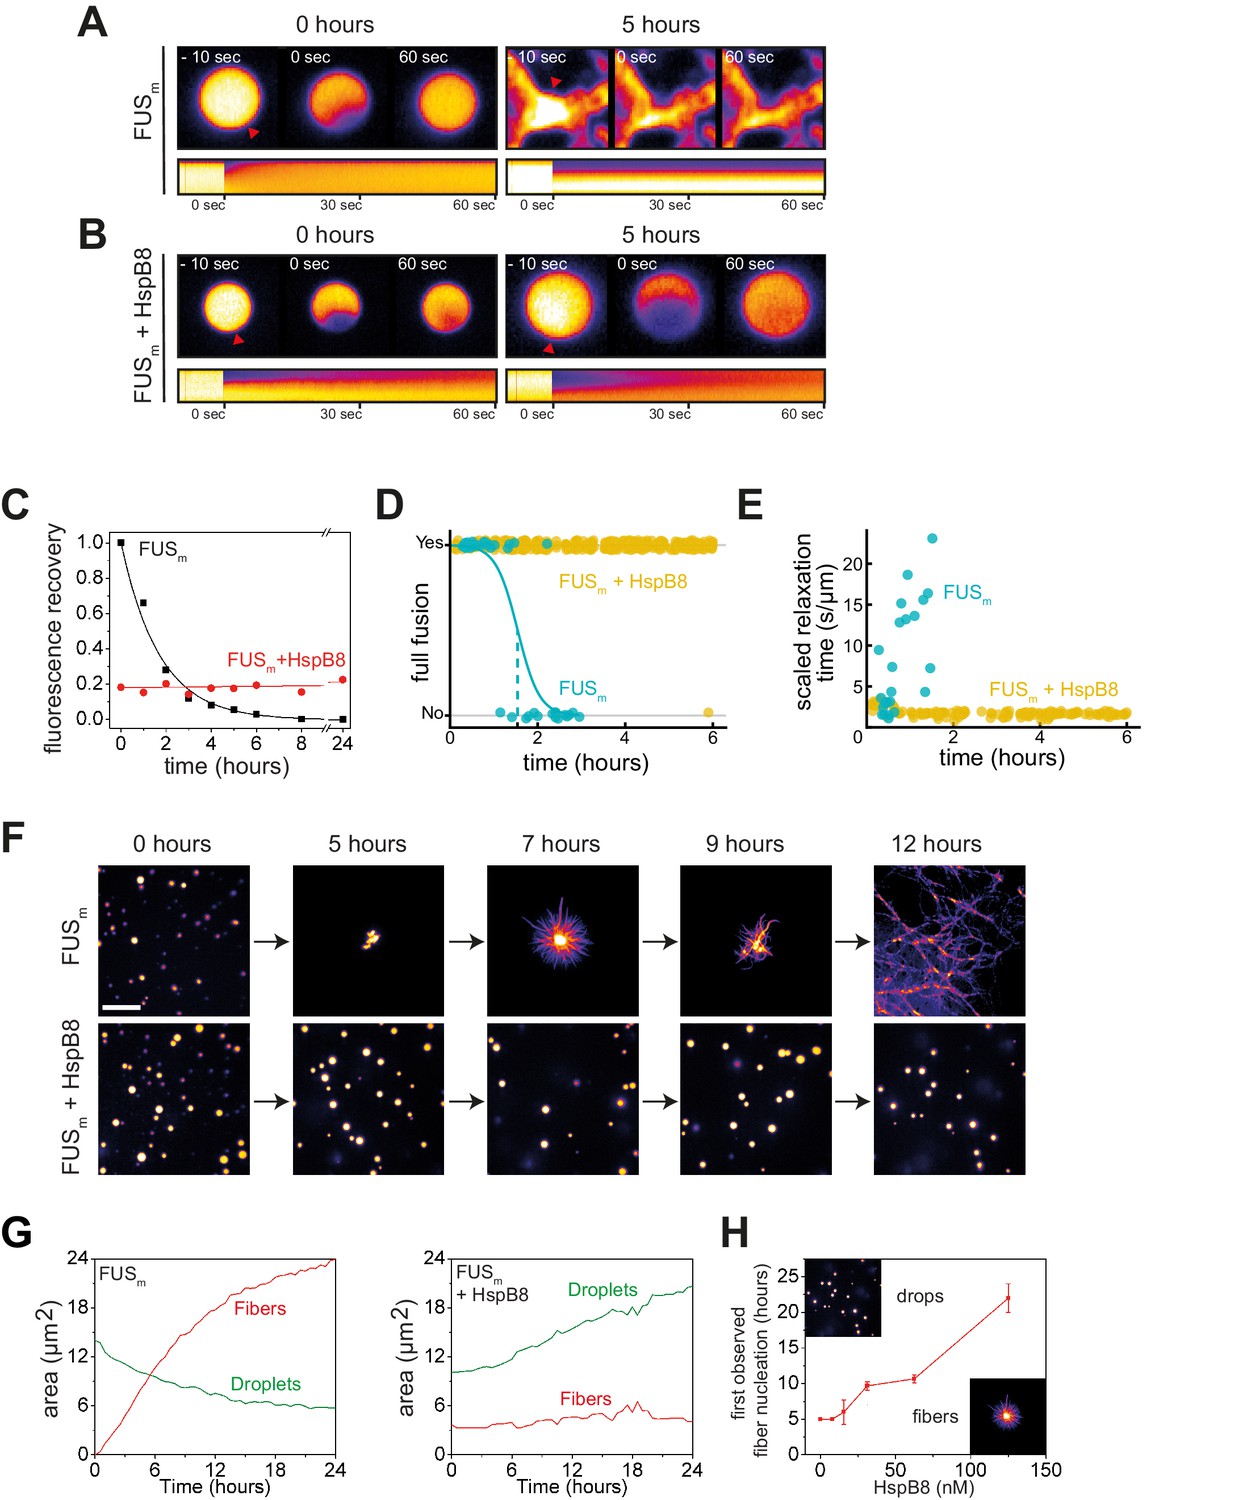
HspB8 prevents hardening and fiber formation of FUS droplets and keeps them dynamic.
(A) FRAP experiment of fresh FUSm condensates (0 hr) and condensates incubated for 5 hr. A kymograph shown below illustrates the kinetics of the process. (B) FRAP experiment of fresh FUSm condensates mixed with HspB8 (0 hr) and condensates incubated for 5 hr. A kymograph shown below illustrates the kinetics of the process. (C) Kinetics of the FUSm aging process. Plotted are the initial slopes of the FRAP recovery curves for FUSm condensates in the absence (black) or presence of HspB8 (red). (D) Successful complete fusion events were registered over time, demonstrating the aging process of the FUSm sample in the absence (turquoise, N=40) or the presence of HspB8 (yellow, N=330). The half-life of liquid-like FUSm condensates alone was estimated to be around 1.5 hr from logistic regression. (E) The size-normalized coalescence relaxation time is an indicator for the material state of the condensates. While it increases for FUSm condensates during the hardening process, it stays constant over 6 hr in the presence of HspB8. Tweezer experiments were performed with fresh samples of 5 μM FUSm with or without 20 μM HspB8. (F) Aging process of 5 µM FUSm condensates in the absence and presence of 5 µM HspB8. In the presence of the chaperone, the droplet morphology is maintained over the whole timeframe of the experiment (12 hr). Scale bar is 10 µm. (G) Left panel: shown is the total area of droplet material (green line) or fibrous material (red line) within FUSm droplets as a function of time after FUSm droplets were added to the existing fibrous material. Spacing between data points is 30 min. Right panel: shown is the total area of droplet material (green line) and fibrous material (red line) within FUSm droplets as a function of time after FUSm droplets and HspB8 were added to the existing fibrous material. Spacing between data points is 30 min. (H) The onset of 5 µM FUSm fiber formation as a function of HspB8 concentration. FRAP, fluorescence recovery after photobleaching.
Figure 3—figure supplement 1
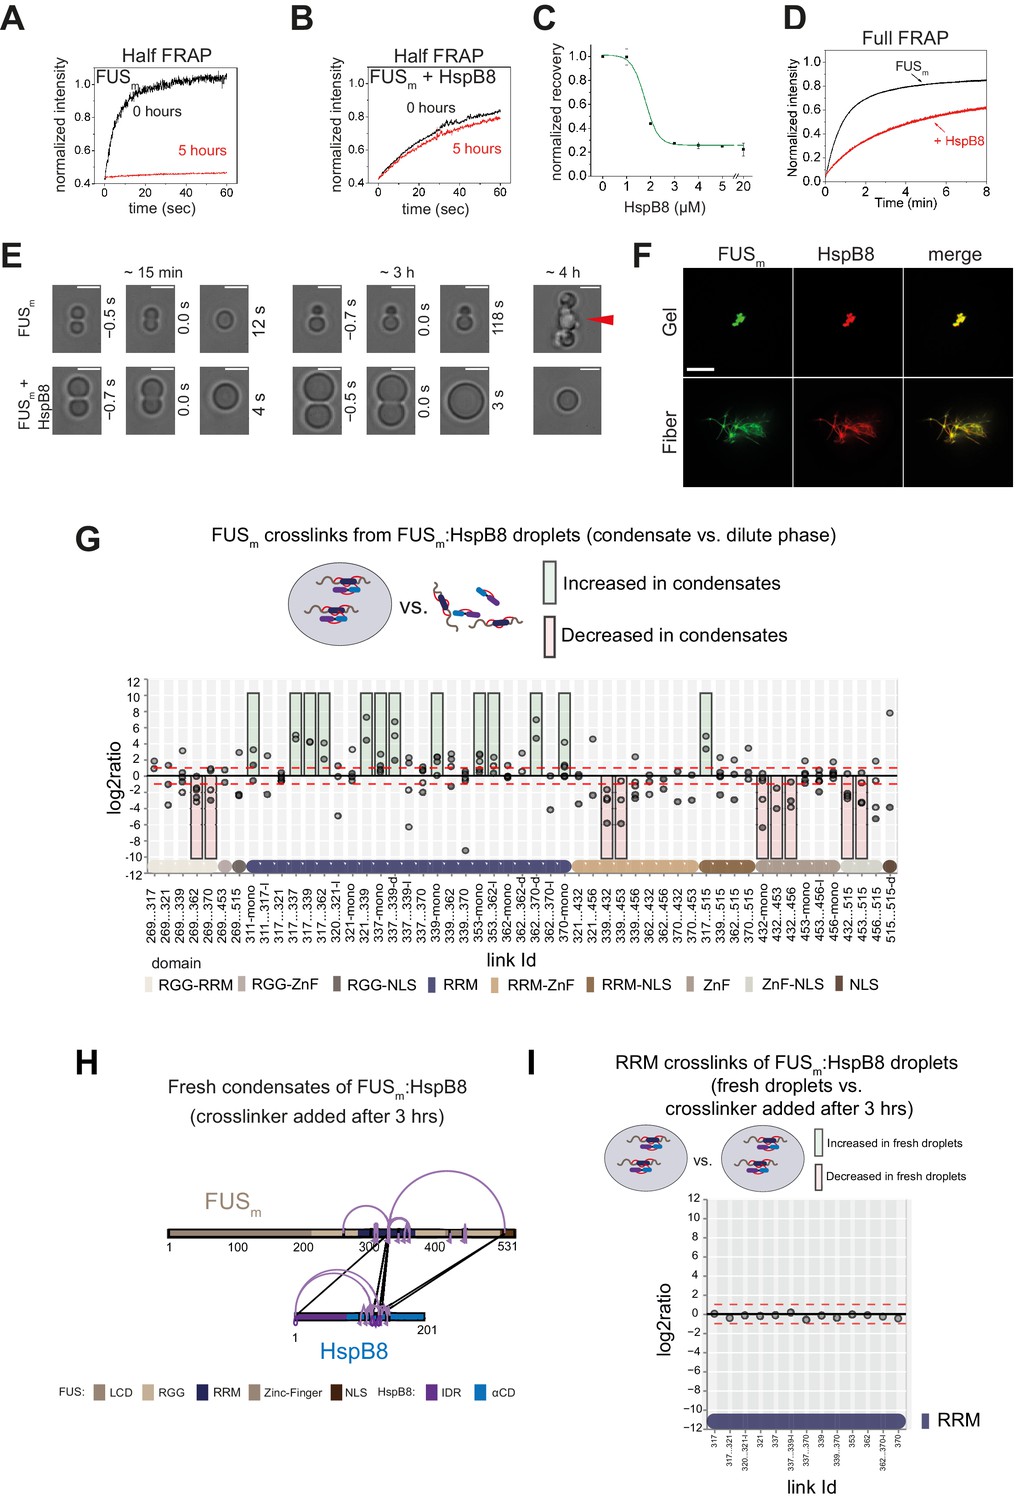
HspB8 prevents hardening and fiber formation of FUS droplets and keeps them dynamic.
(A) Quantification of a half-bleach FRAP experiment of fresh FUSm condensates (black) and condensates incubated for 5 hr (red). (B) Same experiment as in (A) in the presence of 5 µM HspB8. (C) HspB8-dependent decrease in mobility has an EC50 of 1.5 µM. Plotted are the initial slopes of the FRAP recovery curves for 5 µM FUSm condensates in the presence of different concentrations of HspB8. (D) Quantification of a full-bleach FRAP experiment of fresh FUSm condensates in the absence (black) and presence of 5 µM HspB8 (red). (E) Representative images of attempted fusion events at early and late stages. Attempts to fuse several droplets of FUSm condensates after hardening result in large amorphous assemblies (red arrow). Scale bar is 3 μm. (F) Colocalization of gels or fibers formed by FUSm and Cy3-labeled HspB8. Scale bar is 10 µm. (G) Crosslink abundance plot from reconstituted FUSm:HspB8 condensates. Plotted are the relative enrichment (droplet vs. non-droplet) for each unique crosslinking site (y-axis) sorted according to the known domain structure within FUSm and HspB8 (x-axis). Shown are only high confidence crosslinking sites (see Materials and methods for details) from five biologically independent sets of experiments (n=5; circles in different shades of gray). Crosslinking sites that were consistently upregulated or downregulated twofold or more (log2ratio≥1 or ≤−1 and FDR≤0.05) in at least two out of five biological replicate sets of experiments and in addition contained no opposing regulation in any replicate set were considered significant and are highlighted with a green (enriched in droplets) or red background rectangle (decreased in droplets). All other changes in crosslinking abundances were considered insignificant and are shown on gray background. The significance threshold of twofold enrichment is indicated as dashed red lines. Dimeric links are indicated by an additional ‘−d’, loop-links by a ‘−l’, and mono-links by an ‘-mono’ at their respective unique crosslinking site. (H) Overall crosslinking pattern of FUSm:HspB8 condensates that were allowed to mature and that were crosslinked 3 hr after their initial formation. (I) Focus on the RRM domain. A comparison of the crosslinks within the RRM (intra, loop, and mono-links) shows no change in abundance when FUSm:HspB8 condensates of fresh droplets were compared with those that were crosslinked 3 hr after their initial formation. FRAP, fluorescence recovery after photobleaching; RRM, RNA recognition motif.
Figure 4 with 1 supplement
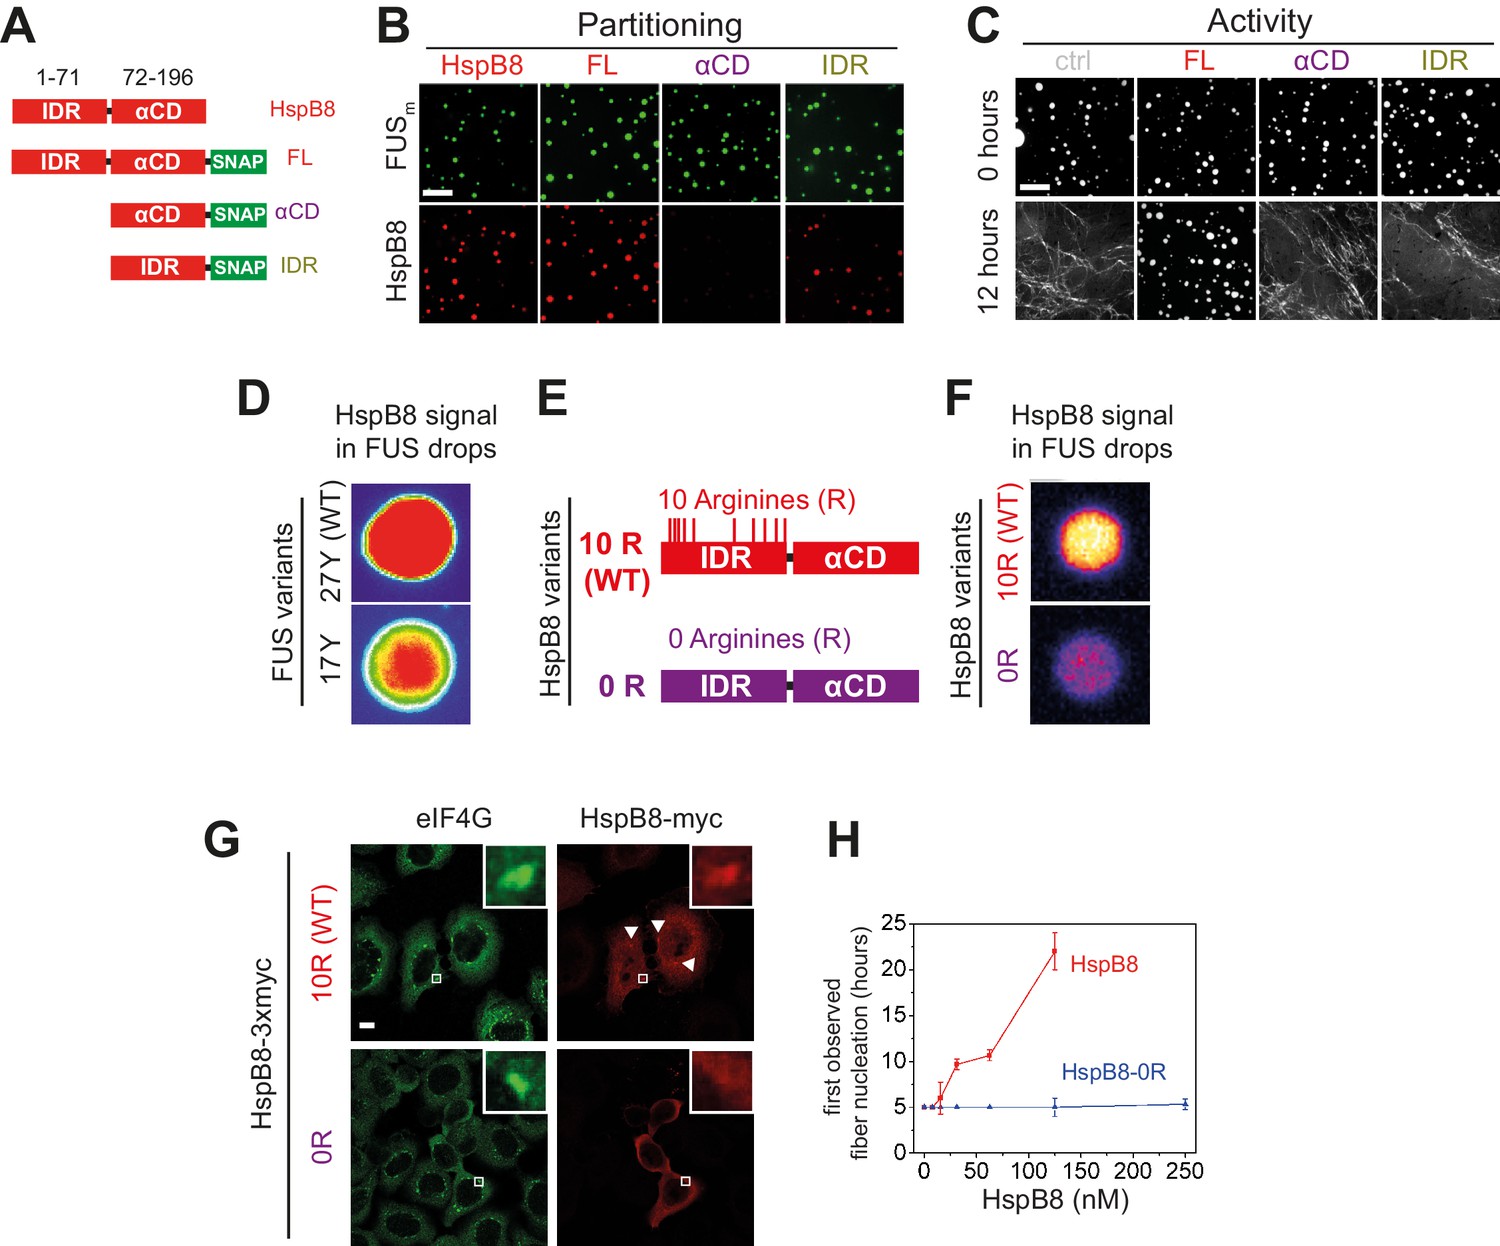
Arginines within the disordered region of HspB8 direct the α-crystallin domain into FUS condensates for chaperoning.
(A) Overview of HspB8 truncation variants used in this study. FL (full-length HspB8 fused to a SNAP-tag), αCD (HspB8 alpha-crystallin domain [AA72–196] fused to a SNAP-tag), and IDR (HspB8-N-terminus [AA1–71] fused to a SNAP-tag). (B) Partitioning of 5 µM HspB8 SNAP constructs (1:20 mix of labeled:unlabeled) into 5 µM FUSm condensates. Scale bar is 10 µm. (C) Aging assay of 5 µM FUSm condensates in the absence (ctrl) and presence of 5 µM HspB8 truncation variants. Scale bar is 10 µm. (D) Partitioning of 5 µM HspB8 (1:20 mix of labeled:unlabeled) into condensates formed by 5 µM FUS wildtype (27 Y, WT) or a variant with a reduced number of tyrosines in its IDR (17 Y). (E) Location of Arg residues in the primary structure of HspB8. 10 Arg residues are located in the N-terminus of HspB8-WT (10 R). In the HspB8-0R variant, these Arg residues are replaced by Gly residues (0 R). (F) Partitioning of 5 µM HspB8-WT or HspB8-0R variant (1:20 mix of labeled:unlabeled) into condensates formed by 5 µM FUSm. (G) HeLa Kyoto cells expressing HSPB8-WT-3xmyc or HSPB8-0R-3xmyc from a plasmid were subjected to heat shock at 43.5°C for 1 hr. Cells were fixed and stained with myc and eIF4G specific antibodies. Merged image composed of eIF4G (green) and myc (red) signals is shown. (H) The onset of 5 µM FUSm fiber formation as a function of HspB8-0R concentration. IDR, intrinsically disordered region.
Figure 4—figure supplement 1

Arginines in the disordered region of HspB8 direct the αCD into FUS condensates.
(A–D) Disorder prediction and circular dichroism of HspB8 and closely related HspB1. (A) Disorder prediction plot using Dis-EMBL1.5 (Linding et al., 2003) for HspB8 shows that except for the αCD a large portion of the chaperone is predicted to be disordered while (C) HspB1 is predicted to be much less disordered. The αCD of HspB8 was predicted by sequence similarity to the crystallized αCD of HspB1. (B) Circular dichroism analysis shows the typical spectrum of a disordered protein for HspB8, while the analysis of HspB1 (D) reveals mainly beta-sheet content. (E) Quantification of the partitioning of HspB8 truncation variants into condensates formed by full-length FUSm as shown in (Figure 4B). (F) The onset of 5 µM FUSm fiber formation as a function of HspB8 truncation variant concentration. (G) Kinetics of the FUSm aging process. Plotted are the initial slopes of the FRAP recovery curves for FUSm condensates in the absence and presence of 5 µM HspB8 truncation variants. (H) Quantification of the partitioning of HspB8 truncation variants into condensates formed by the FUS-LCD in the presence of 10% Dextran. (I) Overview of HspB8-HspB1 swap variants used in this study. IDR8αCD1 carries an IDR from HspB8 and an αCD from HspB1. IDR1αCD8 carries an IDR from HspB1 and an αCD from HspB8. (J) Partitioning of 5 µM HspB8-HspB1 swap variants (1:20 mix of labeled:unlabeled) into 5 µM FUSm condensates. Scale bar is 10 µm. (K) Quantification of the partitioning experiment described in (G). (L) Aging assay of 5 µM FUSm condensates in the absence (ctrl) and presence of 5 µM HspB8 truncation variants. Scale bar is 10 µm. (M) The onset of 5 µM FUSm fiber formation as a function of HspB8-HspB1 swap variant concentration. (N) Kinetics of the FUSm aging process. Plotted are the initial slopes of the FRAP recovery curves for FUSm condensates in the absence and presence of 5 µM HspB8-HspB1 swap variants. αCD, α-crystallin domain; FRAP, fluorescence recovery after photobleaching; IDR, intrinsically disordered region; LCD, low complexity domain.
Figure 5 with 1 supplement
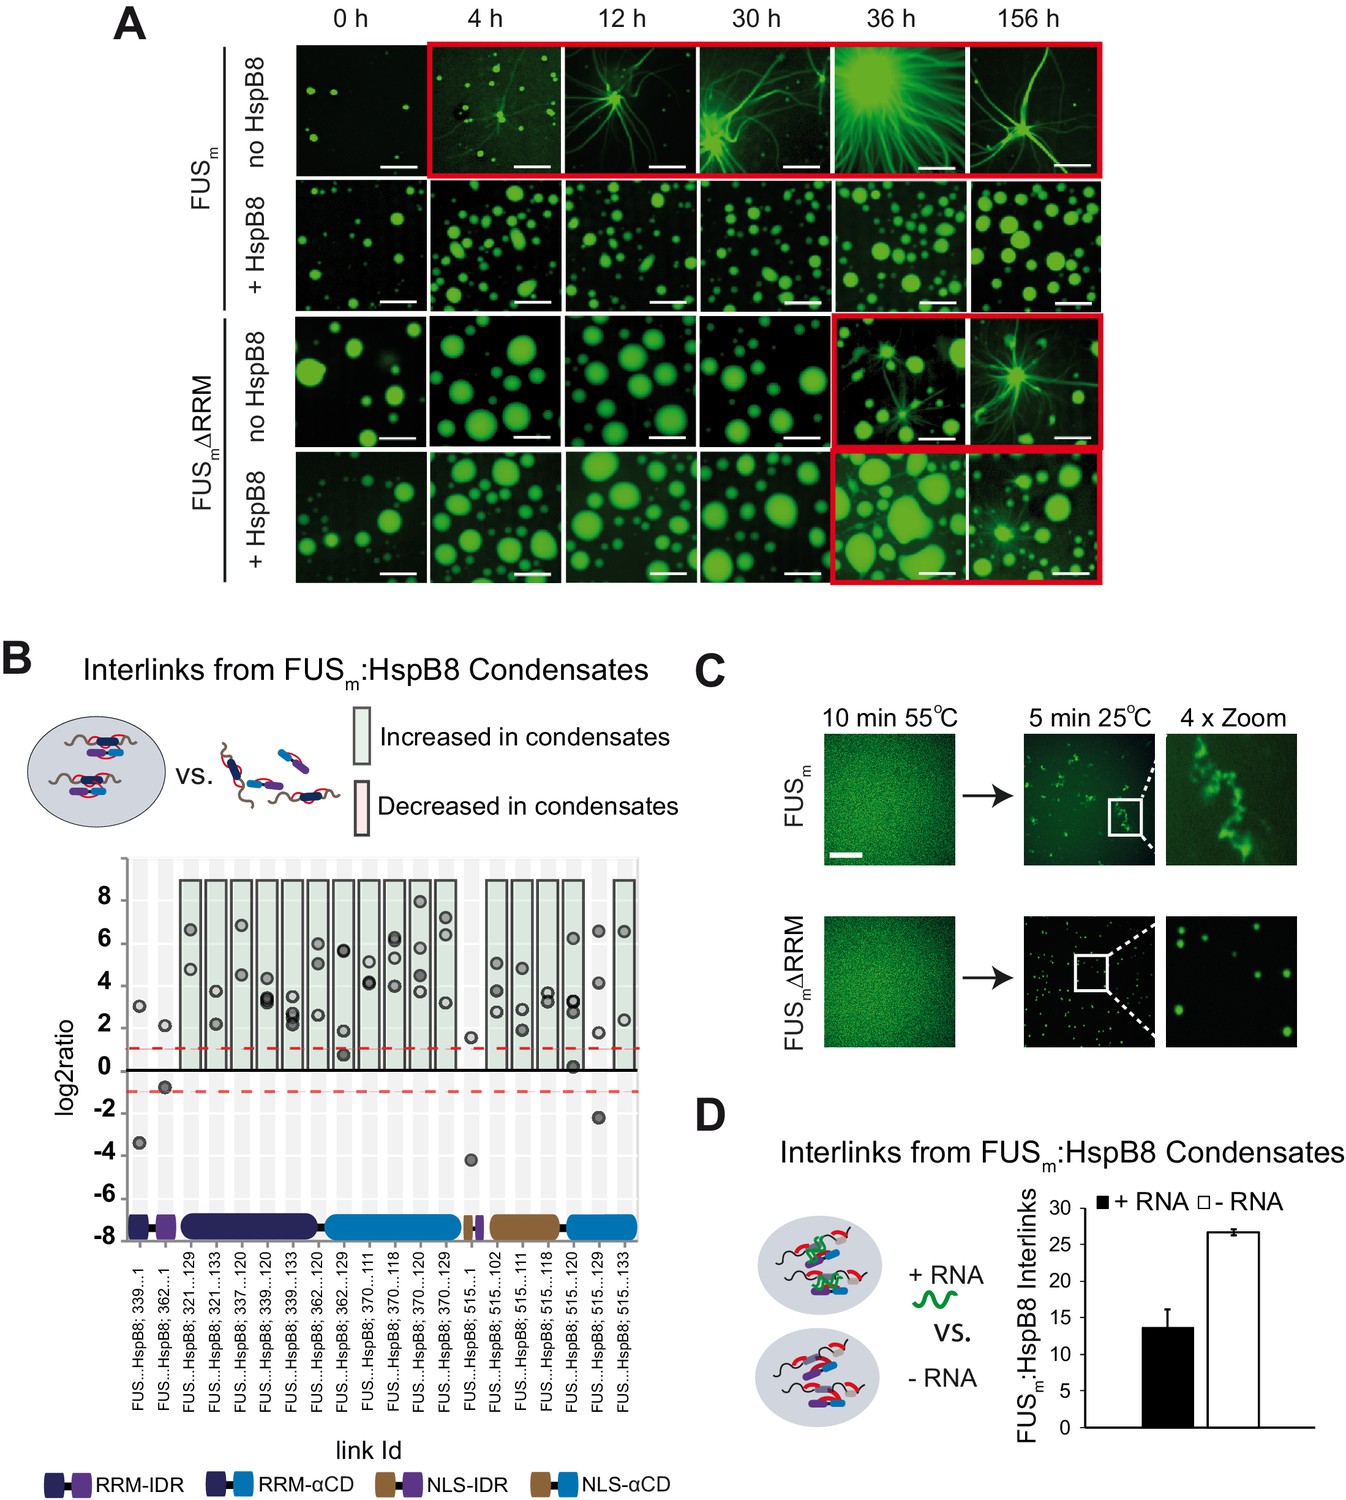
RRM unfolding drives FUS aggregation and is rescued by HspB8.
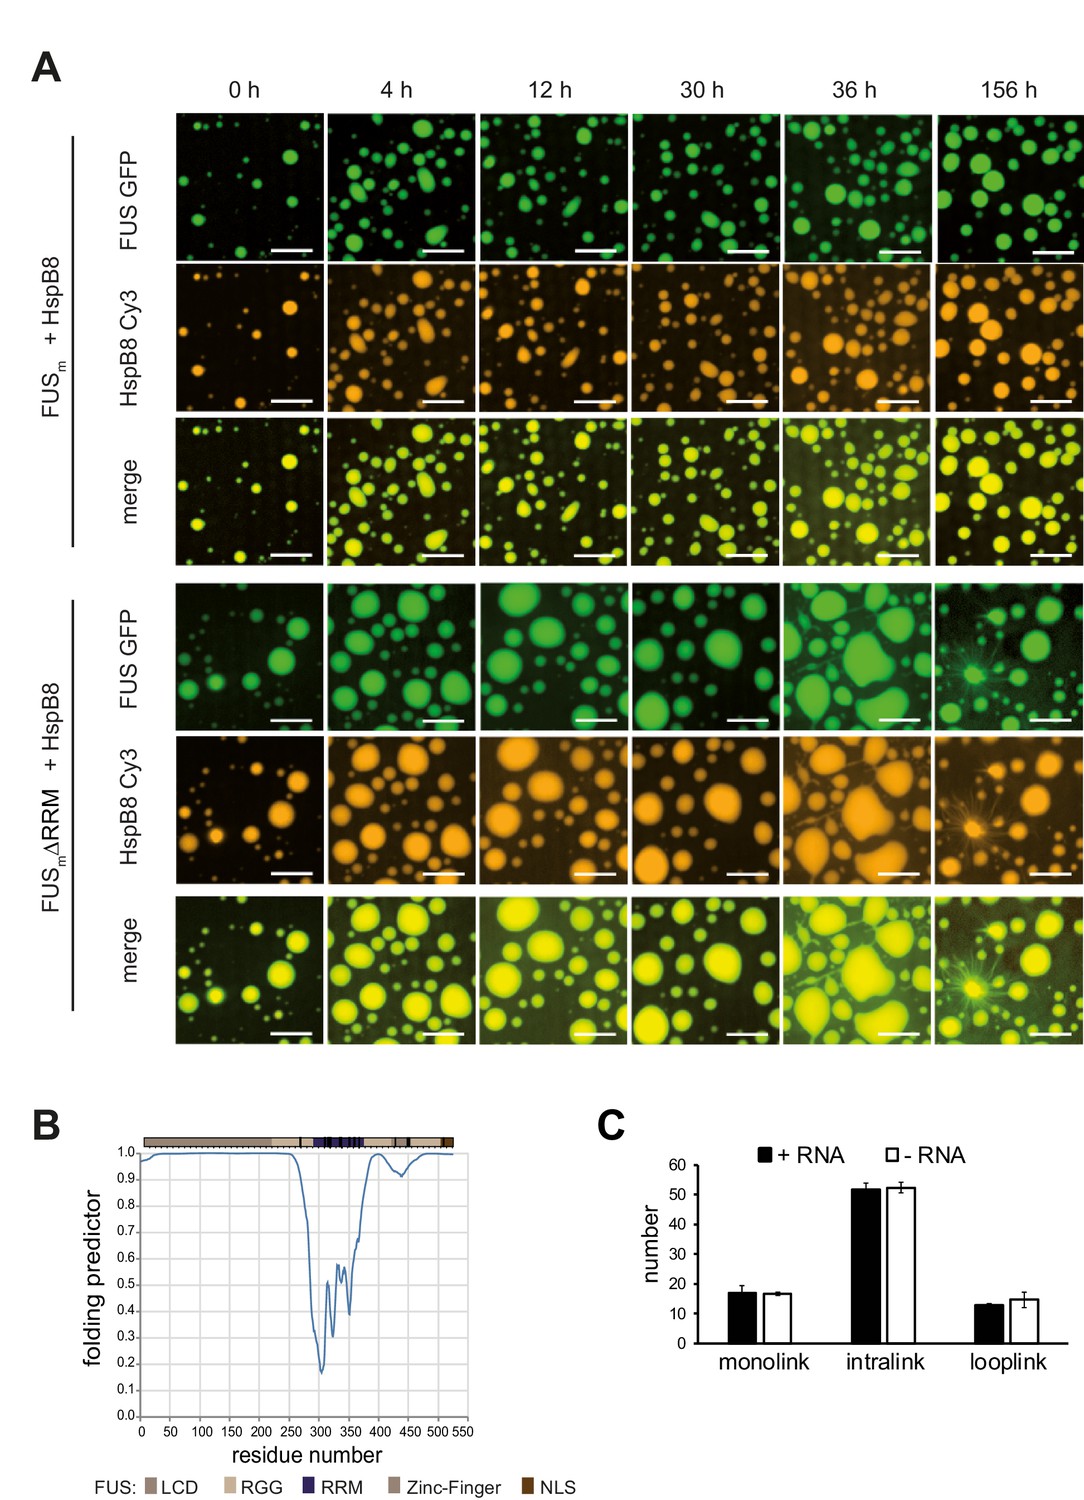
(A) Aging process of molecular condensates containing either FUSm or the FUSm∆RRM (∆AA285–371) variant in the presence or absence of HspB8 monitored by fluorescence microscopy over time. Scale bar is 10 µm. (B) Inter-link abundances from reconstituted FUSm:HspB condensates. Plotted are the relative enrichment (droplet vs. non-droplet) for each unique crosslinking site (y-axis) sorted according to the known domain structure within FUSm and HspB8 (x-axis). Shown are only high confidence crosslinking sites (see Materials and methods for details) from five biologically independent sets of experiments (n=5; circles in different shades of gray). Crosslinking sites that were consistently upregulated or downregulated twofold or more (log2ratio≥1 or ≤−1 and FDR≤0.05) in at least two out of five biological replicate sets of experiments and in addition contained no opposing regulation in any replicate set were considered significant and are highlighted with a green (enriched in droplets) or red background rectangle (decreased in droplets). All other changes in crosslinking abundances were considered insignificant and are shown on gray background. The significance threshold of twofold enrichment is indicated as dashed red line. (C) Fluorescence microscopy images of FUSm and FUSm∆RRM variant during and after incubation under heat shock conditions. Samples were heated to 55°C for 10 min followed by a 5 min cool-down step to 25°C. Scale bar is 10 µm. (D) FUSm:HspB8 condensates were crosslinked in the presence (black) or absence (white) of a customized RNA oligonucleotide previously shown to bind to FUS (Maharana et al., 2018) and analyzed by LC-MS/MS (n=3; FDR≤0.05). RRM, RNA recognition motif.
Figure 5—figure supplement 1
RRM unfolding drives FUS aging and is rescued by HspB8.
(A) Aging process of molecular condensates containing either FUSm or the FUSm∆RRM (∆AA285–371) variant in the presence of HspB8 monitored by fluorescence microscopy over time. Scale bar is 10 µm. Shown are images after excitation with a 488 nm laser (green) or a 561 nm laser (orange) and the merged images (yellow). (B) A disorder prediction plot (Xue et al., 2010) predicts the FUS-RRM to be folded. (C) FUSm:HspB8 condensates were crosslinked in the presence (black) or absence (white) of a customized RNA oligonucleotide previously shown to bind to FUS (Maharana et al., 2018) and analyzed by LC-MS/MS (n=3; FDR≤0.05). RRM, RNA recognition motif.
Figure 6
A disease-related mutation interferes with HspB8 activity.
(A) Location of the disease-related K141E mutation inside the αCD of HspB8. (B) Partitioning of 5 µM HspB8-K141E (1:20 mix of labeled:unlabeled) into condensates formed by 5 µM FUSm. Scale bar is 10 µm. (C) Aging assay of 5 µM FUSm condensates in the absence (ctrl) and presence of HspB8-WT, HspB8-K141E, or a 1:1 mix of WT and K141 mutant. Final chaperone concentrations in all reactions are 125 nM. Scale bar is 10 µm. (D) Kinetics of the aging process. Plotted are the initial slopes of the FRAP recovery curves for FUSm condensates in the absence (ctrl) and presence of HspB8-WT (red), HspB8-K141E (blue), or a 1:1 mix of WT and K141E mutant (cyan). (E) Equal amounts of FUSm:HspB8-K141E (left) or FUSm:HspB8-WT (right) were crosslinked under condensate inducing low salt conditions (75 mM NaCl). Experiments were carried out in triplicates and crosslinks were only considered, if they were identified in two out of three replicates with a deltaS<0.95, a minimum Id score≥20, and an ld score≥25 in at least one replicate (filtering was done on the level of the unique crosslinking site) and an FDR<0.05. The mutated site in HspB8-K141E is shown in red. Inter-links are shown in black and intra-links are shown in violet. Mono-links are shown with a flag, loop links with a pointed triangle, and homo-dimeric links with a loop. (F) Quantitative comparison of crosslinking patterns from HspB8-K141E and HspB8-WT condensates. Crosslinking sites that were upregulated or downregulated twofold or more (log2ratio≥1 or ≤−1 and FDR≤0.05) were considered significant and are highlighted in green (i.e., relative enrichment in FUSm:HspB8-K141E condensates) or red (i.e., relative decrease in FUSm:HspB8-K141E condensates). All other changes in crosslinking abundances were considered insignificant and are shown in gray background. αCD, α-crystallin domain; FRAP, fluorescence recovery after photobleaching.
Figure 7

Unfolding of globular domains nucleates aberrant seeds for aggregation.
Proposed mechanism where unfolding of globular domains in otherwise disordered proteins nucleates aberrant seeds for aggregation. In this model, the unfolding of the RRM domain comprises the initial step to seed the conversion of FUS into an aberrant conformational space that consequently involves the beta-amyloid formation of the LCDs by rising their local concentration and potentially by sterically aligning them for nucleation. Molecular chaperones like HspB8 stabilize the fold of the RRM domain and maintain the dynamic liquid state of the condensate. LCD, low complexity domain; RRM, RNA recognition motif.
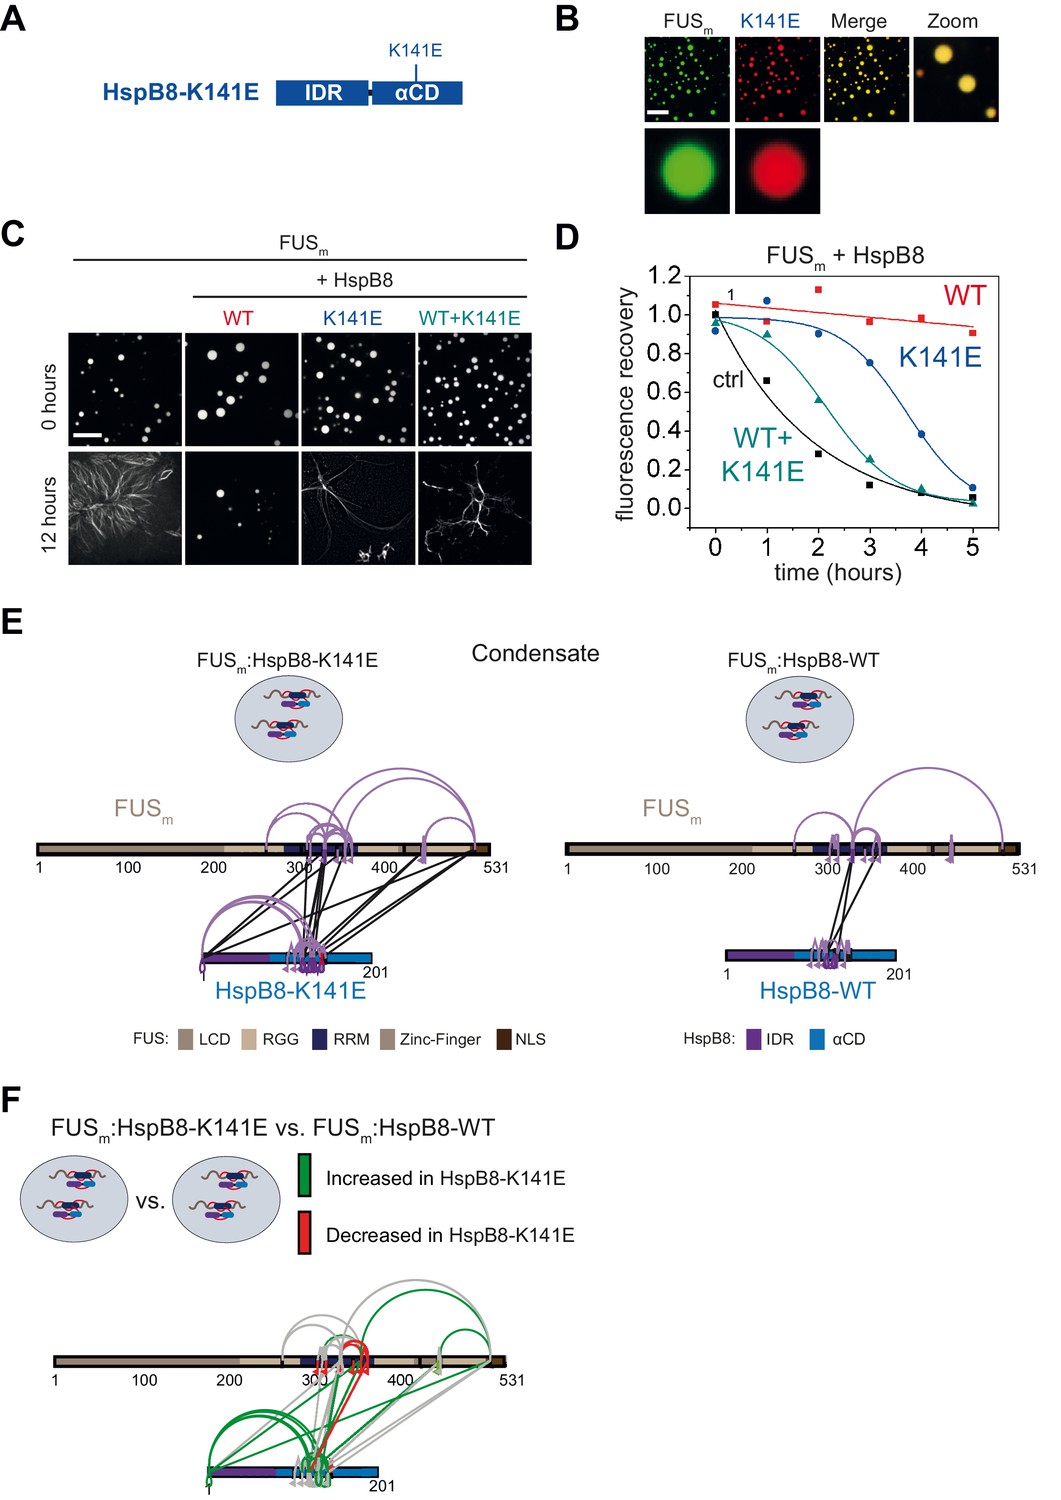
Author response image 1
Mapping identified cross-links identified using the crosslinker DSS H12/D12 onto the NMR structure of the RRM of FUS (PDB 2LCW).
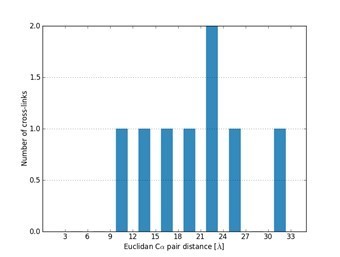
Author response image 2
Monitoring crosslinking in a concentration-dependent shows no apparent differences in crosslink behavior and crosslinking yield in the range used in this study, i.
e. 1 to 2 mM DSS (see updated experimental procedures).
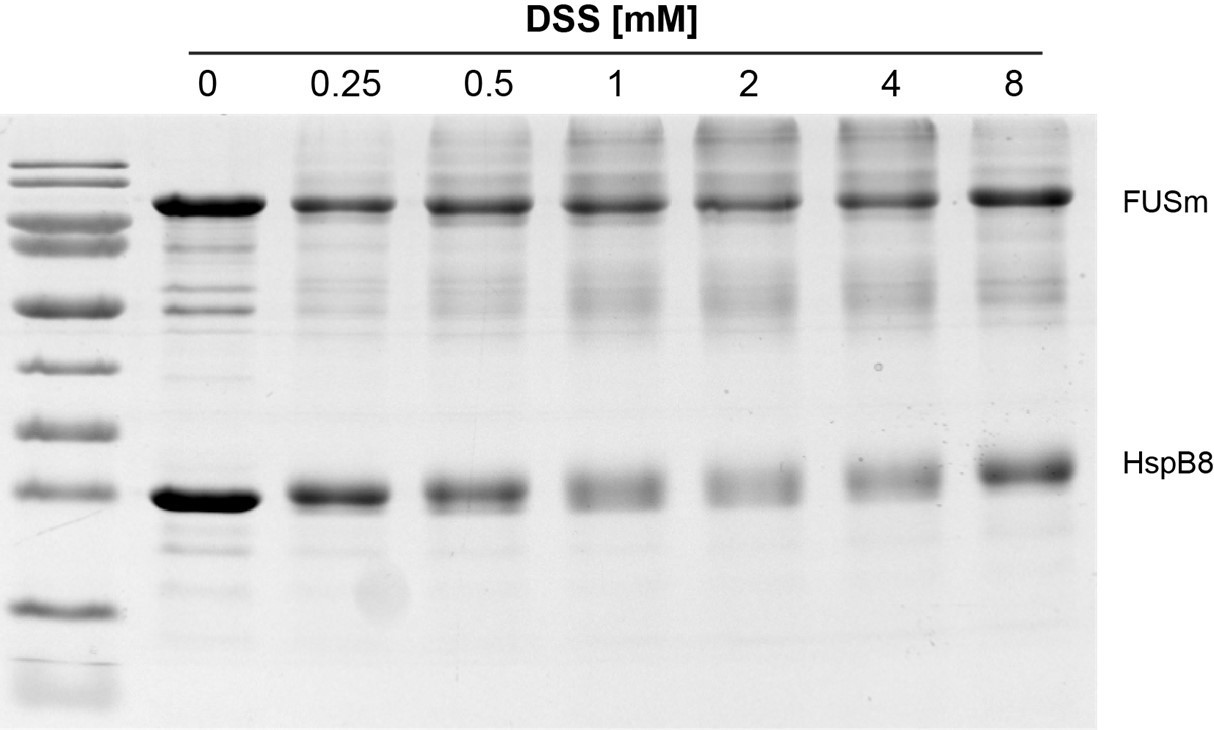
Author response image 3
Comparison of crosslinks within FUS when exclusively lysine-lysine crosslinks (upper panel) or additionally side reactions to serine, tyrosine and threonine are taken into account (lower panel) (n=3).
Author response image 4

Overall crosslinking pattern from a mixture of recombinant FUSm and HspB8 under condensate inducing low salt (75 mM KCl) conditions that were UV crosslinked using Sulfo-SDA and searched using StavroX/MeroX (including side reactions to serine, tyrosine and threonine) after digestion with chymotrypsin.
Author response image 5

Overall crosslinking pattern from mixtures of recombinant FUSm and HspB8 under condensate inducing low salt (75 mM NaCl) conditions that were digested using either chymotrypsin (interlinks are shown in black and Intralinks, monolinks and loop links in violet (n=3)) or AspN as endoproteinases (all links are shown in orange (n=1)).
Author response image 6

Comparison of condensation behavior of FUSm and FUSm-ΔRRM.
Author response image 7
Comparison of detected crosslinks from FUS/HspB8 condensates at an FDR < 0.
05 using either a high/low acquisition strategy and xQuest as a search engine or a high/high strategy and plink2 (A) or MeroX (B) as search engine. Please note that due to technical reasons the comparison with MeroX included only inter- and intraprotein crosslinks, while the comparison with pLink2 additionally comprised mono links and loop links.
Author response image 8
Shown are select transitions for crosslinked peptide pairs of FUS.
In total, our assay contained 100 transitions and while a few isolated transitions did not result in conclusive traces, we could validate all tested uxIDs from our dataset by PRM.
Videos
Video 1
Time lapse of FUS fiber growth.
Time-lapse movie of FUSm fiber growth in the presence and absence of HspB8. The y-direction images are scaled by a factor of 3 to match the scale bar for the other maximum projection. The histograms/contrast are automatically set using the enhance contrast command in FIJI with 0.3% saturated pixels.
Tables
Key resources table
| Reagent type (species) or resource | Designation | Source or reference | Identifiers | Additional information |
|---|---|---|---|---|
| Cell line (Homo-sapiens) | Hela Kyoto FUS-GFP BAC line | PMID:26496610 PMID:28377462 | 5063 | |
| Cell line (Homo-sapiens) | Hela Kyoto WT | PMID:26496610 | 5067 | |
| Cell line (Escherichia coli) | BL21-AI One Shot | Thermo Fisher Scientific | Cat# C607003 | Chemically competent E. coli |
| Chemical compound, drug | DSS-H12/D12 (BisSulfoSuccinimidylSuberate) | Creative Molecules Inc | Cat# 001S | |
| Chemical compound, drug | N,N-Dimethylformamide (DMF) | Sigma-Aldrich | Cat# D4551 | |
| Chemical compound, drug | Ammonium bicarbonate | Sigma-Aldrich | Cat# 09830 | |
| Chemical compound, drug | Urea | Sigma-Aldrich | Cat# U5378 | |
| Chemical compound, drug | DTT (1,4-Dithiothreito) | Carl Roth | Cat# 6908.4 | |
| Chemical compound, drug | Trypsin | Promega | Cat# V5113 | |
| Chemical compound, drug | TCEP (Tris(2-carboxyethyl)phosphine hydrochloride) | Sigma-Aldrich | Cat# C4706-2G (CAS 51805-45-9) | |
| Chemical compound, drug | Iodoacetamide | Sigma-Aldrich | Cat# I1149-5G (CAS 144-48-9) | |
| Chemical compound, drug | Sep-Pak (C18) | Waters | Cat# WAT054960 | |
| Recombinant DNA reagent | FUS-GFP (plasmid) | PMID:26317470 | FUS-GFP expression in Sf9 cells | |
| Recombinant DNA reagent | FUS-G156E-GFP (FUSm) (plasmid) | PMID:26317470 | FUS-G156E-GFP expression in Sf9 cells | |
| Recombinant DNA reagent | FUS-G156E-K9-GFP (FUSm_K9) (plasmid) | This paper | FUS-K9-GFP expression in Sf9 cells | |
| Recombinant DNA reagent | FUS-G156E-ΔRRM-GFP (FUSmΔRRM) (plasmid) | This paper | FUS-G156E-ΔRRM-GFP expression in Sf9 cells | |
| Recombinant DNA reagent | FUS-17Y-GFP (plasmid) | This paper | FUS-GFP-17Y expression in Sf9 cells | |
| Recombinant DNA reagent | FUS-LCD-GFP (plasmid) | PMID:29961577 | FUS-LCD-GFP expression in Sf9 cells | |
| Recombinant DNA reagent | HspB8-WT (plasmid) | PMID:15879436 | HspB8-WT expression in E. coli | |
| Recombinant DNA reagent | HspB8-K141E (plasmid) | This paper | HspB8-K141E expression in E. coli | |
| Recombinant DNA reagent | HspB8-SNAP (FL) (plasmid) | This paper | HspB8-SNAP expression in E. coli | |
| Recombinant DNA reagent | HspB8-IDR-SNAP (IDR) (plasmid) | This paper | HspB8-IDR-SNAP expression in E. coli | |
| Recombinant DNA reagent | HspB8-αCD-SNAP (αCD) (plasmid) | This paper | HspB8-αCD-SNAP expression in E. coli | |
| Recombinant DNA reagent | SNAP (plasmid) | This paper | SNAP expression in E. coli | |
| Recombinant DNA reagent | HspB8-IDR-HspB1-αCD (IDR8αCD1) (plasmid) | This paper | HspB8-IDR-HspB1-αCD expression in E. coli | |
| Recombinant DNA reagent | HspB1-IDR-HspB8-αCD (IDR8αCD1) (plasmid) | This paper | HspB1-IDR-HspB8-αCD expression in E. coli | |
| Recombinant DNA reagent | HspB8-0R (plasmid) | This paper | HspB8-0R expression in E. coli | |
| Recombinant DNA reagent | HspB8-WT-3xmyc (plasmid) | This paper | HspB8-WT-3xmyc expression in human cells | |
| Recombinant DNA reagent | HspB8-0R-3xmyc (plasmid) | This paper | HspB8-0R-3xmyc expression in human cells | |
| Antibody | Anti-c-myc (monoclonal) | Santa Cruz Biotechnology | Clone 9E10 | IF(1:100) |
| Antibody | Anti-eIF4G (monoclonal) | Santa Cruz Biotechnology | Clone H-300 | IF(1:100) |
| Antibody | Anti-mouse Alexa Fluor 594 (monoclonal) | Thermo Fisher Scientific | A-21203 | IF(1:1000) |
| Antibody | Anti-rabbit Alexa Fluor 594 (monoclonal) | Thermo Fisher Scientific | A-21206 | IF(1:1000) |
| Software, algorithm | xQuest 2.1.3 | PMID:24356771 | http://proteomics.ethz.ch/cgi-bin/xquest2_cgi/download.cgi | |
| Software, algorithm | xProphet 2.1.3 | PMID:24356771 | http://proteomics.ethz.ch/cgi-bin/xquest2_cgi/download.cgi | |
| Software, algorithm | xTract 1.0.2 | PMID:26501516 | http://proteomics.ethz.ch/cgi-bin/xtract_cgi/index.cgi | |
| Software, algorithm | xiNET | PMID:25648531 | http://crosslinkviewer.org/ | |
| Software, algorithm | python 3.7.2 and 3.7.6 | https://python.org | ||
| Software, algorithm | pandas 1.0.3 | https://pandas.pydata.org | ||
| Software, algorithm | altair 4.1.0 | Altair Developers, 2020 | https://altair-viz.github.io | |
| Software, algorithm | seaborn 0.9.0 | https://seaborn.pydata.org | ||
| Software, algorithm | Fiji | PMID:22743772 | https://imagej.net/software/fiji/ | |
| Other | SuperdexPeptide 3.2/30 | GE Healthcare | Cat# 29-0362-31 | |
| Other | Acclaim PepMap RSLC | Thermo Fisher Scientific | Cat# P/N 164943 | |
| Other | EASY-nLC 1200 system | Thermo Fisher Scientific | LC140 | |
| Other | Orbitrap FusionTribridMass Spectrometer | Thermo Fisher Scientific | ||
| Other | Deposited Data: MS raw files | PRIDE https://www.ebi.ac.uk/pride/ | PXD021114 PXD021115 |
Additional files
-
Supplementary file 1
Crosslink identification and quantification, related to Figure 1A and B and Figure 1—figure supplement 1A.
- https://cdn.elifesciences.org/articles/69377/elife-69377-supp1-v2.xlsx
-
Supplementary file 2
Crosslink identification and quantification for FUS aging experiment, related to Figure 1C and Figure 1—figure supplement 1C, D, E and F and Figure 3—figure supplement 1H and I.
- https://cdn.elifesciences.org/articles/69377/elife-69377-supp2-v2.xlsx
-
Supplementary file 3
Crosslink identification, related to Figures 2E and 5B and Figure 2—figure supplement 1E, F, G and I and Figure 3—figure supplement 1G.
- https://cdn.elifesciences.org/articles/69377/elife-69377-supp3-v2.xlsx
-
Supplementary file 4
Crosslink quantification, related to Figure 5B and Figure 3—figure supplement 1G.
- https://cdn.elifesciences.org/articles/69377/elife-69377-supp4-v2.xlsx
-
Supplementary file 5
Crosslink quantification, related to Figure 5D and Figure 5—figure supplement 1C.
- https://cdn.elifesciences.org/articles/69377/elife-69377-supp5-v2.xlsx
-
Supplementary file 6
Crosslink identification and quantification, related to Figure 6E and F.
- https://cdn.elifesciences.org/articles/69377/elife-69377-supp6-v2.xlsx
-
Transparent reporting form
- https://cdn.elifesciences.org/articles/69377/elife-69377-transrepform-v2.pdf
Download links
A two-part list of links to download the article, or parts of the article, in various formats.
Downloads (link to download the article as PDF)
Open citations (links to open the citations from this article in various online reference manager services)
Cite this article (links to download the citations from this article in formats compatible with various reference manager tools)
HspB8 prevents aberrant phase transitions of FUS by chaperoning its folded RNA-binding domain
eLife 10:e69377.
https://doi.org/10.7554/eLife.69377


