Neural tube-associated boundary caps are a major source of mural cells in the skin
- Institut de Biologie de l'Ecole normale supérieure (IBENS), Ecole normale supérieure, CNRS, Inserm, Université PSL, France
- Sorbonne Université, Collège Doctoral, France
- nstitut Mondor de Recherche Biomédicale, Inserm U955-Team 9, France
- Genomic facility, Ecole normale supérieure, PSL Research University, CNRS, Inserm, Institut de Biologie de l'Ecole normale supérieure (IBENS), France
- Inserm US23, AMMICA, Institut Gustave Roussy, France
- Laboratoire de Plasticité Structurale, Sorbonne Université, ICM Institut du Cerveau et de la Moelle Epinière, Inserm U1127, CNRS UMR7225, France
- Department of Pediatrics Section of Developmental Biology, University of Colorado Anschutz Medical Campus, United States
- Department of Physiology and Pharmacology, Karolinska Institutet, Sweden
- Department of Neuroimmunology, Center for Brain Research, Medical University Vienna, Austria
- Inserm U1050, Centre Interdisciplinaire de Recherche en Biologie (CIRB), Collège de France, France
Figures
Figure 1 with 1 supplement
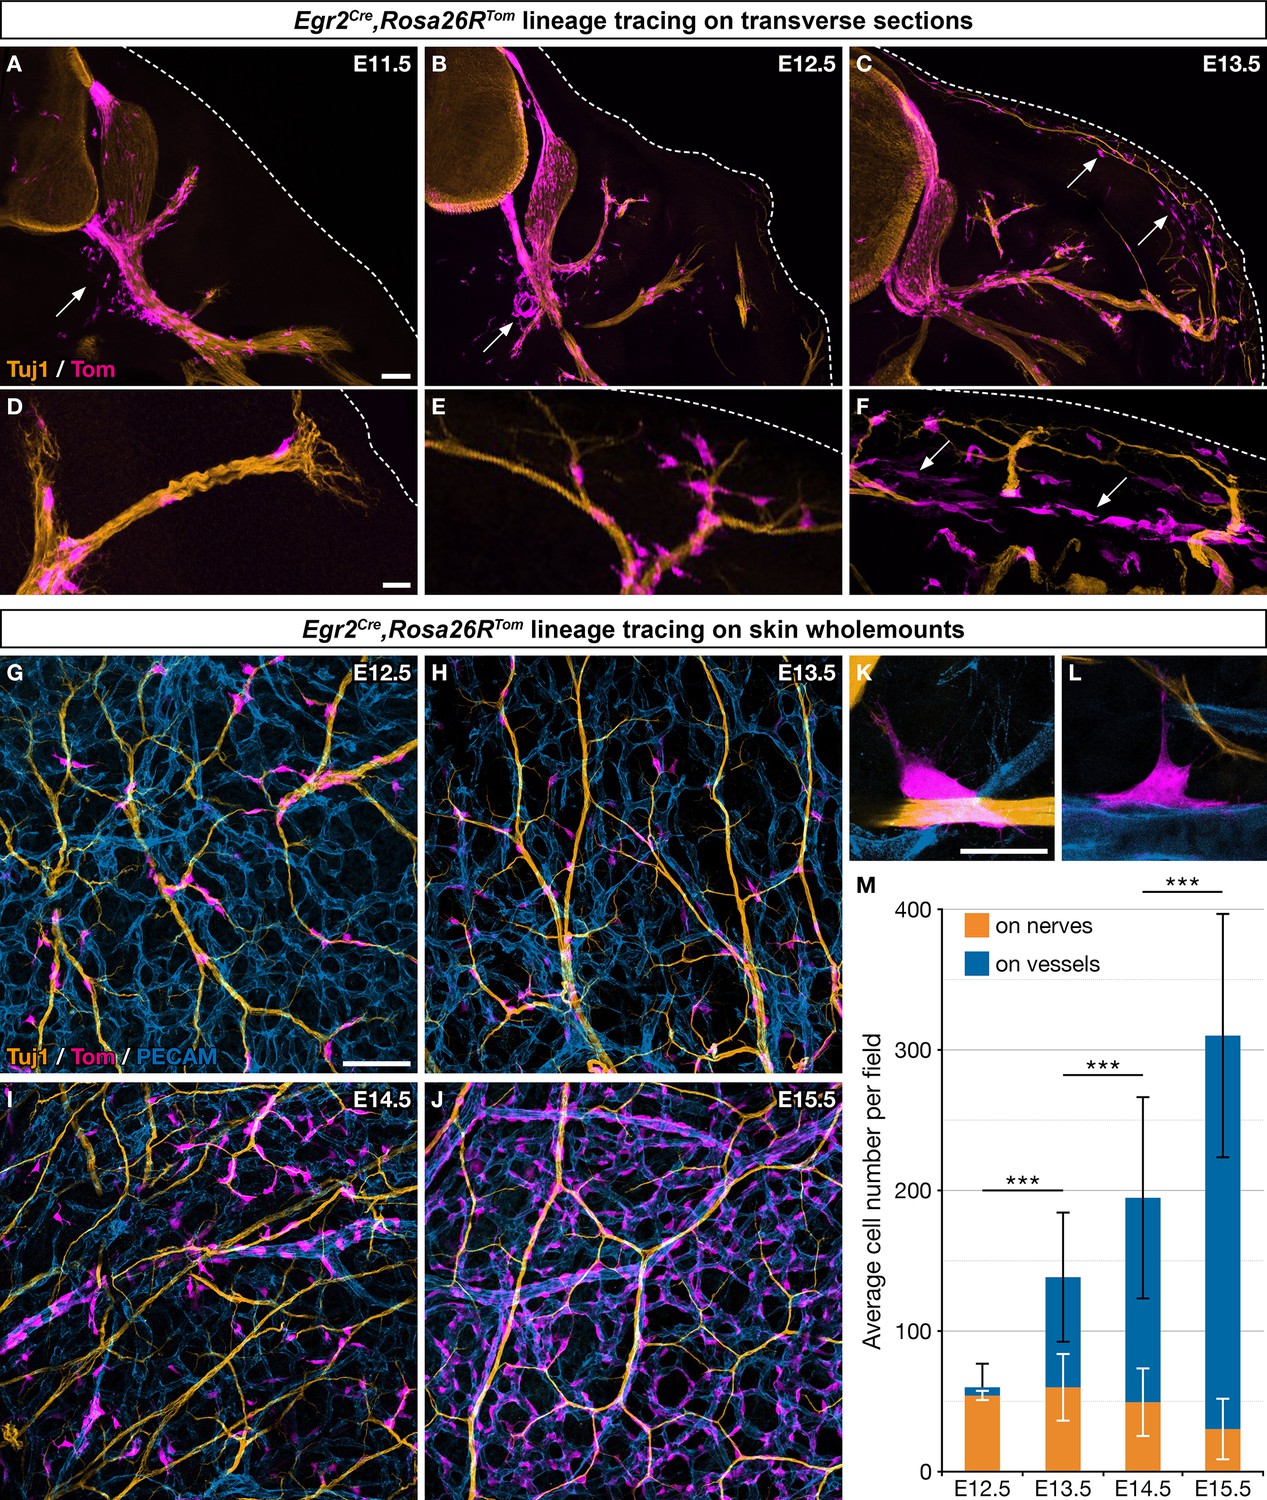
Boundary cap (BC) cell derivatives migrate along the nerves and incorporate into the vascular plexus.
(A–F) Trunk transverse sections from Egr2Cre/+,Rosa26RTom embryos at the indicated stages, and labeled with antibodies against Tomato (magenta) and Tuj1 (orange). Cells detached from the nerves (arrows) appear first in the vicinity of the ventral roots (A,B) and later close to the skin, as indicated by the dotted line (C,F). (G–J) Whole-mount dorsal skin from Egr2Cre/+,Rosa26RTom embryos at the indicated stages, labeled with antibodies against Tomato (magenta), Tuj1 (orange), and PECAM (blue). (K,L) Higher magnifications showing cells in contact with both nerve and vessel at embryonic day (E) 13.5. (M) Quantification of the number of labeled cells associated with nerve or vessel per field at the indicated stages (n=3 embryos per stage). Statistical analyses of the “on nerve”/“on vessels” ratio between time points were carried out using a Mann-Whitney U test. Scale bars, 100 μm (A–C,G–J) and 20 μm (D–F,K–L). Error bars, one standard deviation (M). ***=p < 0.001.
Figure 1—figure supplement 1
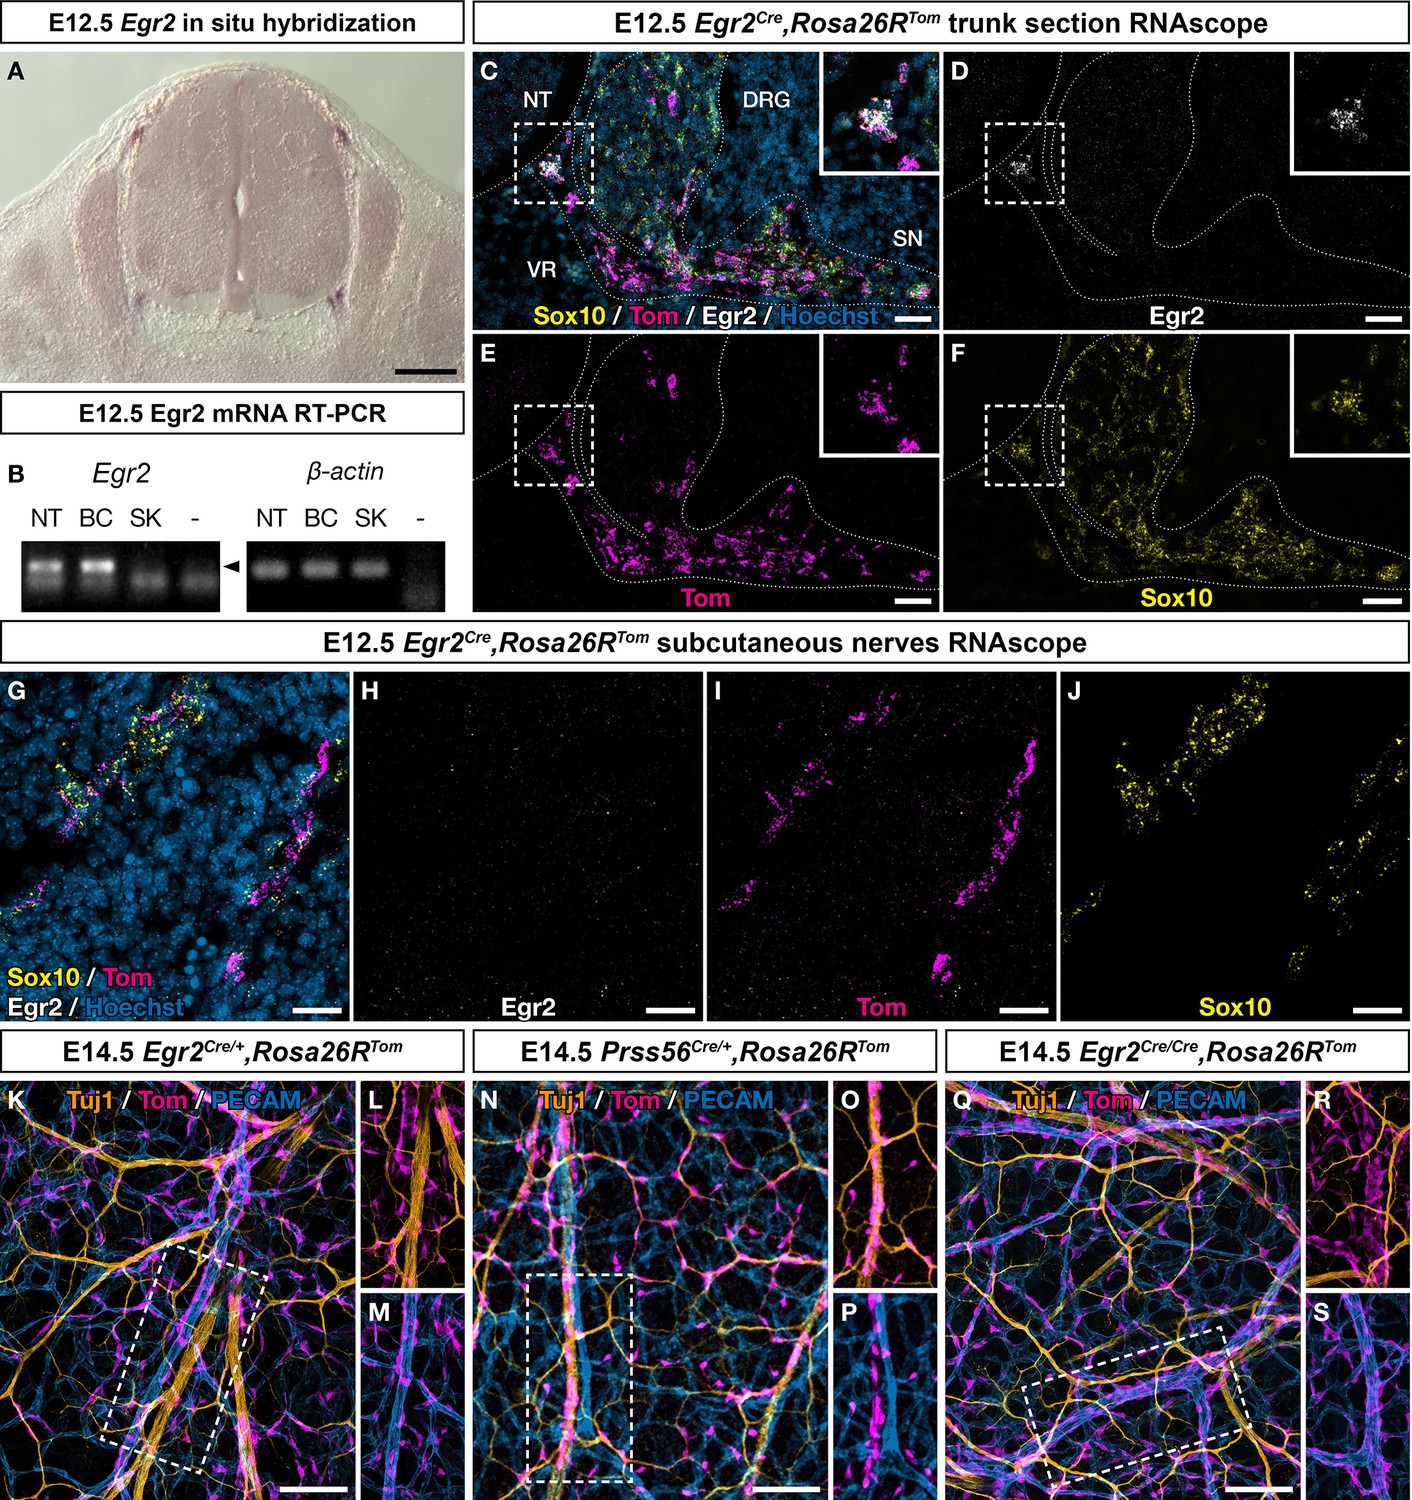
Traced cells, apart from boundary cap (BC) cells themselves, do not express Egr2 at embryonic day (E) 12.5 and behave differently from Prss56-positive BC cell derivatives.
(A) Egr2 in situ hybridization on an E12.5 embryo section. BC cells at dorsal entry and ventral exit points express Egr2. In contrast, Egr2 mRNA is not detected along the nerves or in the skin. (B) RT-PCR for Egr2 mRNA performed on RNA extracted from dissociated E12.5 dorsal skin (SK), as compared to neural tube (NT) and BCs, used as positive controls. The arrowhead indicates the position of the predicted band corresponding to Egr2 amplification. Trunk transverse (C–F) and embryonic skin (G–J) sections from Egr2Cre/+,Rosa26RTom embryos at E12.5 were analyzed by RNAscope in situ hybridization for Tomato (magenta), Sox10 (yellow), and Egr2 (white), confirmed that Egr2 mRNA was restricted to BC. (D) Whole-mount E14.5 embryonic dorsal skin from Egr2Cre/+,Rosa26RTom (K–M), Prss56Cre/+,Rosa26RTom (N–P), and Egr2Cre/Cre,Rosa26RTom (Q–S) embryos, immunostained for Tuj1 (yellow), Tomato (purple), and PECAM (blue). In contrast to Egr2-traced derivatives that mostly reside on the vascular plexus (K–M), all Prss56-traced cells are attached to Tuj1-positive nerves and not to PECAM-positive blood vessels (N–P). Egr2 inactivation does not affect the association of Egr2-traced derivatives to the vascular plexus (Q–S). Scale bars, 200 μm (A) and 50 μm (C–S).
Figure 2 with 2 supplements
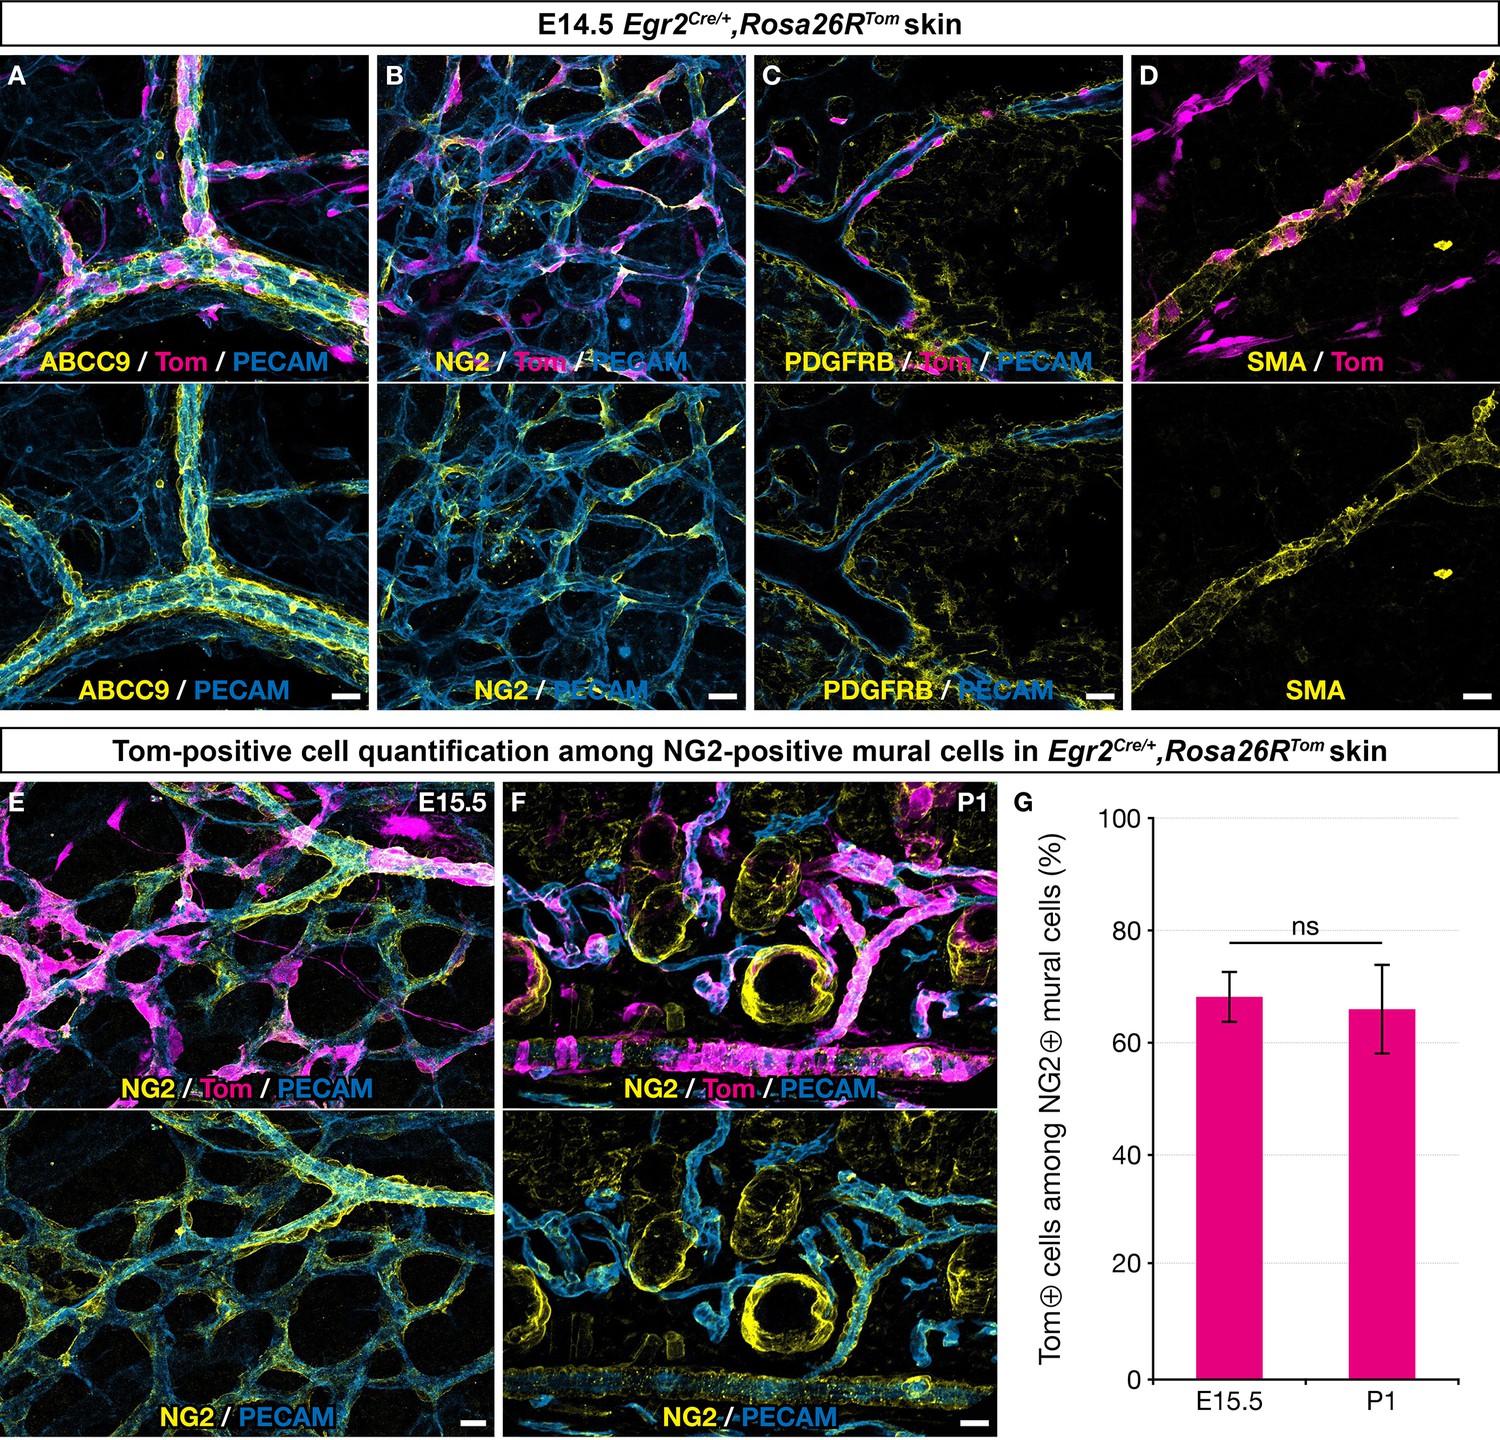
Boundary cap (BC) cell derivatives give rise to the majority of skin mural cells (MCs).
Whole-mount embryonic dorsal skin at the indicated stages (A–E) or transverse section of newborn skin (F), labeled with antibodies against Tomato (magenta), PECAM (blue), and ABCC9, NG2, PDGFRβ, or smooth muscle actin (SMA) (yellow). (A–D) In the vascular plexus, Tomato-positive cells express MC markers: ABCC9 (A), NG2 (B), PDGFRβ (C), and SMA (D). (E–G) Tomato-positive cells account for approximately two thirds of NG2-positive MCs in the skin at embryonic day (E) 15.5 (E,G ; n=3)and postnatal day (P) 1 (F,G; n=3). Tomato labeling is omitted in the lower images (A–F). Statistical analysis of the “NG2 and Tomato-positive”/“NG2-positive” ratio between time points was carried out using a Mann-Whitney U test. Scale bars, 20 μm. ns, non-significant (G).
Figure 2—figure supplement 1
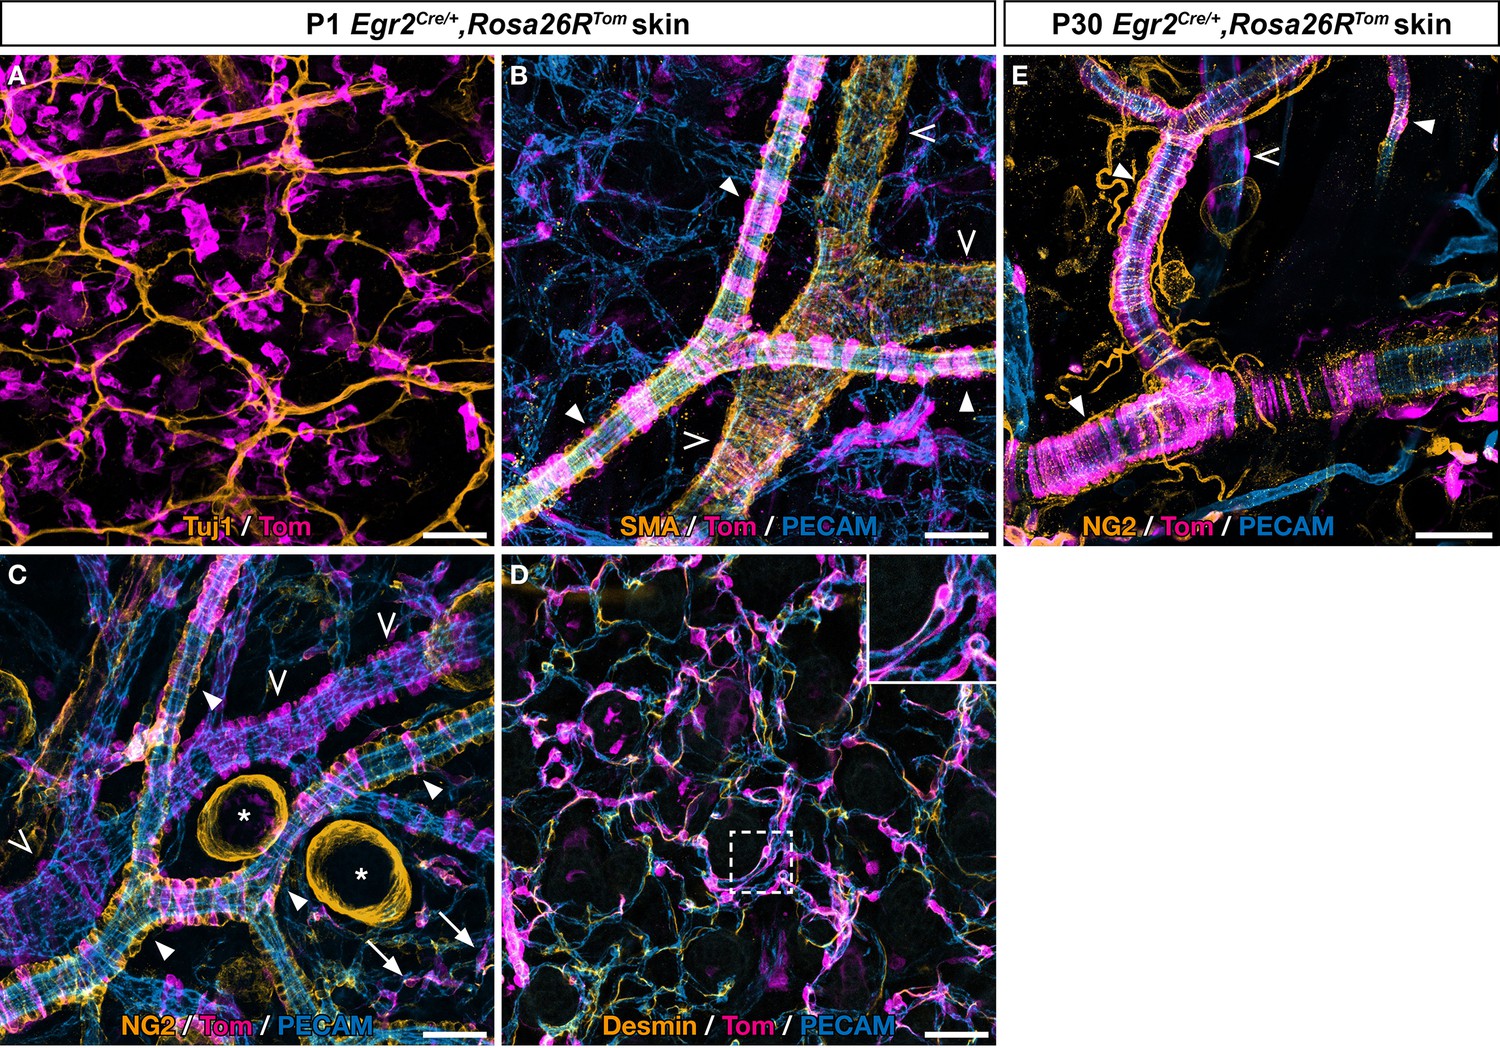
Boundary cap (BC) cells give rise to skin mural cells (MCs), including pericytes, arterial and venous vascular smooth muscle cells (VSMCs).
Egr2Cre/+,Rosa26RTom newborn (A–D) and postnatal day (P) 30 (E) dorsal skin was analyzed by whole-mount immunostaining with various antibodies (see color code on each picture). (A) In newborn animals (P1), most Tom-positive cells are not associated with Tuj1-positive nerves. (B–C) On P1 venules (empty arrowheads) and arterioles (arrowheads), which differ by diameter and shape, traced cells express smooth muscle actin (SMA), whereas they only express NG2 when associated with arterioles. Labeled cells also include capillary NG2-positive pericytes (arrows in C). (D) P1 traced capillary pericytes also express Desmin. (E) Numerous Tom-positive MCs expressing NG2 are visible in the adult skin on arterioles (arrowheads) and venules (empty arrowhead). Please note the presence of NG2-positive hair follicles (asterisks in C). Scale bars, 50 μm.
Figure 2—figure supplement 2
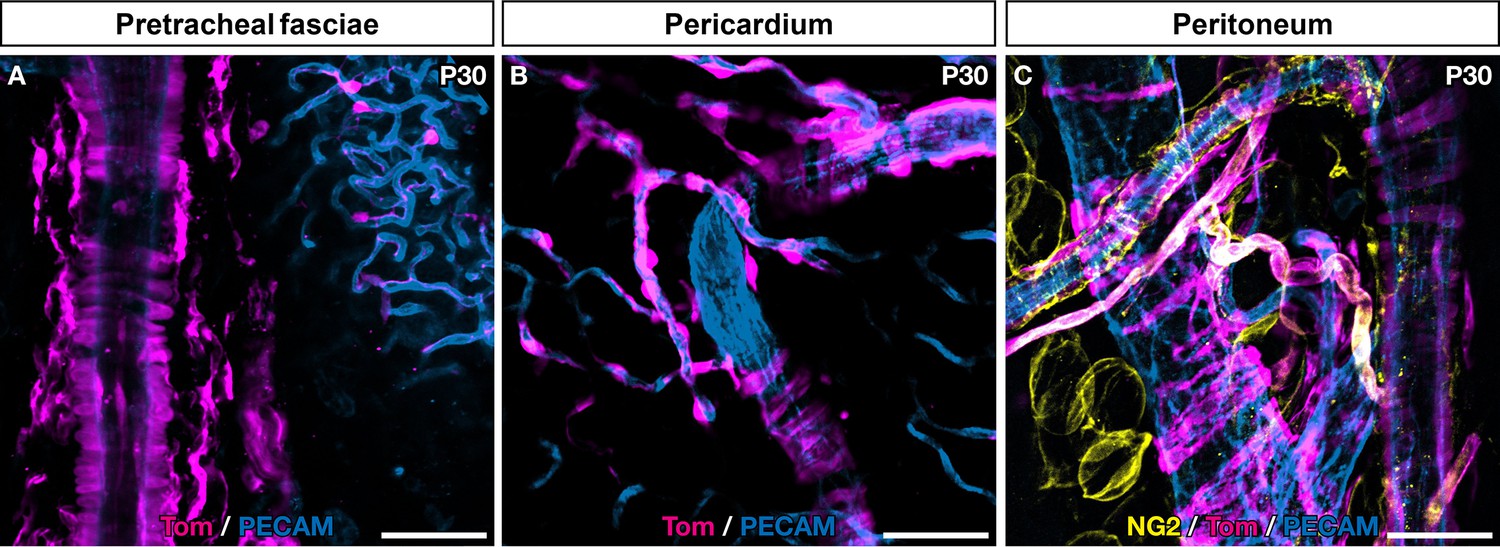
Numerous traced mural cells (MCs) are present in serous membranes from various organs.
Serous membranes from Egr2Cre/+,Rosa26RTom adult mice (A–C) were analyzed by whole-mount immunostaining with antibodies directed against Tomato (magenta), PECAM (blue), and NG2 (yellow). Numerous tomato-positive, BC-derived MCs were visible on arteries, veins, and capillaries, interspaced with non-traced cells. Scale bars, 50 μm.
Figure 3
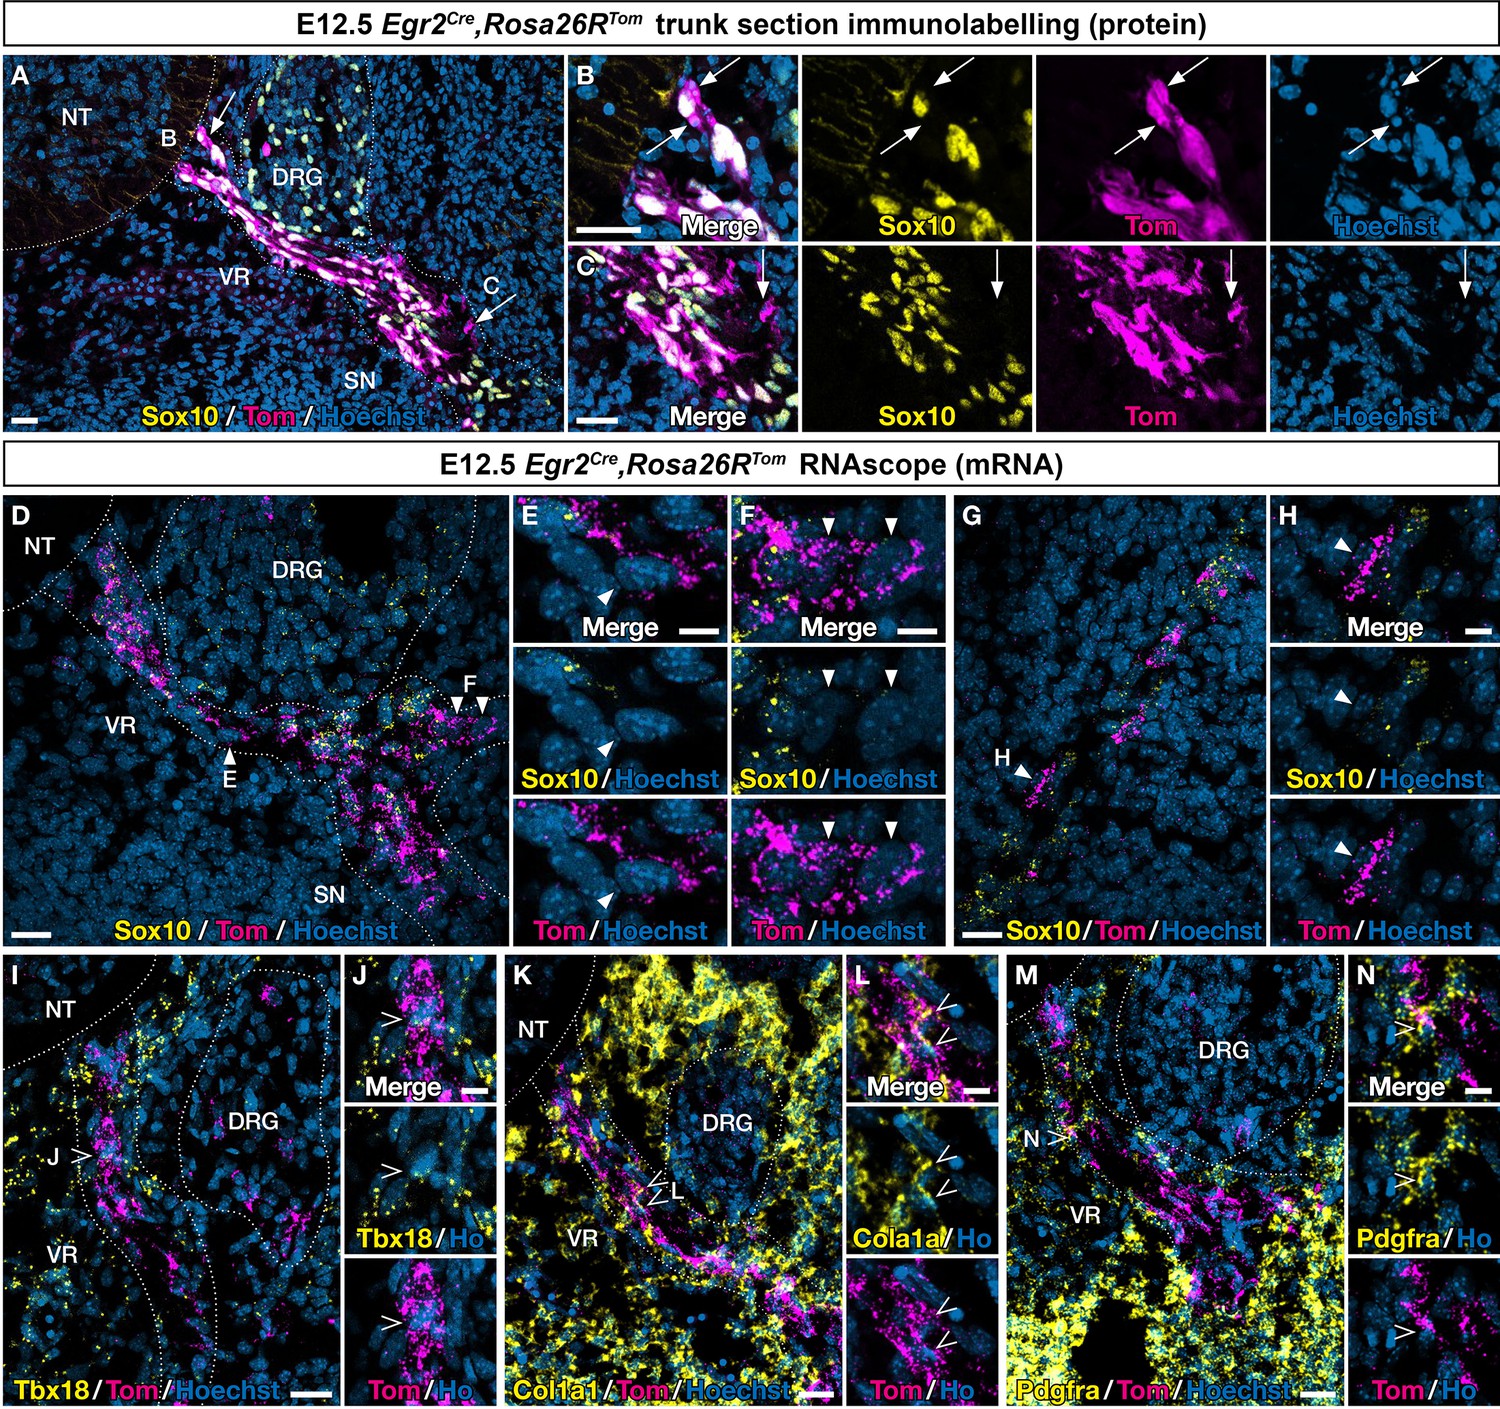
An Egr2-expressing boundary cap (BC) cell subpopulation displays mesenchymal identity before migrating to the periphery.
Trunk transverse sections (A–F, I–N) and skin sections (G,H) from Egr2Cre/+,Rosa26RTom embryos at embryonic day (E) 12.5. Sections were labeled with antibodies (A–C) against Tomato (magenta) and Sox10 (yellow), or analyzed by RNAscope in situ hybridization (D–H) for Tomato (magenta) and Sox10 (yellow). Detailed analysis revealed that some Tomato-positive cells on ventral roots did not express Sox10 at the protein (arrows) and RNA level (arrowheads). RNAscope in situ hybridization of Tbx18 (I,J), Col1a1 (K,L), and Pdgfra (M,N) expression in ventral roots from E12.5 embryos. Note that some tomato-positive cells on ventral roots express these markers (empty arrowheads). Scale bars, 25 μm (A,D,G,I,K,M) or 10 μm (B,C,E,F,H,J,L,N).
Figure 4 with 2 supplements
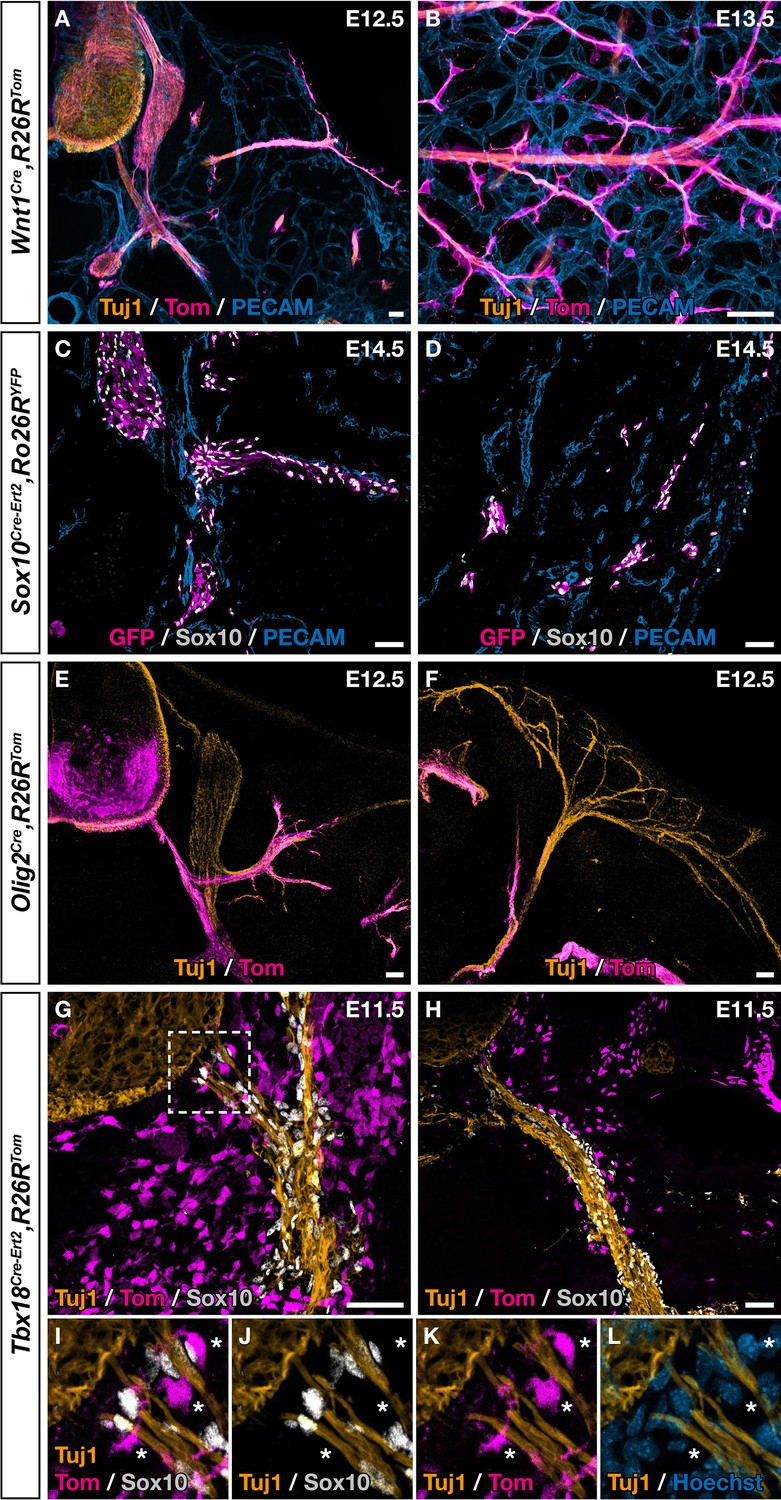
Ventral boundary caps (BCs) have a dual embryonic origin.
Trunk transverse sections (A,C,E–L), dorsal skin whole-mount (B), and skin section (D) at the indicated embryonic stages. Genetic fate mapping of neural crest (NC) using Wnt1Cre/+,Rosa26RTom (A,B) and Sox10Cre-Ert2/+,Rosa26RTom (C,D) embryos and of neuroepithelial cells and their derivatives using Olig2Cre/+,Rosa26RTom embryos (E,F) did not reveal any tomato-positive cells attached to the vascular plexus, neither close to ventral roots nor to nerves in the skin. (G,L) Genetic fate mapping of developing pia matter using Tbx18Cre-Ert2/+,Rosa26RTom embryos revealed the presence of numerous tomato-positive, Sox10-negative cells in close contact with the nerve (asterisks, I–L). Tamoxifen was delivered to pregnant females at embryonic day (E) 9.5 (C,D,G–L). Scale bars, 50 μm.
Figure 4—figure supplement 1
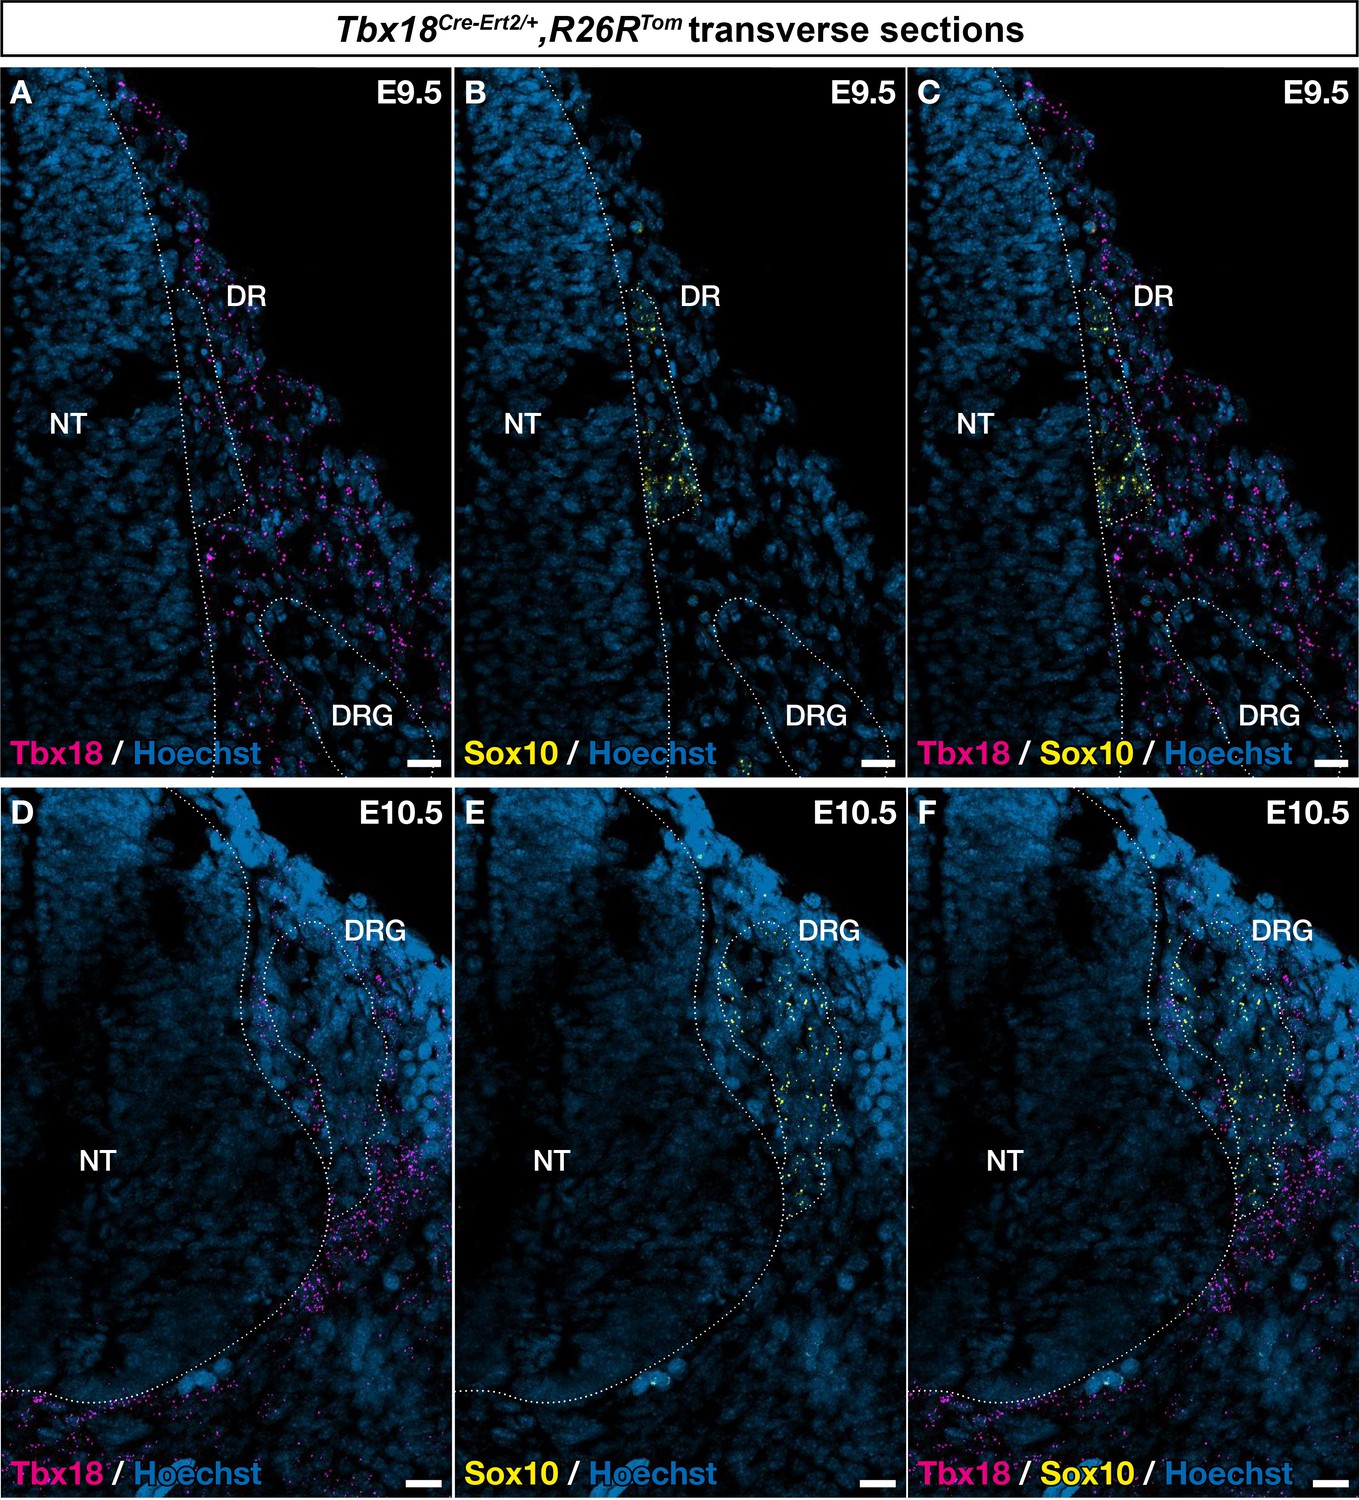
Tbx18 is expressed in cells around the developing neural tube.
Trunk transverse sections of embryos at embryonic day (E) 9.5 (A–C) and E10.5 (D–F) were analyzed by RNAscope in situ hybridization for Tbx18 (magenta) and Sox10 (yellow). Tbx18-expressing cells were observed around the neural tube (NT), dorsal roots (DR), and dorsal root ganglia (DRG), in the area that corresponds to the developing pia matter. Scale bars, 20 μm.
Figure 4—figure supplement 2
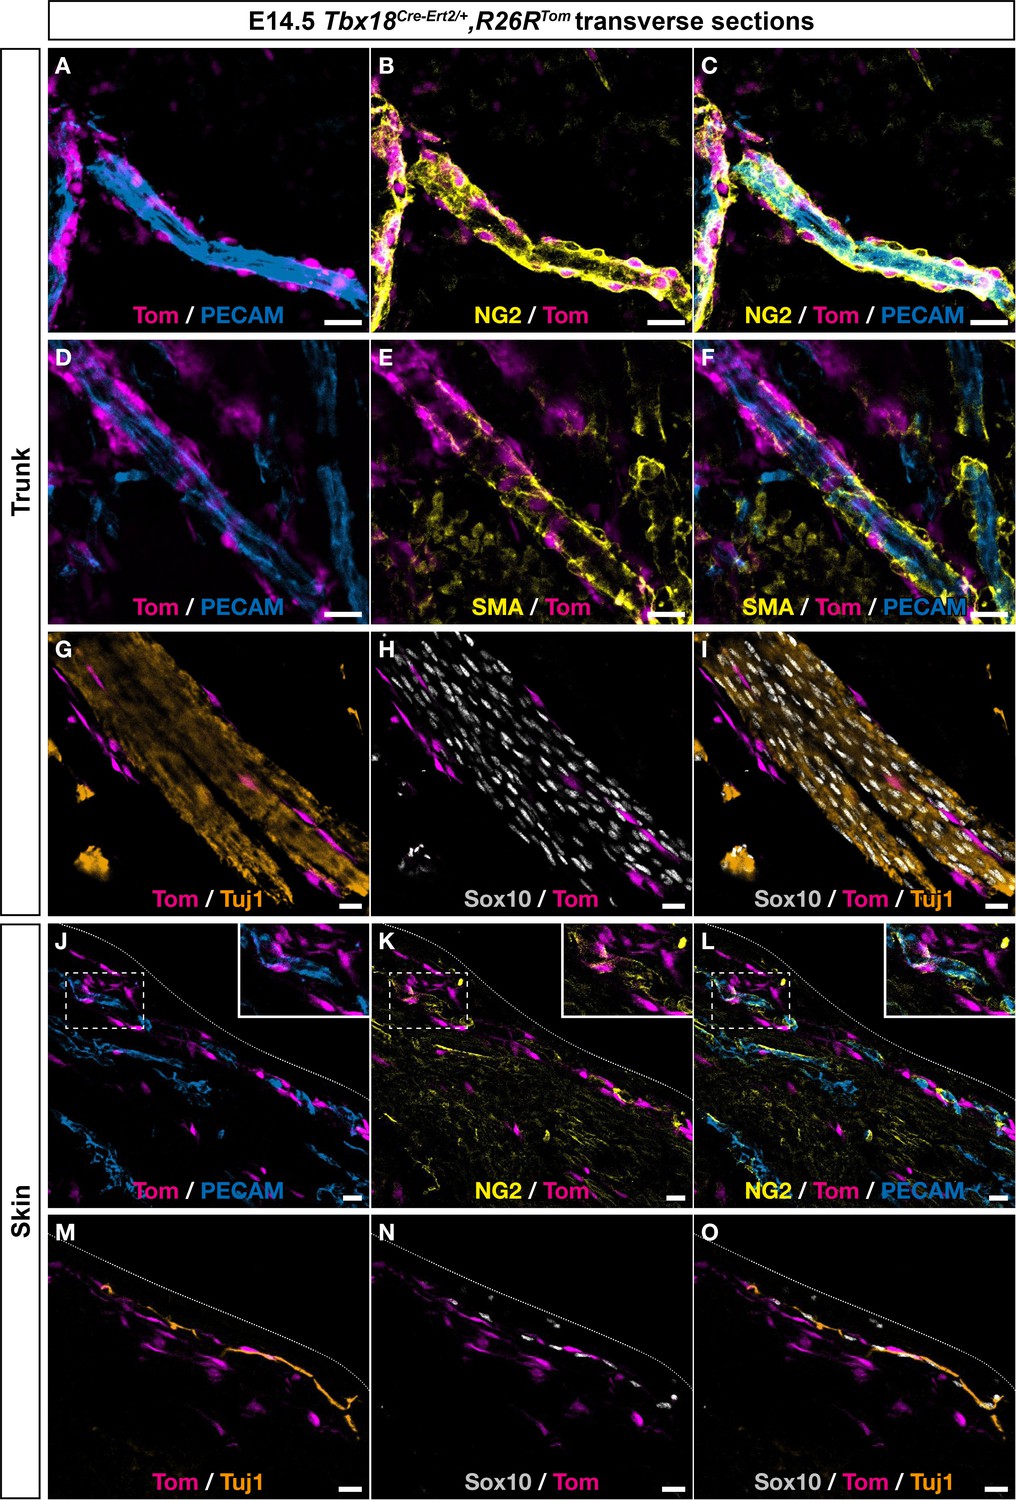
Tbx18-expressing cells contribute to mural cells (MCs) in the skin and around the neural tube.
Immunostaining on trunk transverse sections (A–I) and skin section (J–O) from Tbx18Cre-Ert2/+,Rosa26RTom embryos at embryonic day (E) 14.5, labeled with antibodies against tomato, PECAM, Tuj1, NG2, smooth muscle actin (SMA), or Sox10 (see color code on each picture). Numerous tomato-positive cells expressing MC markers NG2 and SMA were present along blood vessels near the neural tube and along and within spinal nerve (A–I). No tomato-positive cell expressed Sox10 (G–I). In the skin (J–O), tomato-positive cells expressed MC marker NG2 but remained negative for Sox10 (J– O). Tamoxifen was delivered to pregnant females at E9.5. Scale bars, 20 μm.
Figure 5 with 1 supplement
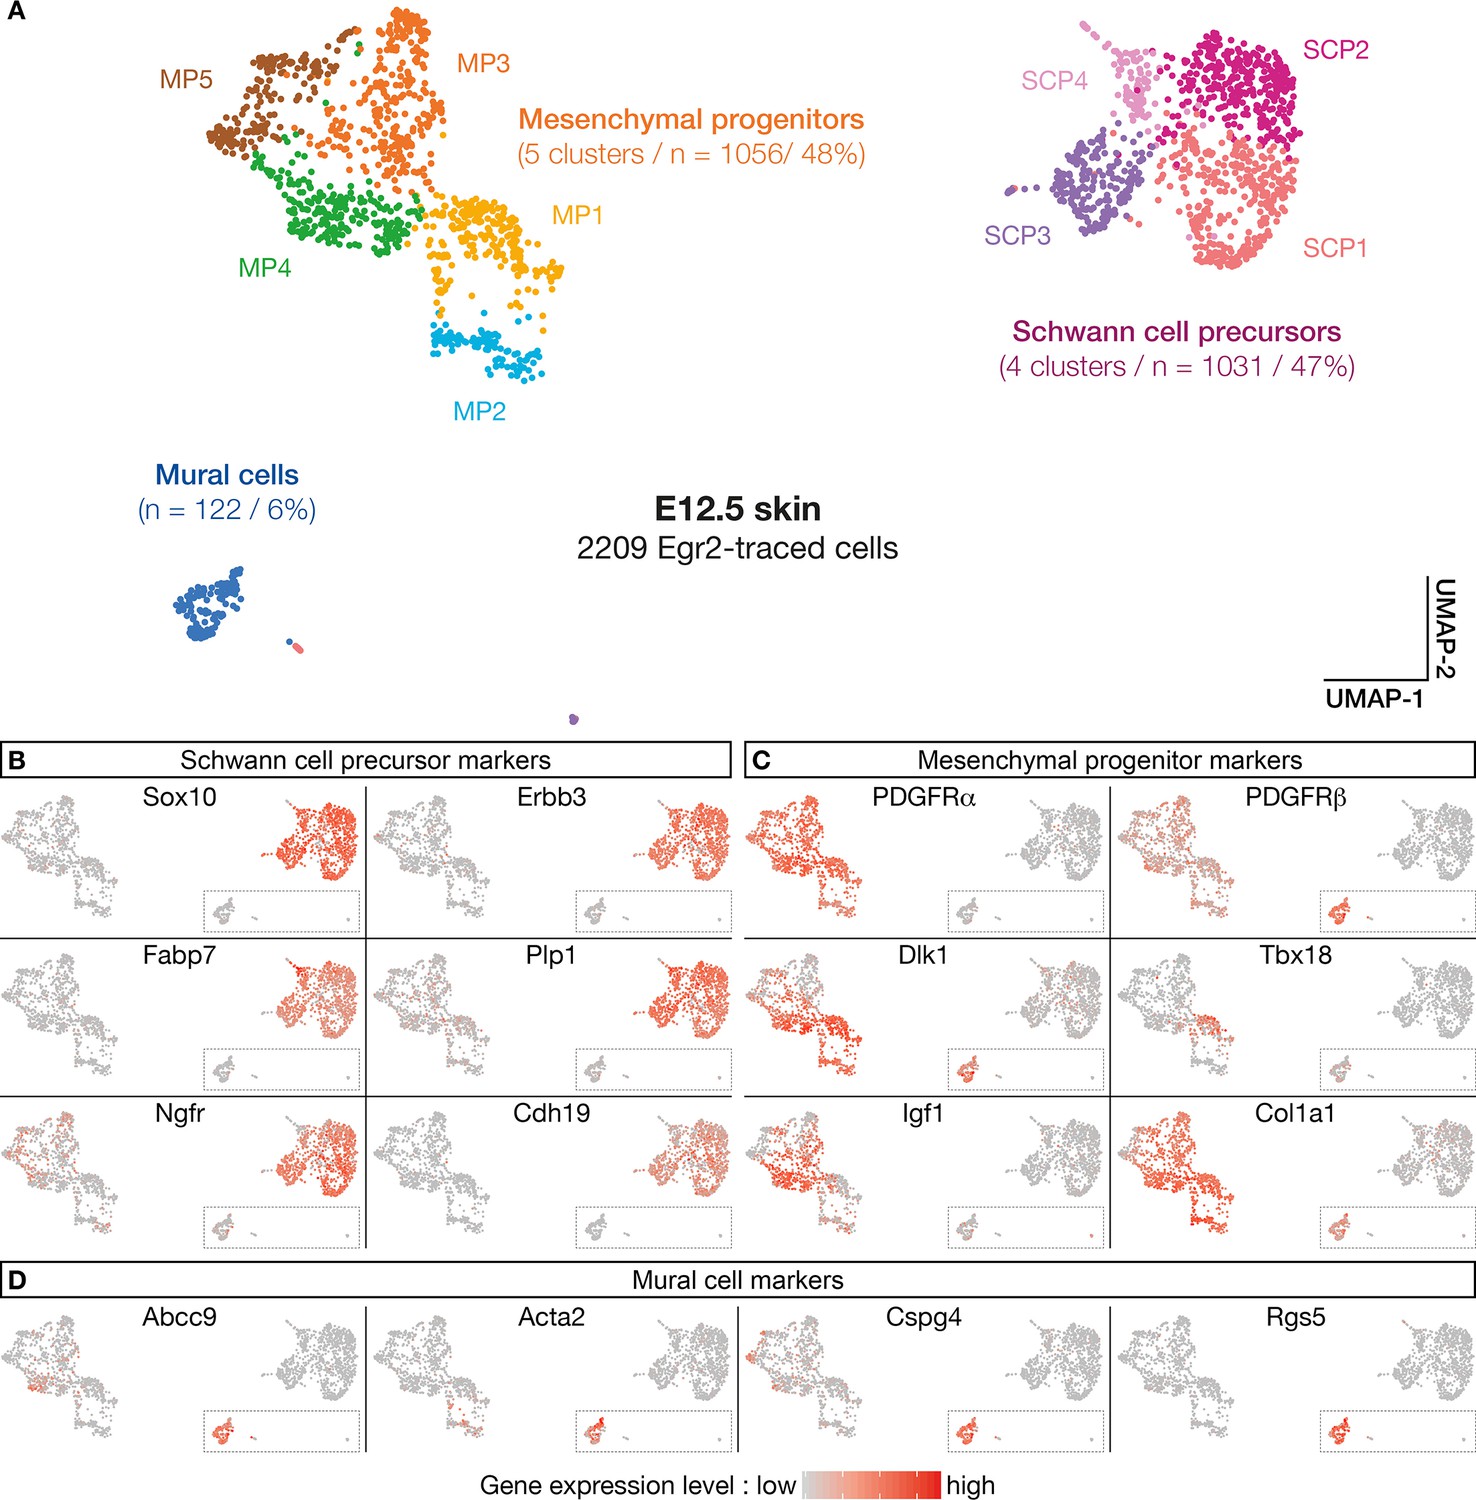
Numerous molecular features reveal diversity in cell identity in embryonic day (E) 12.5 boundary cap (BC) derivatives.
(A–D) 10 clusters can be delineated on the basis of single-cell RNA sequencing (scRNA-seq) experiments performed on traced cells from E12.5 dorsal skin. They can be organized in three supra-clusters based on their molecular signatures: Schwann cell precursors, mesenchymal progenitors, and mural cells. In (B–D), cells are color-coded, with color intensities (from gray to red) reflecting the relative levels of expression of each gene.
Figure 5—figure supplement 1
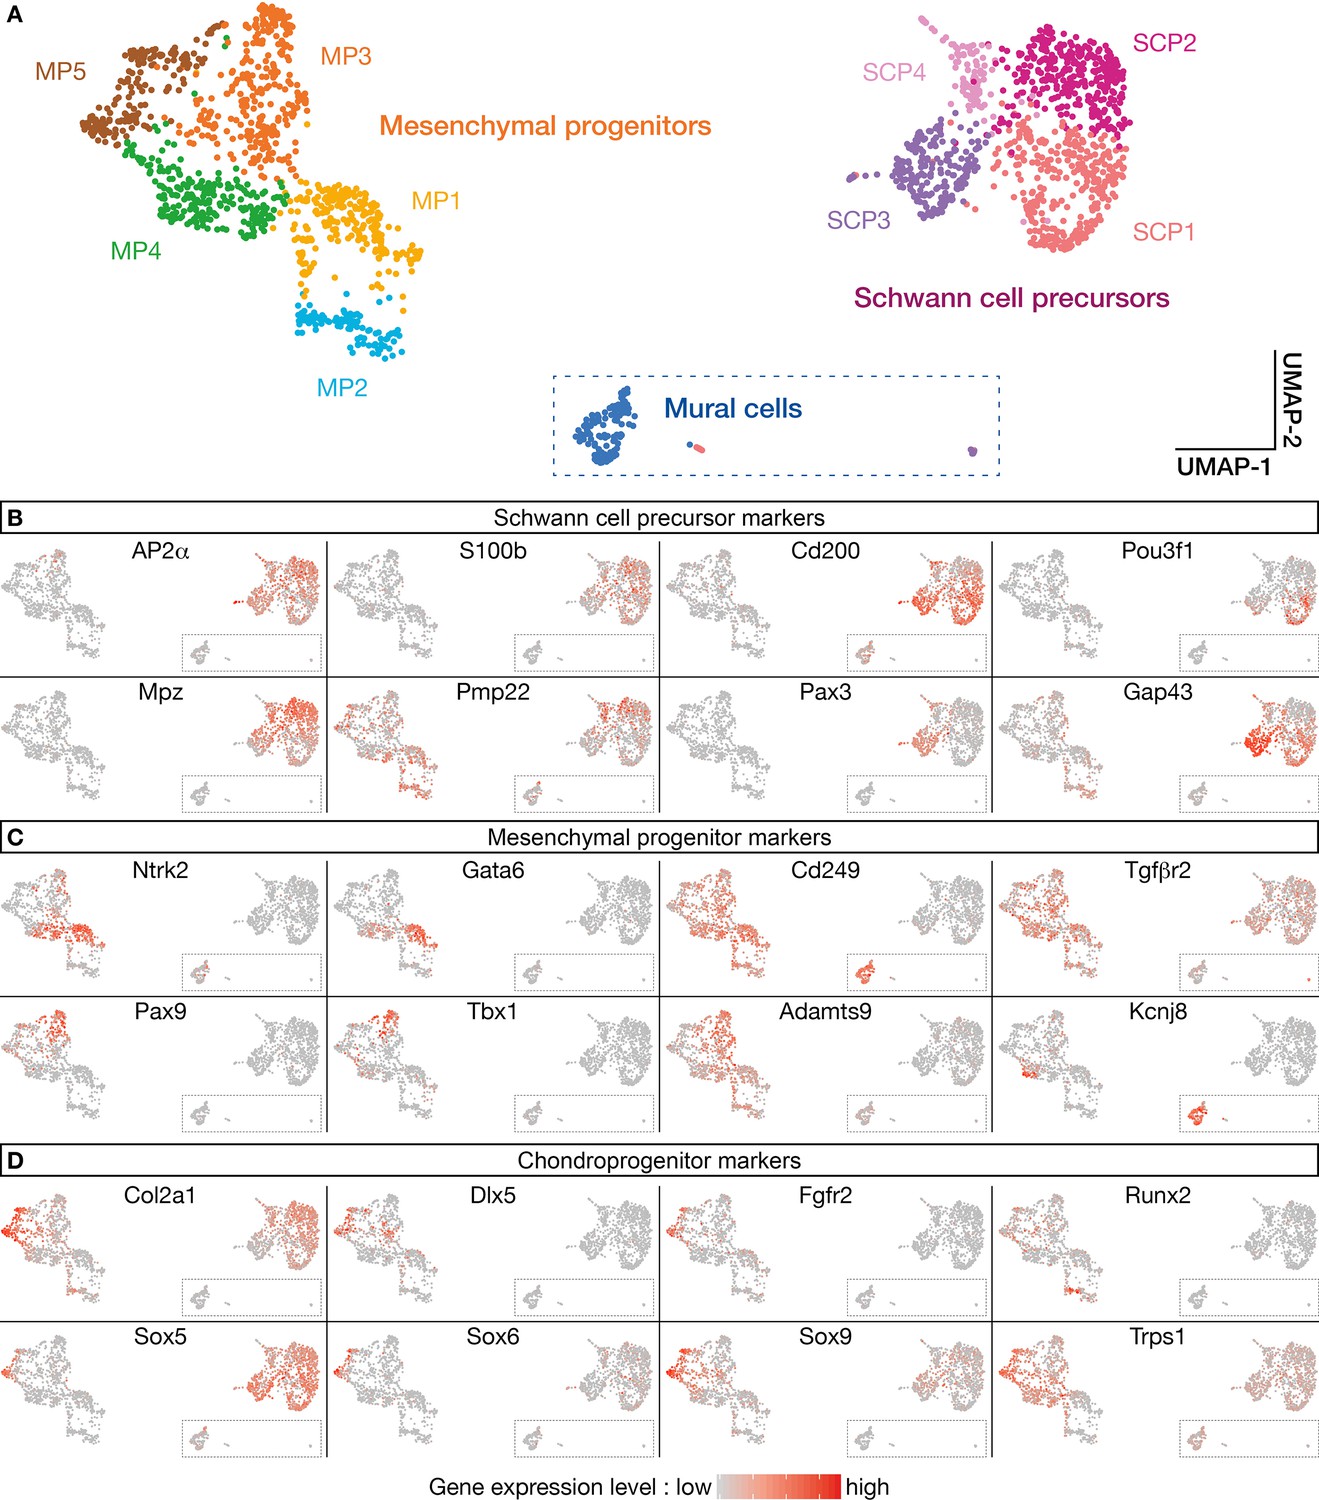
Heterogeneity of the SPC and mesenchymal progenitor (MP) supra-clusters.
Analysis of the supra-clusters (A) derived from traced cell single-cell RNA sequencing (scRNA-seq) data with respect to some SPC (B), MP, (C) or chondroprogenitor (D) markers illustrates their heterogeneity. Cells are color-coded according to gene expression levels (gray = low, red = high).
Figure 6 with 1 supplement
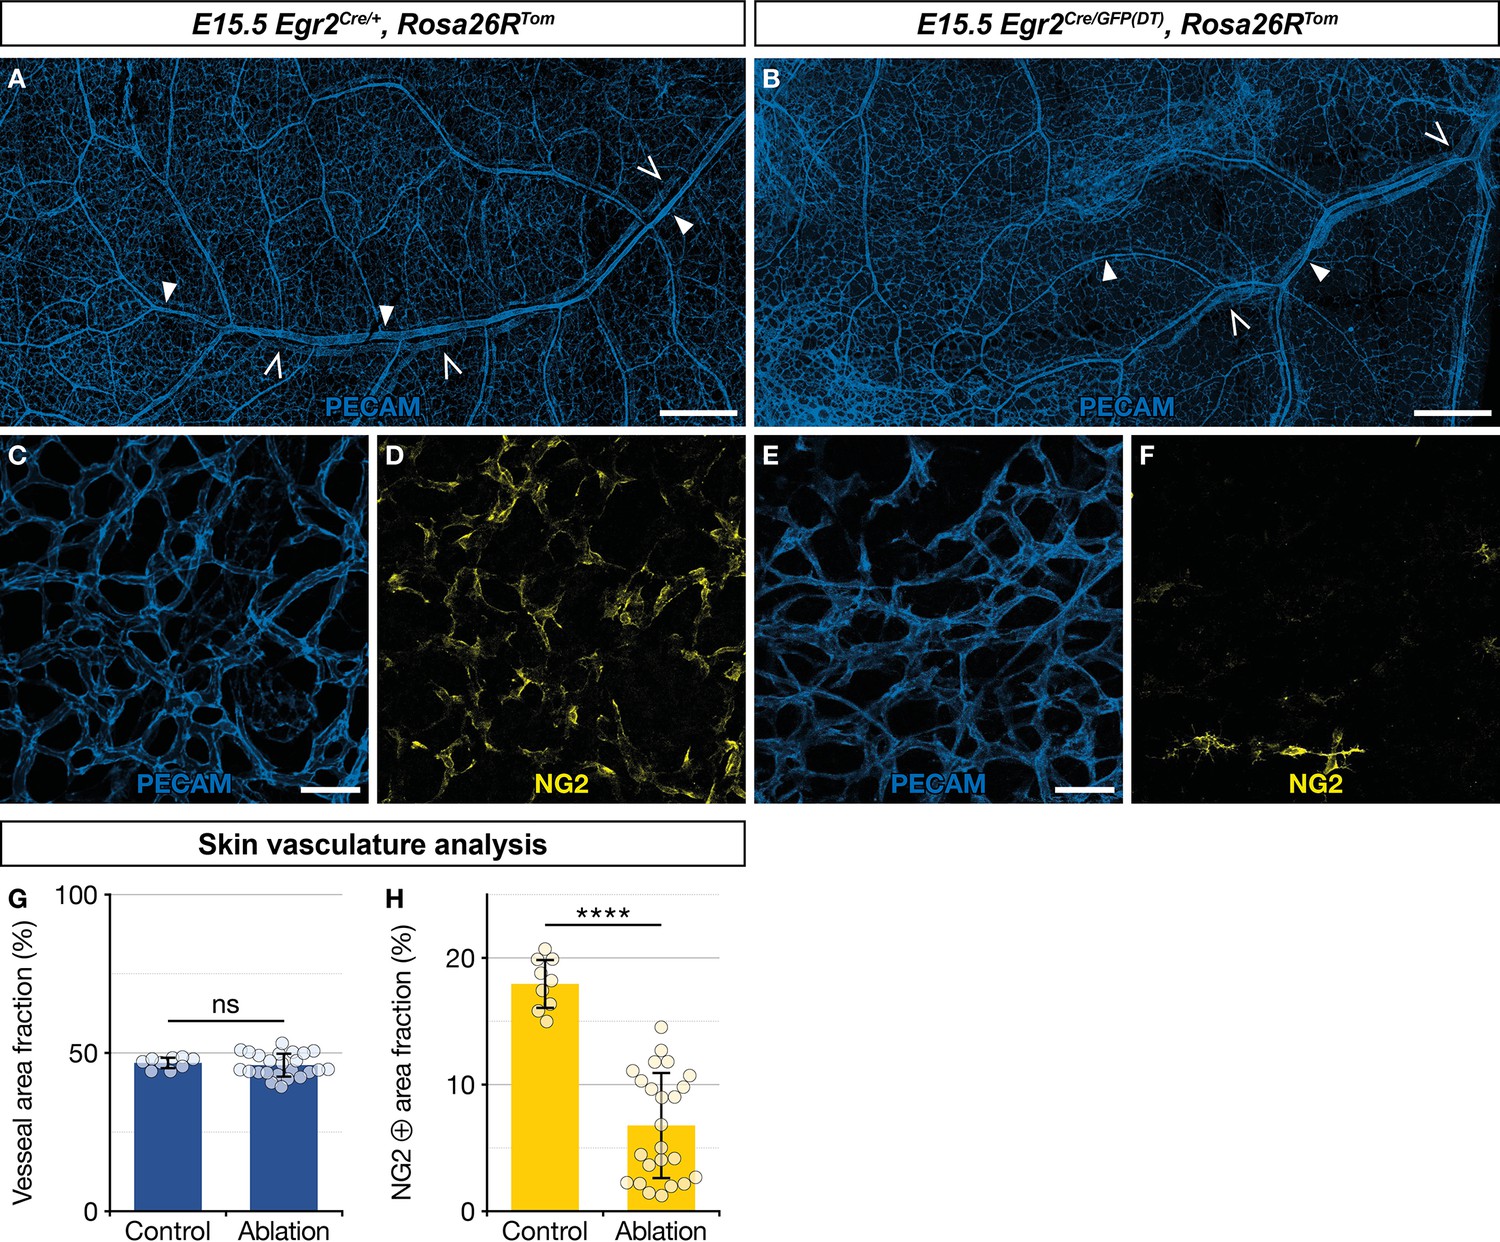
Ablation of Egr2-expressing boundary caps (BCs) impacts mural cell (MC) development in the skin.
Whole-mount embryonic dorsal skin at embryonic day (E) 15.5, labeled with antibodies against PECAM (blue) and NG2 (yellow). Compared with littermate Egr2Cre/+,Rosa26RTom control mice (A), vascular network development appeared normal at low magnification in mutant mice (B), in which BC cells and their derivatives were eliminated (arterioles and venules are indicated by full and empty arrowheads, respectively). Capillaries from mutant mice skin (E,F) showed a significant decrease in NG2-positive MCs as compared to controls (C,D). Vessel area fractions were similar in controls and mutants (G), but the NG2-positive area fraction was significantly decreased in the mutants (H), indicating a depletion of MCs. Statistical analyses of the PECAM and NG2-positive surface areas between controls (n=3) and mutants (n=4) were carried out using a Mann-Whitney U test. Scale bars, 500 μm (A,B), 50 μm (C–F). Error bars, one standard deviation (G,H). ****=p < 0.0001. ns, non-significant.
Figure 6—figure supplement 1
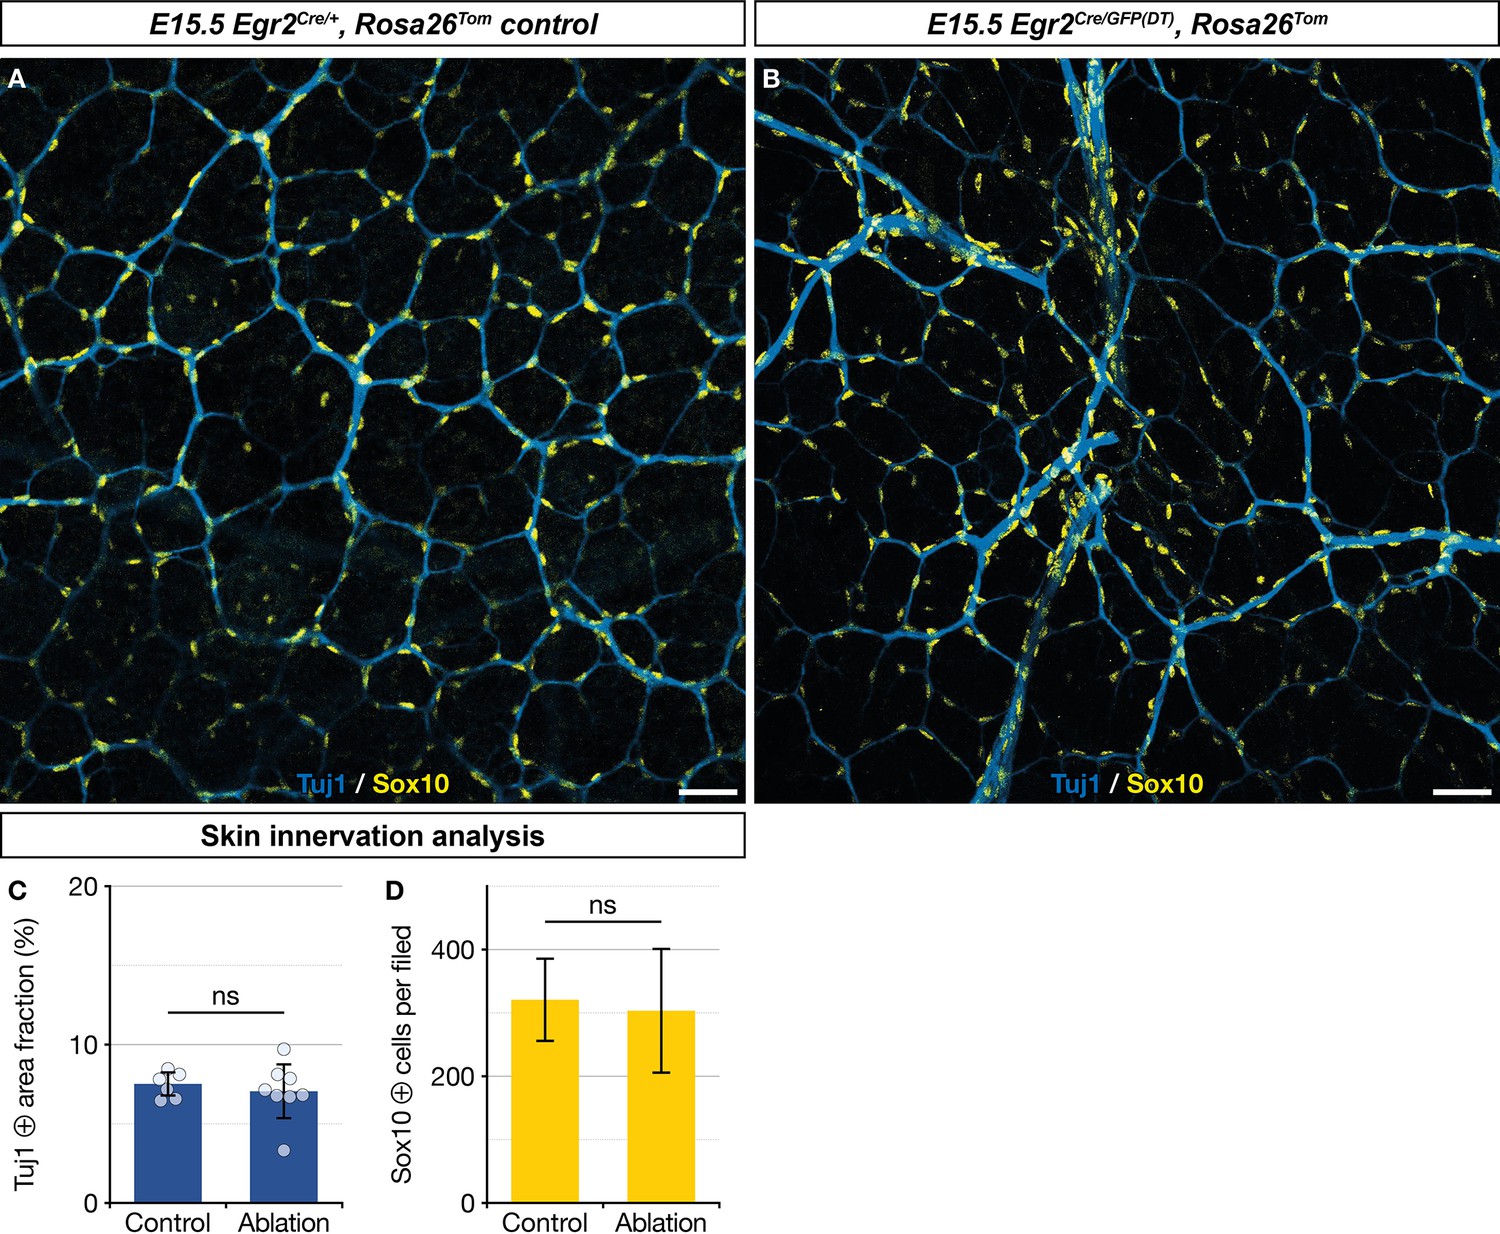
Ablation of Egr2-expressing boundary caps (BCs) does not affect normal skin innervation.
Immunolabeling of whole-mount embryonic day (E) 15.5 embryonic dorsal skin with antibodies against Tuj1 (blue) and Sox10 (yellow). Compared with non-littermate Egr2Cre/+,Rosa26RTom control mice (A), nerve network organization appeared normal in mutant mice (B). Nerve area fractions (C) and Sox10-positive cell counts (D) were similar in controls and mutant samples. Scale bars, 50 μm (A,B). Statistical analyses of the Tuj1-positive surface areas and Sox10-positive cell counts between controls (n=2) and mutants (n=2) were carried out using a Mann-Whitney U test. Error bars, one standard deviation (C,D). ns, non-significant.
Additional files
Download links
A two-part list of links to download the article, or parts of the article, in various formats.
Downloads (link to download the article as PDF)
Open citations (links to open the citations from this article in various online reference manager services)
Cite this article (links to download the citations from this article in formats compatible with various reference manager tools)
Neural tube-associated boundary caps are a major source of mural cells in the skin
eLife 12:e69413.
https://doi.org/10.7554/eLife.69413


