Neutrophil-mediated oxidative stress and albumin structural damage predict COVID-19-associated mortality
- Research Department, Children’s Cancer Hospital, Egypt
- Infectious Disease Unit, Internal Medicine Department, Faculty of Medicine, Cairo University, Egypt
- Pharmacology Department, Faculty of Medicine, Assuit University, Egypt
- Pediatric Oncology Department, National Cancer Institute, Cairo University and Children's Cancer Hospital, Egypt
- Clinical pathology department, National Cancer Institute, Cairo University and Children's Cancer Hospital, Egypt
- Department of Intensive Care, Faculty of Medicine, Cairo University, Egypt
- Department of Pulmonary Medicine, Faculty of Medicine, Cairo University, Egypt
- Department of Chest Diseases, Faculty of Medicine, Cairo University, Egypt
- Division of Geriatric Medicine, Department of Medicine, Vanderbilt University Medical Center; and VATennessee Valley Geriatric Research, Education and Clinical Center (GRECC), United States
Figures
Figure 1
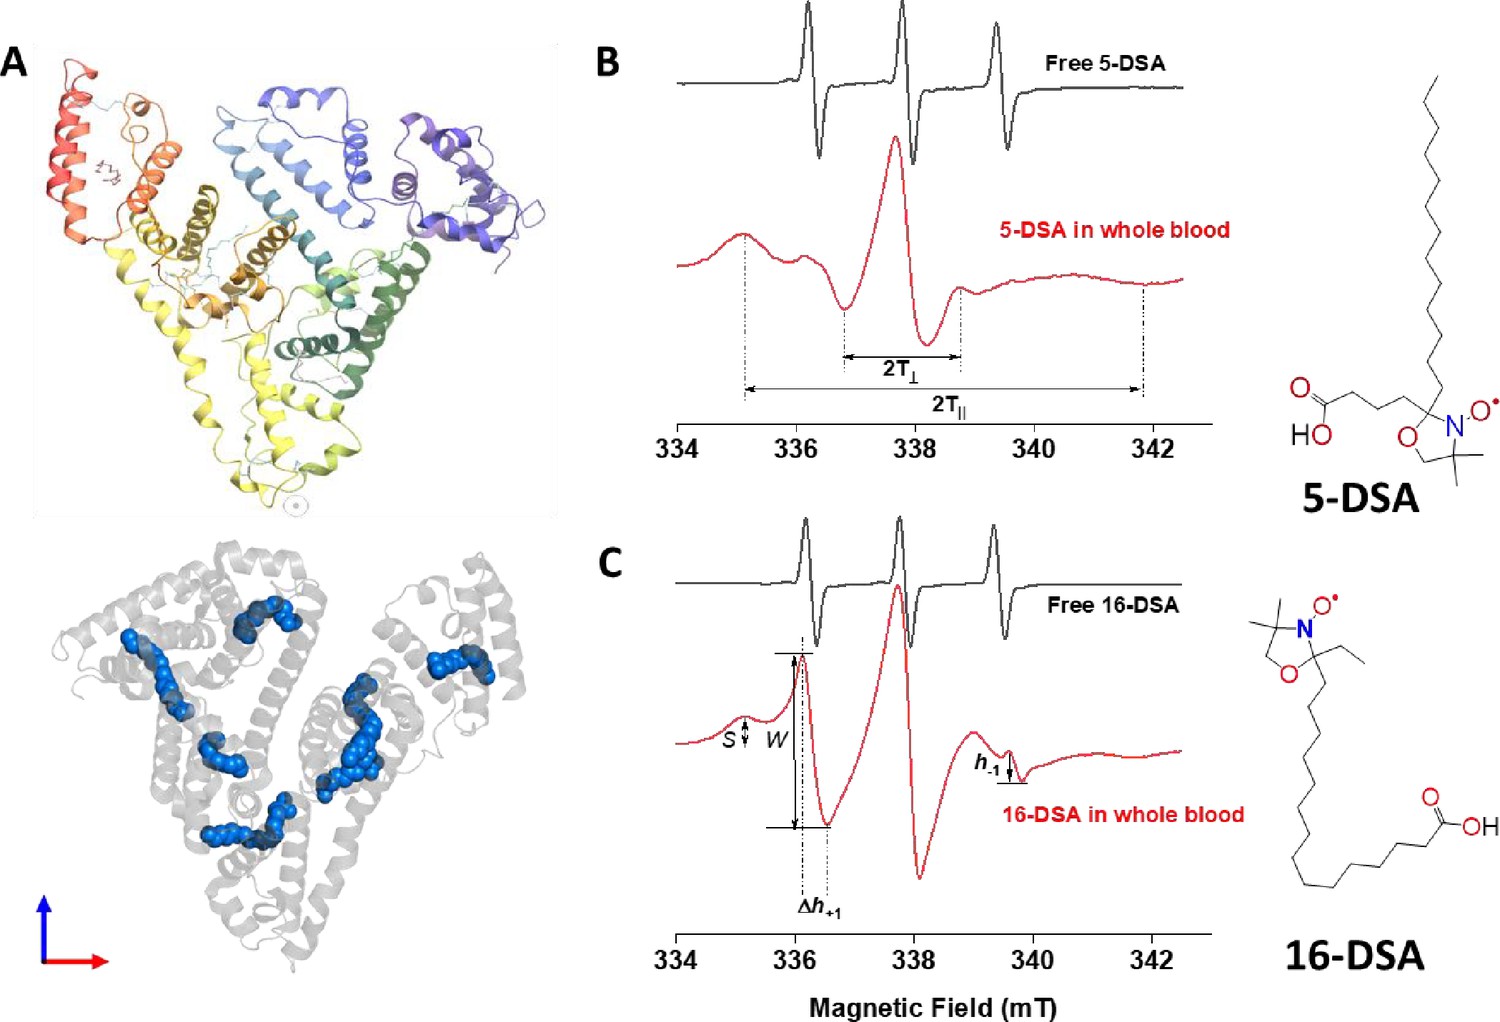
Probing structual changes of serum albumin through spin labeling EPR spectroscopy.
(A) HSA crystal structure containing seven copies of stearic acid. (B) Representative EPR spectra of free and HSA-bound 5-DSA (B) and 16-DSA (C) in whole blood from the same COVID-19 recovered patient. Chemical structures of the two spin-labeled fatty acids are given on the right side of the figure. EPR, electron paramagnetic resonance; HSA, human serum albumin.
Figure 2

Hematologic cellular counts and neutrophil-ROS levels reflect severity and mortality in COVID-19 patients.
(A) Representative flow cytometric diagrams comparing morphologic, hematologic, and ROS levels in control (representative of n=9; upper row), Sev-R (representative of n=10; middle row), and Sev-D (representative of n=11; lower row) groups. (B) Heat diagram comparing lymphocyte, neutrophils, platelets, and DCF-positive neutrophil counts as the percentage of total cell counts in all of the studied subjects. Yellow areas are either group separators or missing data due to insufficient sample size or processing errors. (C) A diagram showing statistically positive correlation between neutrophil count and count of neutrophils stained positive for DCF dye in all groups (black dots denote controls; blue are Sev-R; and red represent Sev-D patients). (D) When neutrophil counts were compared for all groups, both Sev-R and Sev-D groups showed statistically significant neutrophilia relative to control groups. However, only a weak trend has been observed when comparing the two groups with COVID-19. (E) DCF staining revealed increased levels of ROS in Sev-R and Sev-D groups relative to control neutrophils. Sev-D showed a trend of increased ROS level relative to Sev-R group. Multiple comparisons were carried out using ANOVA followed by Tukey test and p values are given. ROS, reactive oxygen species.
-
Figure 2—source data 1
Raw source data for Figure 2B-E.
- https://cdn.elifesciences.org/articles/69417/elife-69417-fig2-data1-v2.xlsx
Figure 3
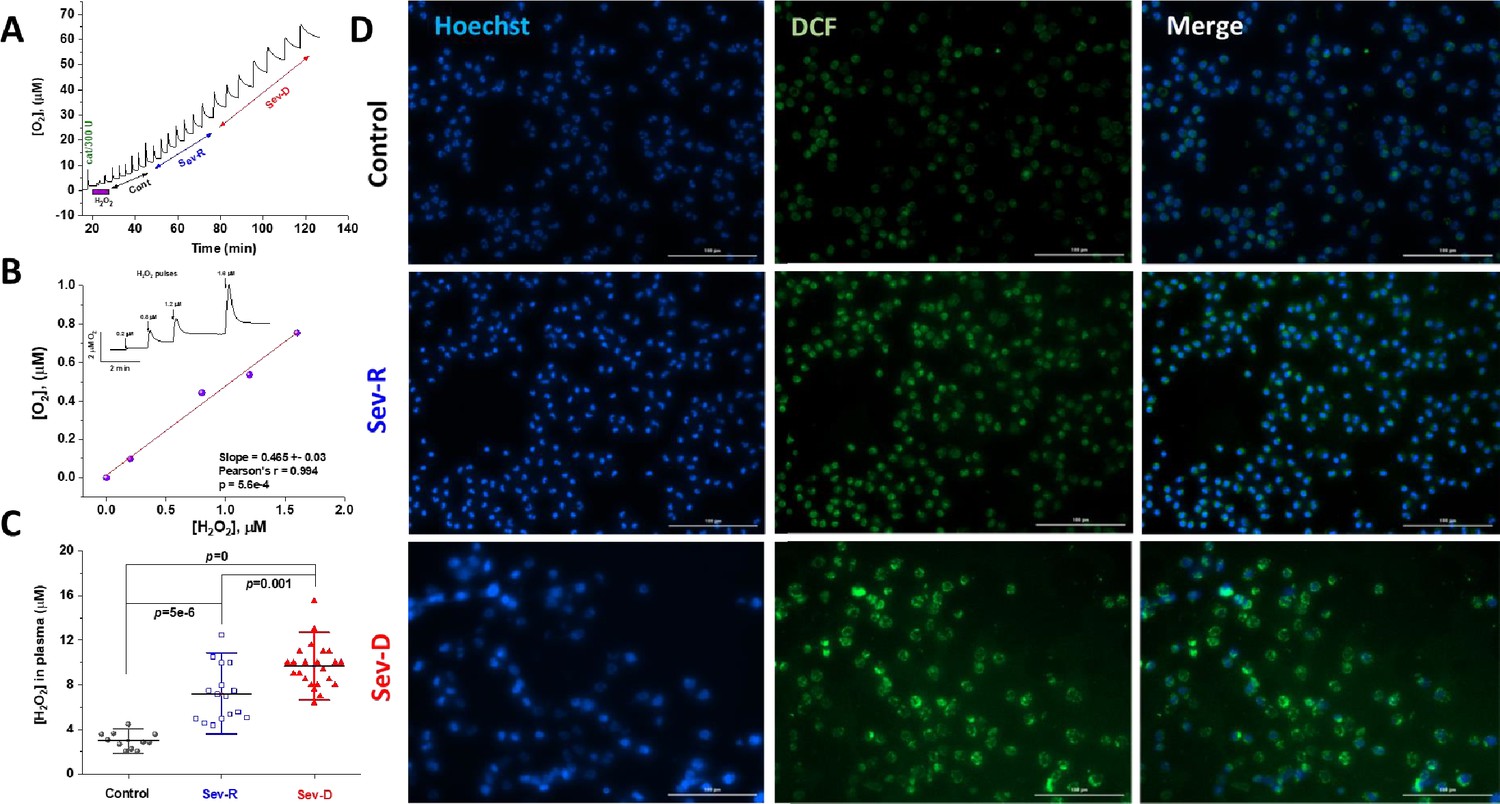
Hydrogen peroxide levels in plasma and neutrophils reflect mortality in COVID-19 patients.
Catalase was used to specifically and quantitatively determine levels of hydrogen peroxide in identical plasma volumes collected from control (n=11), Sev-R (n=16), and Sev-D (n=23) groups. (A) Oxygen levels are monitored and recorded while 50 μl batches of plasma from control, Sev-R, and Sev-D subjects are sequentially infused into tightly air-controlled O2k chamber containing catalase (315 units/ml) in deoxygenated buffer. In addition to the initial rise due to residual oxygen in the added plasma samples, the decomposition of hydrogen peroxide in these samples produces oxygen quantitatively. (B) To verify the assay we measured the released oxygen upon adding an increasing volume of standard hydrogen peroxide solution in PBS buffer with 0.2, 0.8, 1.2, and 1.6 μM final concentrations; inset. Linear fitting of the plotted [O2] versus [H2O2] relation yielded a slope=0.47±0.03 (Pearson’s r=0.994, p=5.6×10⁻⁴), which is very close to the theoretically expected value of 0.5 as the catalase-mediated decomposition of one mole of H2O2 produces ½-mole O2. (C) Plasma contents of H2O2 in plasma significantly increased in the order Sev-D>Sev-R>Cont using ANOVA followed by Tukey test applied on n=11, 16, and 23 for control, survivors, and non-survivors, respectively. (D) Fluorescence imaging was used to assess levels of ROS in freshly isolated neutrophils using DCF (2,7-Dichlorodihydrofluorescein diacetate, green) staining in all groups. Hoechst binds strongly to adenine–thymine-rich regions in DNA thus mapping nuclei through emitting blue fluorescence. Merged DCF and Hoechst images are shown in the third column. Images were acquired using Cytation 5 Cell Imaging Multi-Mode Reader (Agilent) and analyzed using Gen5 Software package 3.08. Scale bar: 100 µm.
-
Figure 3—source data 1
Raw polarographic data for released oxygen (A), calibration curve (B), and calculated plasma hydrogen peroxide levels in all groups (C).
- https://cdn.elifesciences.org/articles/69417/elife-69417-fig3-data1-v2.xlsx
Figure 4

EPR spectroscopic analyses of HSA-fatty acid binding reveal strong dependence of binding on mortality in COVID-19 patients.
(A) Albumin level in plasma of control (n=8), Sev-R (n=16), and Sev-D (n = 23) groups showed that both survivors and non-survivors COVID-19 patients exhibit statistically significant hypoalbuminemia. Comparisons between representative spectra showing changes in line shape that are related to mobility and microenvironmental statuses of HSA-bound 5-DSA (B) and 16-DSA (C) in whole blood of a control (black trace), a Sev-R (blue trace), and a Sev-D (red trace) patients. Calculated biophysical parameters including order parameter (D), rotational correlation time (E), and the ratio between strongly bound to weakly bound spin labels (S/W, F) as defined in Figure 1 and described in Materials and methods section. Statistical comparisons by ANOVA followed by Tukey tests were used for means’ comparisons and revealed remarkable decrease in the binding strengths and packing parameter of the local microenvironment surrounding the spin labels. All calculated parameters along with exact p values are given in the Supplementary file 1. Water accessibility into albumin/fatty acids binding pockets are followed by reacting with ascorbate, which reduces nitroxide radicals into the EPR silent hydroxylamines. Representative EPR signal decays of 16-DSA in whole blood of control (G) and Sev-D (H) are shown. Kinetic traces (n=3 per group) showing the reduction of 16-DSA (I) and 5-DSA (J) bound to HSA by sodium ascorbate in whole blood. Kinetic traces are shown as the percentage loss of the signal intensity of the middle peak (A/A0). All samples contained 0.26 mM spin label and 3 mM sodium ascorbate and measured at 37°C. Weaker and slower disappearance of the EPR signal suggests inaccessible space toward the nitroxide moiety of the spin label. EPR, electron paramagnetic resonance; HSA, human serum albumin.
-
Figure 4—source data 1
Determined biochemical and biophysical EPR parameters used for statistical comparisons.
- https://cdn.elifesciences.org/articles/69417/elife-69417-fig4-data1-v2.xlsx
Figure 5
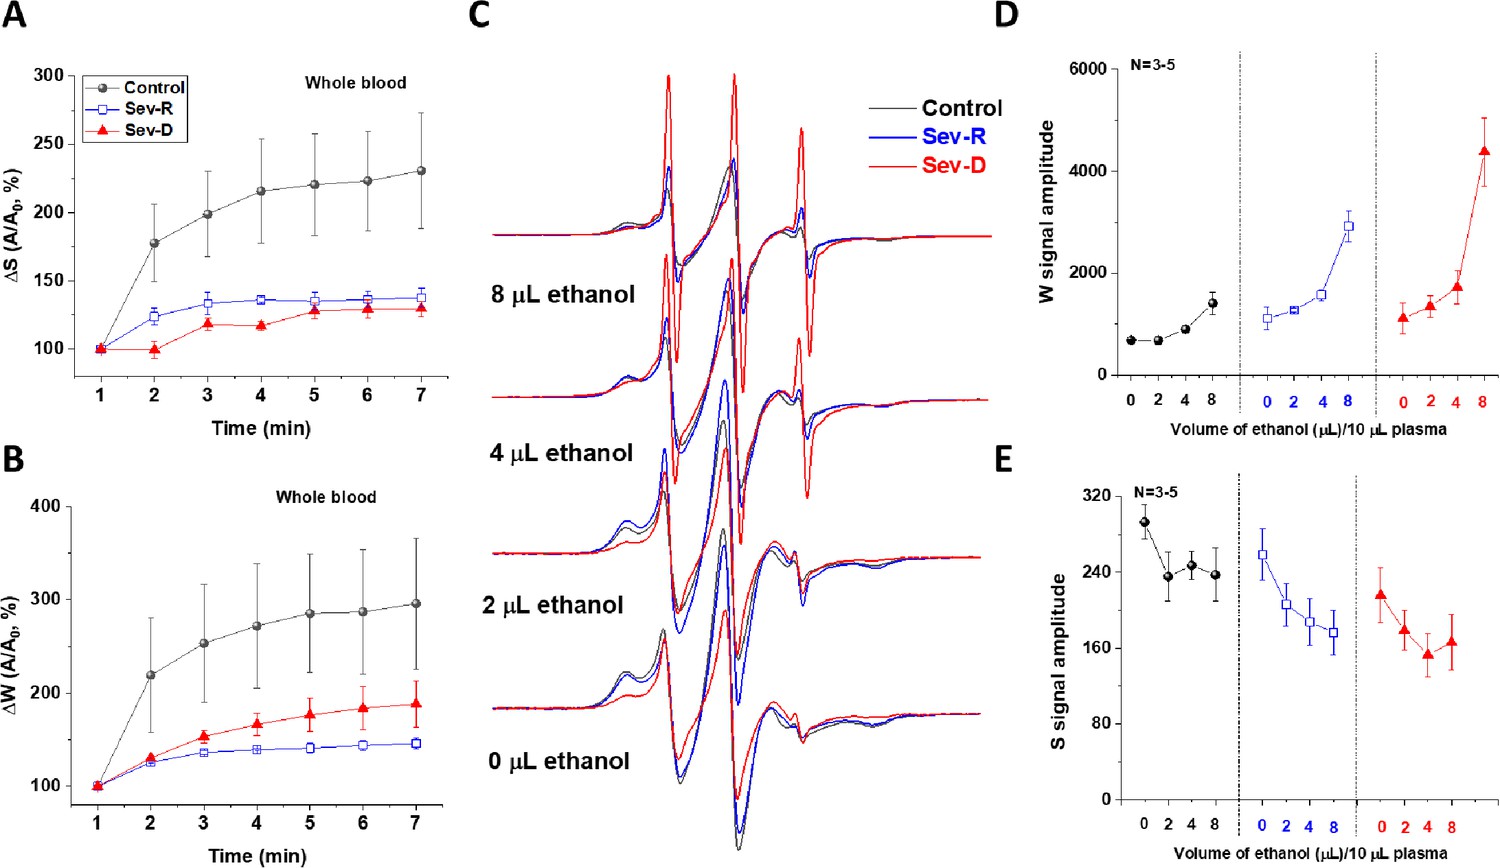
COVID-19-associated impairment of HSA transport function.
Transport function of HSA is assessed through the apparent kinetics of fatty acid uptake by following the rise in both strongly (A) and weakly (B) bound components immediately after mixing SLFA with blood from representative subjects (n=3 for each kinetic trace). These results demonstrate the hindered fatty acid uptake by HSA of critically ill patients relative to controls. (C–E) To investigate the dislodging function of HSA, increasing volumes of absolute ethanol were added to identical SLFA-plasma mixtures of all groups (n=3–5) and the EPR spectra were acquired (C) to follow weakly (D) and strongly (E) bound populations of SLFA. Redistributions of the fatty acid populations are noticeable through decreased S and increased W (includes signals of free fatty acid) peaks. This redistribution is remarkably pronounced in critically ill patients reflecting weaker association with, and easier release of fatty acids from HSA in those patients. HSA, human serum albumin; SLFA, spin-labeled fatty acid.
Figure 6
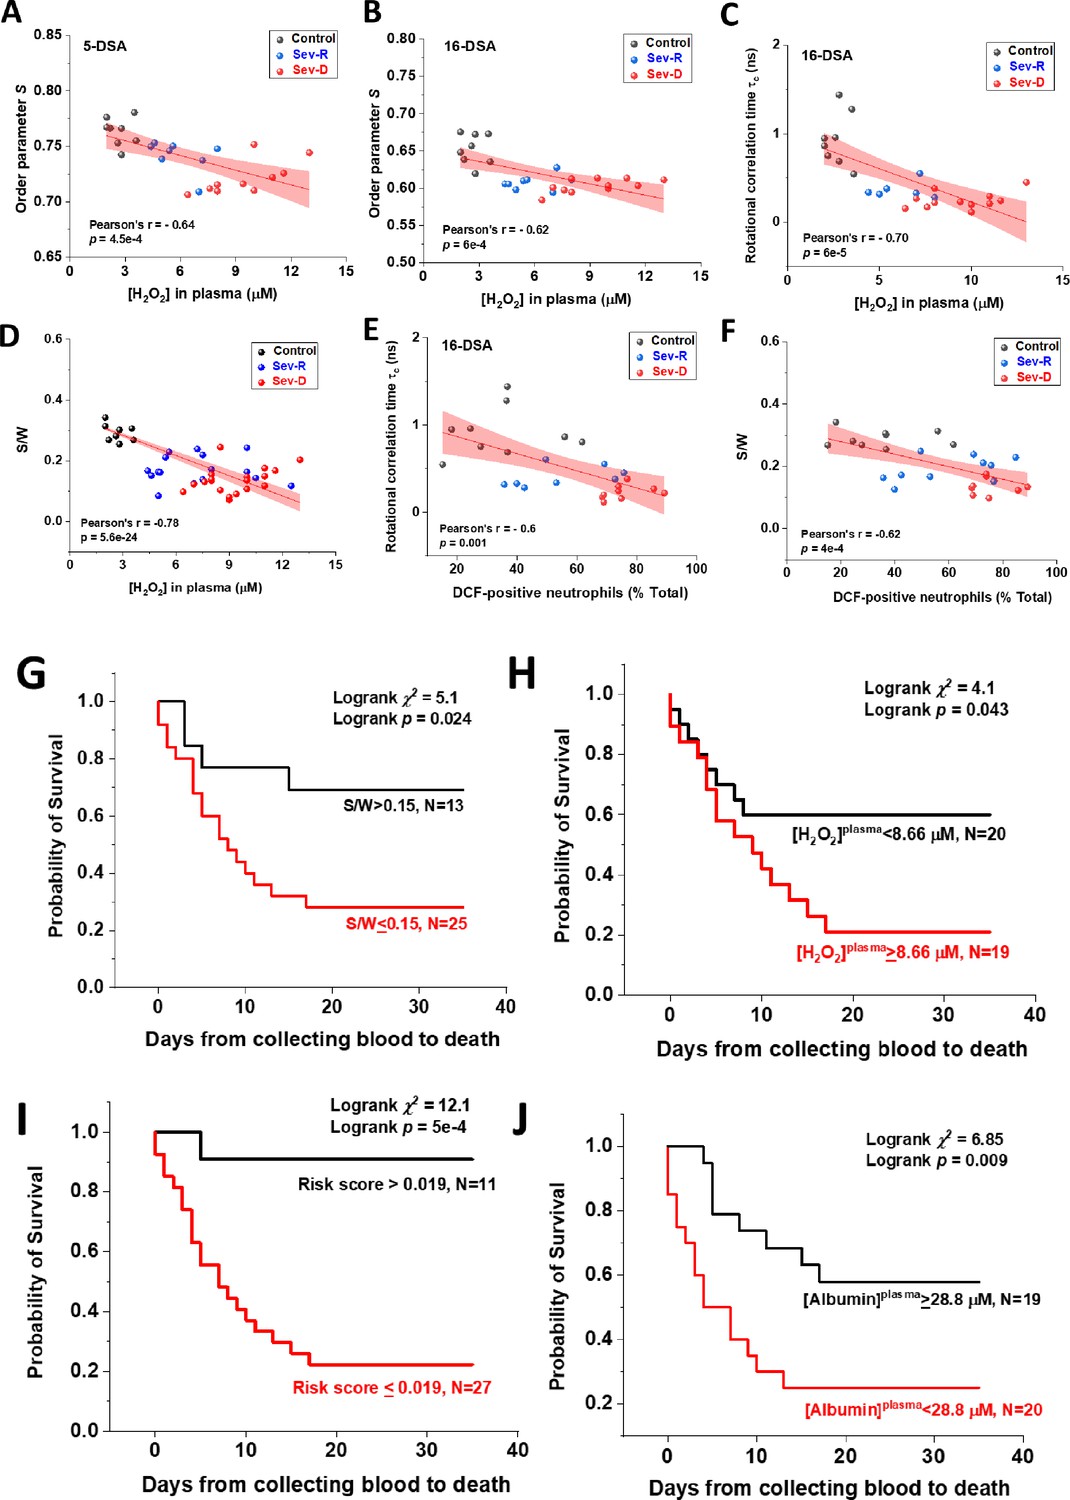
Associations of oxidative stress measures and biophysical parameters with mortality outcome in COVID-19 subjects.
Linear correlations between plasma levels of hydrogen peroxide and EPR-calculated parameters pertaining to protein packing order parameter (A, B), fatty acid mobility τc (C), and S/W ratio (D) in Control (black circles), Sev-R (blue circles), and Sev-D (red circles) groups (n=26, 27, 26, 46, 26, and 28 for data in panels (A–F), respectively). Significant negative correlation between S/W ratio and plasma levels of hydrogen peroxide is seen (D). Neutrophils are major sources of oxidative stress as evident from the linear correlations between % DCF positive neutrophils and τc (E) or S/W ratio (F). On each correlation, Pearson’s r and exact p values are provided. Kaplan–Meier estimates of time-to-mortality from blood sample collection during ICU hospitalization (G–J). Log-rank Kaplan–Meier survival analyses were carried out to estimate the probability of survival of COVID-19 patients in relation to cutoff thresholds arbitrarily selected as the mean values of the analyzed parameters. For S/W, plasma [H2O2], Risk Score defined as the {(S/W)/[H2O2]} ratio, and plasma [Albumin], the number of analyzed COVID-19 patients were 38, 39, 38, and 39, respectively. EPR, electron paramagnetic resonance.
-
Figure 6—source data 1
Raw data for correlation analyses and for Kaplan-Meier analyses.
- https://cdn.elifesciences.org/articles/69417/elife-69417-fig6-data1-v2.xlsx
Tables
Table 1
Demographic and clinical characteristics of the studied subjects.
| Sev-R | Sev-D | Tukey 95% CI | p | |
|---|---|---|---|---|
| n | 16 | 23 | ||
| Age (mean ± SD) | 60.7±9.5 | 67.8±13.2 | 4.1–17.8 | 0.09 |
| Male | 56.25% | 63.16% | 0.677† | |
| sO2 (mean ± SD) | 82.1±18.7 | 76.1±18.6 | –20.5 to 8.4 | 0.40 |
| Hypertension | 12.5% | 42.1% | 0.053† | |
| Diabetes | 25% | 75% | 0.08† | |
| Cardiovascular disease | 0% | 15.8% | 0.10† | |
| Cancer | 0% | 10.5% | 0.18† | |
| Bronchial asthma | 6.25% | 10.5% | 0.65† | |
| ACE inhibitors | 0% | 7.14% | 0.47† | |
| ARBs | 9.09% | 7.14% | 0.85† | |
| calcium channel blocker | 14.28% | 7.14% | 0.60† | |
| Beta blockers | 0% | 7.14% | 0.47† | |
| Diuretics | 0% | 7.14% | 0.47† | |
| Sulphonylurea | 14.28% | 21.43% | 0.69† | |
| Other oral hypoglycemic | 0% | 21.43% | 0.18† | |
| Insulin | 42.85% | 21.43% | 0.30† | |
| Anticoagulant | 57.14% | 50.0% | 0.76† | |
| Steroids | 71.42% | 64.28% | 0.74† | |
| Hydroxychloro-quine | 14.28% | 7.14% | 0.60† | |
| IL-6 receptor antibody | 28.57% | 21.42% | 0.72† | |
| Proton-pump inhibitor | 28.57% | 42.85% | 0.52† | |
| Azithromycin | 14.28% | 28.57% | 0.47† | |
| Cephalosporin | 42.85% | 21.43% | 0.30† | |
| Carbapenem | 42.85% | 42.85% | 1.0† | |
| Oxazolidinone | 42.85% | 28.57% | 0.51† | |
| Fluoro-quinolone | 42.85% | 21.43% | 0.30† | |
| Nitrofuran | 14.28% | 0% | 0.15† | |
| Remdesivir | 14.28% | 28.57% | 0.47† | |
| Ivermectin | 0% | 28.57% | 0.11† |
-
sO2, blood oxygen saturation level; ACE, angiotensin-converting enzyme; ARB, angiotensin II receptor blocker; IL-6, interleukin-6. † p values obtained through Pearson’s χ2 test.
Table 2
Laboratory parameters of the current study patients.
WBC, white blood cell; INR, international normalized ratio; CRP, high-sensitivity C-reactive protein; ICU,intensive care unit; PLT, platelet; ALT, alanine transaminase; AST, aspartate transaminase. The Tukey’scalculated p-values as well as upper and lower 95% confidence levels for the Sev-R vs. Sev-D means’comparisons are given.
| Sev-R (mean ± SD) | Sev-D (mean ± SD) | Tukey 95% CI | p | |
|---|---|---|---|---|
| WBCs (×103 /ml) | 10.6±4.0 | 13.9±8.0 | –1.47 to 8.06 | 0.17 |
| Platelets (×106 /ml) | 260±75.5 | 213.7±115.8 | –116.7 to 24.2 | 0.19 |
| INR | 1.29±0.56 | 1.23±0.23 | –0.38 to 0.26 | 0.69 |
| CRP (mg/L) | 51.19±54.4 | 103.77±86.3 | –2.35 to 107.5 | 0.06 |
| D-dimer (mg/ml) | 1.47±1.9 | 3.17±3.56 | –0.55 to 3.96 | 0.13 |
| IL-6 (pg/ml) | 314.1±527 | 325.3±619 | –591 to 614 | 0.97 |
| Ferritin | 922.6±565 | 1078±578 | –281 to 594 | 0.47 |
| Albumin (g/ml) | 31.47±7.95 | 26.97±5.1 | –8.7 to –0.26 | 0.038 |
| Hemoglobin (g/dl) | 12.26±2.0 | 12.16±2.0 | –1.53 to –1.33 | 0.97 |
| ALT (U/L) | 33.64±24.15 | 46.5±37.2 | –10.37 to 36.13 |
-
ALT, alanine transaminase; AST, aspartate transaminase; CRP, high-sensitivity C-reactive protein; ICU,intensive care unit; PLT, platelet; INR, international normalized ratio; WBC, white blood cell. The Tukey’scalculated p-values as well as upper and lower 95% confidence levels for the Sev-R vs. Sev-D means’comparisons are given.
Key resources table
| Reagent type (species) or resource | Designation | Source or reference | Identifiers | Additional information |
|---|---|---|---|---|
| Antibody | CD-42b-PE- (Mouse monoclonal) | Beckman Coulter Life Sciences | Cat#IM1417URRID: AB_2893282 | FACS (1 µl per test) |
| Antibody | CD14-PC7- (Mouse monoclonal) | Beckman Coulter Life Sciences | Cat#A22331RRID: AB_10639528 | FACS (1 µl per test) |
| Antibody | CD66b-APC-Alexa Fluor 750- (Mouse monoclonal) | Beckman Coulter Life Sciences | Cat#B08756RRID:AB_2893284 | FACS (1 µl per test) |
| Antibody | CD3-ECD- (Mouse monoclonal) | Beckman Coulter Life Sciences | Cat#IM2705URRID: MGI:3850637 | FACS (1 µl per test) |
| Other | 2′,7′-dichlorofluorescein-diacetate | Sigma-Aldrich | Cat#D6883 | Imaging (30 μM)FACS (20 μM) |
| Other | DAPI | Thermo Fisher Scientific | Cat#62249 | Imaging (6.15 µg/ml) |
| Other | 2-(3-carboxypropyl)-4,4-dimethyl-2-tridecyl-3-oxazolidinyloxy (5–130 doxyl-stearic acid, 5-DSA) | Sigma-Aldrich | Cat#253618 | EPR (0.26 mm) |
| Other | 2-(14-carboxytetradecyl)-2-ethyl-4,4-dimethyl-3-oxazolidinyloxy (16–131 doxyl-stearic acid, 16-DSA) | Sigma-Aldrich | Cat#253596 | EPR (0.26 mm)EPR/ethanol experiments (0.52 mm) |
Additional files
-
Supplementary file 1
Calculated biophysical EPR spectral parameters for all groups.
- https://cdn.elifesciences.org/articles/69417/elife-69417-supp1-v2.pptx
-
Transparent reporting form
- https://cdn.elifesciences.org/articles/69417/elife-69417-transrepform1-v2.docx
Download links
A two-part list of links to download the article, or parts of the article, in various formats.
Downloads (link to download the article as PDF)
Open citations (links to open the citations from this article in various online reference manager services)
Cite this article (links to download the citations from this article in formats compatible with various reference manager tools)
Neutrophil-mediated oxidative stress and albumin structural damage predict COVID-19-associated mortality
eLife 10:e69417.
https://doi.org/10.7554/eLife.69417


