Developmental changes in story-evoked responses in the neocortex and hippocampus
- Department of Psychology, Columbia University, United States
Figures
Figure 1 with 3 supplements
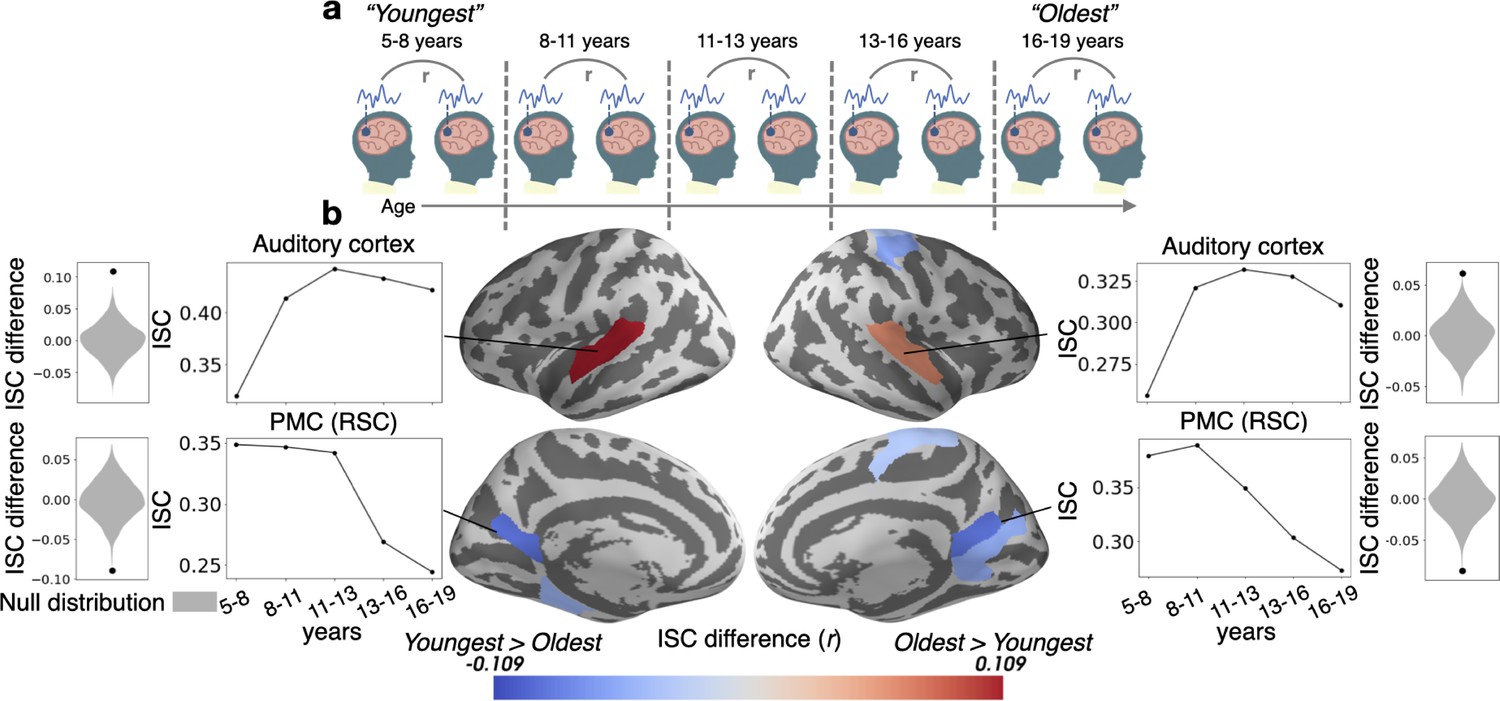
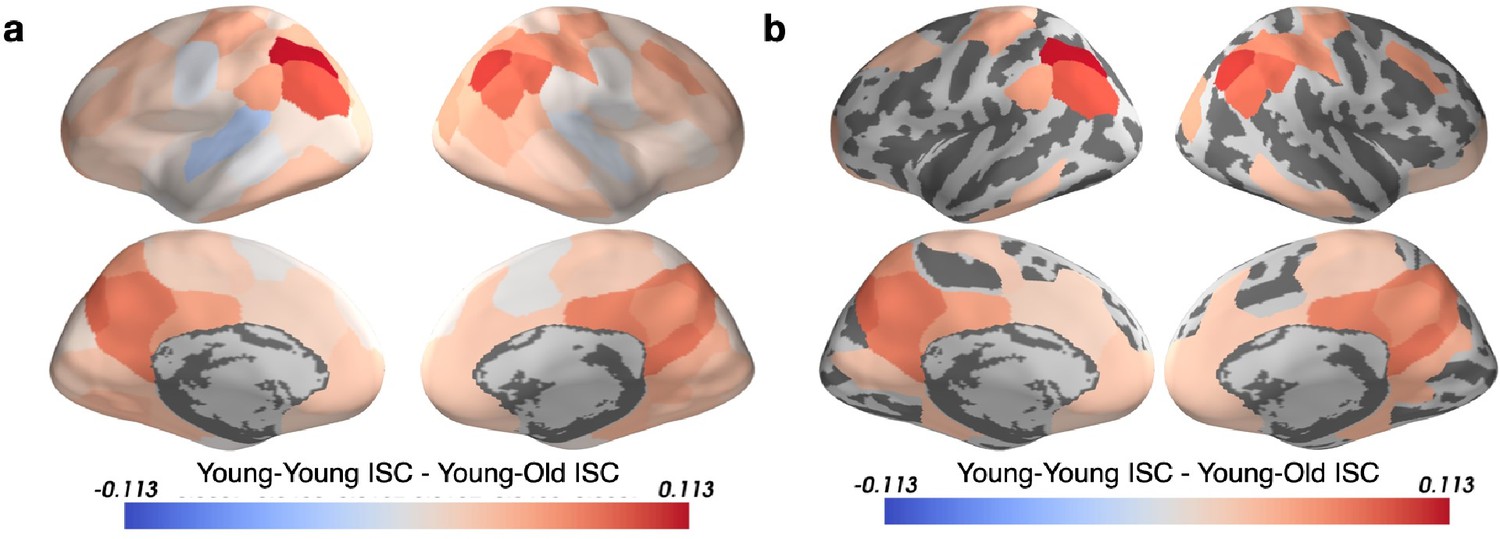
Inter-subject correlation (ISC) increases with age in sensory regions and decreases with age in the PMC.
(a) Within-group ISC was computed for five distinct age groups, and a statistical comparison was performed between the Oldest and Youngest age groups. (b) The difference in ISC between the Youngest (5–8years) group and the Oldest (16–19years) group is displayed in significant parcels (q<0.05) on the cortical surface. ISCs for all age groups are plotted for four significant parcels, selected post hoc for illustration, along with the ISC difference between the Youngest and Oldest groups compared to the null distribution.
Figure 1—figure supplement 1
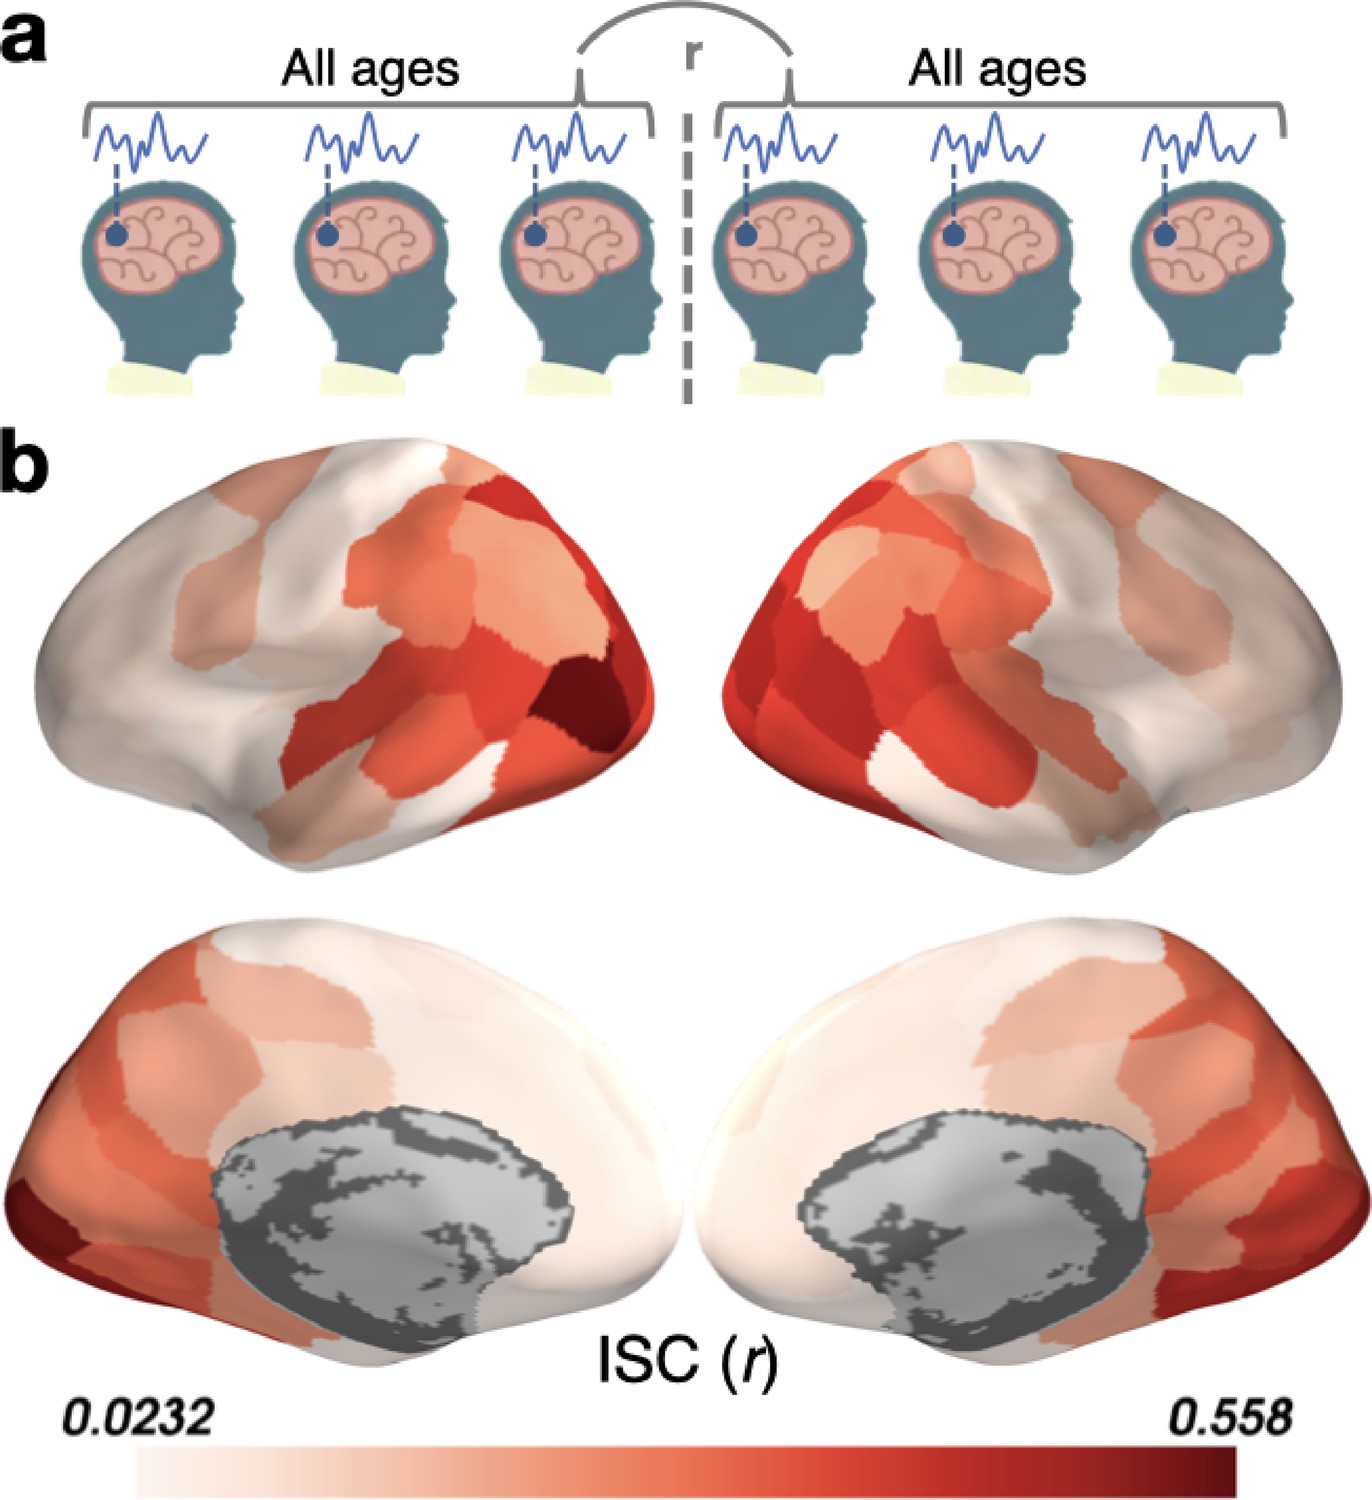
Inter-subject correlation (ISC) across a random mixture of the Youngest and Oldest subjects.
(a) Schematic illustration of the correlation for each parcel between subjects in the Youngest (5–8 years) and Oldest (16–19 years) groups. (b) ISC in parcels on the cortical surface.
Figure 1—figure supplement 2
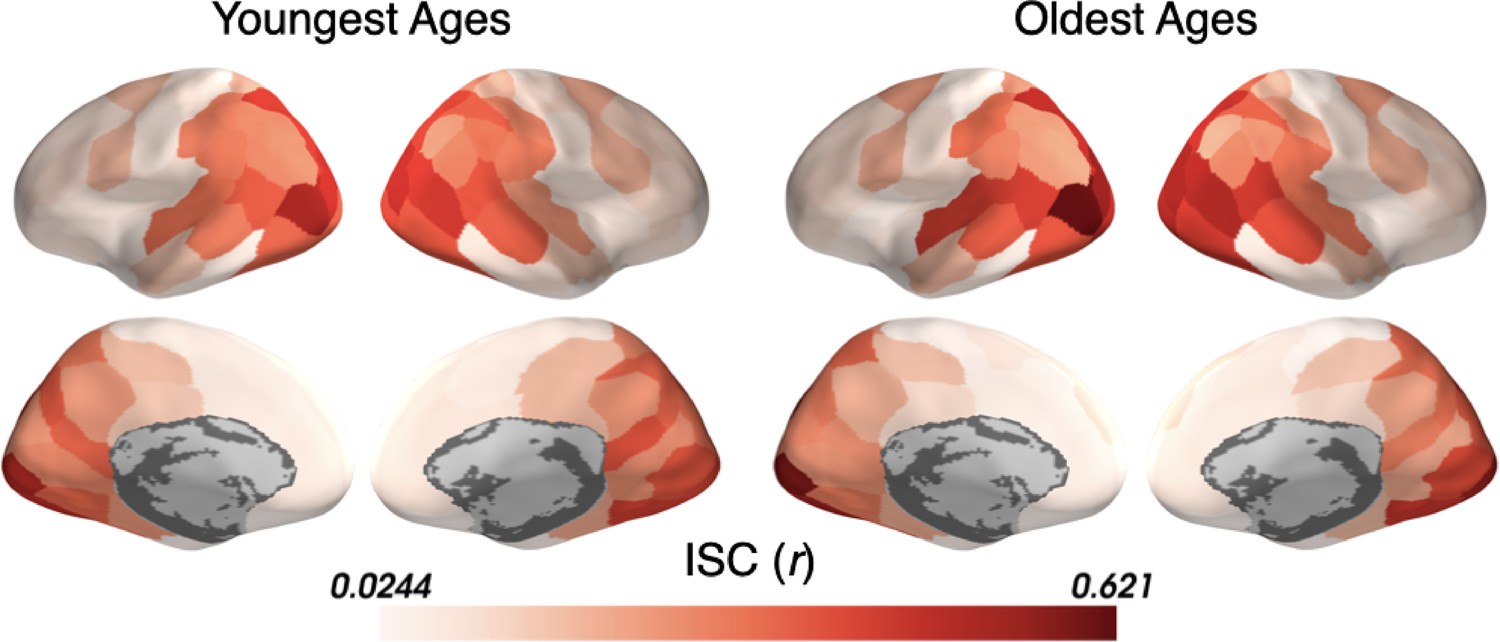
Inter-subject correlation (ISC) within the Youngest and Oldest subjects.
ISC is displayed separately in parcels across the cortical surface for subjects in the Youngest (5–8 years) and Oldest (16–19 years) groups. Both age groups show a similar pattern of ISC increasing from sensory to anterior regions.
Figure 1—figure supplement 3
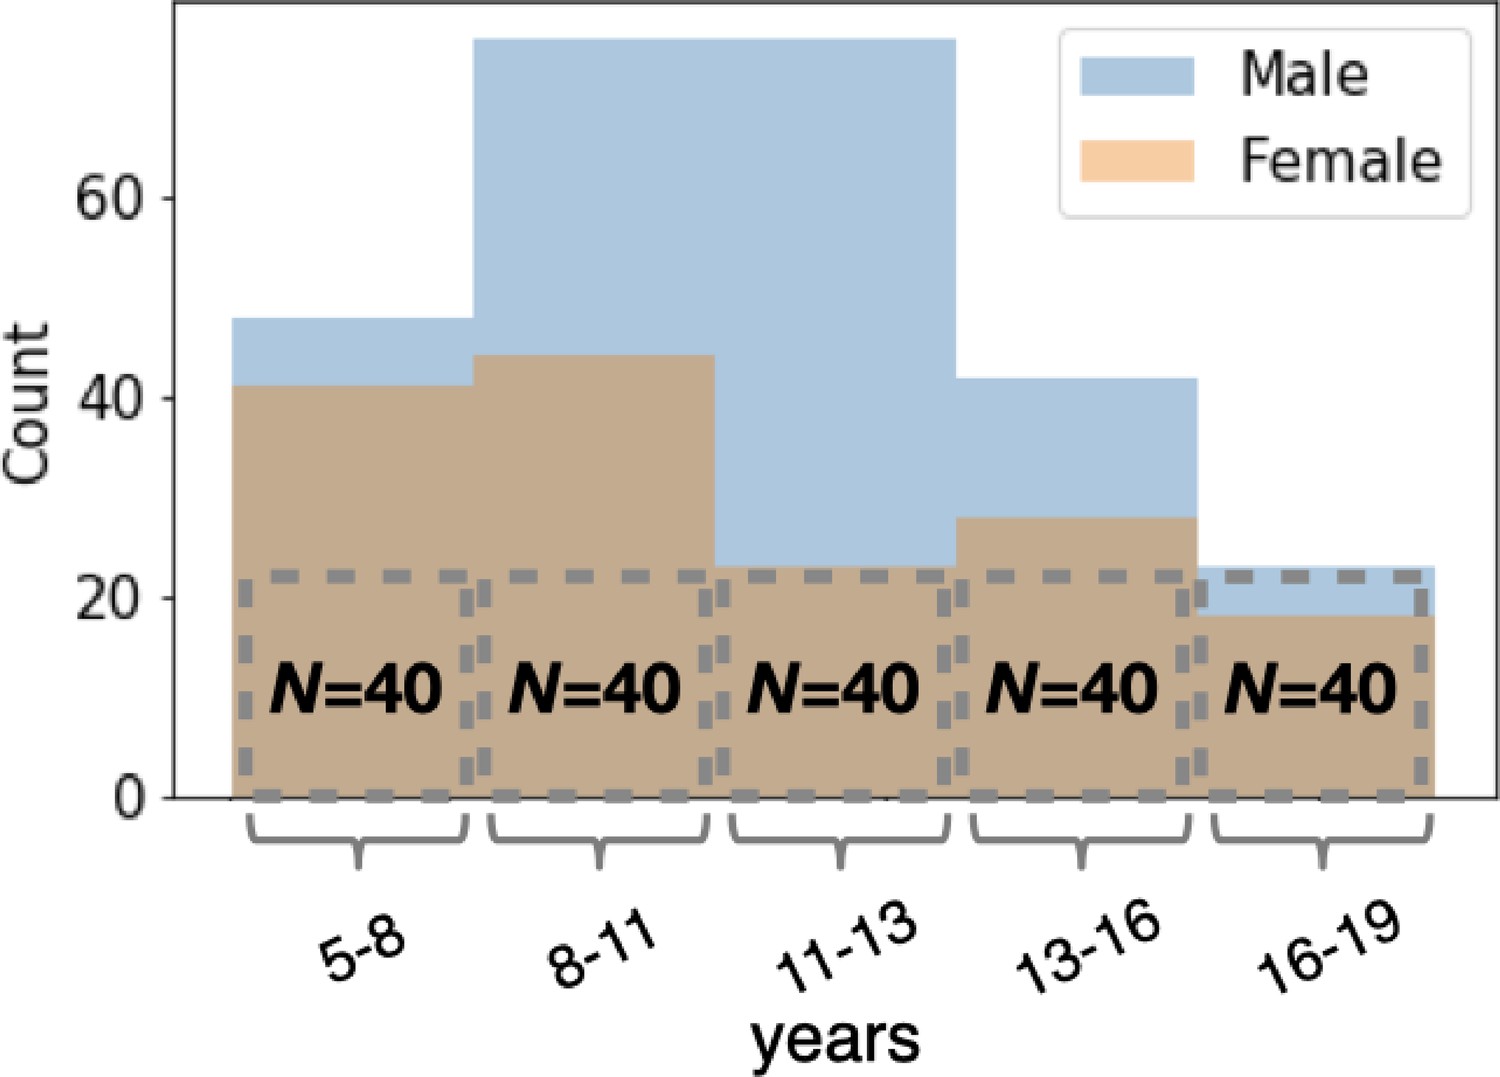
The demographic breakdown of the subject groups studied.
The “Oldest” age group (16–19 years) had only 40 subjects. All other age groups contained a sub-sample of 40 subjects whose gender distribution matched that of the Oldest group. The counts of male and female subjects are overlapping.
Figure 2
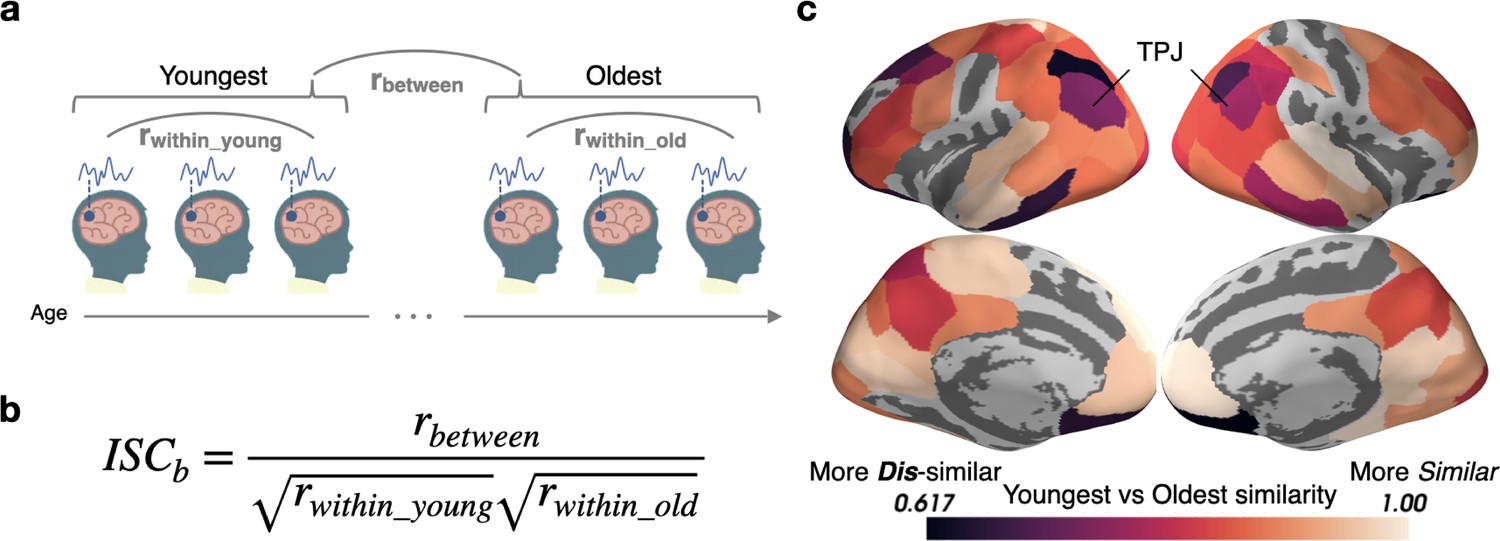
Stimulus processing differs in semantic and default mode regions between the Youngest and Oldest ages.
(a) Response timecourses were correlated within the Oldest and Youngest groups separately, and also correlated between groups. (b) For each parcel, between-group ISC (ISCb) is calculated by dividing the across-group correlation by the geometric mean of the within-group correlation. This allows us to identify regions in which the correlations between groups are smaller than we would expect based on the within-group similarities, reflecting differing mean responses across groups. (c) The Youngest and Oldest groups are most dissimilar (indicated by darker colors) in regions in the default mode network, such as the temporoparietal junction, and in regions responsible for semantic processing, such as the inferior temporal cortices, temporoparietal junction, and dorsolateral prefrontal cortex (parcels shown have ISCb values less than age-shuffled null permutations, thresholded at q<0.05).
Figure 3
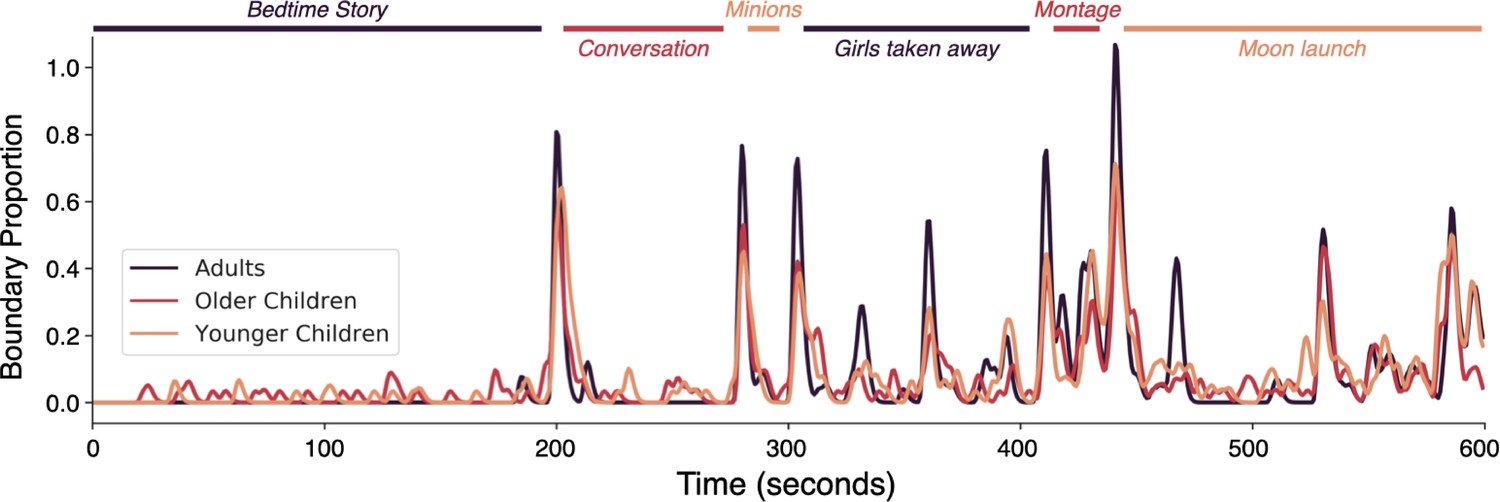
Event boundary alignment between children and adults.
The proportion of Adult, Older Children, and Younger Children raters who marked a boundary during the stimulus. Colored lines indicate the event durations and boundaries agreed upon by at least half of a group of independent adult raters (see Methods). Brief descriptions of each scene are written in italics.
Figure 4
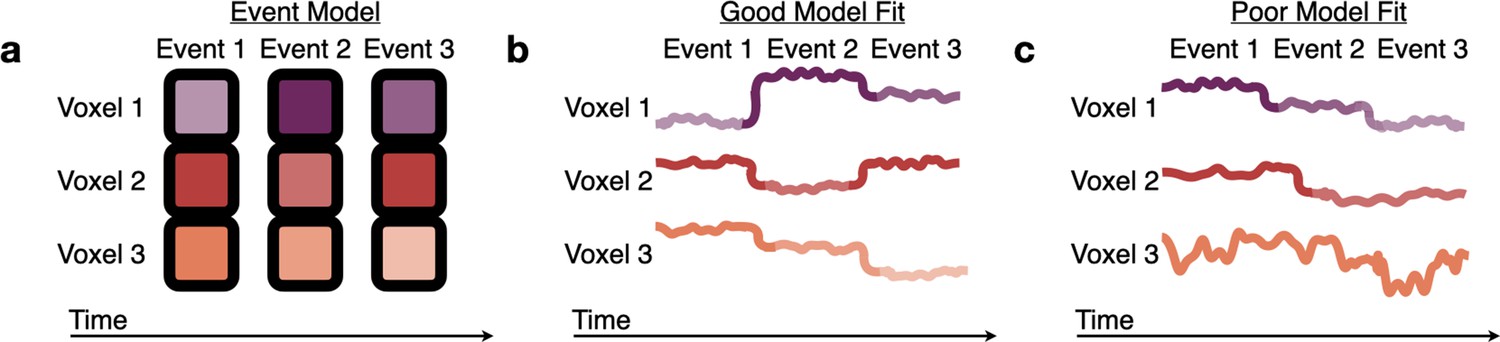
Measuring fits to the HMM event model.
(a) The Hidden Markov Model (HMM) assumes that brain activity in response to a movie should proceed through a specific sequence of stable event patterns, each with a specific pattern of high and low activities across voxels (represented here as the saturation of each color). (b) The model is a good fit to brain responses that exhibit patterns consistent with the model assumptions, sequentially transitioning between the HMM event patterns with little variability during events. (c) A poor model fit indicates that this event model does not capture a brain region’s dynamics, because the order of the relative activity levels does not match the model’s sequence of event patterns (Voxel 1), the event transitions do not align between voxels (Voxel 2), or there is high within-event variability (across time or across subjects) (Voxel 3).
Figure 5 with 3 supplements
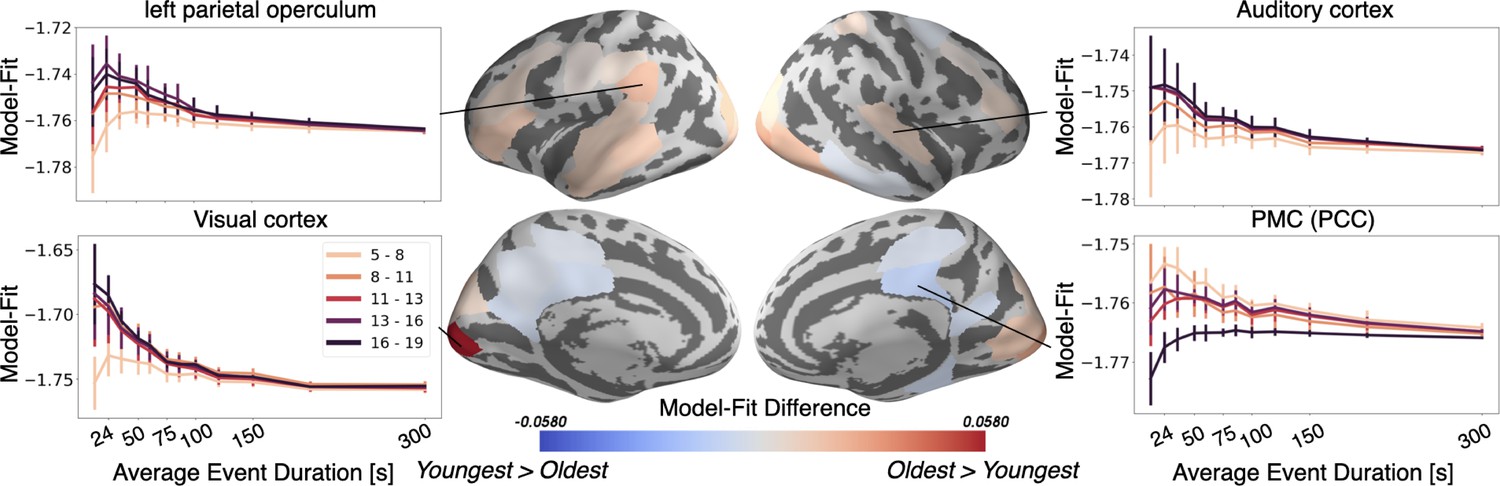
The Oldest group has better event models in regions including visual cortex and auditory cortex, whereas the Youngest group has a better model-fit in PMC.
Regions with a significant model-fit difference between the youngest and oldest age group (at the optimal timescale for that region) are plotted on the cortical surface. Redder shades indicate that the event model fits improve with age, and bluer shades indicate that they weaken with age. The model fits for event models with different event durations are shown across all age groups and event durations in four example regions, selected post hoc for illustration. Error bars represent the standard deviation of model fit in the held out subjects, averaged across five cross-validated folds.
Figure 5—figure supplement 1
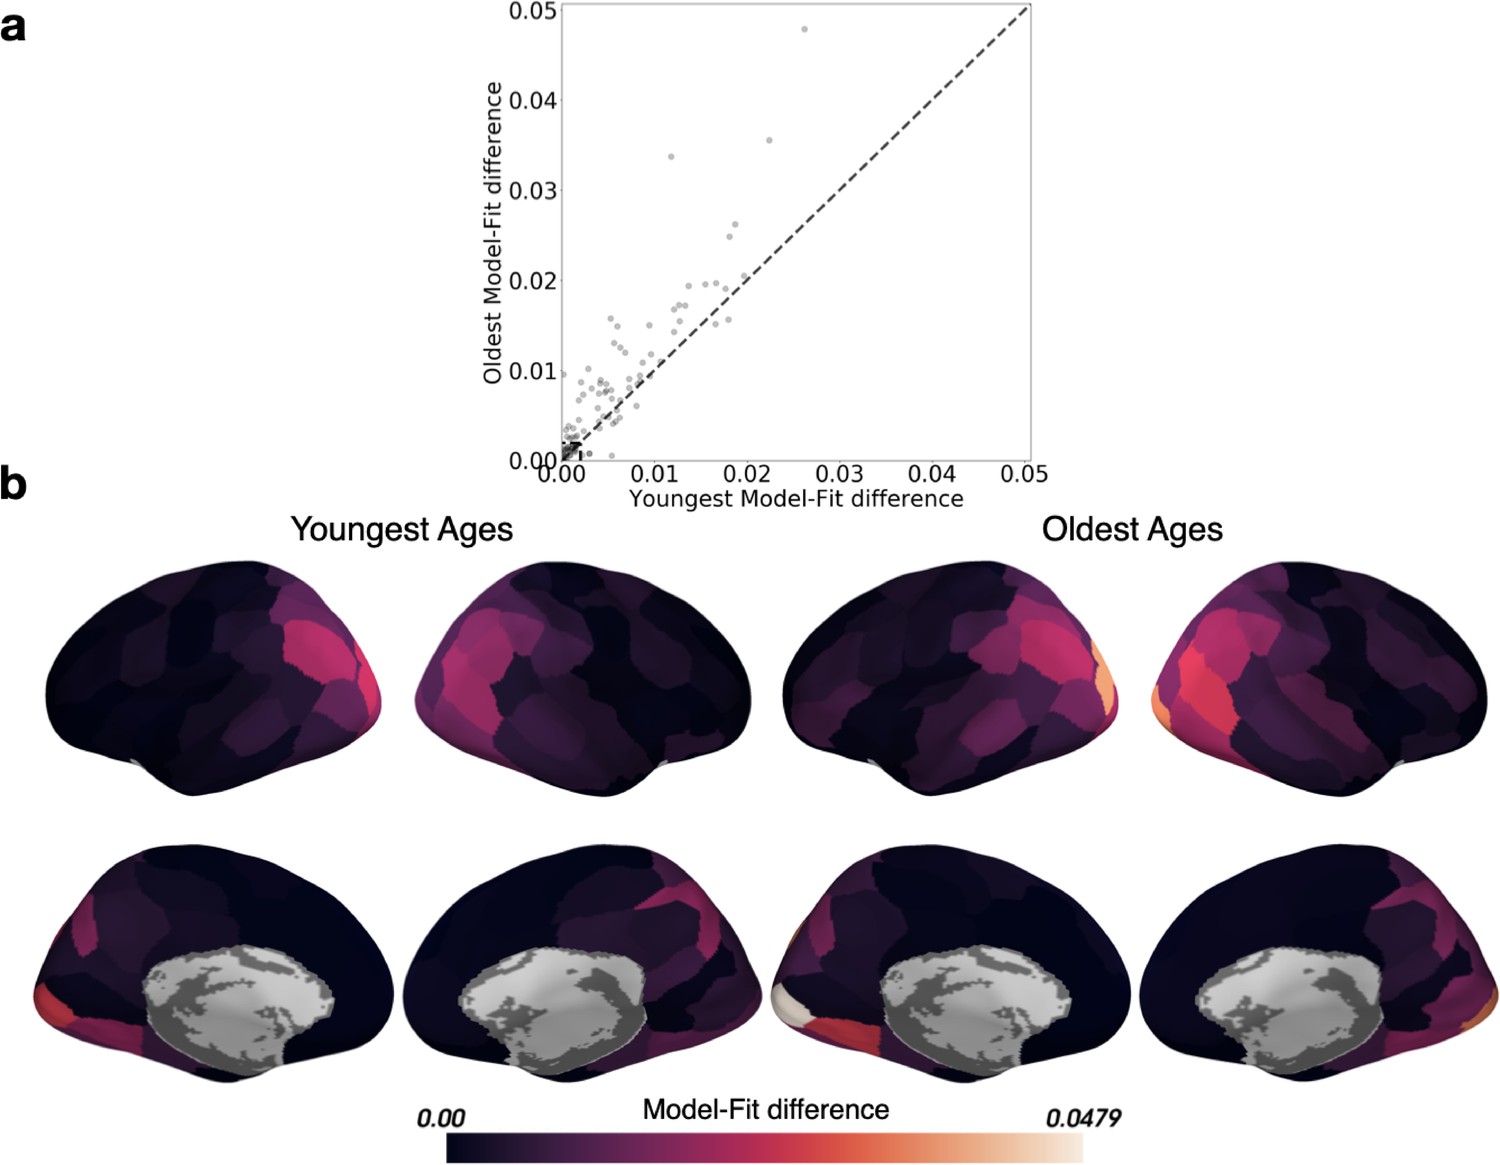
Comparing the model-fit difference for all parcels between the Youngest and Oldest ages.
The model-fit difference is the difference in log-likelihood between the HMM for two events (expected to fit poorly), and the HMM with maximal model-fit (the best fitting number of events). (a) Parcels within the box in the lower left-hand corner of the scatter plot did not capture event structure in either age group (model fit differences smaller than 0.002), and were therefore excluded from the HMM-based analyses. (b) The model-fit difference is displayed in cortical parcels for both the Youngest and Oldest ages.
Figure 5—figure supplement 2
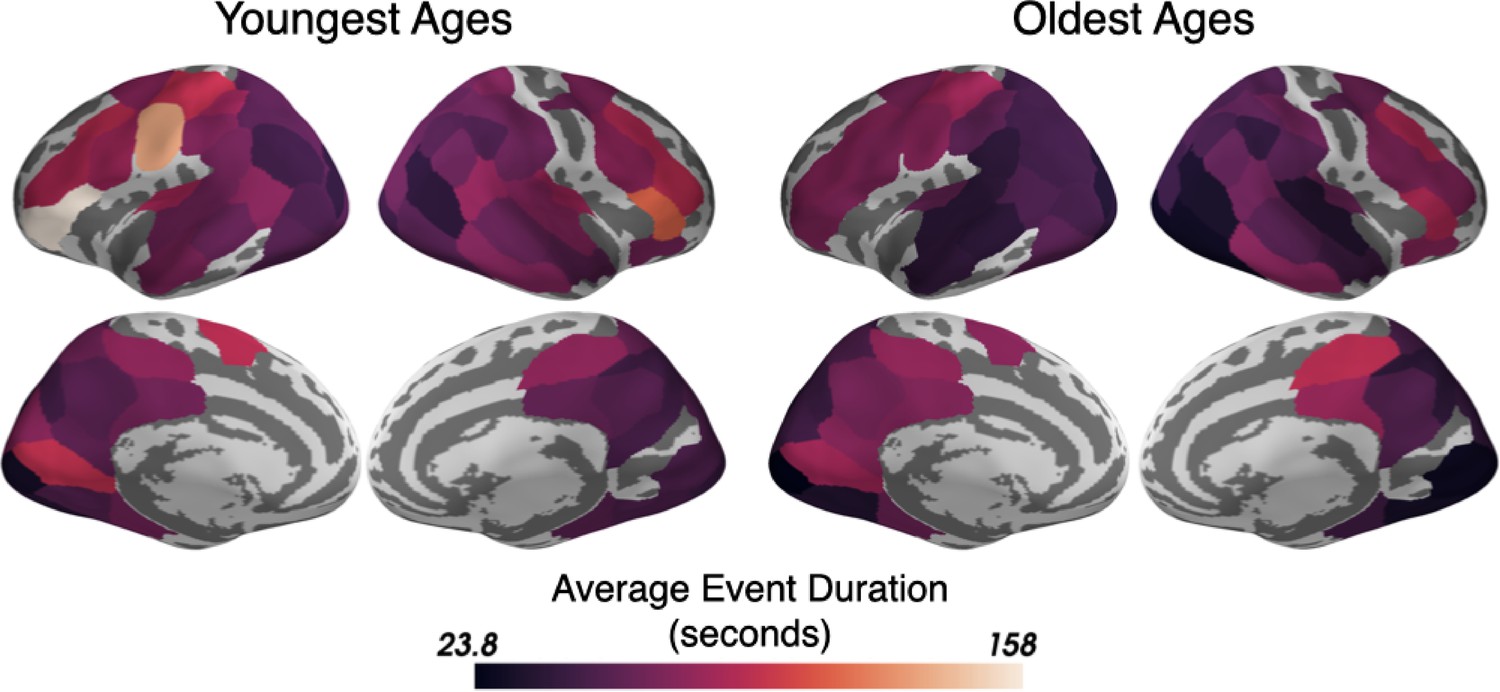
The best-fitting average duration of events for the optimal HMMs trained and tested on either the Youngest or the Oldest ages.
The average event duration increases from sensory to association parcels for both age groups and the average event durations are highly correlated between the groups (r=0.78, RMS difference between groups = 12.3 seconds). Only parcels that had good model-fits in at least one age group (see Figure 1—figure supplement 2) are shown.
Figure 5—figure supplement 3
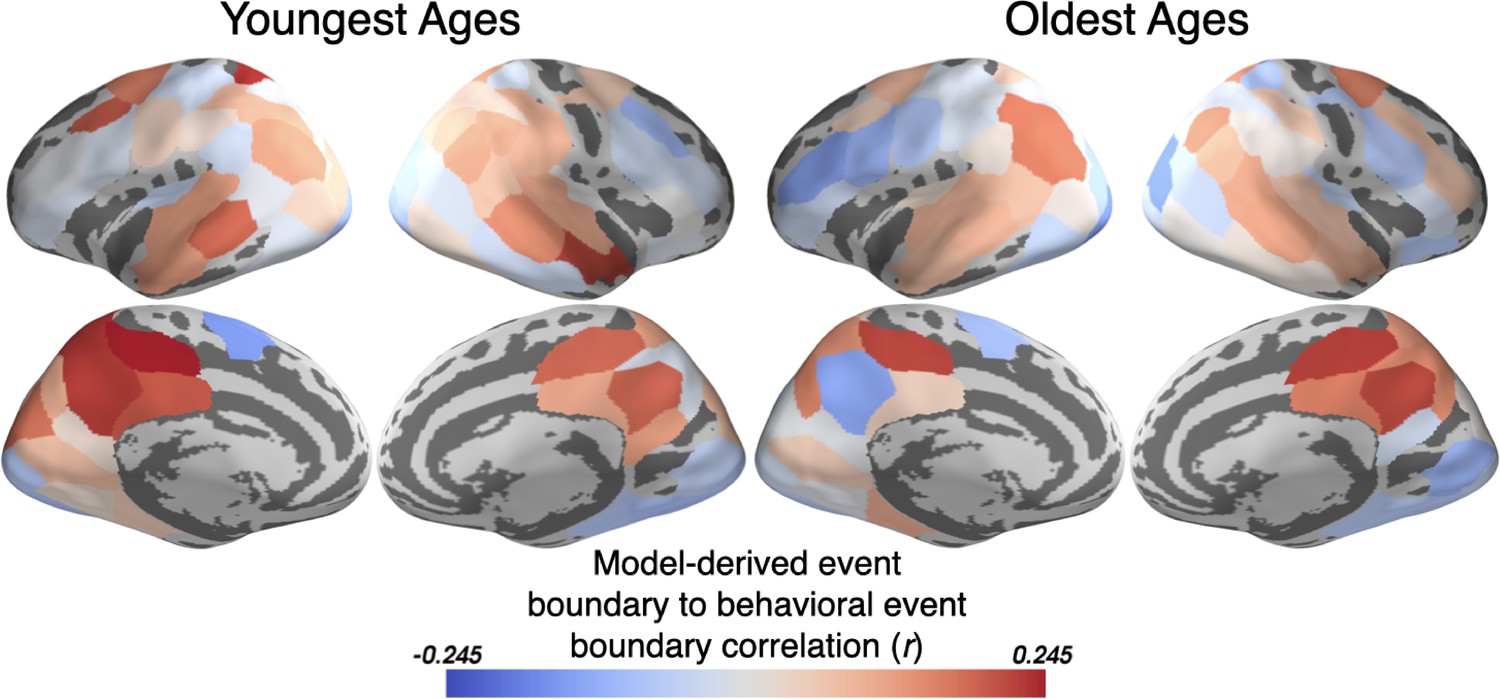
The HMM-derived event boundaries correlate with behaviorally estimated event boundaries from children.
The event boundaries determined by the HMM jointly-fit to both the Youngest and Oldest groups correspond to behaviorally estimated event boundaries in association regions such as PMC, TPJ, and precuneus. All parcels for which a jointly fit HMM was modeled are displayed.
Figure 6
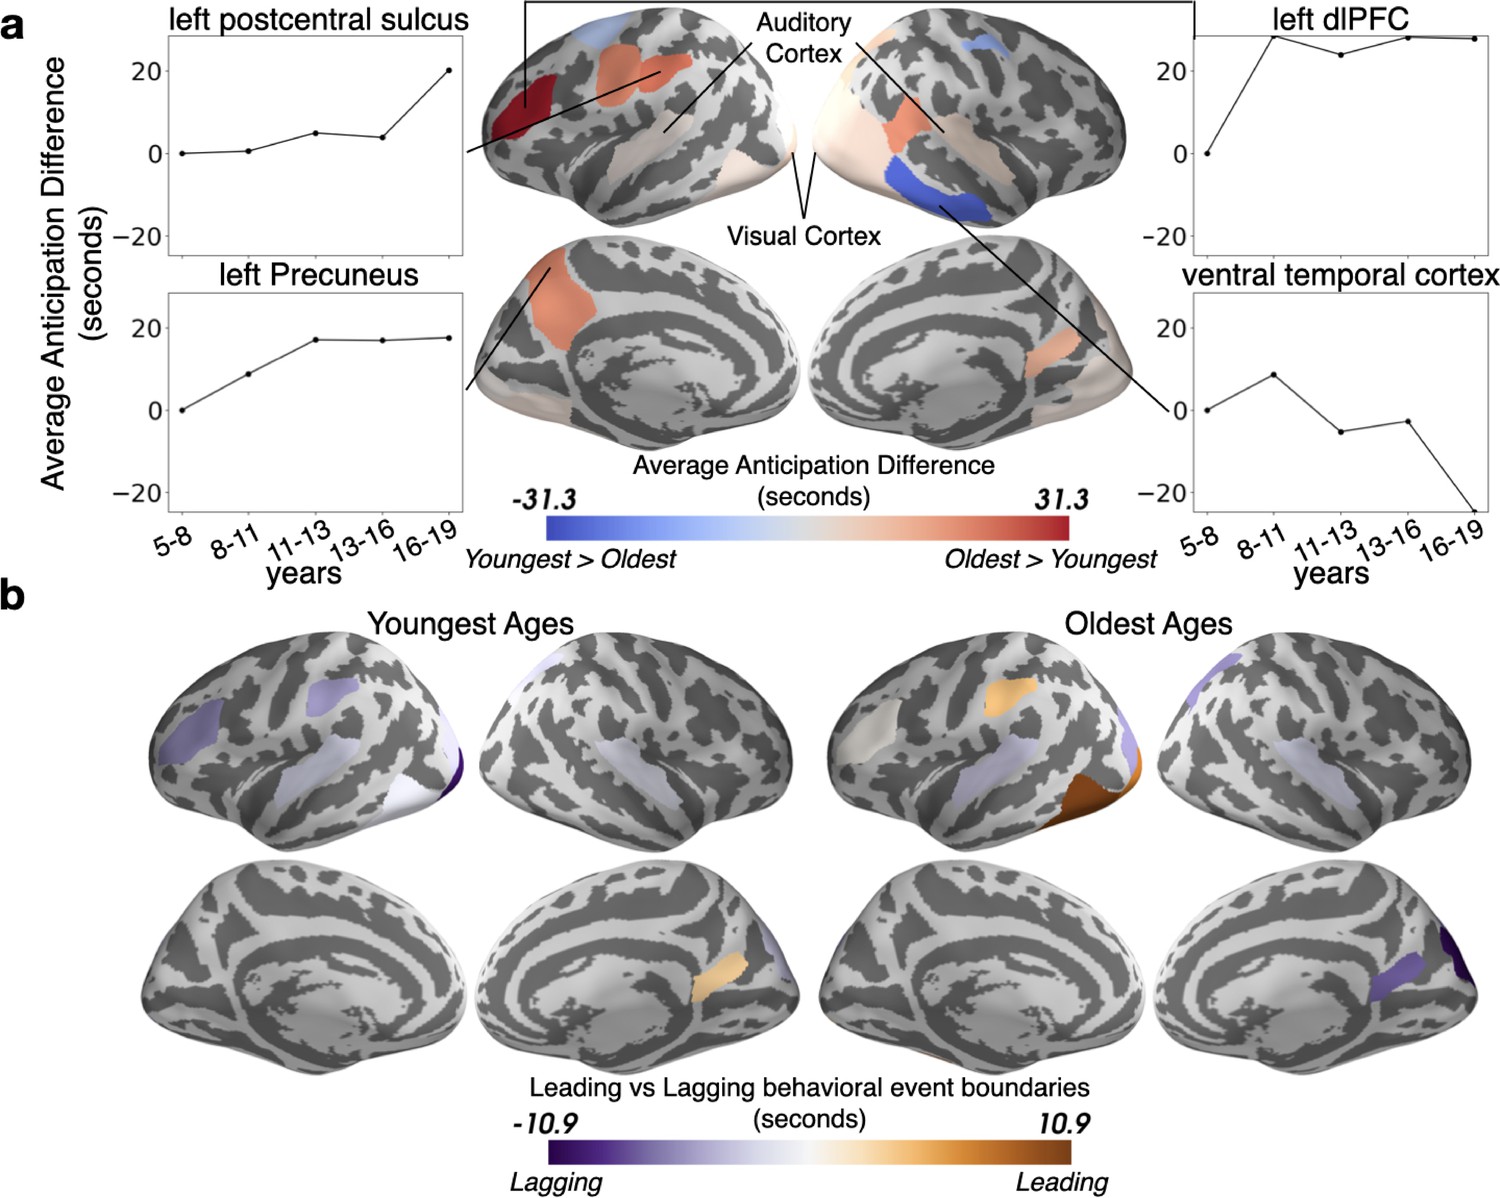
The timing of event boundaries shifts with age.
(a) The Oldest group represents upcoming events before the Youngest group in auditory and visual cortex, as well as left lateralized associative regions including the left precuneus and left dorsolateral prefrontal cortex (reddish hues). The Youngest group anticipates events sooner in the right ventral temporal cortex (bluish hues). Highlighted parcels showing age anticipation trajectories were selected post hoc for illustration. (b) The event boundaries in the brains of the Oldest group generally lead behaviorally-derived event boundaries, whereas the transitions in the brains of the Youngest group generally lag behind behavior. In both (a) and (b), the parcels shown have differences greater than age shuffled permutations (q<0.05).
Figure 7
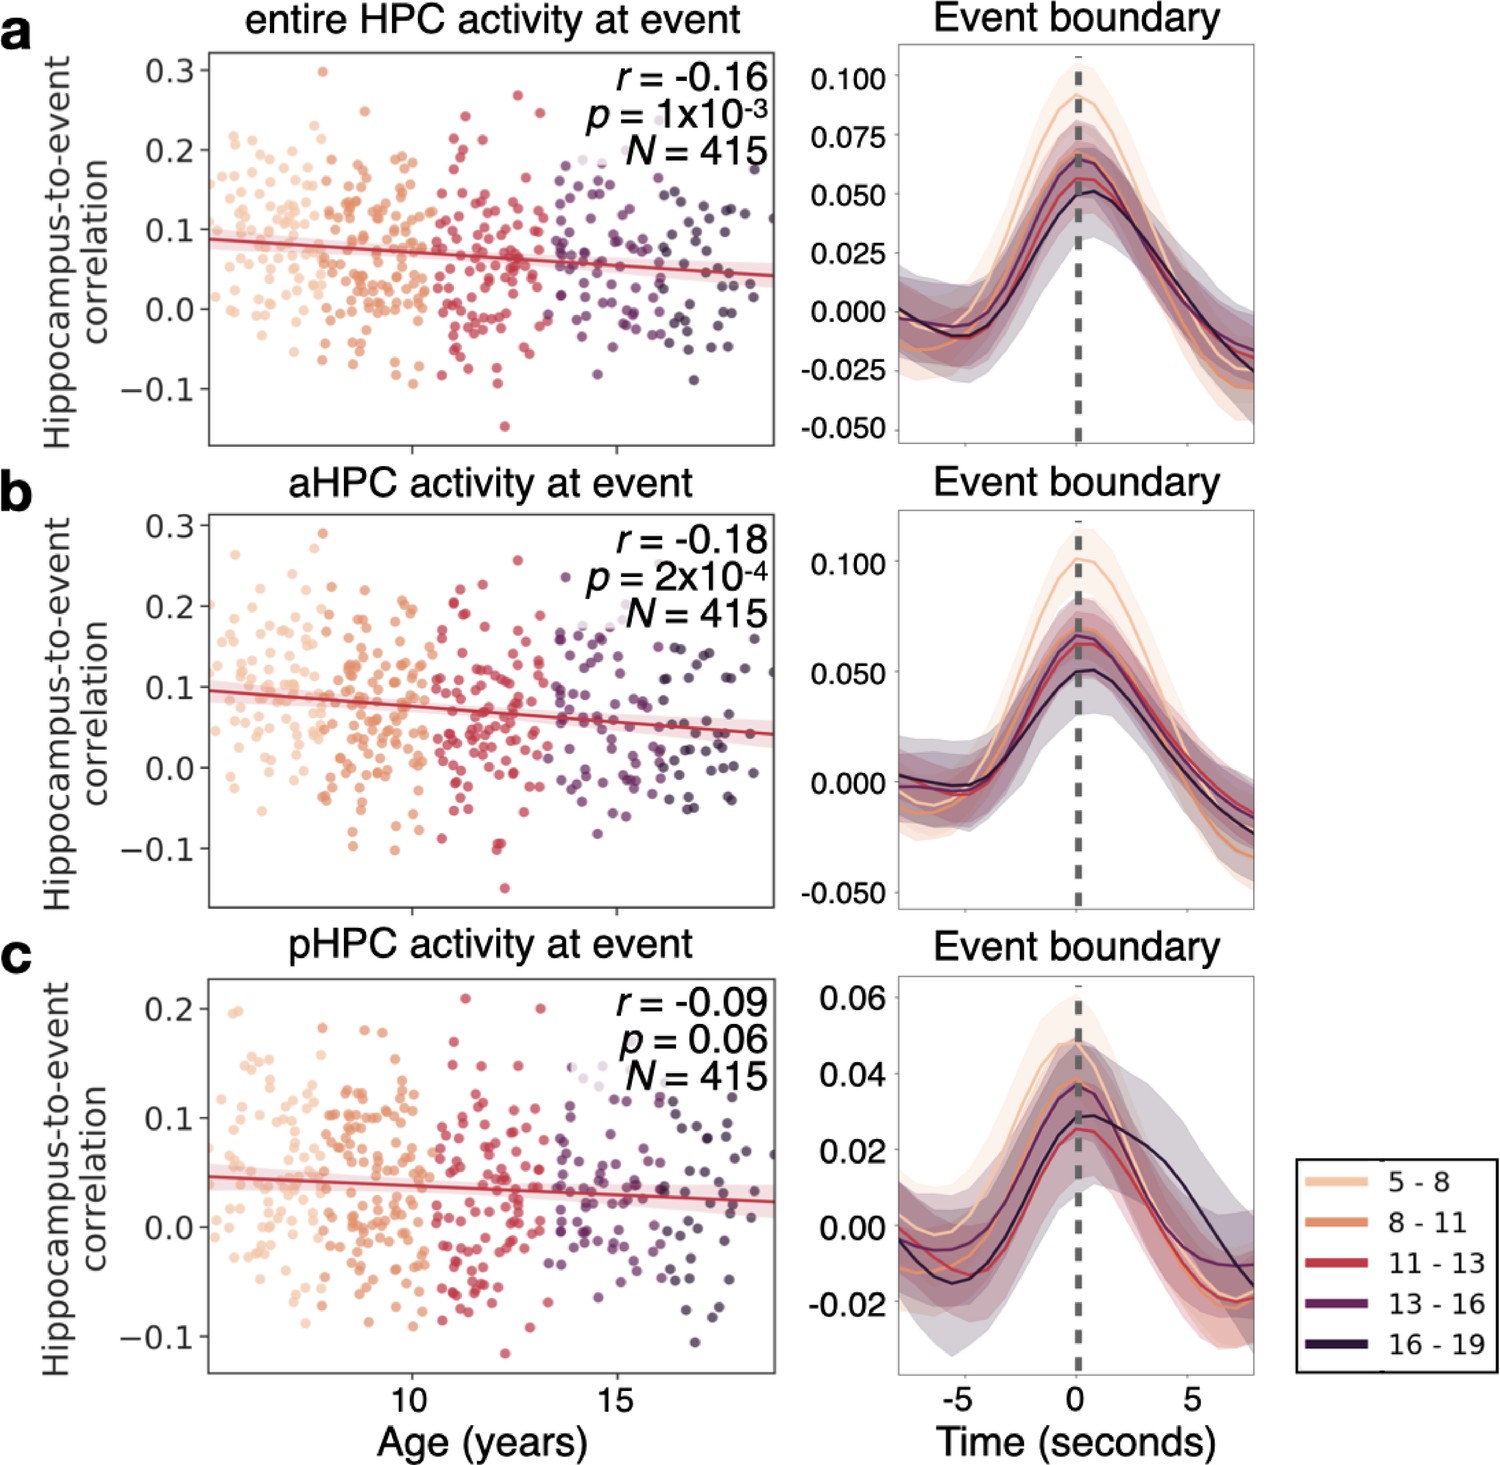
The hippocampus in children as young as 5 responds to event boundaries, an effect that decreases with age.
(a) The event-boundary driven response decreases as a function of age in the hippocampus (HPC). This can be shown across individuals at the time point where hippocampus-to-event correlation is maximal (left), and throughout the time-course of the HPC’s correlation with event boundaries. (b) The correlation between the HPC and event boundaries significantly decreases with age in the anterior HPC (aHPC), but in (c) posterior HPC (pHPC) there is no significant relationship between the boundary-driven signal and age. The shaded region surrounding each line represents the 95% confidence interval across all 415 subjects.
Author response image 1
Additional files
Download links
A two-part list of links to download the article, or parts of the article, in various formats.
Downloads (link to download the article as PDF)
Open citations (links to open the citations from this article in various online reference manager services)
Cite this article (links to download the citations from this article in formats compatible with various reference manager tools)
Developmental changes in story-evoked responses in the neocortex and hippocampus
eLife 11:e69430.
https://doi.org/10.7554/eLife.69430


