Epigenetic reprogramming by TET enzymes impacts co-transcriptional R-loops
- Instituto de Medicina Molecular João Lobo Antunes, Faculdade de Medicina, Universidade de Lisboa, Portugal
- Associate laboratory i4HB – Institute for Health and Bioeconomy, NOVA School of Science and Technology, Universidade Nova de Lisboa, Portugal
- UCIBIO-REQUIMTE, Applied Molecular Biosciences Unit, Department of Life Sciences, NOVA School of Science and Technology, Universidade Nova de Lisboa, Portugal
Figures
Figure 1 with 2 supplements
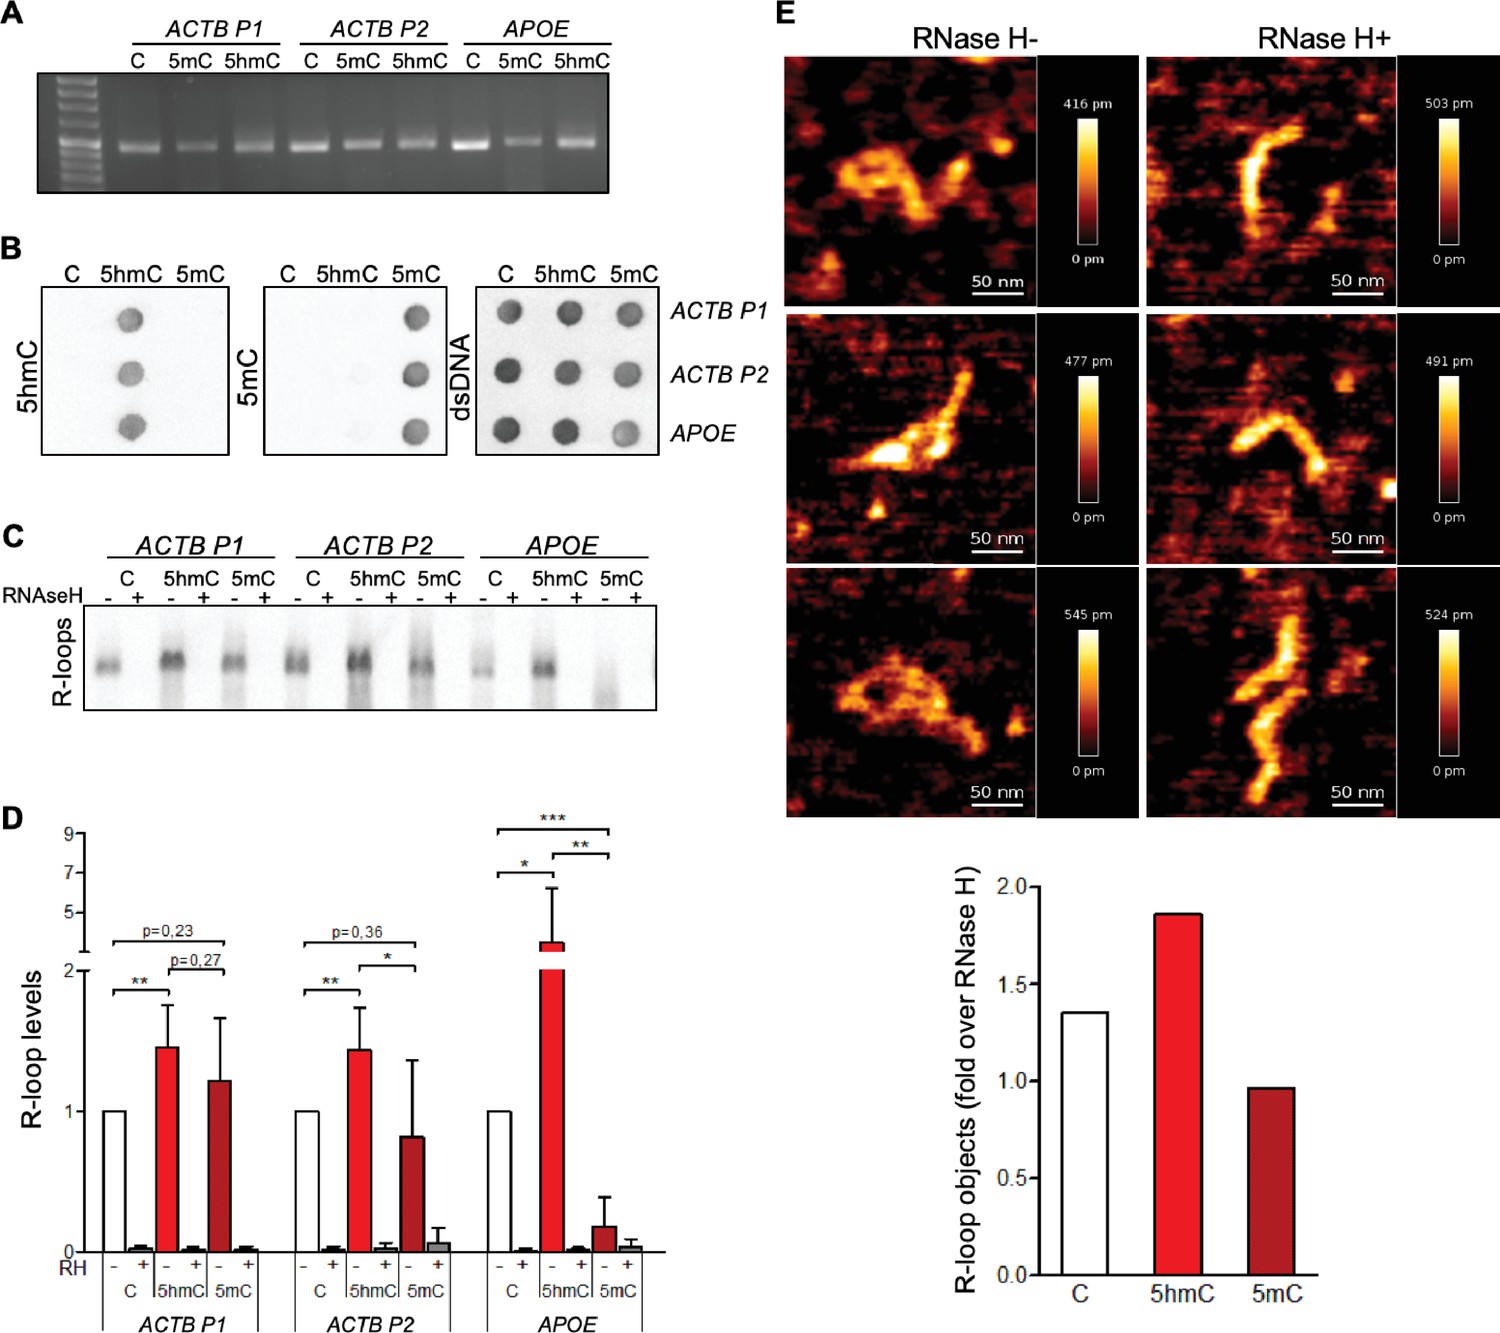
5-Hydroxymethylcytosine (5hmC) favors co-transcriptional R-loop formation.
(A) Native or modified deoxyribonucleotides (dCTPs) were incorporated upon PCR amplification into DNA fragments with sequences from the transcription termination region of ACTB (ACTB P1 and ACTB P2) or APOE. (B) Incorporation of dCTP variants confirmed by immunoblotting using specific antibodies against 5-methylcytosine (5mC), 5hmC, and double-stranded DNA (dsDNA). (C) R-loops formed upon in vitro transcription reactions were detected by immunoblotting using the S9.6 antibody. RNase H-treated in vitro transcription reaction products (RH+) serve as negative controls. All data are representative of seven independent experiments with similar results. (D) S9.6 immunoblots were quantified and the R-loop levels normalized against the levels detected in the reaction products of DNA templates containing native C. Data represent the mean and standard deviation (SD) from seven independent experiments. *p<0.05, **p<0.01, and ***p<0.001, two-tailed Student’s t-test. (E) In vitro transcription reaction products of ACTB P2 templates were visualized using atomic force microscopy (AFM). R-loop structures obtained from 5hmC-containing ACTB P2 transcription in the absence (RH-) or presence (RH+) of RNase H are shown. R-loops present in the transcription reaction products of C, 5mC, or 5hmC-containing ACTB P2 templates were counted in a minimum of 80 filaments observed in three individual AFM experiments.
Figure 1—figure supplement 1
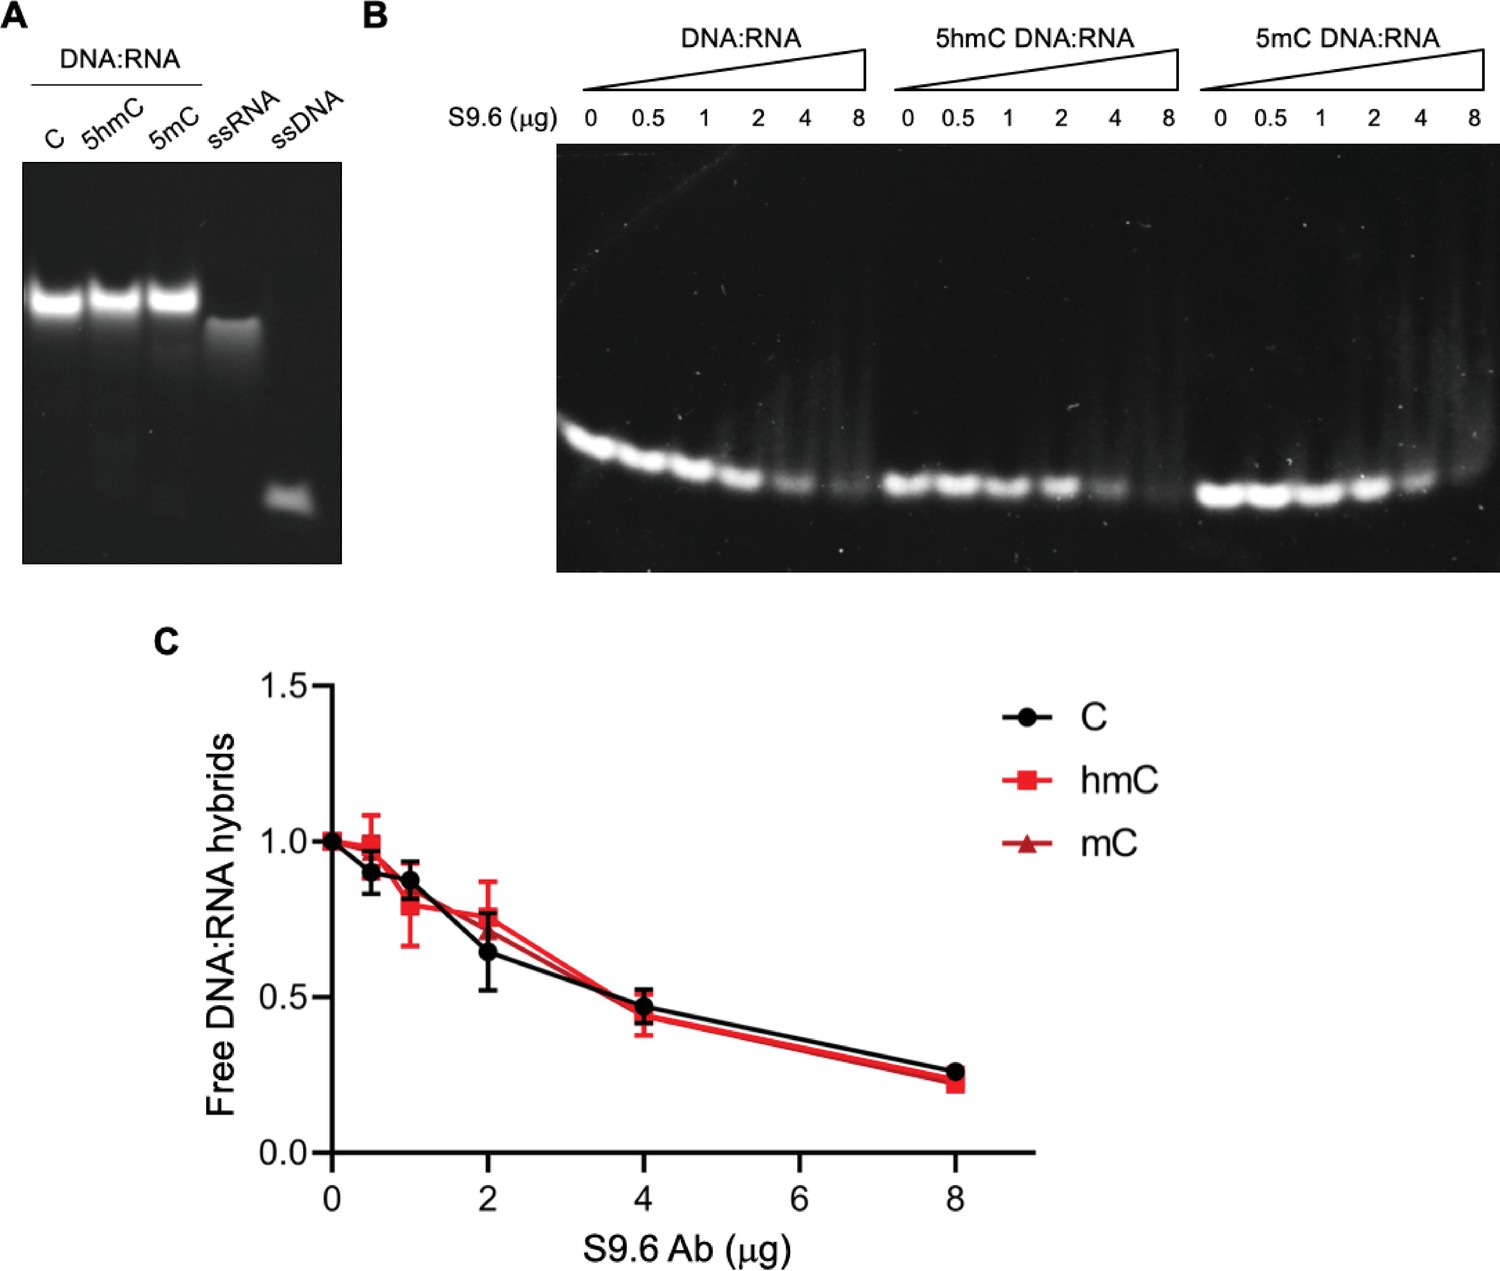
Cytosine modifications do not affect the detection of DNA:RNA hybrids by the S9.6 Ab.
(A) DNA:RNA hybrids formed through annealing of C, 5-hydroxymethylcytosine (5hmC), or 5-methylcytosine (5mC)-containing ssDNA with the complementary ssRNA. Data are representative of three independent experiments. (B) Electrophoretic mobility shift assay (EMSA) of DNA:RNA hybrids incubated with increasing amounts of the S9.6 Ab in a native polyacrylamide gel. Data are representative of three independent experiments. (C) Quantification of free DNA:RNA hybrids. The graph shows means and SD from three independent experiments.
Figure 1—figure supplement 2
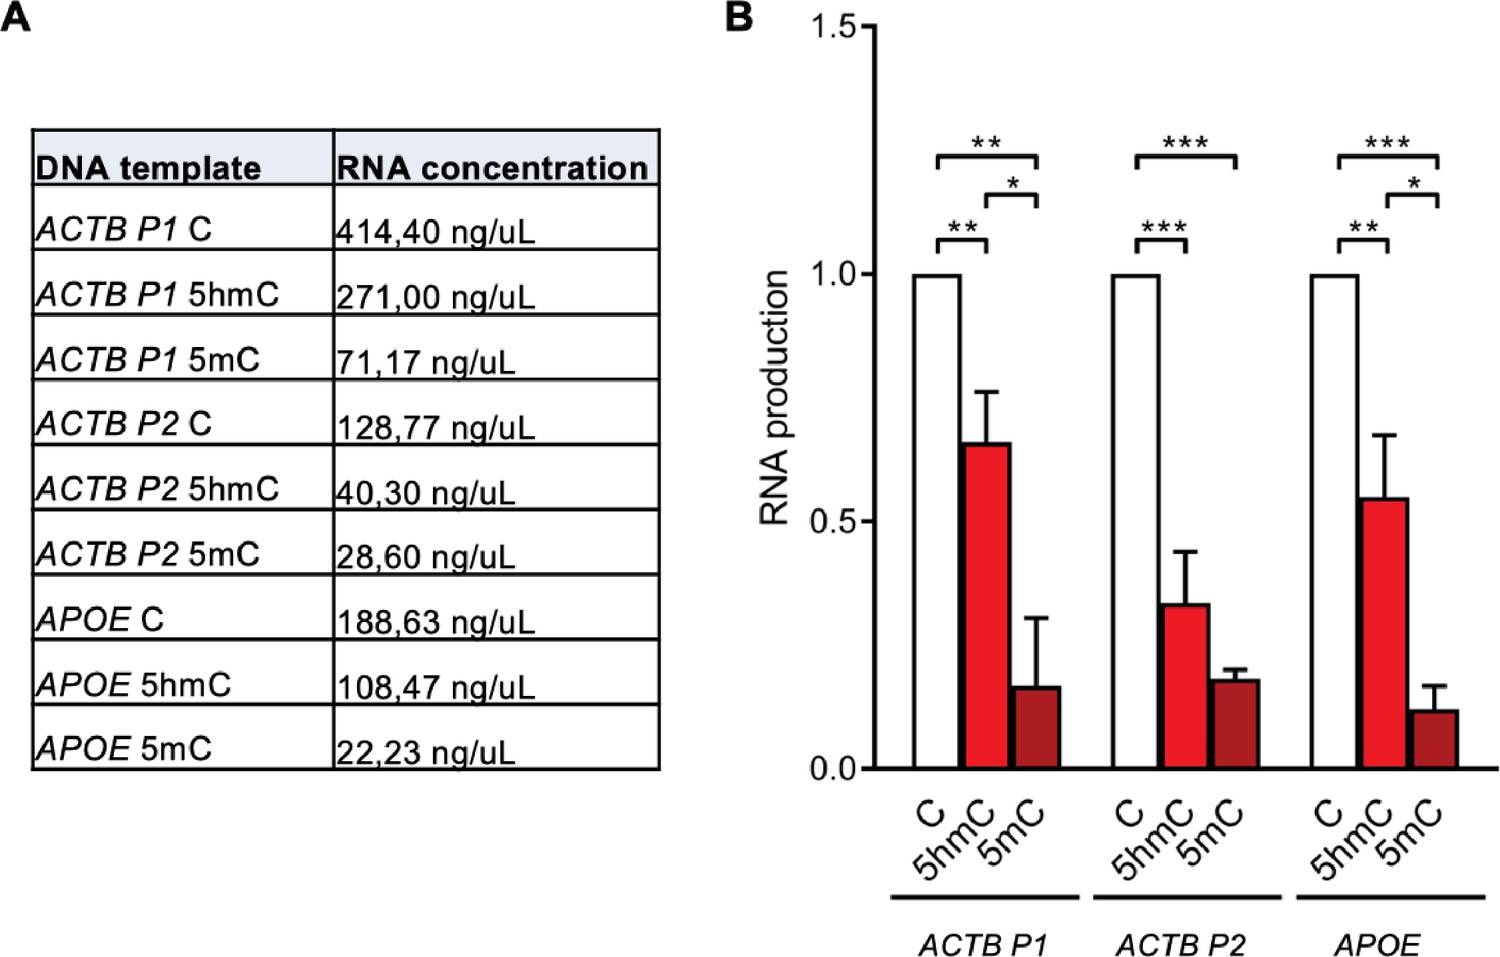
In vitro transcription levels of different DNA templates.
(A) RNA concentration obtained from in vitro transcription of DNA templates containing C, 5-hydroxymethylcytosine (5hmC), or 5-methylcytosine (5mC). Data shown are the mean from three independent experiments. (B) Mean and SD of the RNA levels obtained in each reaction normalized to reactions using DNA templates with native cytosines. Data are from three independent experiments.
Figure 2 with 2 supplements
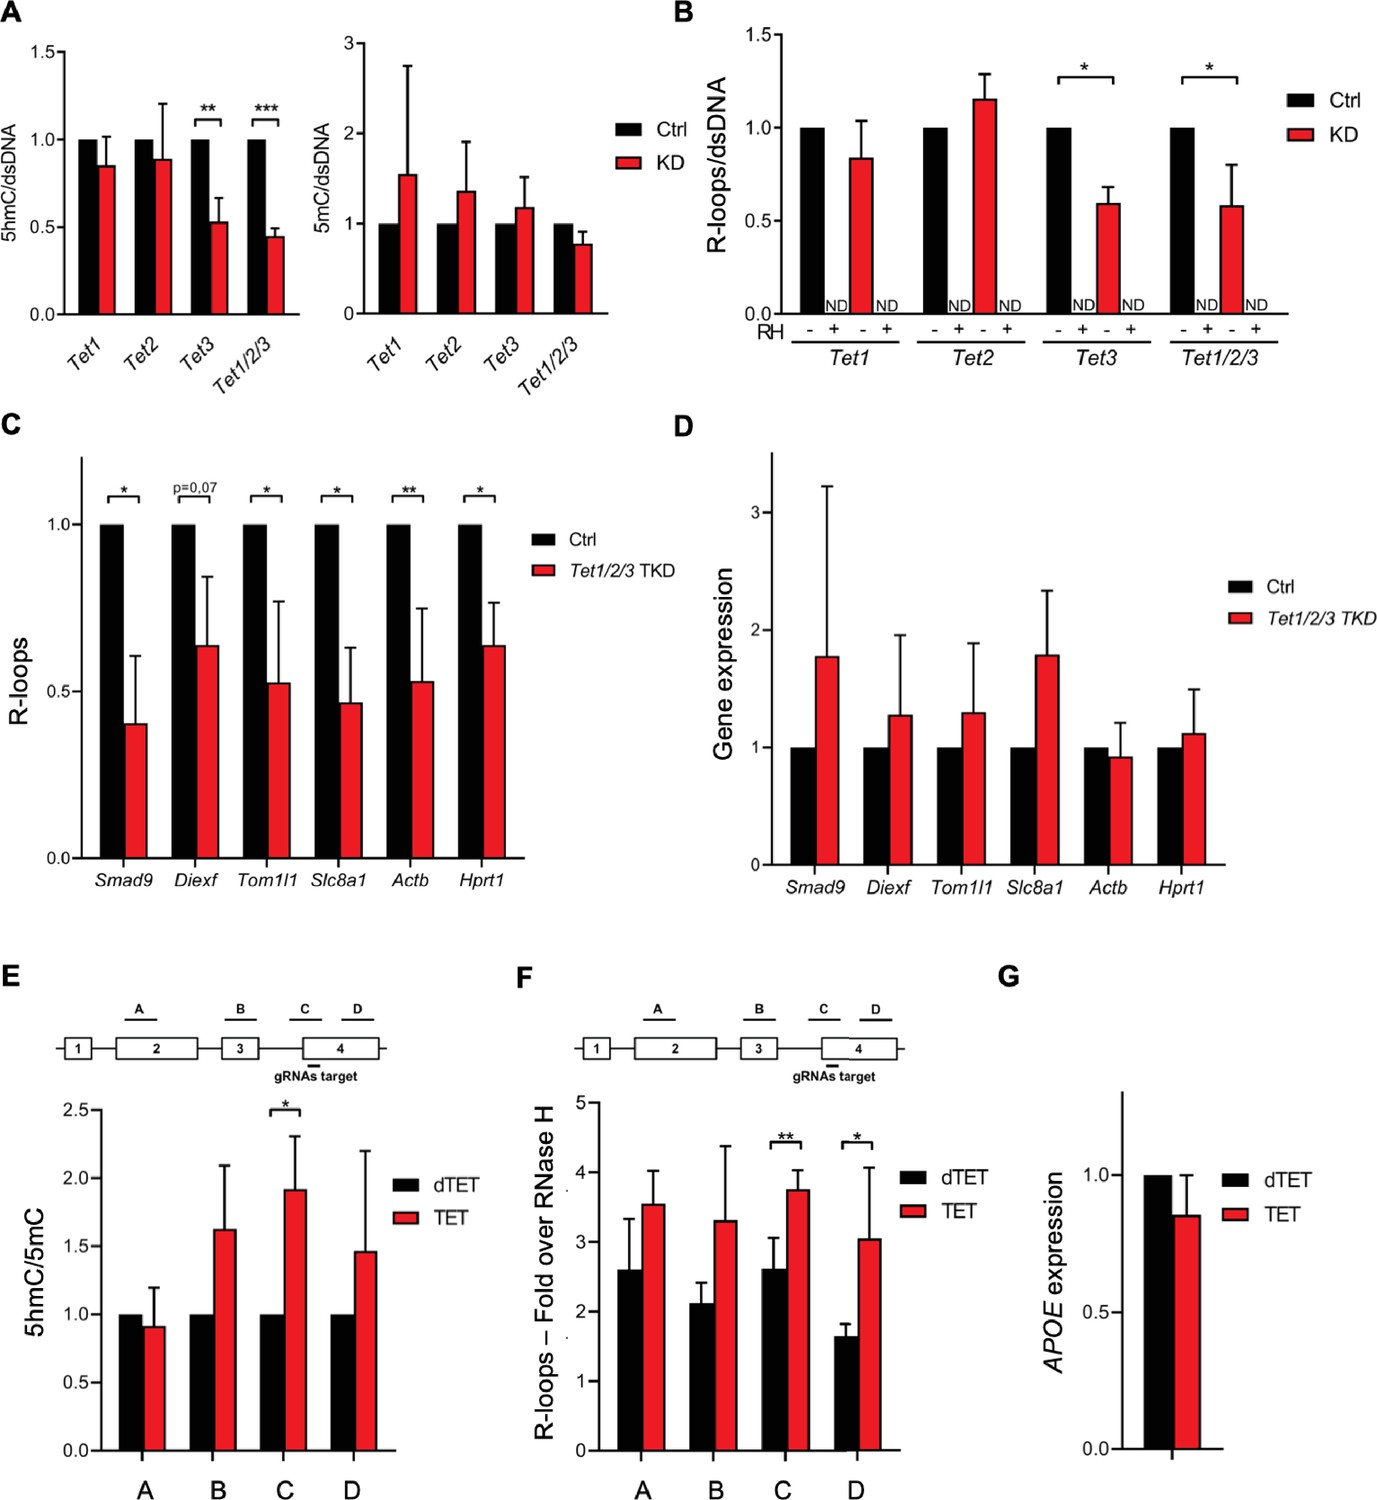
Ten-eleven translocation (TET) enzymatic activity impacts R-loop levels.
Quantification of 5-hydroxymethylcytosine (5hmC) and 5-methylcytosine (5mC) (A) and R-loops (B) dot blots of Tet1, Tet2, Tet3 single KD, and of Tet1/2/3 triple KD mouse embryonic stem (mES) cells. Dot blots are shown in Figure 2—figure supplement 1B. Data were normalized against dsDNA levels. *p<0.05, **p<0.01, ***p<0.001, two-tailed Student’s t-test. ND, not detected. (C) R-loop levels assessed by DNA:RNA immunoprecipitation (DRIP) in Tet1/2/3 triple KD mES cells. Data were normalized against RNase H-treated samples. *p<0.05, **p<0.01, two-tailed Student’s t-test. (D) Transcription levels of the genes presented in (C) assessed by RT-qPCR. 5hmC/5mC (E) and R-loop (F) levels determined by (h)MeDIP or DRIP at four regions of the APOE gene upon tethering of dCas9-TET1 or dCas9-dTET1 to the last exon of APOE in U-2 OS cells. R-loop data were normalized against RNase H-treated samples. *p<0.05, **p<0.01, two-tailed Student’s t-test. (G) APOE transcription levels upon targeting dCas9-TET1 or dCas9-dTET1 to the last exon of the gene in U-2 OS cells. Data shown are the mean and SD from at least three independent experiments.
Figure 2—figure supplement 1
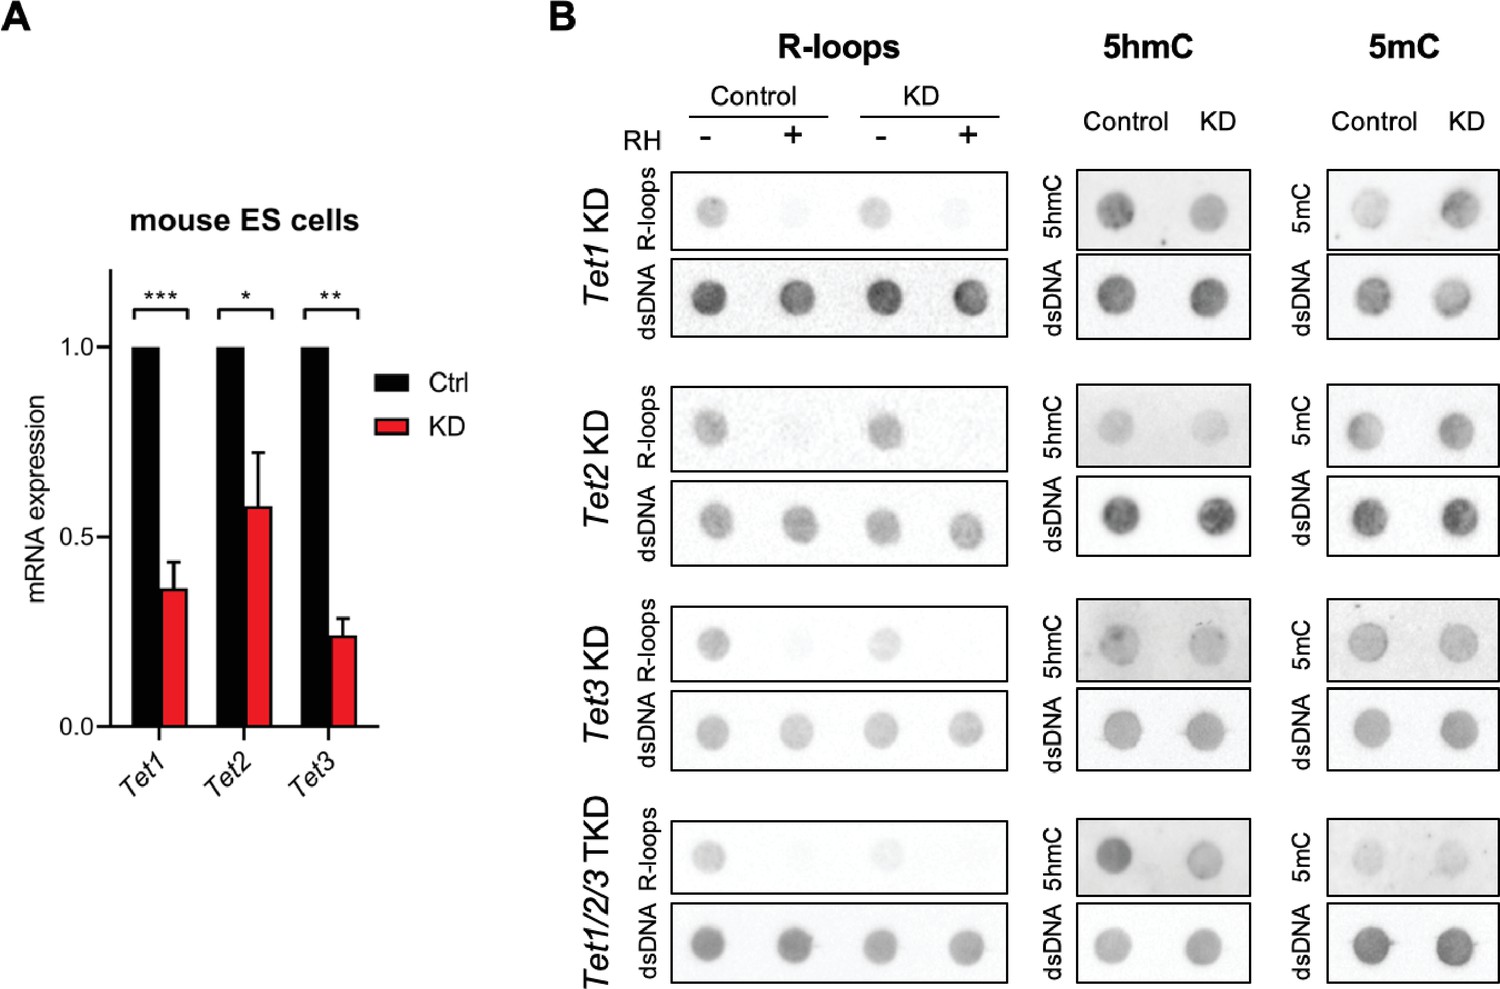
Impact of Tet depletion in mouse embryonic stem (mES) cells in R-loops, 5-hydroxymethylcytosine (5hmC), and 5-methylcytosine (5mC).
(A) Tet1, Tet2, and Tet3 mRNA expression levels in mES cells 48 hr after RNAi depletion of Tet1, Tet2, or Tet3. *p<0.05, **p<0.01, ***p<0.001, two-tailed Student’s t-test. Graph shows the mean and SD from three independent experiments. (B) Dot blot of R-loops, 5hmC, and 5mC in Tet1, Tet2, and Tet3 single KD and in Tet1/2/3 triple KD mES cell extracts. dsDNA was detected after stripping and reprobing of the same membranes. Data are representative of a minimum of three independent experiments.
Figure 2—figure supplement 2
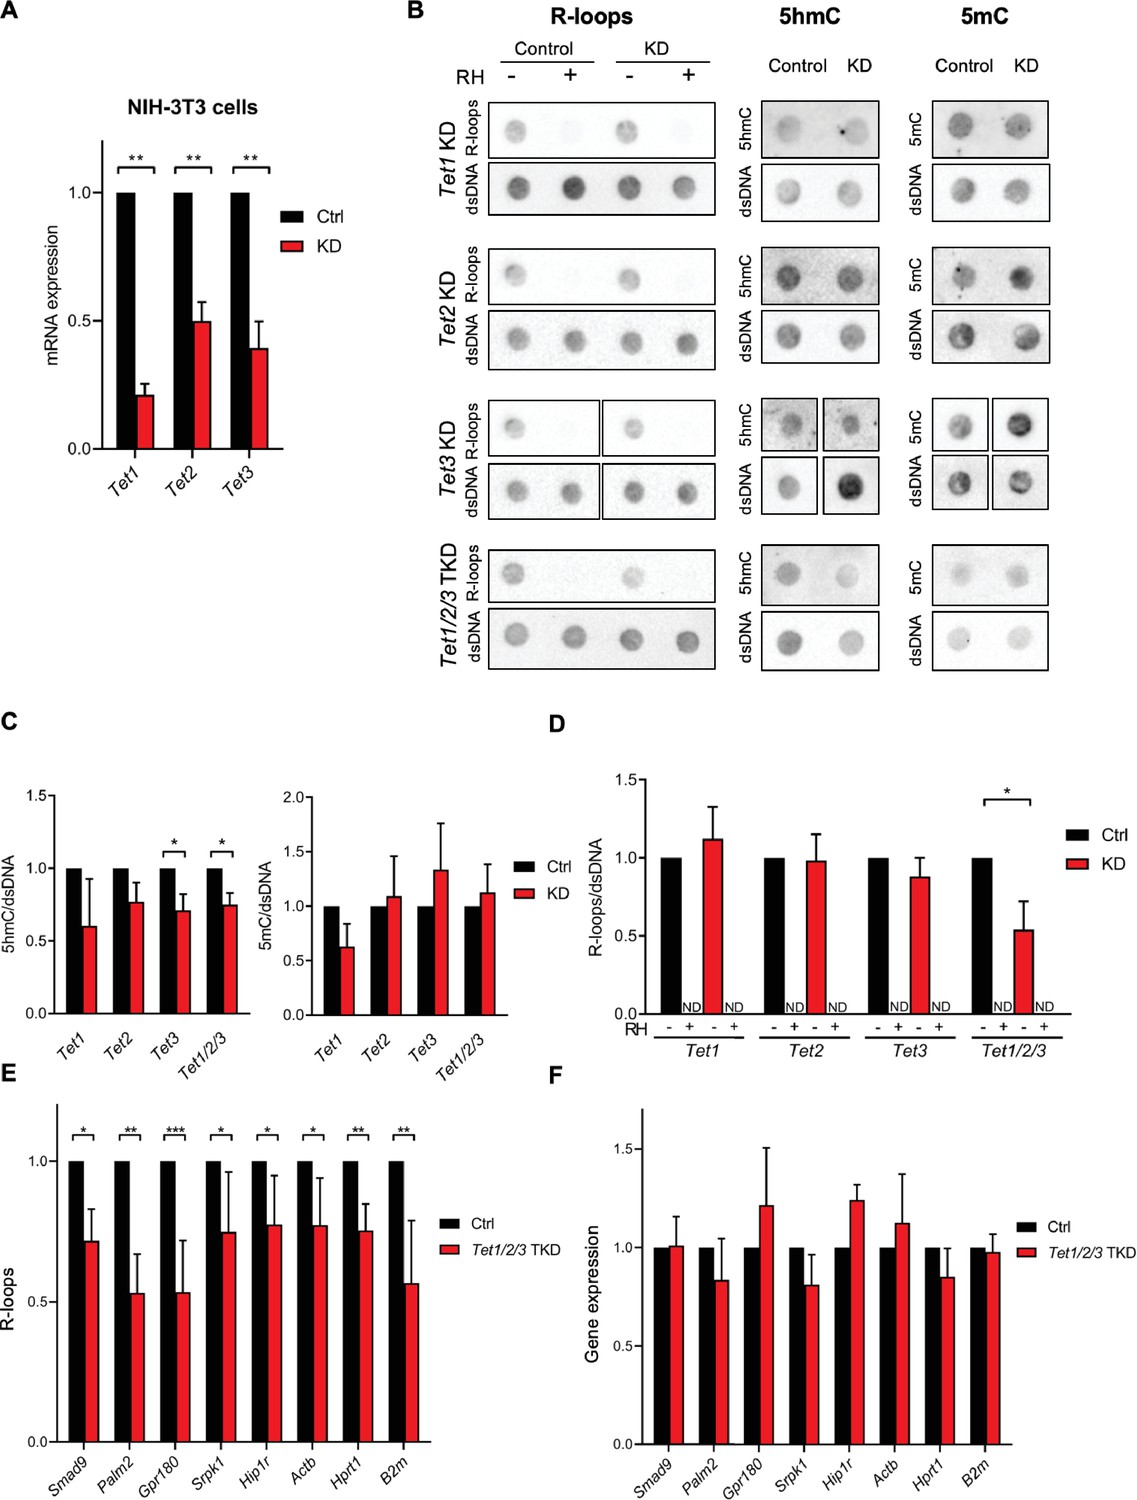
Tet depletion impacts R-loop formation in mouse fibroblasts.
(A) Tet1, Tet2, and Tet3 mRNA expression levels in mouse fibroblasts 48 hr after RNAi depletion of Tet1, Tet2, or Tet3. **p<0.01, two-tailed Student’s t-test. (B) Dot blot of R-loops, 5-hydroxymethylcytosine (5hmC), and 5-methylcytosine (5mC) in Tet1, Tet2, and Tet3 single KD and in Tet1/2/3 triple KD mouse fibroblast extracts. dsDNA was detected after stripping and reprobing of the same membranes. Data are from three independent experiments. Quantification of the 5hmC, 5mC (C), and R-loops (D) dot blots shown in (B). *p<0.05, two-tailed Student’s t-test. ND, not detected. (E) DNA:RNA immunoprecipitations (DRIPs) performed in Tet1/2/3 triple KD mouse fibroblasts to assess the R-loop levels formed in the indicated genes. R-loop levels were normalized to the corresponding RNase H-treated sample. *p<0.05, **p<0.01, ***p<0.001, two-tailed Student’s t-test. (F) Transcription levels of the genes presented in (E) in control and Tet1/2/3 triple KD mouse fibroblasts. All graphs show the mean and SD from a minimum of three independent experiments.
Figure 3 with 2 supplements
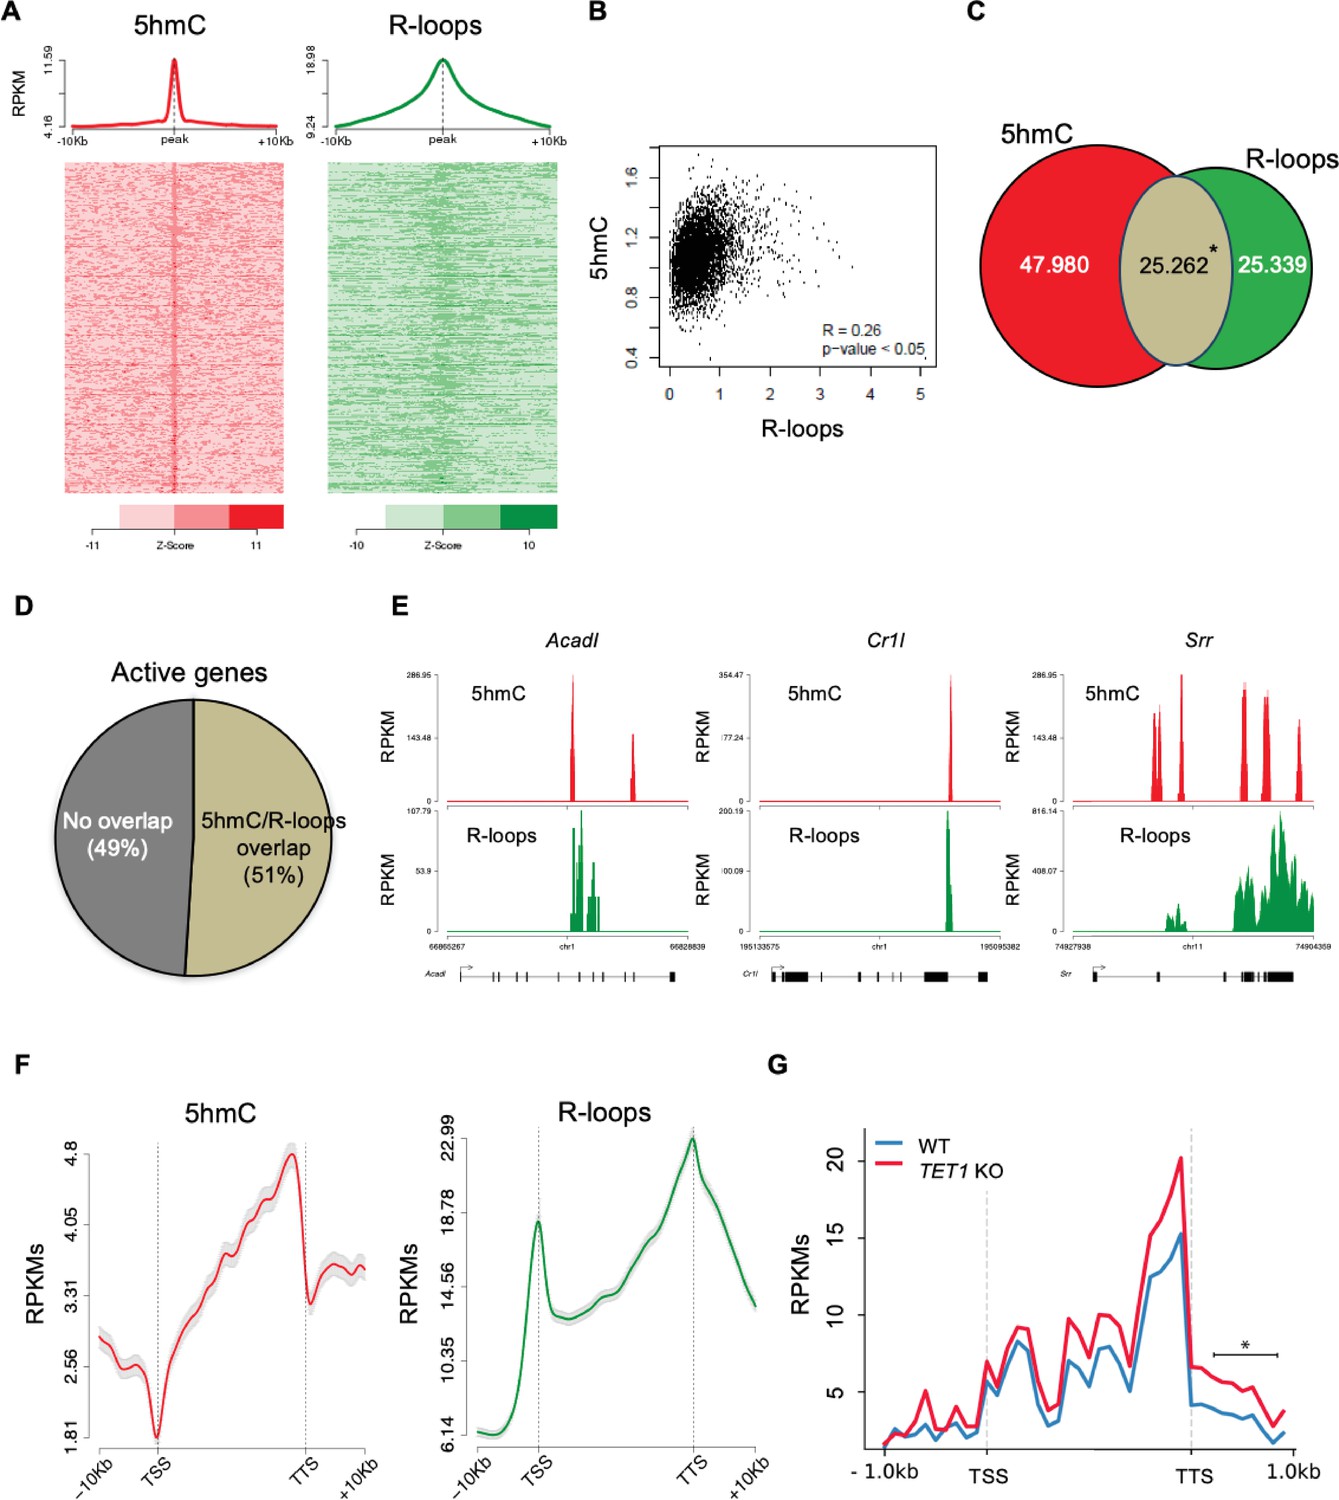
5-Hydroxymethylcytosine (5hmC) and R-loops overlap in active genes of mouse embryonic stem (mES) cells.
(A) Metagene and heatmap profiles of 5hmC and R-loops probed over fixed windows of ±10 kbp around the 5hmC peaks in expressed genes. (B) Pearson correlation coefficient between 5hmC and R-loops distribution within active genes (p<0.05). (C) Number of loci displaying 5hmC, R-loops, and overlapping 5hmC and R-loops. *Permutation analysis, p<0.05. (D) Percentage of active genes displaying overlapping 5hmC and R-loops. (E) Individual profiles of 5hmC and R-loop distribution along the Acadl, Cr1l, and Srr genes. Density signals are represented as reads per kilobase (RPKMs). (F) Metagene profiles of 5hmC and R-loops distribution in active genes. The gene body region was scaled to 60 equally sized bins, and ±10 kbp gene-flanking regions were averaged in 200 bp windows. TSS: transcription start site; TTS: transcription termination site. Density signals are represented as RPKMs, and error bars (gray) represent standard error of the mean. (G) Metagene profiles of genes showing transcription readthrough in wild-type and TET1 KO human ES cells. All gene regions were scaled to 2000 bp (gene body) and divided in equal bins of 100 bp. 1000 bp regions averaged in 100 bp bins were added upstream the TSS and downstream the TTS region. *p<0.05, Mann–Whitney rank test.
Figure 3—figure supplement 1
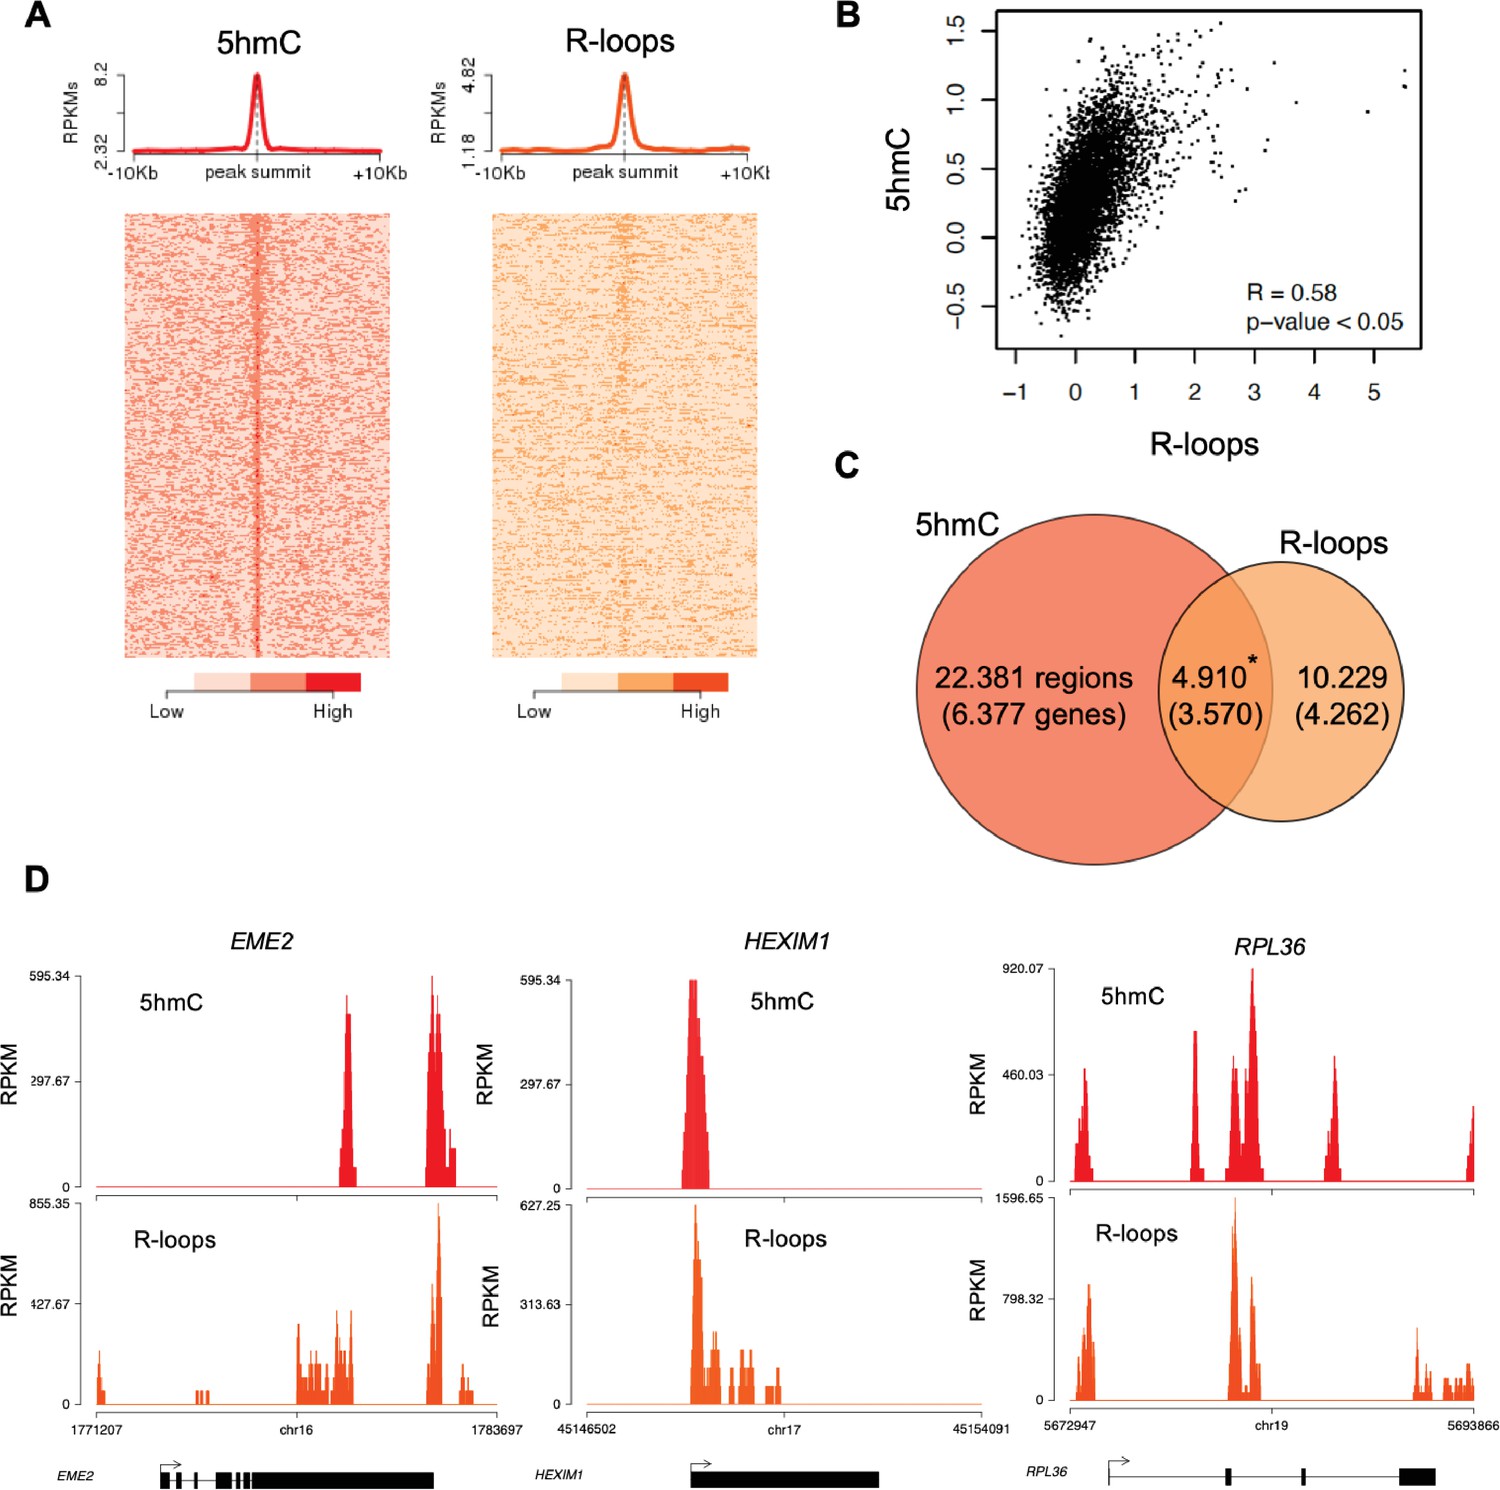
Genome-wide analysis of 5-hydroxymethylcytosine (5hmC) and R-loops in HEK293 cells.
(A) Metagene and heatmap profiles of 5hmC and R-loops probed over fixed windows ± 10 kbp around the 5hmC peaks in expressed genes. (B) Pearson correlation coefficient between 5hmC and R-loops distribution within active genes (p<0.05). (C) Number of loci displaying 5hmC, R-loops, and overlapping 5hmC and R-loops. *Permutation analysis, p<0.05. (D) Individual profiles of 5hmC and R-loop distribution along the EME2, HEXIM1, and RPL36 genes. Density signals are represented as reads per kilobase (RPKMs).
Figure 3—figure supplement 2
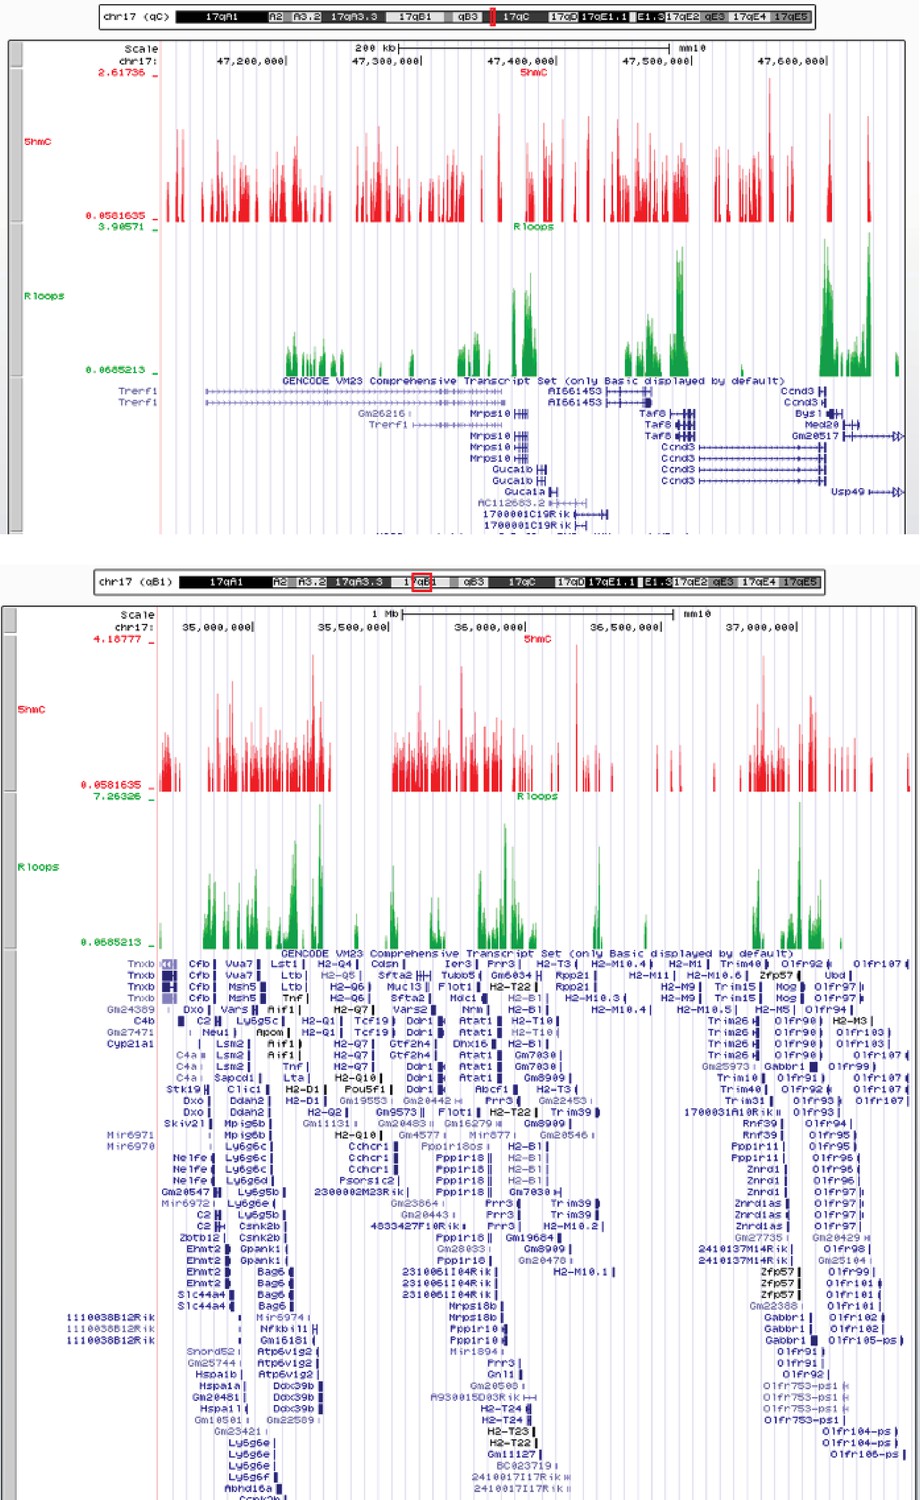
Chromosomal distribution of R-loops and 5-hydroxymethylcytosine (5hmC).
Individual profiles of 5hmC and R-loops along two long chromosomal regions. Density signals are represented as reads per kilobase (RPKMs) and were uploaded in UCSC Genome Browser (http://genome-euro.ucsc.edu/).
Figure 4
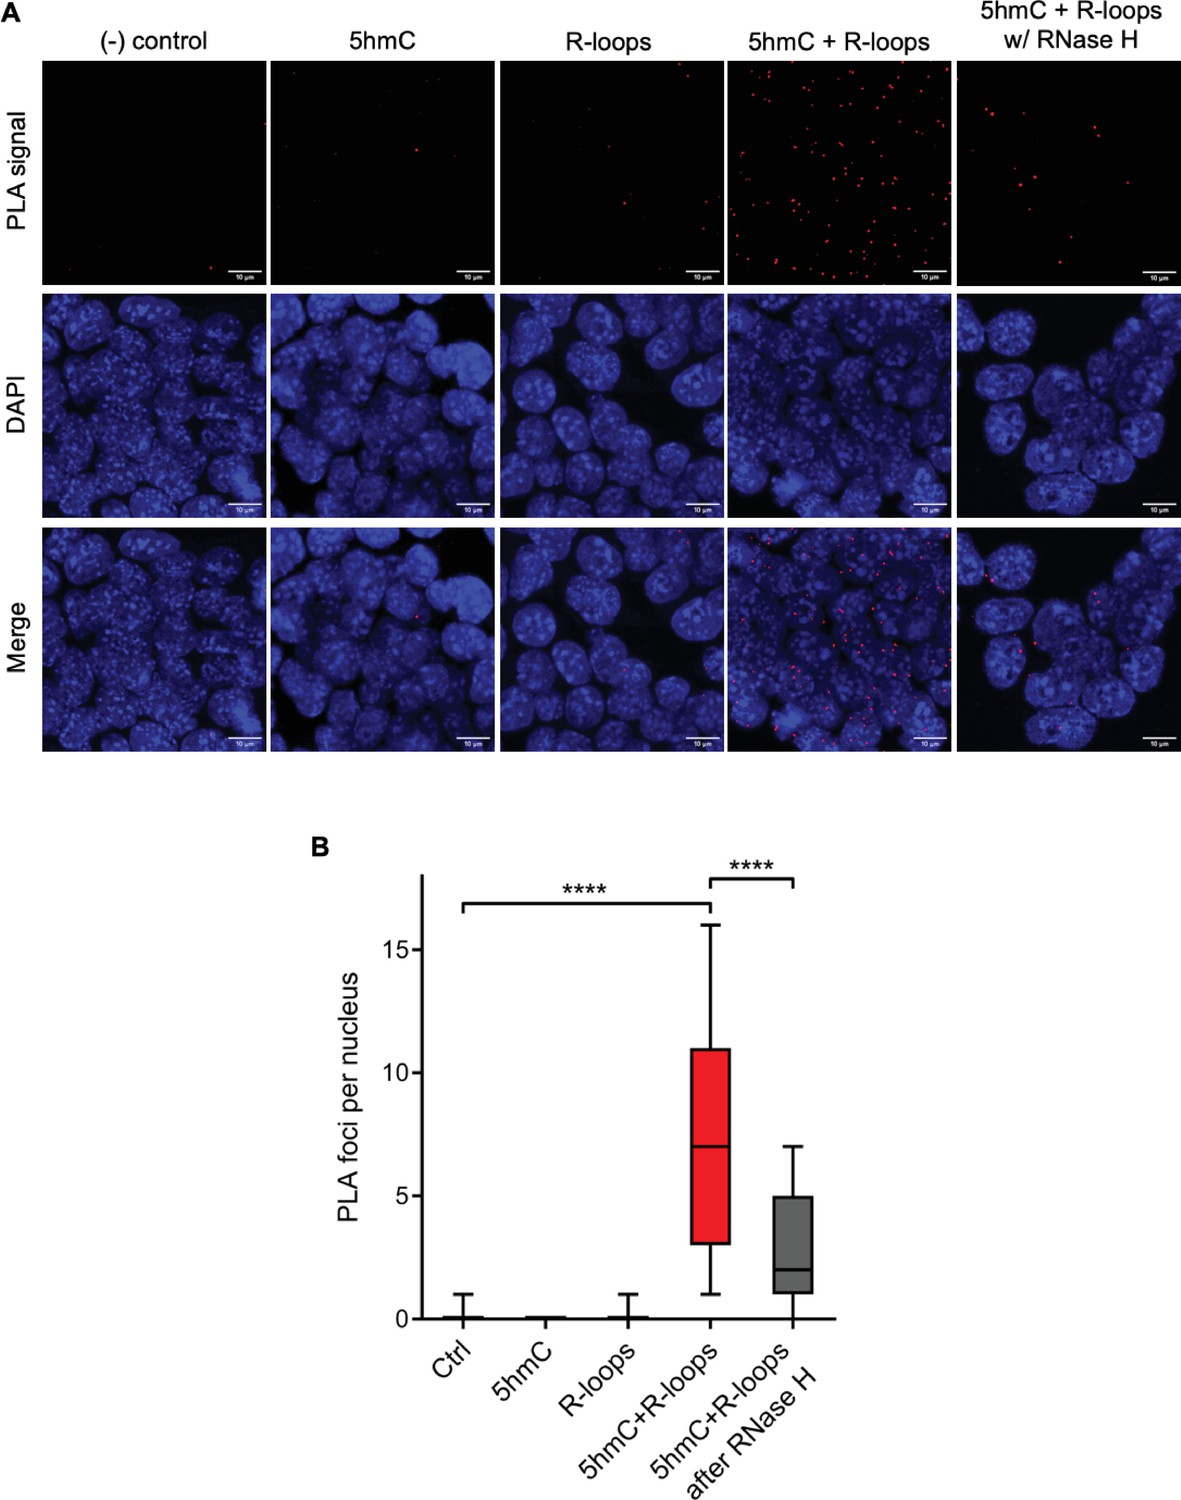
Simultaneous detection of 5-hydroxymethylcytosine (5hmC) and R-loops at the same genomic loci in individual mouse embryonic stem (mES) cells.
(A) 5hmC and R-loops proximity ligation assay (PLA) foci in mES cells. DAPI was added to the mounting medium to stain DNA. Scale bars: 10 μm. Data are representative of at least three independent experiments with similar results. (B) Boxplot showing 5hmC/R-loops PLA foci per nucleus. Horizontal solid lines represent the median values, and whiskers correspond to the 10 and 90 percentiles. A minimum of 300 cells from at least three independent experiments was scored for each experimental condition. ****p<0.0001, Mann–Whitney rank test.
Figure 5
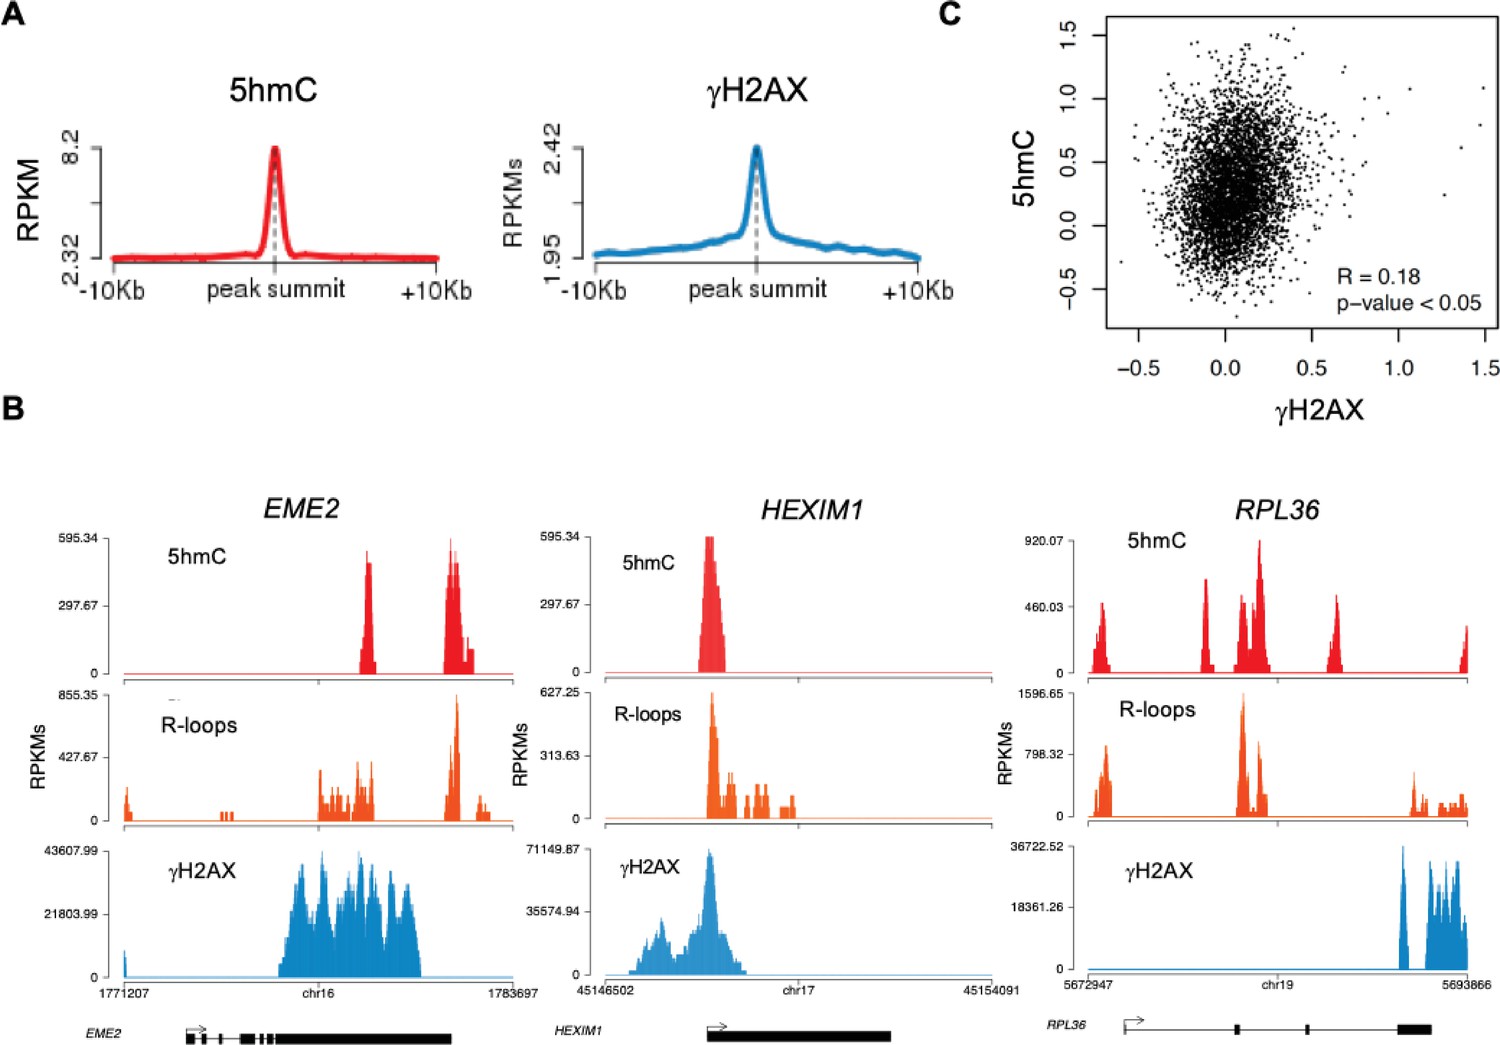
5-hydroxymethylcytosine (5hmC)-rich loci are genomic hotspots for DNA damage.
(A) Metagene profiles of 5hmC and ɣH2AX probed over fixed windows of ±10 kbp around the 5hmC peaks in expressed genes of HEK293 cells. (B) Individual profiles of 5hmC, R-loops and ɣH2AX distribution along the EME2, HEXIM1, and RPL36 genes. Density signals are represented as reads per kilobase (RPKMs). (C) Pearson correlation coefficient between 5hmC and ɣH2AX at active genes (p<0.05).
Figure 6 with 1 supplement

Cellular pathways affected by R-loops formed at 5-hydroxymethylcytosine (5hmC) loci.
(A) Volcano plot displaying the differentially expressed genes in mouse embryonic stem (mES) cells upon RNase H overexpression. Of all downregulated and upregulated genes, 64 and 48% displayed R-loops overlapping with 5hmC, respectively. (B, C) Pathway analysis of the genes that have R-loops overlapping with 5hmC and are differentially expressed upon RNase H overexpression. Shown are the significantly downregulated (B) and upregulated (C) hallmark gene sets from MSigDB. False discovery rate (FDR), p<0.001. (D) Transcription levels of pluripotency and germ layer commitment genes in mES cells overexpressing RNase H. *p<0.05, two-tailed Student’s t-test. Means and SDs are from five independent experiments.
Figure 6—figure supplement 1
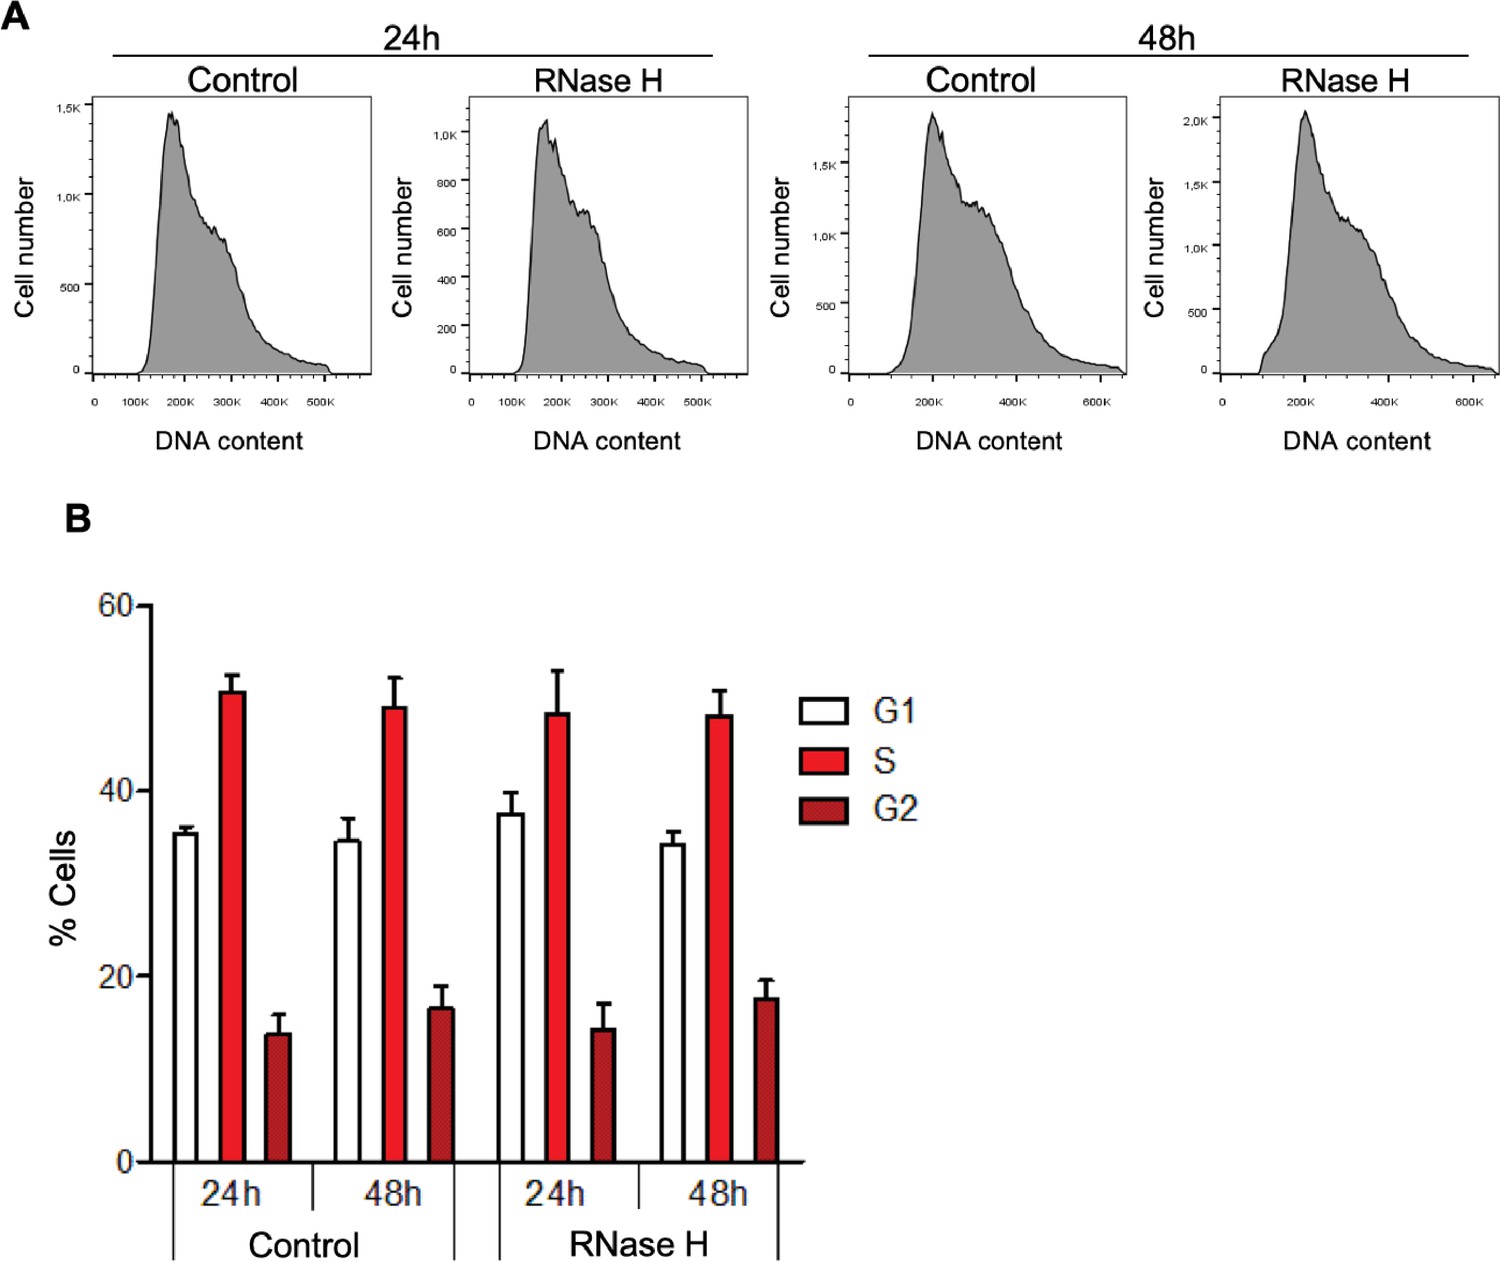
Global R-loop suppression does not impact cell cycle progression of mouse embryonic stem (mES) cells.
(A) Flow cytometry analysis of propidium iodide-treated mES cells with ectopic expression of either GFP (control) or GFP-tagged RNase H for 24 or 48 hr. Data are representative of five independent experiments. (B) Percentage of control and RNase H-overexpressing mES cells at each cell cycle stage. Means and SDs are from five independent experiments.
Additional files
-
Supplementary file 1
Differentially expressed genes upon RNase H overexpression.
- https://cdn.elifesciences.org/articles/69476/elife-69476-supp1-v2.xlsx
-
Supplementary file 2
Oligonucleotides and antibodies used in the study.
(A) shRNA sequences. (B) Oligonucleotide sequences. (C) Antibodies used in this study. (D) g-Blocks sequences. (E) S9.6 electrophoretic mobility shift assay (EMSA) oligonucleotides.
- https://cdn.elifesciences.org/articles/69476/elife-69476-supp2-v2.docx
-
Transparent reporting form
- https://cdn.elifesciences.org/articles/69476/elife-69476-transrepform1-v2.docx
-
Source data 1
Original, uncropped images of blots and gels.
- https://cdn.elifesciences.org/articles/69476/elife-69476-data1-v2.pptx
-
Source data 2
Original, uncropped images of blots.
- https://cdn.elifesciences.org/articles/69476/elife-69476-data2-v2.pptx
Download links
A two-part list of links to download the article, or parts of the article, in various formats.
Downloads (link to download the article as PDF)
Open citations (links to open the citations from this article in various online reference manager services)
Cite this article (links to download the citations from this article in formats compatible with various reference manager tools)
Epigenetic reprogramming by TET enzymes impacts co-transcriptional R-loops
eLife 11:e69476.
https://doi.org/10.7554/eLife.69476


