The fluoride permeation pathway and anion recognition in Fluc family fluoride channels
- Department of Molecular, Cellular, and Developmental Biology, University of Michigan, United States
- Program in Biophysics, University of Michigan, United States
Figures
Figure 1 with 2 supplements
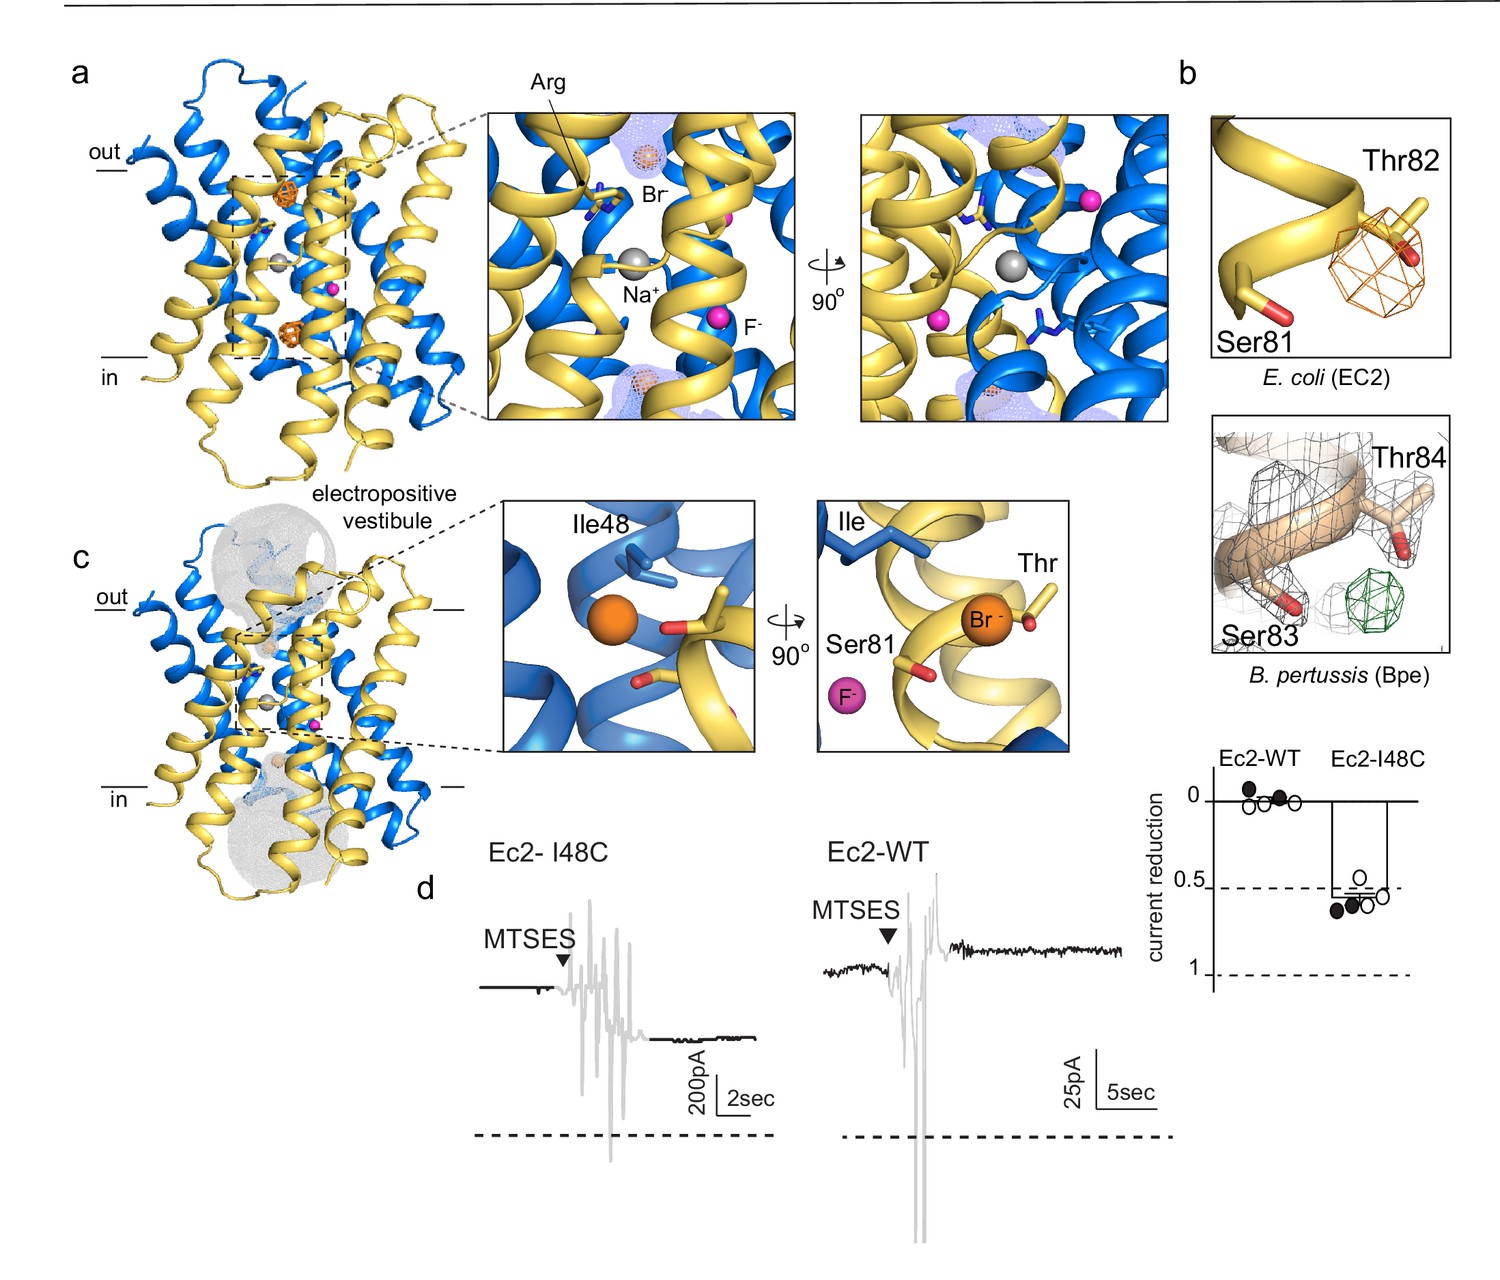
An anion-binding site in the Fluc channel vestibule.
(a) Structure of Fluc-Ec2 with Br-. Monomers are shown in maize and blue, with fluoride ions as pink spheres, sodium as a gray sphere, and anomalous difference map shown as an orange mesh, contoured at 5σ. Zoomed-in views depict Br- as orange spheres, with the aqueous vestibule indicated by a blue mesh and vestibule arginines shown as sticks. (b) Comparison of vestibule anion-binding site for Fluc-Ec2 (top) and Fluc-Bpe (bottom; PDB: 5NKQ). For Fluc-Ec2, the Br- anomalous difference map is displayed as an orange mesh and contoured at 5σ. For Fluc-Bpe, the Fo-Fc map is displayed in green and contoured at 3σ. 2Fo-Fc electron density is shown for sidechains and displayed as a gray mesh, contoured at 2σ. (c) Additional views of the Br--binding site in Fluc-Ec2, with Ile48, Ser81, and Thr82 shown as sticks. (d) Electrical recordings for multichannel bilayers of Fluc-Ec2 I48C and wild-type (WT) Fluc-Ec2. Dashed line indicates the zero-current level. Saturating (2-sulfonatoethyl)methanethiosulfonate (MTSES) was added at the indicated time. Regions of the recording with electrical noise from mixing are colored light gray to assist with figure interpretation. Traces are representative of data collected from five independent bilayers. Right panel, normalized current after MTSES addition. Replicates from two independent preps are shown in black or white. Average current change for Ec2 I48C upon MTSES addition (mean ± SEM from five bilayers): 56 ± 3% decrease. Current change for Ec2 WT upon MTSES addition (mean ± SEM from five bilayers): 0.7 ± 1.7% increase.
-
Figure 1—source data 1
Measurements of current decrease upon MTSES addition.
- https://cdn.elifesciences.org/articles/69482/elife-69482-fig1-data1-v2.xlsx
-
Figure 1—source data 2
Fluoride efflux measurements for Bpe-I50W.
- https://cdn.elifesciences.org/articles/69482/elife-69482-fig1-data2-v2.xlsx
Figure 1—figure supplement 1
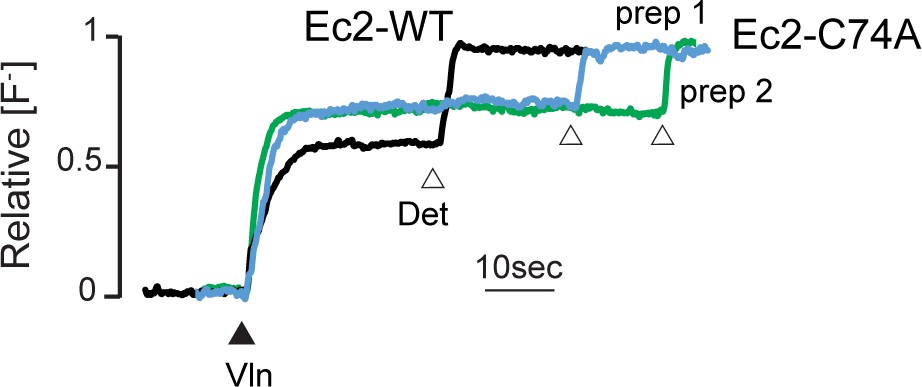
Fluoride efflux from Fluc-Ec2 C74A (blue and green traces) or WT Fluc-Ec2 channel (black trace) proteoliposomes.
Traces are representative of results obtained from four replicates, derived from proteins from two independent preps. Valinomycin and detergent addition is indicated by triangles. Results from all replicates are tabulated in Table 5.
Figure 1—figure supplement 2
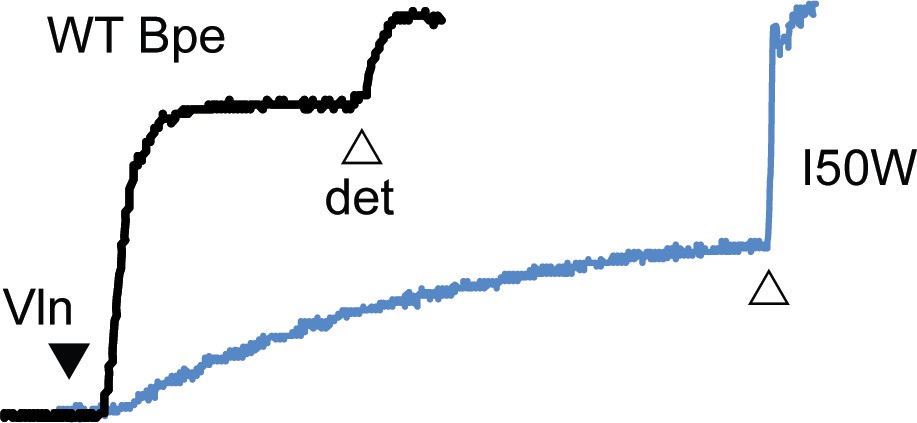
Fluoride efflux from Fluc-Bpe I50W (blue trace) or WT Fluc-Bpe channel (black trace) proteoliposomes.
The unitary fluoride transport rate determined from five independent replicates is 700 ± 60 ions/s. Results from all replicates are tabulated in Table 5.
Figure 2 with 2 supplements
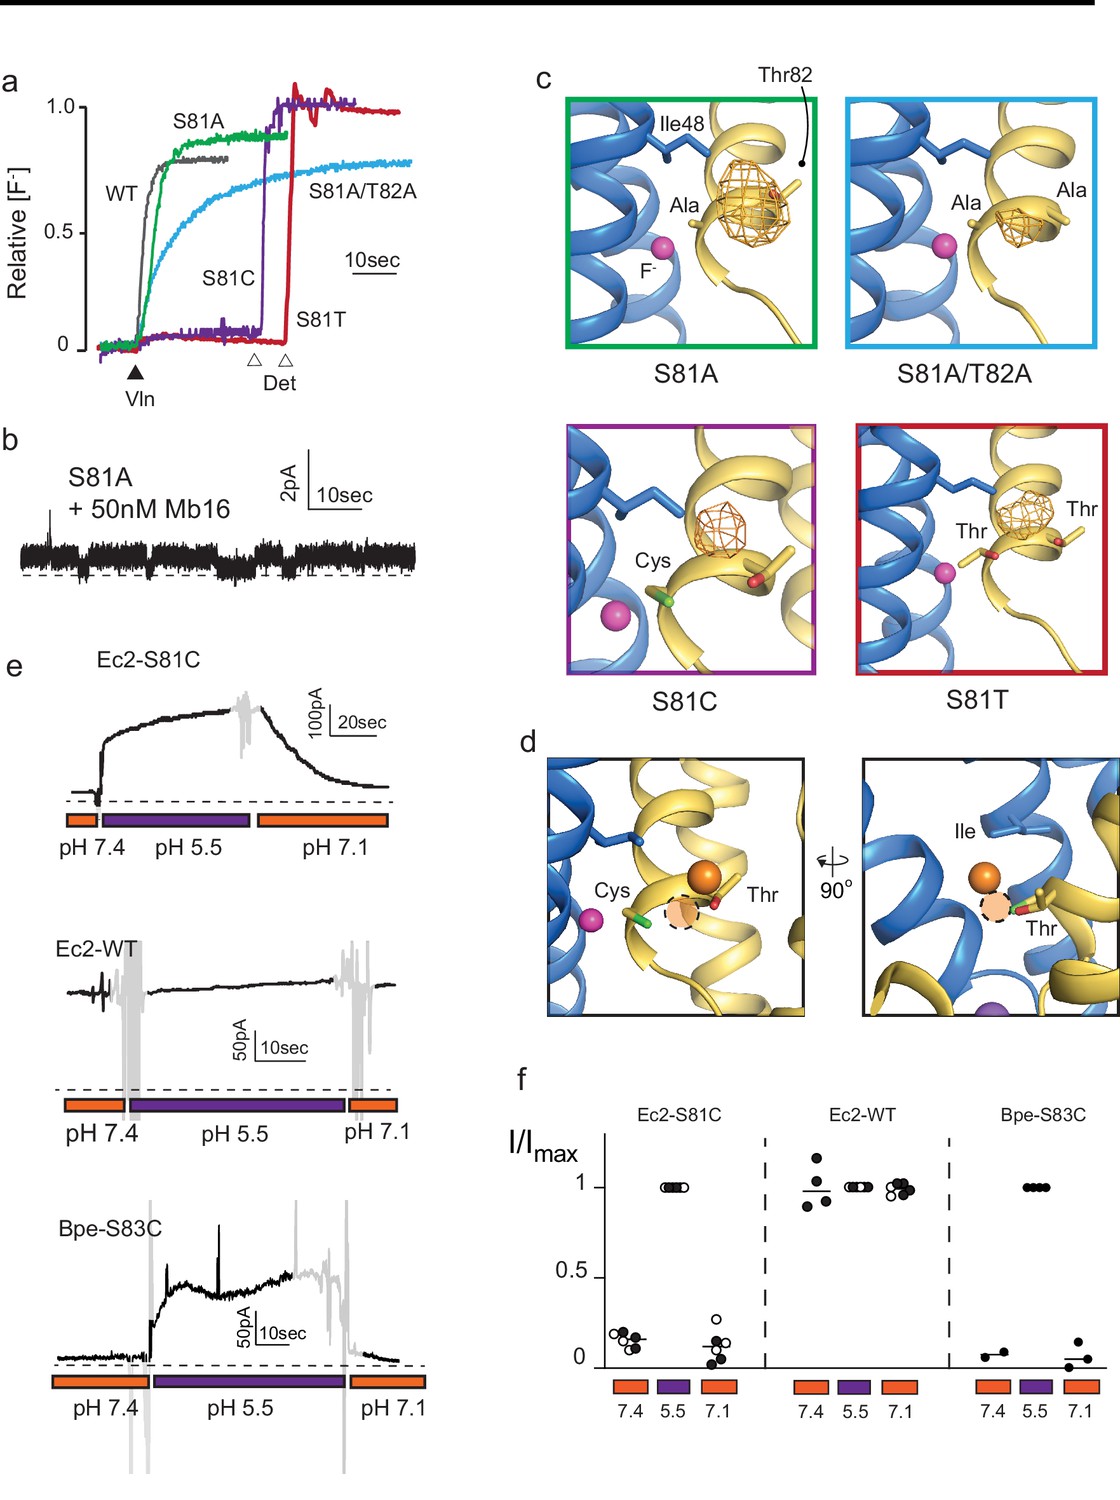
Mutagenesis of vestibule anion-binding site.
(a) Fluoride efflux from liposomes monitored with a fluoride-selective electrode: wild-type (WT) Fluc-Ec2 (gray), S81A (green), S81A/T82A (blue), S81T (red), and S81C (purple). Efflux initiated by the addition of valinomycin (black triangle). After reaching steady state, the remaining encapsulated fluoride was released by detergent addition (open triangles). Each trace is normalized against total encapsulated fluoride. Traces are representative of results from at least two independent biochemical purifications. Results from all replicates are tabulated in Table 5. (b) Representative single-channel recording of S81A in the presence of a blocking monobody to identify the zero-current level (dashed line). (c) Bromine anomalous difference maps for S81A, S81A/T82A, S81T, and S81C contoured at 5σ. The frame around each panel is colored as in panel (a). (d) Comparison of the position of Br- density in S81C (orange sphere) and WT Ec2 (dashed orange circle). (e) Fluoride currents mediated by Ec2-S81C, WT Ec2, and Bpe-S83C channels. pH was adjusted during the experiment as indicated. Regions of the recording with electrical noise from mixing are colored light gray to assist with figure interpretation. Traces are representative of recordings from three to six independent bilayers. Additional replicate traces can be found in Figure 2—figure supplement 1. (f) Summary of all replicates of experiments shown in panel (e). Values are normalized against the maximum steady-state current (5 s average) measured at pH 5.5 for that trace. Black and white points indicate different protein preparations.
-
Figure 2—source data 1
Fluoride efflux data.
- https://cdn.elifesciences.org/articles/69482/elife-69482-fig2-data1-v2.xlsx
-
Figure 2—source data 2
Single-channel measurements of S81A.
- https://cdn.elifesciences.org/articles/69482/elife-69482-fig2-data2-v2.xlsx
-
Figure 2—source data 3
Normalized currents for Ec2-S81C, Ec2, and Bpe-S83C as a function of pH.
- https://cdn.elifesciences.org/articles/69482/elife-69482-fig2-data3-v2.xlsx
-
Figure 2—source data 4
Electrophysiological recordings of Ec2-S81C, Ec2, and Bpe-S83C as a function of pH.
- https://cdn.elifesciences.org/articles/69482/elife-69482-fig2-data4-v2.xlsx
-
Figure 2—source data 5
Chloride efflux data.
- https://cdn.elifesciences.org/articles/69482/elife-69482-fig2-data5-v2.xlsx
Figure 2—figure supplement 1
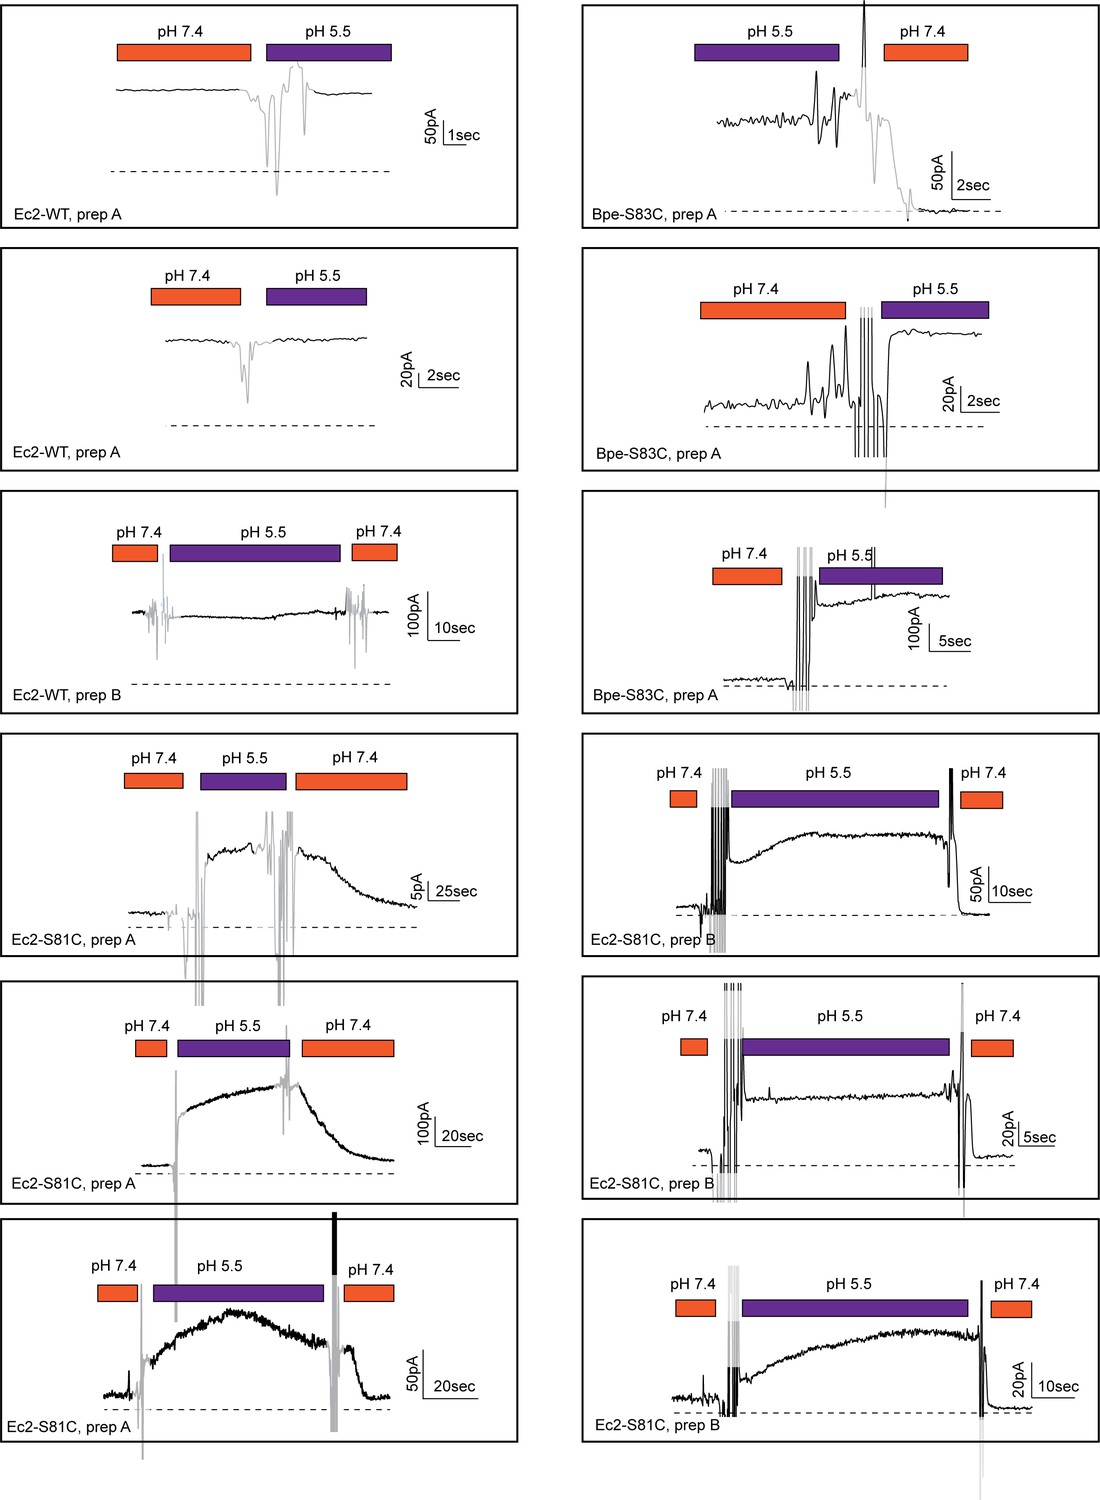
Additional replicate traces for the experiment in Figure 2E.
Figure 2—figure supplement 2
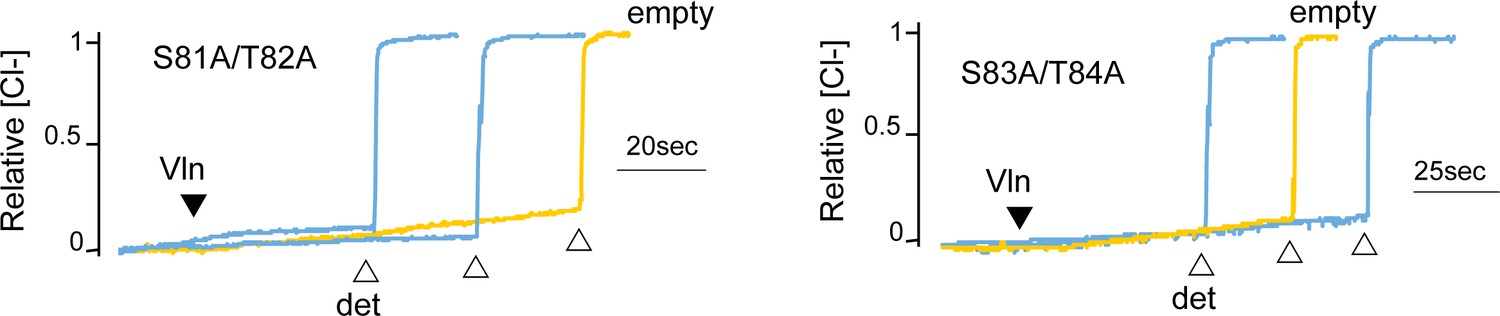
Chloride efflux experiments with fluoride-transporting Fluc-Ec2 S81A/T82A and the homologous Fluc-Bpe S83A/T84A (blue traces).
Representative traces from two independent protein preparations are shown. The background rate of chloride leak from empty liposomes is ~40 s−1 (yellow traces). Results from all replicates are tabulated in Table 5.
Figure 3 with 3 supplements
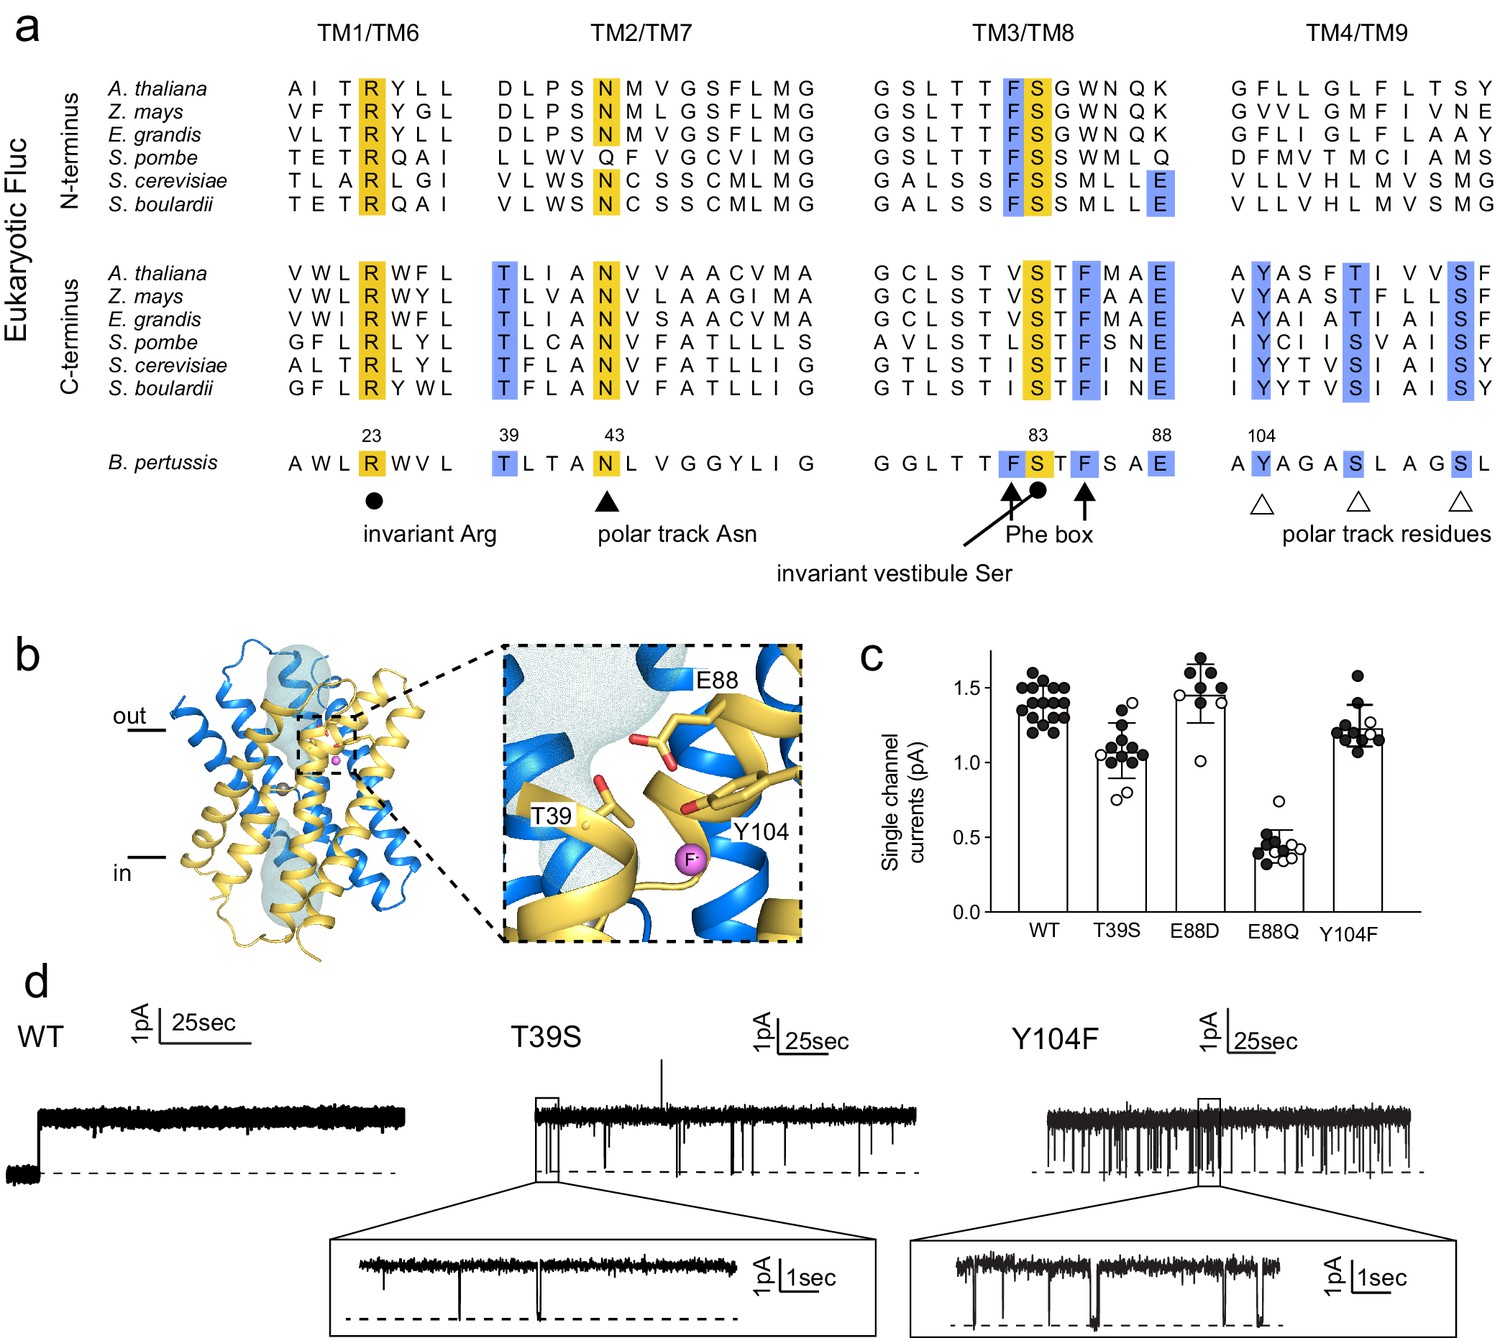
Identification and characterization of triad residues.
(a) Sequence alignment of Fluc-Bpe with N- and C-terminal domains of representative eukaryotic fluoride channels (transmembrane helices only). Invariant pore-lining residues are shown in yellow. Pore-lining residues that are conserved in only one pore of the eukaryotic FEX channels are highlighted in blue. Residue numbering from Fluc-Bpe is shown (note that S83 in Fluc-Bpe is equivalent to S81 in Fluc-Ec2). (b) Structure of Fluc-Bpe (PDB: 5NKQ) with triad residues indicated as sticks, aqueous vestibule as a mesh, and fluoride ions as pink spheres. (c) Single-channel currents for wild-type (WT) Fluc-Bpe and indicated mutants measured at a holding voltage of 200 mV. Error bars represent the mean and SEM. Black and white points indicate different protein preparations. (d) Representative single-channel electrophysiological recordings for WT Fluc-Bpe, Bpe T39S, and Bpe-Y104F.
-
Figure 3—source data 1
Single-channel current measurements.
- https://cdn.elifesciences.org/articles/69482/elife-69482-fig3-data1-v2.xlsx
-
Figure 3—source data 2
Single-channel recordings of Bpe-WT, Bpe-T39S, and Bpe-Y104F.
- https://cdn.elifesciences.org/articles/69482/elife-69482-fig3-data2-v2.xlsx
-
Figure 3—source data 3
Fluoride efflux data.
- https://cdn.elifesciences.org/articles/69482/elife-69482-fig3-data3-v2.xlsx
-
Figure 3—source data 4
pH dependence of WT and E88Q (oriented channels).
- https://cdn.elifesciences.org/articles/69482/elife-69482-fig3-data4-v2.xlsx
-
Figure 3—source data 5
Monobody block of T39S and Y104F.
- https://cdn.elifesciences.org/articles/69482/elife-69482-fig3-data5-v2.xlsx
Figure 3—figure supplement 1
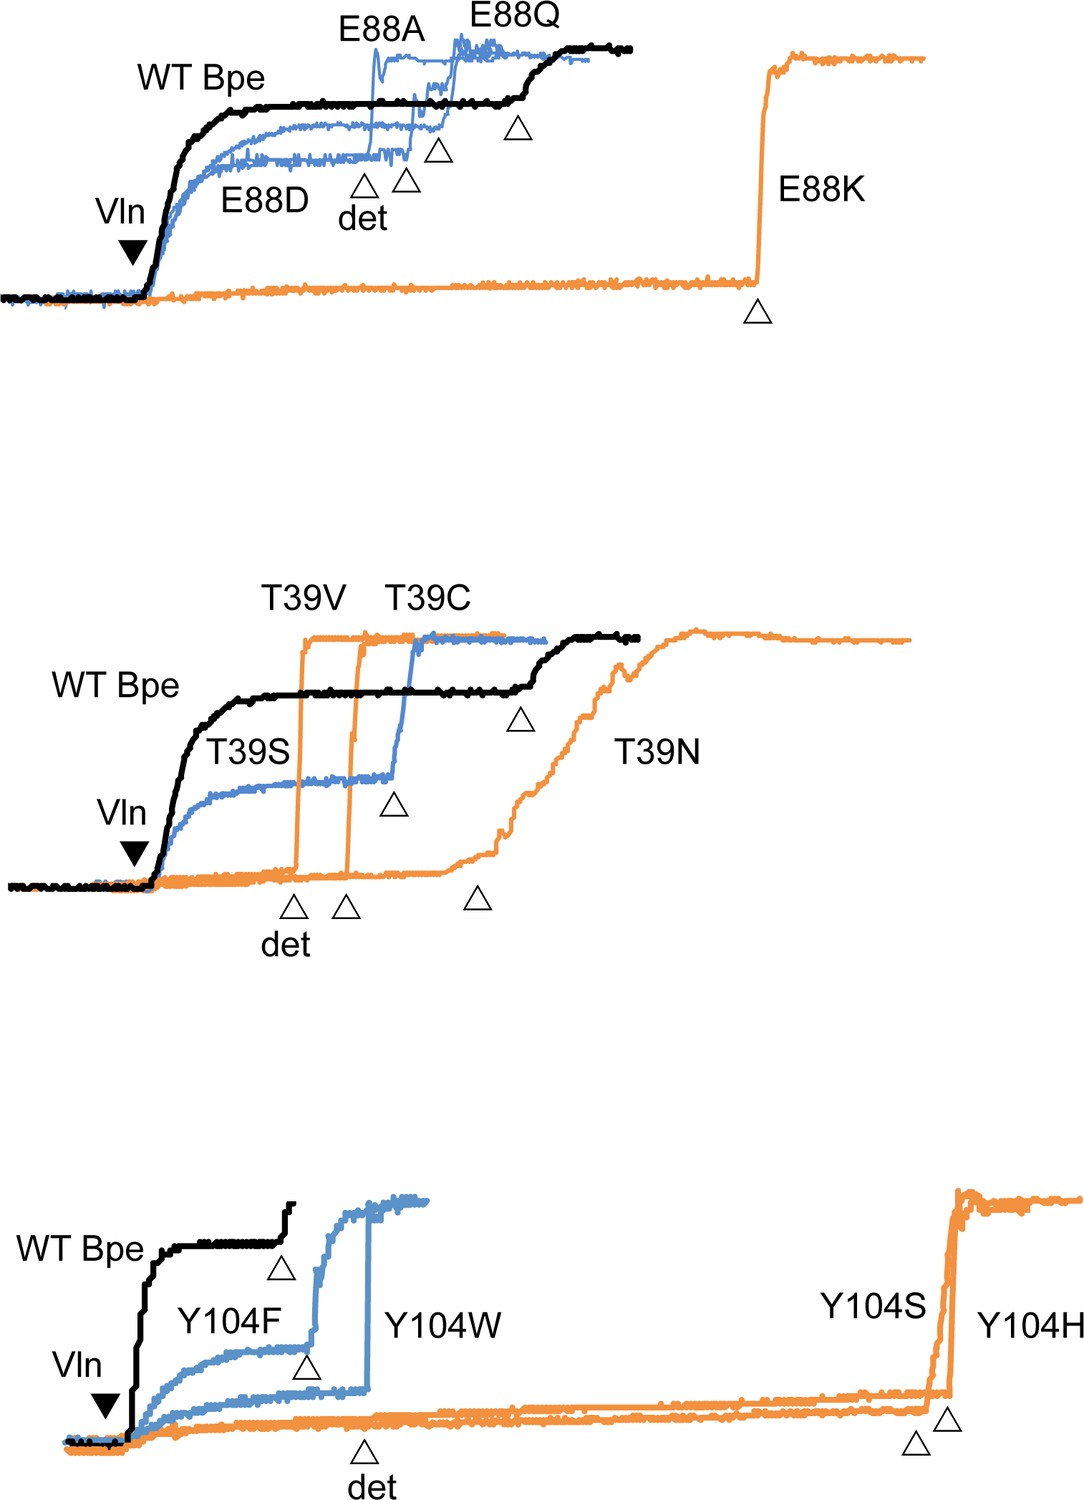
Fluoride efflux traces with indicated Fluc-Bpe mutants.
Fluoride dump is normalized against total fluoride in liposomes. In all traces, wild-type (WT) trace is shown in black, active mutants in blue, and inactive mutants in orange. Valinomycin addition is indicated with the closed triangle and detergent addition with open triangles. Traces are representative of results from two independent protein preparations. Results from all replicates are tabulated in Table 5.
Figure 3—figure supplement 2
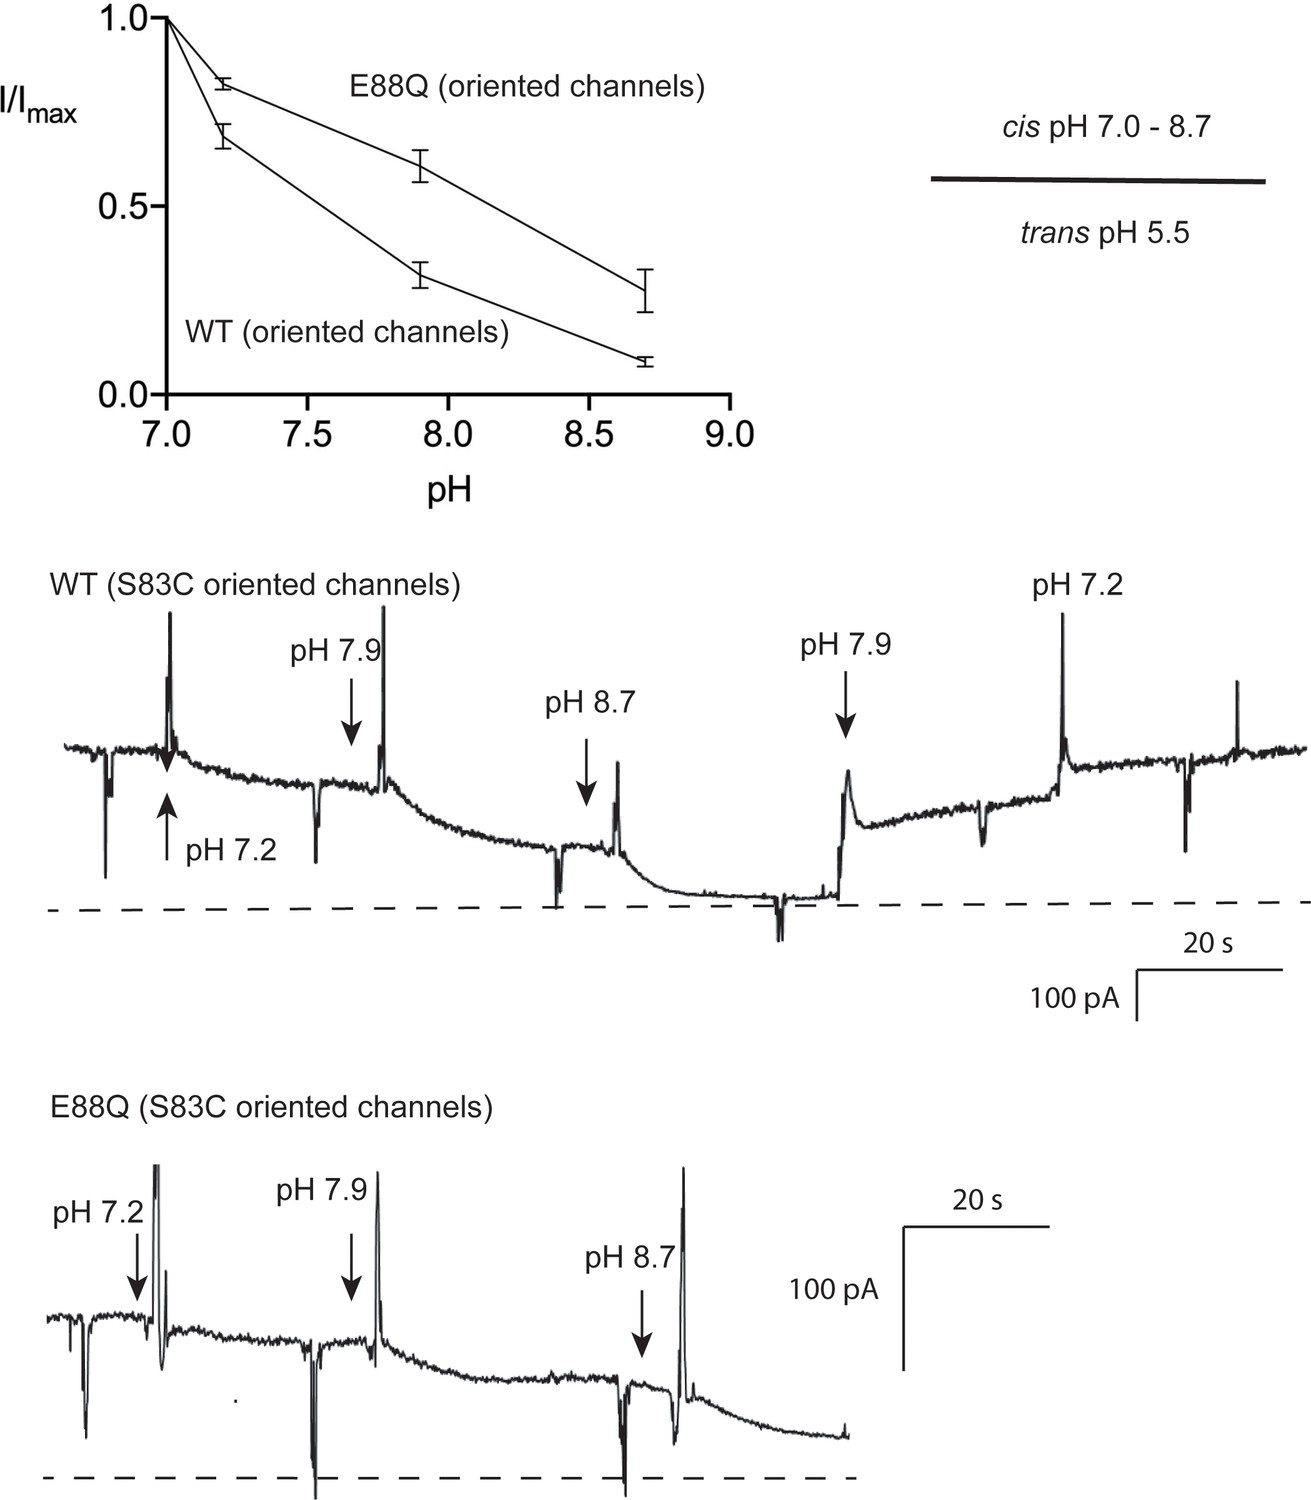
pH dependence of Fluc-Bpe E88 and E88Q.
Experiments were performed in the oriented system, S83C, with trans pH 5.5. The pH on the cis side was raised by the stepwise replacement of pH 7 recording solution (buffered with 3-morpholinopropane-1-sulfonic acid (MOPS)) with recording solution buffered with glycine (pH 9). Currents are normalized against initial pH 7 currents for each individual bilayer. Points and error bars represent the mean and SEM from three independent bilayers. Representative recordings are shown in lower panels.
Figure 3—figure supplement 3
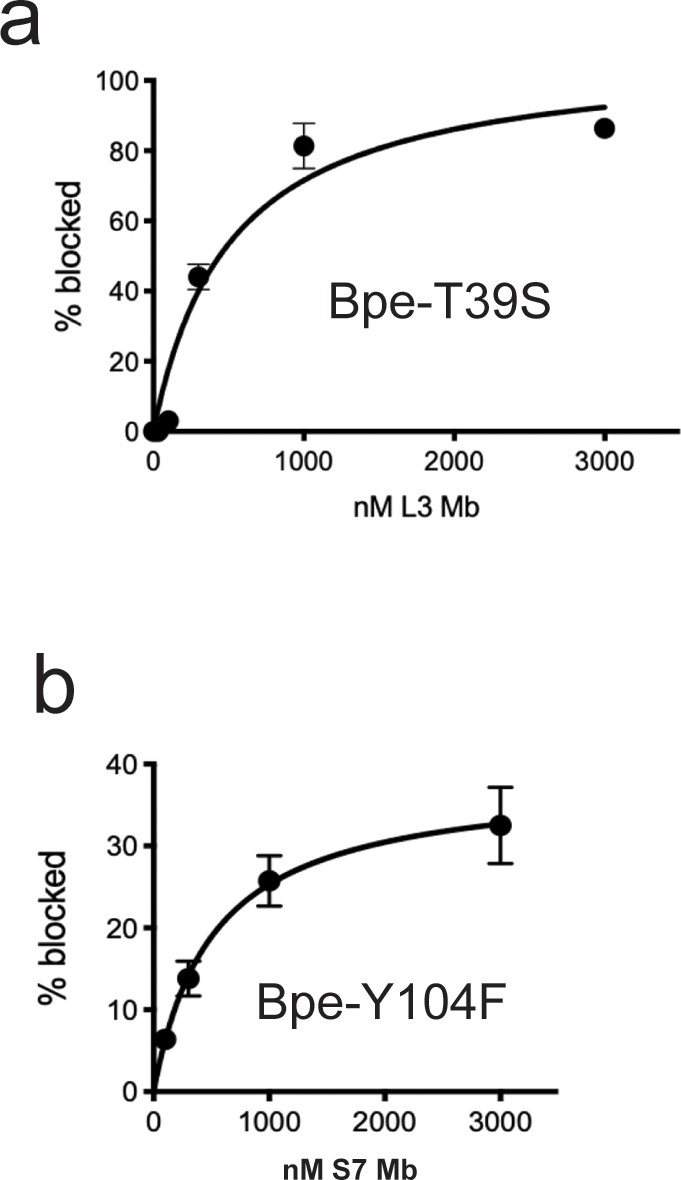
Monobody block of currents mediated by Fluc-Bpe mutants T39S and Y104F.
(a) Fraction of T39S current blocked as a function of monobody L3 addition. Points and error bars represent the mean and SEM of measurements from three independent bilayers. The solid line represents a hyperbolic fit with a Kd value of 510 nM. For comparison, wild-type (WT) Fluc-Bpe is blocked by monobody L3 with a Kd value of 100 nM (Stockbridge et al., 2014; Turman and Stockbridge, 2017). (b) Fraction of T39S current blocked as a function of monobody S7 addition. Points and error bars represent the mean and SEM of measurements from four independent bilayers. The solid line represents a hyperbolic fit with a Kd value of 510 nM (it is entirely coincidental that this fit parameter is the same as that for the data in panel a). For comparison, WT Fluc-Bpe is blocked by monobody S7 with a Kd value of 370 nM. The partial current block is typical of monobody S7 (Stockbridge et al., 2014; Stockbridge et al., 2015).
Figure 4 with 6 supplements
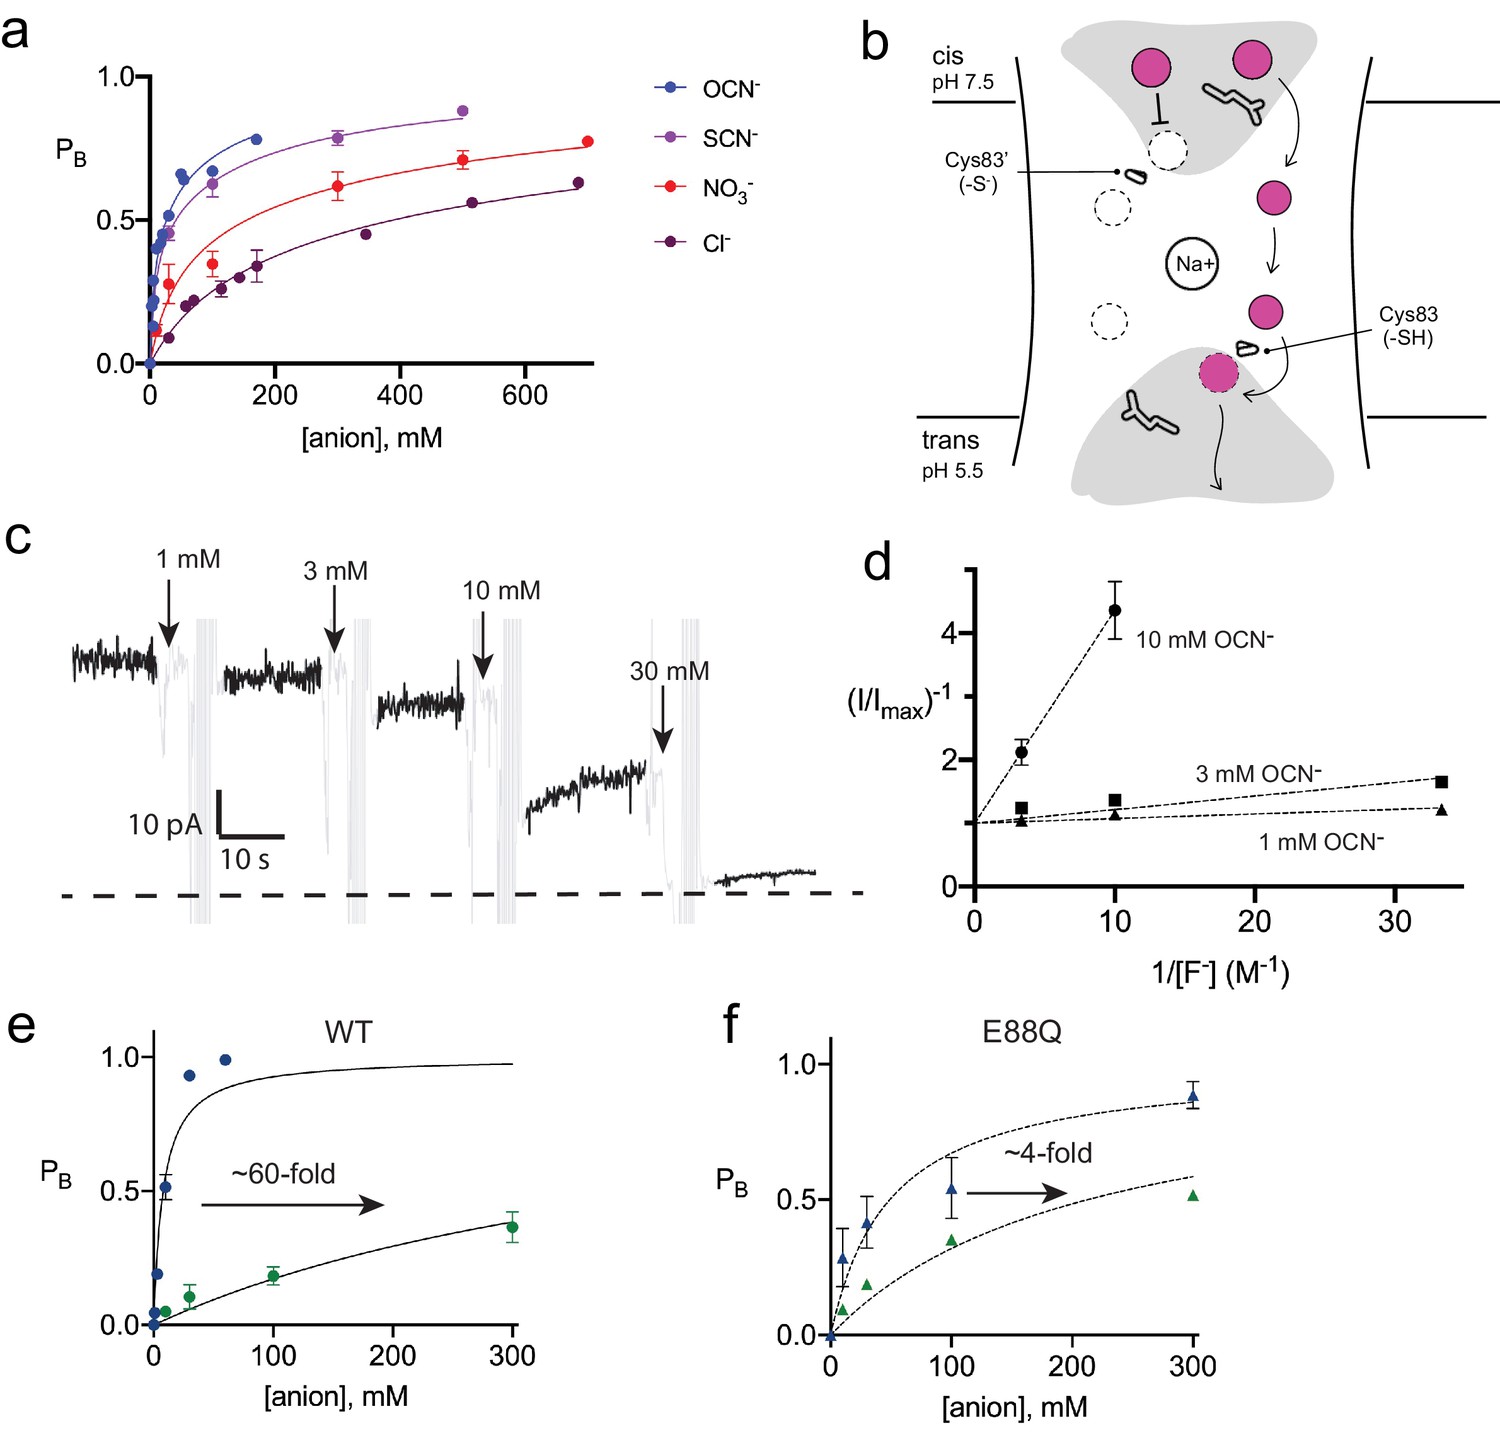
Inhibition of Fluc-Bpe and Fluc-Bpe E88Q currents by halides and pseudohalides.
(a) Fraction of blocked current as a function of anion addition. The solid lines represent fits to a two-site-binding isotherm, constrained so that the maximum PB for each site is 0.5. In this model, anions bind to single sites that are located on opposite sides of the dual-topology pores. Ki values for fits are reported in Table 2. Data are collected from three independent bilayers. Where present, error bars represent SEM of independent replicates. (b) Cartoon of strategy for orienting Bpe channels for anion block experiments. Gray area indicates aqueous vestibules. Sidechains E88 and S83C are shown as sticks. (c) Representative electrical recording showing OCN- addition to fluoride currents mediated by oriented Bpe-S83C channels. The zero-current level is indicated with a dashed line. Cyanate additions are indicated by the arrows. Regions of the recording with electrical noise from cyanate addition and mixing are colored light gray to assist with figure interpretation. (d) Lineweaver-Burke analysis of OCN- block as a function of F- concentration. Dashed lines represent linear fits to the data. All measurements were performed in triplicate from independent bilayers; where not visible, error bars are smaller than the diameter of the point. (e, f) Fraction of blocked current in S83C (e) or S83C/E88Q (f) oriented channels as a function of anion addition. Points and error bars represent the mean and SEM from three independent bilayers. Where not visible, error bars are smaller than the diameter of the point. Solid lines represent fits to a single-site-binding isotherm with PB,max = 1. Ki values from fits are reported in Table 2. Comparison of replicate measurements from independent preps are shown in Figure 4—figure supplement 3.
-
Figure 4—source data 1
Current block by anion addition (dual-topology channels).
- https://cdn.elifesciences.org/articles/69482/elife-69482-fig4-data1-v2.xlsx
-
Figure 4—source data 2
Current block by anion addition (oriented channels).
- https://cdn.elifesciences.org/articles/69482/elife-69482-fig4-data2-v2.xlsx
-
Figure 4—source data 3
Current blocked by OCN- addition as a function of F- concentration.
- https://cdn.elifesciences.org/articles/69482/elife-69482-fig4-data3-v2.xlsx
-
Figure 4—source data 4
Chloride efflux traces for triad mutants.
- https://cdn.elifesciences.org/articles/69482/elife-69482-fig4-data4-v2.xlsx
-
Figure 4—source data 5
Light-scattering traces.
- https://cdn.elifesciences.org/articles/69482/elife-69482-fig4-data5-v2.xlsx
-
Figure 4—source data 6
SCN- block of dual-topology channels.
- https://cdn.elifesciences.org/articles/69482/elife-69482-fig4-data6-v2.xlsx
Figure 4—figure supplement 1
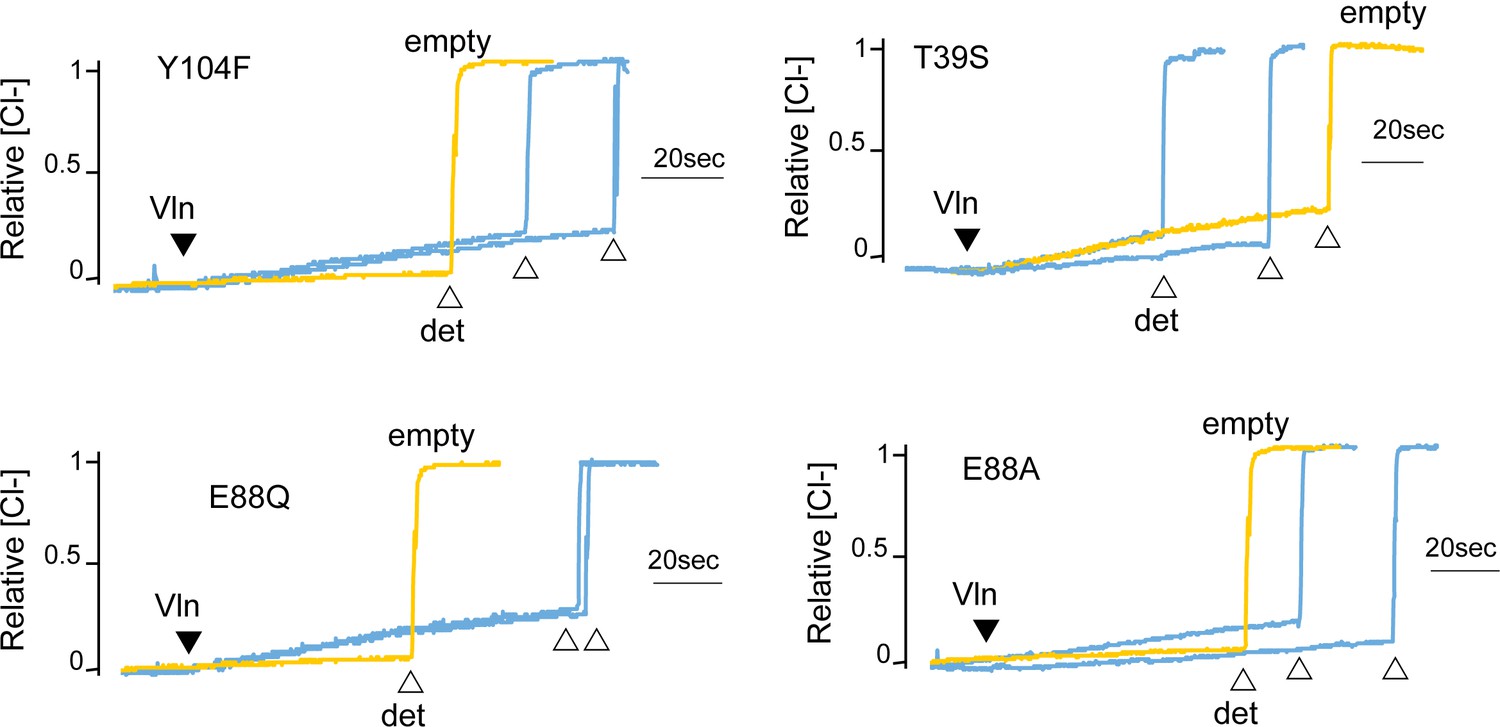
Chloride efflux experiments for fluoride-transporting Fluc-Bpe mutants Y104F, T39S, E88Q, and E88A.
Representative traces from two independent protein preparations are shown. The background rate of chloride leak from empty liposomes is ~40 s−1 (yellow traces). Results from all replicates are tabulated in Table 5.
Figure 4—figure supplement 2
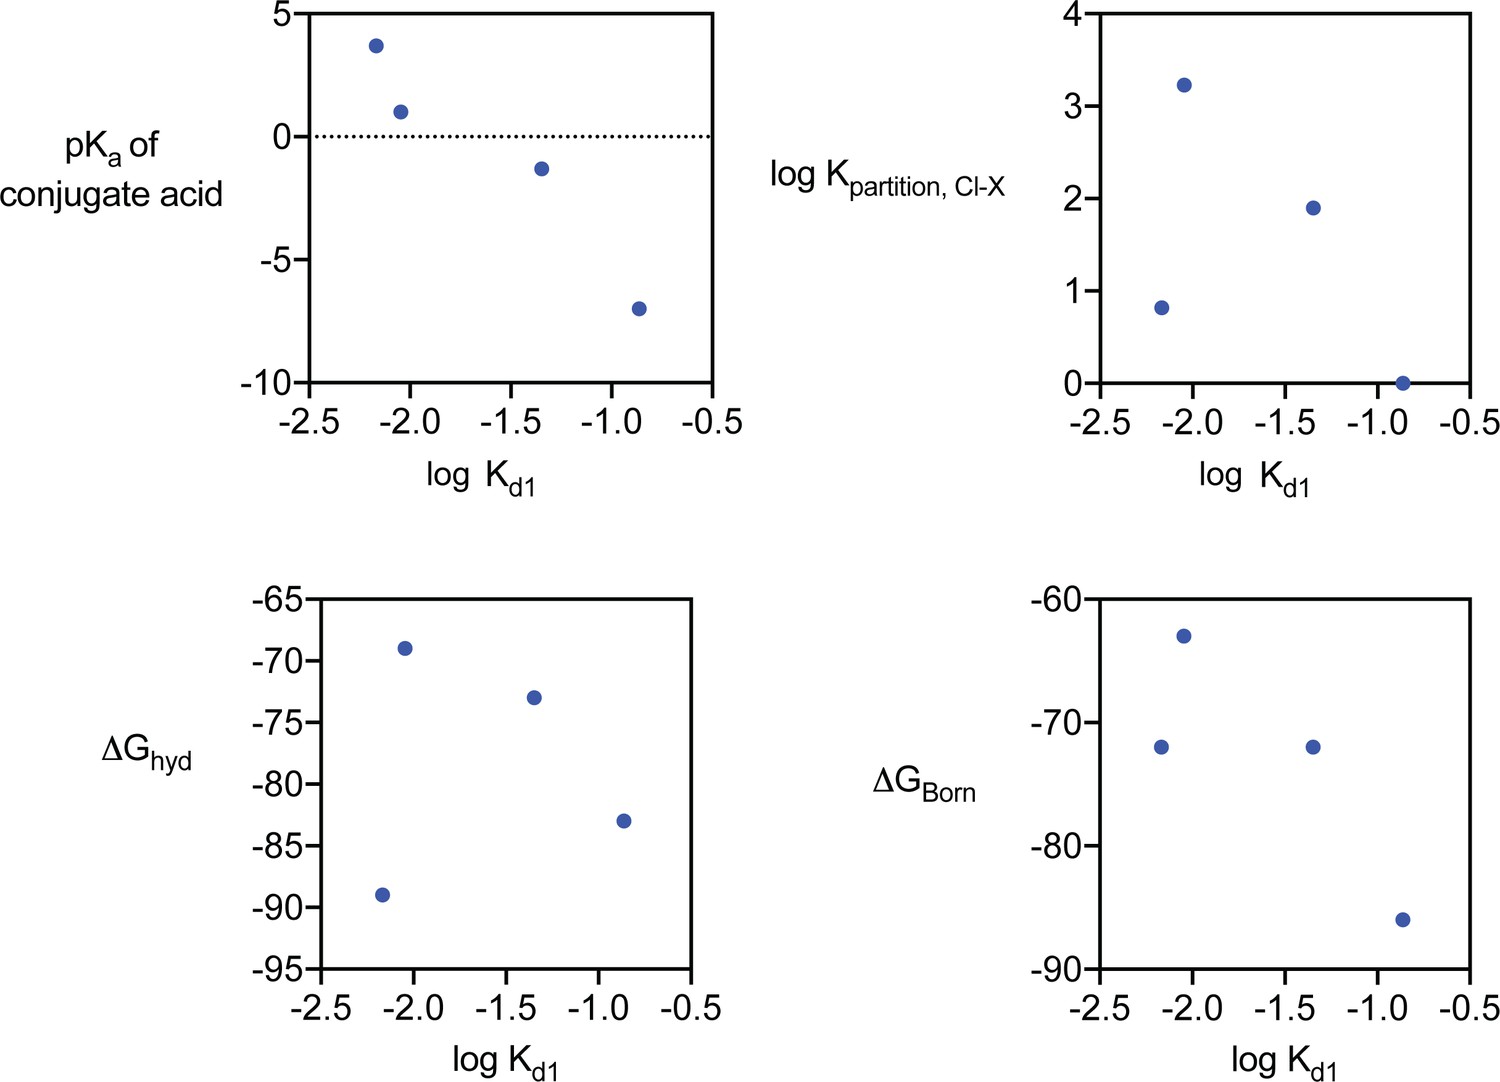
Halide and pseudohalide block of Fluc-Bpe.
Kd1 for anion block, related to physical properties of the anions. Kpartition, Cl-X describes the relative anion partition coefficient between water and Polyvinyl chloride membrane, a measurement that reflects the lyotropic (Hofmeister) series, described in Smith et al., 1999. All values are also reported in Table 3.
Figure 4—figure supplement 3
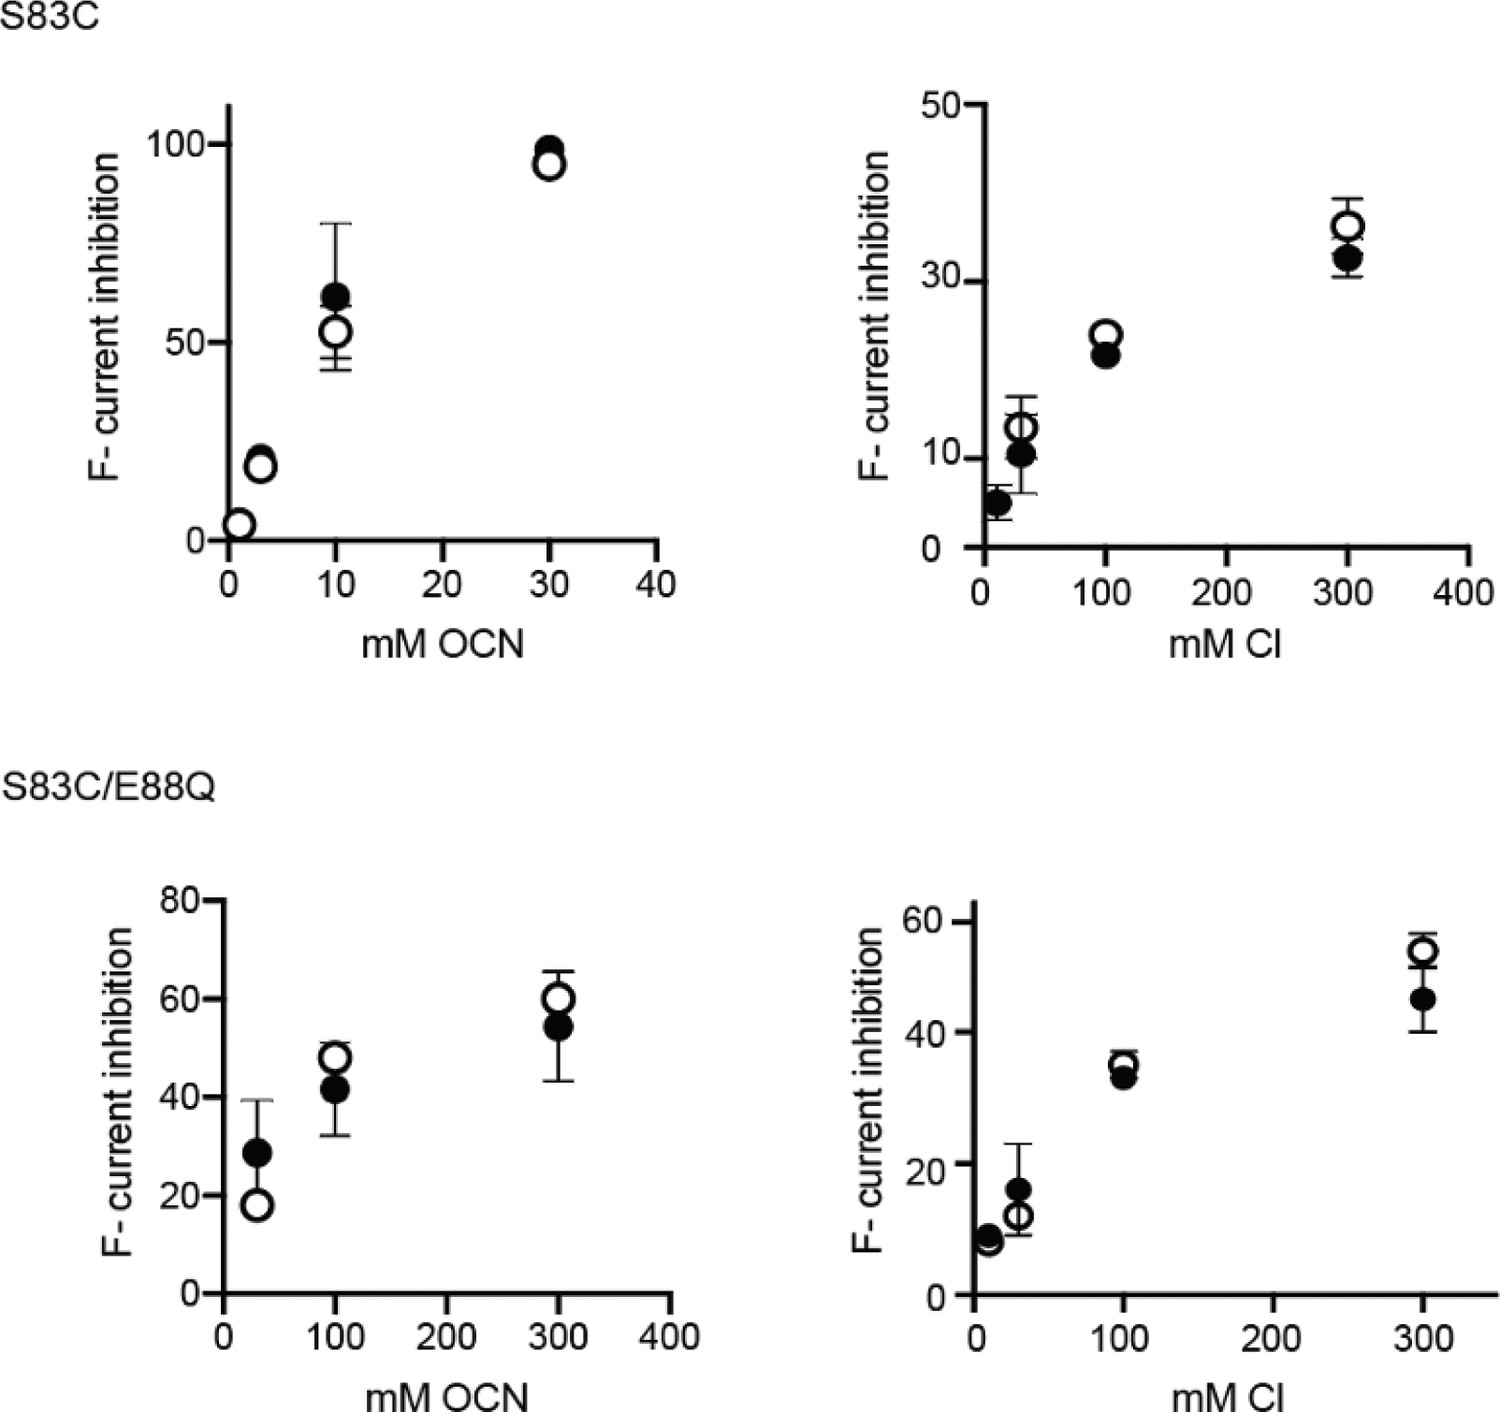
Prep-to-prep comparison of Cl- and OCN- titrations to bilayers with E88Q and WT channels (S83C oriented system).
Datapoints derived from the independent preps are shown in black and white, respectively.
Figure 4—figure supplement 4

Light-scattering experiments to detect OCN- permeation through Fluc-Bpe channels.
For permeant ions, efflux from proteoliposomes upon valinomycin addition (black triangle) causes an increase in 90° light scatter (Stockbridge et al., 2012). Light-scattering traces are shown for empty liposomes (blue) and Fluc-Bpe liposomes (orange), reconstituted with internal KOCN (a), KF (b), or KCl (c).
Figure 4—figure supplement 5
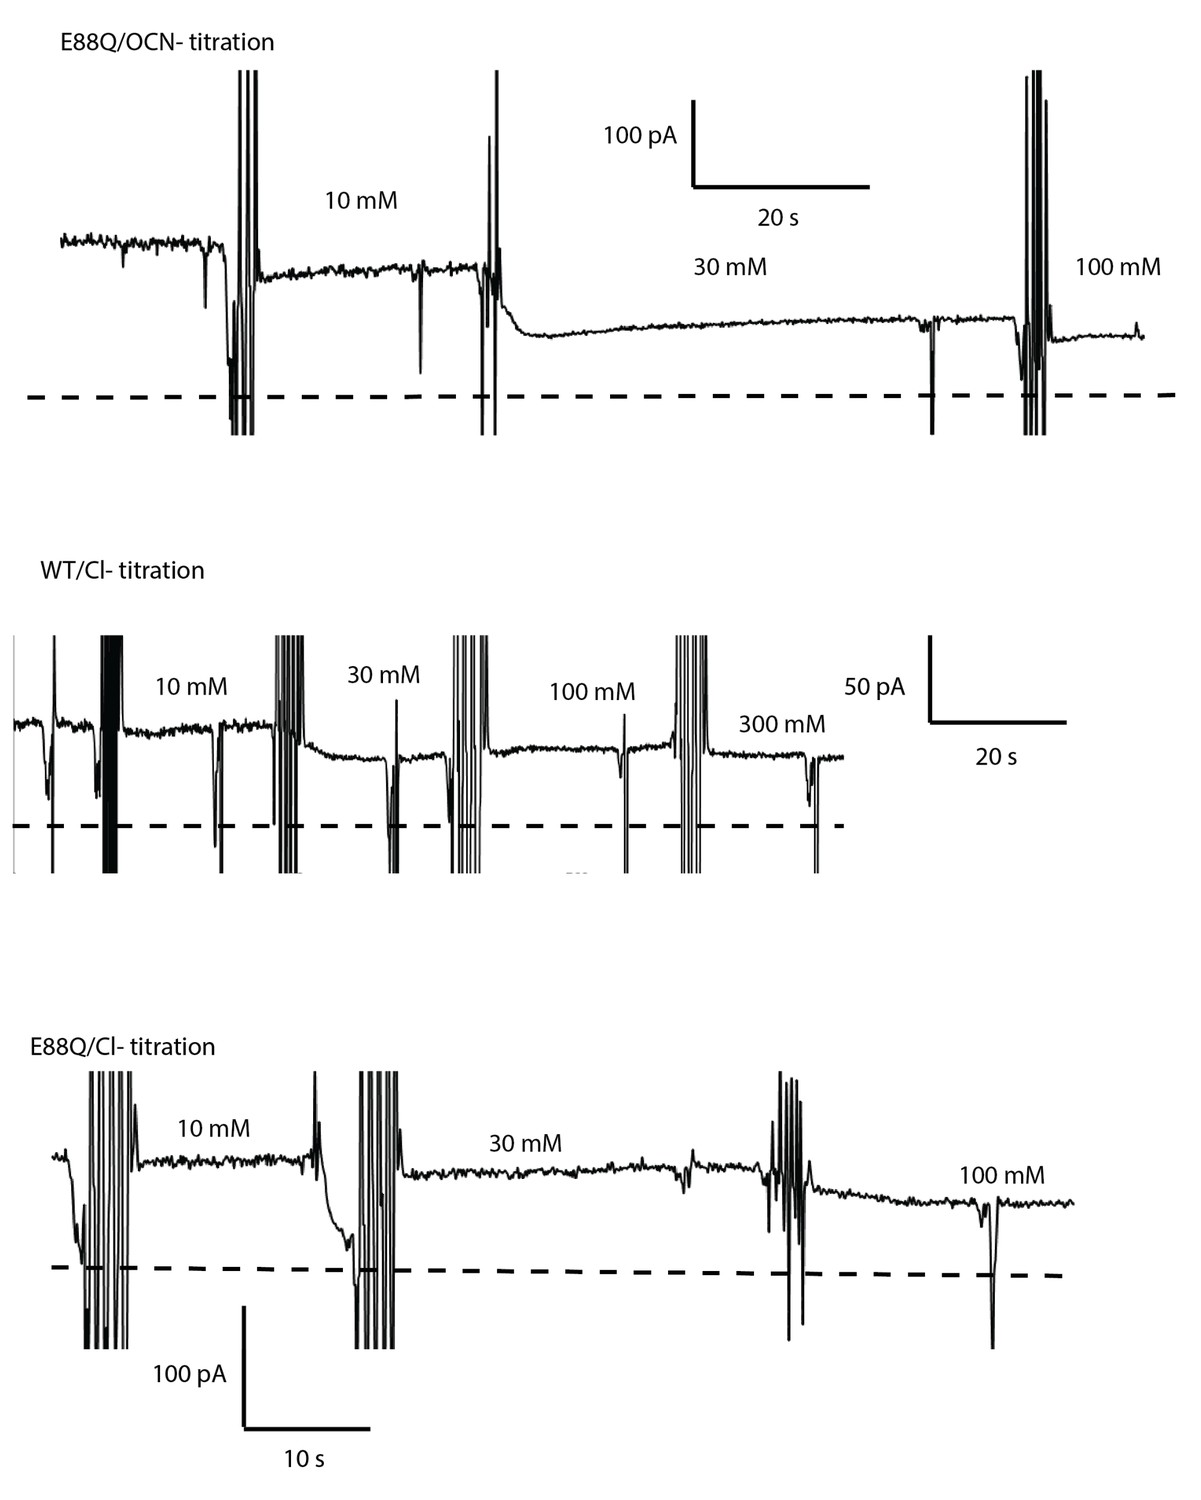
Representative fluoride current recordings with OCN- and Cl- titrations.
Bilayers contain oriented S83C or S83C/E88Q channel. Zero-current level is indicated by the dashed line.
Figure 4—figure supplement 6

Titration of SCN- into WT (a) and E88Q (b) bilayers.
These experiments were performed in the wild-type (WT) background rather than with oriented S83C channels. Solid line represents a fit to a two-site-binding model, with a fractional inhibition of 0.5 at each site. The parameters of the fits are shown in Table 2.
Figure 5 with 1 supplement
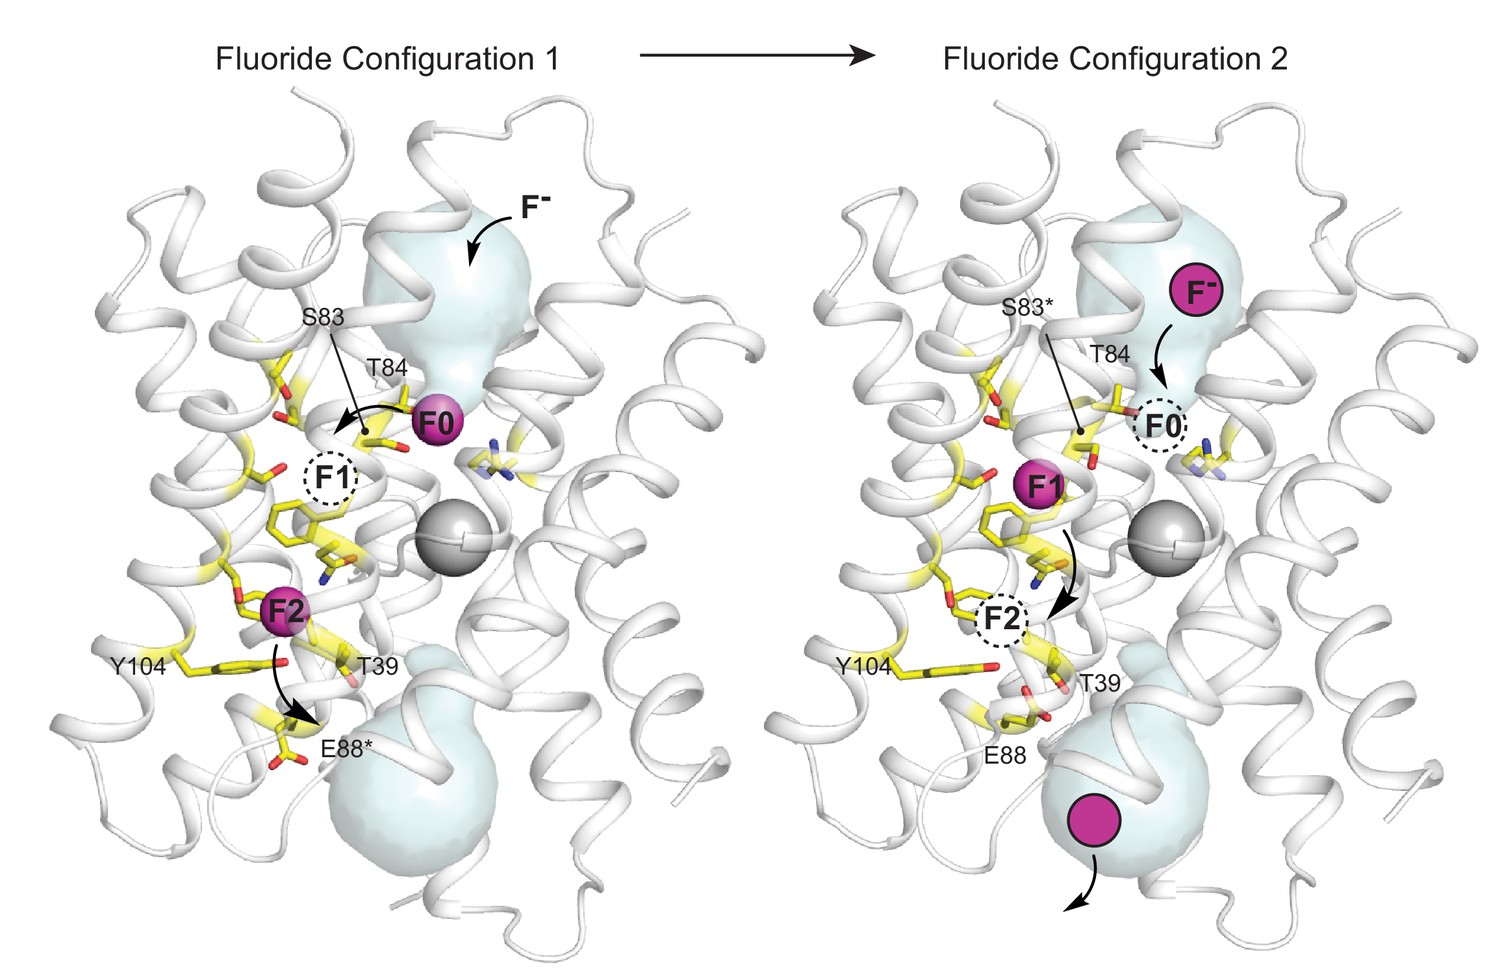
Proposed multi-ion permeation mechanism for Fluc-Bpe.
For clarity, only one pore is shown. Cartoon structure is shown in transparent gray, aqueous vestibules are shown as pale cyan surfaces, and residues that have been shown to contribute to the pore (this work and references Stockbridge et al., 2015; Last et al., 2016; McIlwain et al., 2020; Last et al., 2017) are shown as yellow sticks. The five pore-lining residues identified in this work are labeled. Asterisks indicate that the rotamer shown is hypothetical and has not been observed crystallographically. Occupied fluoride ion sites are shown in pink, unoccupied fluoride-binding sites are shown as dashed circles, and the proposed movement of ions between binding sites is indicated by arrows.
Figure 5—figure supplement 1

Structure of Fluc-Bpe with all sidechains along the permeation pathway labelled.
Image shows the structure of Fluc-Bpe and uses Fluc-Bpe numbering. Sidechains colored in yellow line the permeation pathway. Fluc-Ec2 mutants are not shown if the sidechain is not conserved in Fluc-Bpe. See Table 4 for the phenotype of mutants to these residues.
Author response image 1
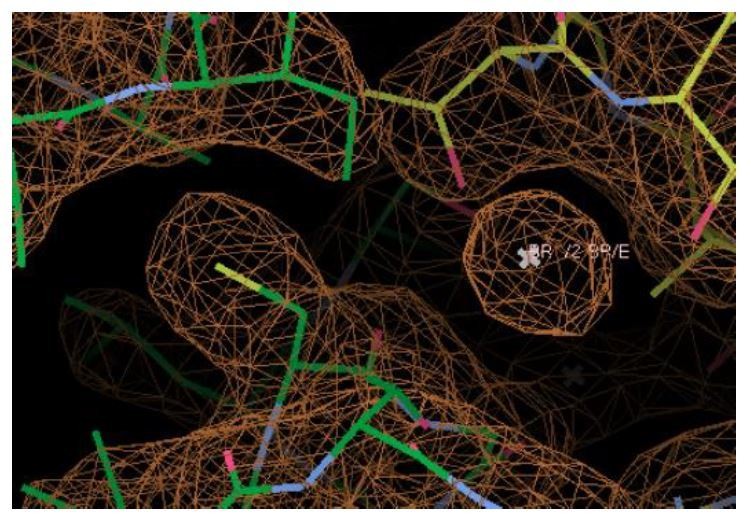
Author response image 2
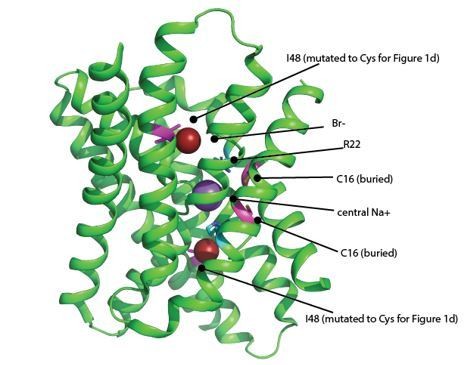
The structure shown here is of the WT channel.
The Br- ions are shown as brick red spheres. Positions that are cysteines in the MTS experiments are colored magenta (I48C and C16). The features that contribute to the electropositive character of the channel are the central sodium ion (purple sphere) and R22 (cyan). These positive charges are in close proximity to both I48C and C16, and are likely to electrostatically influence both positions.
Tables
Table 1
Crystallography data collection and refinement statistics.
| Ec2-WT | Ec2-S81A | Ec2-S81C | Ec2-S81A/T82A | Ec2-S81T | |
|---|---|---|---|---|---|
| Data collection | |||||
| Space group | P41 | P41 | P41 | P41 | P41 |
| Cell dimensions | |||||
| a, b, c (Å) | 87.6, 87.6, 144 | 87.4, 87.4, 141.9 | 87.2, 87.2, 142.7 | 87.5, 87.5, 147.4 | 87.1, 87.1, 145.2 |
| α, β, γ (°) | 90, 90, 90 | 90, 90, 90 | 90, 90, 90 | 90, 90, 90 | 90, 90, 90 |
| Resolution (Å) | 34.4–3.11 (3.3–3.11) | 39.1–2.5 (2.6–2.5) | 46.7–2.9 (3.0–2.9) | 41.9–3.1 (3.3–3.1) | 28.4–2.7 (2.8–2.7) |
| Rmerge | 0.491 (2.31) | 0.140 (1.846) | 0.363 (3.437) | 0.723 (6.147) | 0.217 (2.104) |
| Rpim | 0.203 (0.938) | 0.057 (0.742) | 0.156 (1.434) | 0.290 (2.446) | 0.088 (0.833) |
| Mn I/σI | 7.2 (2.0) | 11.9 (1.7) | 9.8 (2.5) | 8.5 (2.1) | 10.3 (2.0) |
| CC1/2 | 0.996 (0.61) | 0.998 (0.61) | 0.98 (0.59) | 0.998 (0.73) | 0.998 (0.71) |
| Completeness (%) | 99.85 (100) | 99.5 (100) | 99.83 (100) | 99.85 (99.95) | 99.8 (100) |
| Multiplicity | 13.3 (13.9) | 13.7 (14.1) | 12.5 (13.0) | 13.6 (14.0) | 13.8 (14.4) |
| Refinement | |||||
| Resolution | 33.3–3.11 | 37.68–2.5 | 46.65–2.9 | 39.11–3.1 | 28.28–2.7 |
| No. of reflections | 19,500 | 36,591 | 23,580 | 20,055 | 29,192 |
| Rwork/Rfree | 23.7/27.6 | 24.0/25.2 | 22.3/25.8 | 23.0/25.2 | 21.9/25.6 |
| Ramachandran favored | 93.3 | 96.5 | 95.9 | 94.7 | 96.1 |
| Ramachandran outliers | 0.23 | 0.46 | 0.23 | 0.23 | 0.46 |
| r.m.s. deviations | |||||
| Bond length (Å) | 0.005 | 0.002 | 0.002 | 0.008 | 0.008 |
| Bond angle (°) | 0.653 | 0.532 | 0.489 | 0.782 | 0.934 |
| PDB code | 7KKR | 7KKA | 7KKB | 7KK9 | 7KK8 |
-
Statistics for the highest-resolution shell are shown in parentheses. r.m.s., root-mean-square.
Table 2
Fit parameters for anion block experiments.
| Dual-topology channels | Oriented channels | |||||||
|---|---|---|---|---|---|---|---|---|
| WT/OCN- | WT/SCN- | WT/NO3- | WT/Cl- | WT/OCN- | WT/Cl- | E88Q/OCN- | E88Q/Cl- | |
| Ki,1 | 6.8 mM | 9.0 mM | 45 mM | 137 mM | 7.9 mM | 480 mM | 48.9 mM | 213 mM |
| Bmax1 | 0.5 | 0.5 | 0.5 | 0.5 | 1.0 | 1.0 | 1.0 | 1.0 |
| Ki,2 | 100 mM | 190 mM | 530 mM | 1.1 M | -- | -- | -- | -- |
| Bmax2 | 0.5 | 0.5 | 0.5 | 0.5 | -- | -- | -- | -- |
| Dual-topology channels | ||||||||
|---|---|---|---|---|---|---|---|---|
| E88Q/SCN- | E88Q/Cl- | |||||||
| Ki,1 | 398 mM | 542 mM | ||||||
| Bmax1 | 0.5 | 0.5 | ||||||
| Ki,2 | 1.2 M | 5.8 M | ||||||
| Bmax2 | 0.5 | 0.5 | ||||||
Table 3
Fluc-Bpe inhibition and physical properties of halides and pseudohalides.
| Ki,1 (mM) | Ki,2 (mM) | Ki (oriented system, mM) | Radius (Å) | pKa | ΔGhyd (kcal/mol) | ΔGBorn (kcal/mol) | Log KCl-X* | |
|---|---|---|---|---|---|---|---|---|
| F- | -- | -- | -- | 1.33 | 3.2 | −112 | −114 | −1.5 |
| Cl- | 137 | 1100 | 480 | 1.81 | −7 | −83 | −86 | 0 |
| NO3- | 45 | 530 | -- | 1.99 | −1.3 | −73 | −72 | 1.9 |
| SCN- | 9.0 | 190 | -- | 2.49 | 1 | −69 | −63 | 3.23 |
| OCN- | 6.8 | 107 | 7.9 | 2.16 | 3.7 | −89 | −72 | 0.82 |
-
*Relative anion partition coefficient between water and PVC membrane, a measurement that reflects the lyotropic (Hofmeister) series, described in Smith et al., 1999.
Table 4
Compiled results of anion transport experiments for Fluc-Bpe and Fluc-Ec2.
Results from Fluc-Ec2 are shown in italics, with numbering according to Fluc-Bpe for reference to the structure in Figure 5—figure supplement 1.
| Reference | Mutant (no F- permeation) | Mutant (F- permeation retained, no Cl- permeation) |
|---|---|---|
| Stockbridge et al., 2015 | F82I, F85I, N43D | |
| Last et al., 2016 | F82I, F85I | |
| Last et al., 2017 | F82Y, F82S, F82A, F82L, F82I, F82T, F85Y, F85S, F85A | S112A, T116V, T116I, S83A, F82M |
| McIlwain et al., 2020 | N43S, R22K | |
| This work | S83T, S83C, T39A, T39V, T39C, T39N, E88K, Y104S, Y014H, Y104W, Y104I | S83A, S83A/S84A, Y104F, T39S, E88Q, E88D, E88A |
Key resources table
| Reagent type (species) or resource | Designation | Source or reference | Identifiers | Additional information |
|---|---|---|---|---|
| Gene (Bordetella pertussis) | Fluc-Bpe | NCBI | WP_003818609.1 | Bears mutation R28K to increase yield (PMID:26344196) |
| Gene (Escherichia coli virulence plasmid) | Fluc-Ec2 | NCBI | WP_001318207.1 | Bears mutation R25K to increase yield (PMID:26344196). For cysteine modification experiments, C74A (this paper — see Figure 1—figure supplement 1). |
| Recombinant DNA reagent | Fluc-Bpe in pET21a (plasmid) | PMID:26344196 | Expression vector for Fluc-Bpe. Available upon request. | |
| Recombinant DNA reagent | Fluc-Ec2 in pET21a (plasmid) | PMID:26344196 | Expression vector for Fluc-Ec2. Available upon request. | |
| Chemical compound, drug | Isethionic acid | Wako Chemicals, Richmond VA | 107-36-8 | |
| Chemical compound, drug | MTSES | Toronto Research Chemicals | S672000 | |
| Chemical compound, drug | E. coli polar lipids | Avanti, Alabaster, AL | #100600C | |
| Chemical compound, drug | n-decyl-β -D-maltopyranoside | Anatrace, Maumee, OH | D322 | |
| Other | Monobodies S9 and S12 | PMID:25290819 | Purified from E. coli according to the protocol described in the reference. PMID:25290819 |
Table 5
Liposome efflux experiments: compiled results from all replicates.
| Construct | Anion | Figure | Rate (ions/s): Prep 1 | Rate (ions/s): Prep 2 | Mean ± SEM |
|---|---|---|---|---|---|
| Ec2 WT | F- | 1-S1 | >104, >104 | >104, >104 | >104 |
| Ec2 C74A | F- | 1-S1 | >104, >104 | >104, >104 | >104 |
| Ec2 WT | F- | 2a | >104, >104 | >104, >104 | >104 |
| Ec2 S81A | F- | 2a | >104, >104, >104 | >104, >104, >104 | >104 |
| Ec2 S81T | F- | 2a | <100, <100 | <100, <100 | <100 |
| Ec2 S81C | F- | 2a | <100, <100 | <100, <100 | <100 |
| Ec2 S81A/S82A | F- | 2a | 8860, 6400 | 9640, 7840, 8860 | 8320 ± 560 ions/sec |
| Ec2 S81A/S82A | Cl- | 2-S2 | <50, <50 | <50, <50 | <50 |
| Bpe S83A/T84A | Cl- | 2-S2 | <50, <50 | <50, <50 | <50 |
| Bpe T39V | F- | 3-S1 | <100, <100 | <100, <100 | <100 |
| Bpe T39S | F- | 3-S1 | >104, >104, >104 | >104, >104 | >104 |
| Bpe T39C | F- | 3-S1 | <100, <100, <100 | <100, <100 | <100 |
| Bpe T39A | F- | 3-S1 | <100, <100 | <100, <100 | <100 |
| Bpe T39N | F- | 3-S1 | <100 | <100, <100 | <100 |
| Bpe E88A | F- | 3-S1 | >104, >104 | >104, >104, >104 | >104 |
| Bpe E88Q | F- | 3-S1 | >104, >104 | >104, >104, >104 | >104 |
| Bpe E88D | F- | 3-S1 | >104, >104 | >104, >104, >104 | >104 |
| Bpe E88K | F- | 3-S1 | <100 | <100, <100 | <100 |
| Bpe Y104F | F- | 3-S1 | >104, >104, >104 | >104, >104 | >104 |
| Bpe Y104S | F- | 3-S1 | <100, <100, <100 | <100, <100 | <100 |
| Bpe Y104H | F- | 3-S1 | <100, <100 | <100, <100 | <100 |
| Bpe Y104I | F- | 3-S1 | <100, <100 | <100 | <100 |
| Bpe I50W | F- | 1-S1 | 600, 720, 960 | 650, 550, 720 | 700 ± 60 ions/sec |
| Bpe Y104F | Cl- | 4-S1 | <50, <50 | <50, <50 | <50 |
| Bpe T39S | Cl- | 4-S1 | <50, <50 | <50, <50 | <50 |
| Bpe E88Q | Cl- | 4-S1 | <50, <50 | <50, <50 | <50 |
| Bpe E88A | Cl- | 4-S1 | <50, <50 | <50, <50 | <50 |
Additional files
Download links
A two-part list of links to download the article, or parts of the article, in various formats.
Downloads (link to download the article as PDF)
Open citations (links to open the citations from this article in various online reference manager services)
Cite this article (links to download the citations from this article in formats compatible with various reference manager tools)
The fluoride permeation pathway and anion recognition in Fluc family fluoride channels
eLife 10:e69482.
https://doi.org/10.7554/eLife.69482


