A functional topography within the cholinergic basal forebrain for encoding sensory cues and behavioral reinforcement outcomes
- Eaton-Peabody Laboratories, Massachusetts Eye and Ear Infirmary, United States
- Department of Neurology, Massachusetts General Hospital, United States
- Chinese Institute for Brain Research, China
- State Key Laboratory of Membrane Biology, Peking University School of Life Sciences; PKU-IDG/McGovern Institute for Brain Research; Peking-Tsinghua Center for Life Sciences, Beijing, China
- Department of Otolaryngology - Head and Neck Surgery, Harvard Medical School, United States
Figures
Figure 1 with 1 supplement
Bulk basal forebrain cholinergic neuron (BFCN) activity and cortical acetylcholine release closely correspond with pupil-indexed global brain state.
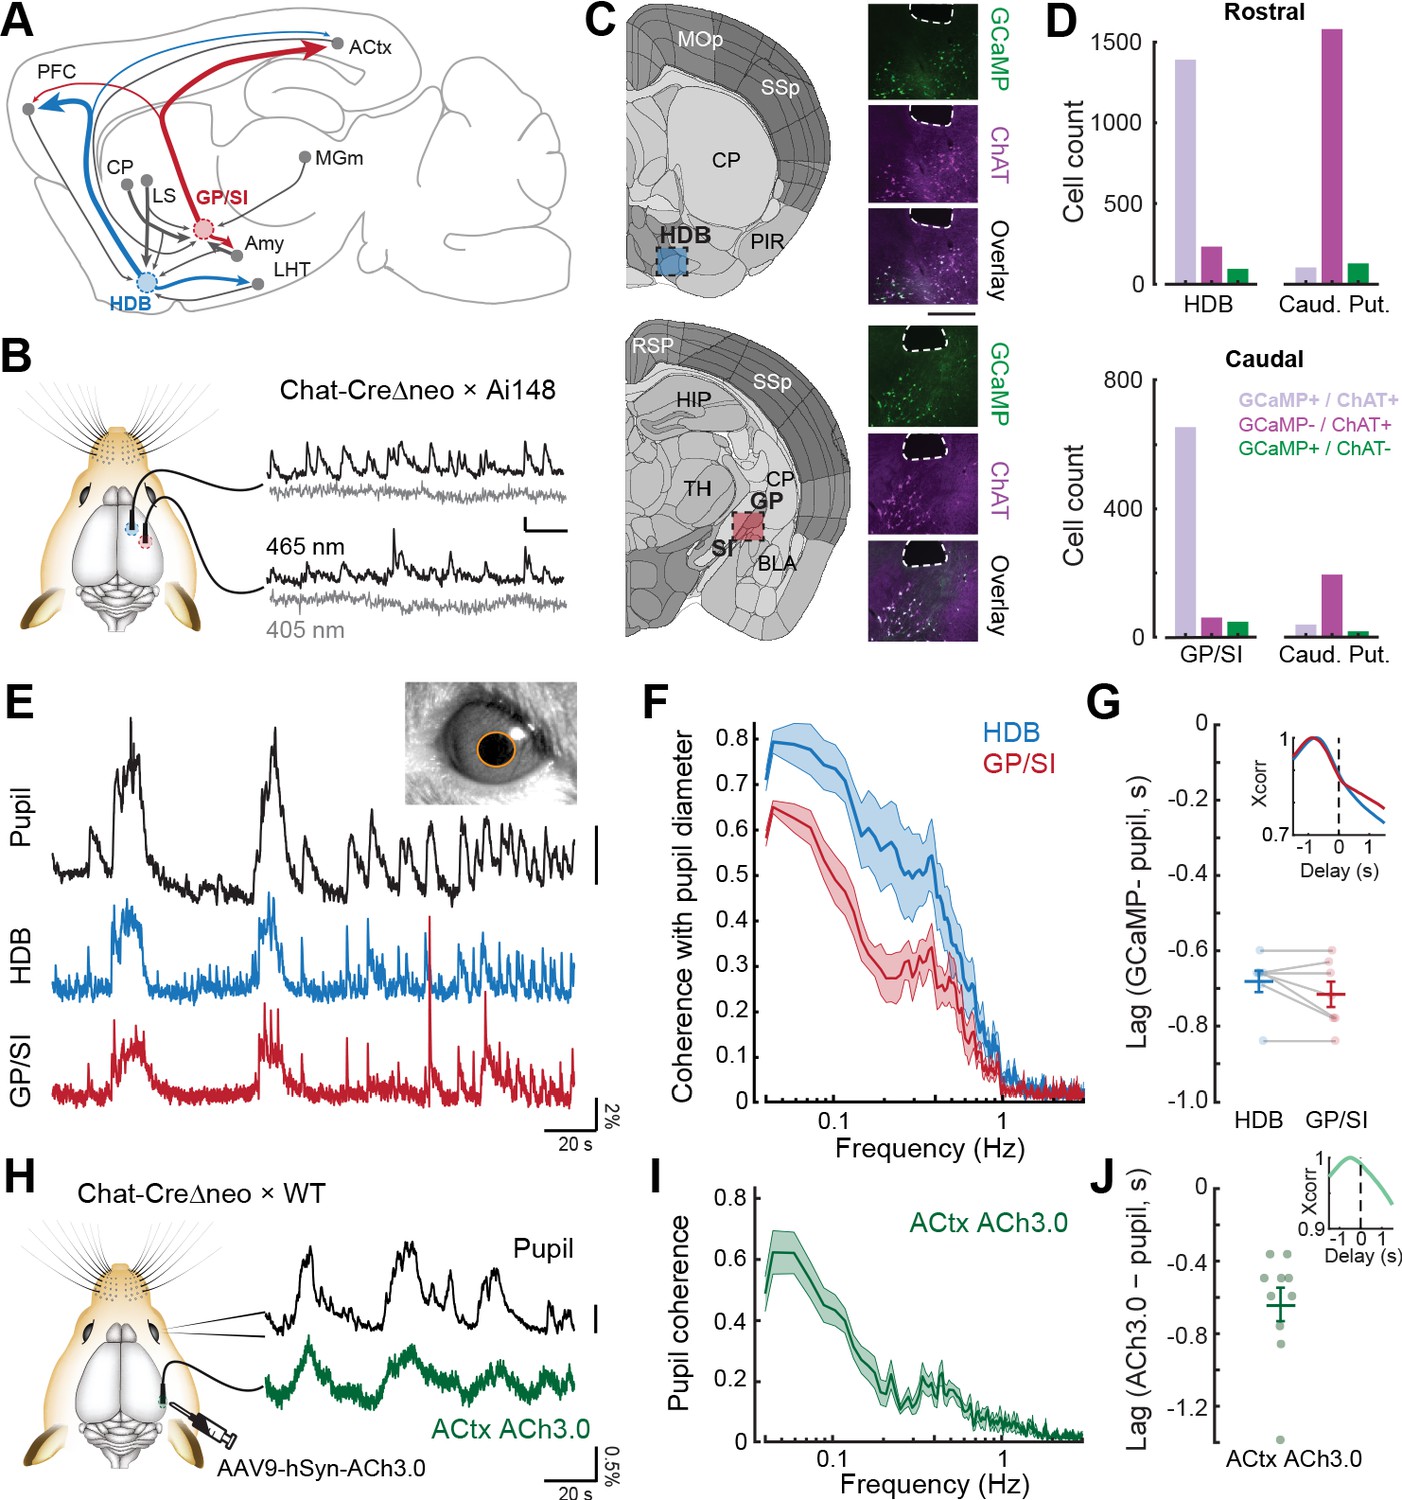
(A) Mid-sagittal diagram of the mouse brain depicting the diversity in major inputs (gray) and outputs (colored) between a rostroventral basal forebrain structure, the horizontal limb of the diagonal band of Broca (HDB), and the caudodorsal tail of the basal forebrain, the boundary of the globus pallidus and substantia innominata (GP/SI). ACtx = auditory cortex, MGm = medial subdivision of the medial geniculate body, LHT = lateral hypothalamus, Amy = amygdala, LS = lateral septum, CP = caudate putamen, PFC = prefrontal cortex. (B) Dual bulk fiber-based calcium imaging from basal forebrain cholinergic neurons was performed from the HDB and GP/SI of ChAT-Cre-Δneo × Ai148 mice. Dual wavelength imaging allowed separate visualization of calcium-independent fluorescence (405 nm) from calcium-dependent fluorescence (465 nm). Vertical and horizontal scale bars reflect 1% DF/F and 5 s, respectively. (C) Coronal diagrams are adapted from the adult mouse coronal reference atlas created by the Allen Institute for Brain Science. Diagrams illustrate anatomical landmarks at the rostral (top) and caudal (bottom) imaging locations. Post-mortem fluorescence photomicrographs of brain sections immunolabeled for the ChAT protein depict the outline of the fiber path and the position of HDB, GP, and SI. GCaMP and ChAT fluorescence channels and their overlay to illustrate the strong co-localization of GCaMP in ChAT neurons within HDB and GP/SI regions near the fiber tip. Scale bar = 0.5 mm. (D) Cells from regions of interest below the fiber tip were counted based on their expression of GCaMP-only (green), ChAT-only (magenta), or both GCaMP and ChAT (lavender). The same analysis was performed on cells within the caudate putamen of the dorsal striatrum. Numbers indicate the number of neurons in the corresponding category. (E) Isoluminous spontaneous pupil dilations in an example mouse were visualized in combination with GCaMP imaging from HDB and GP/SI. Pupil scale bar depicts a five pixel2 areal change. (F) Mean ± SEM coherence of HDB and GP/SI GCaMP activity with pupil-indexed brain state in isoluminous conditions without any explicit environmental stimuli or task demands. N = 7 mice provided data for pupil, HDB, and GP/SI. Basal forebrain GCaMP signals closely track slow (<0.5 Hz) changes in pupil diameter, though the correspondence is stronger overall in HDB than in GP/SI (two-way repeated measures ANOVA, main effect for brain structure, F = 12.58, p = 0.01). (G) HDB and GP/SI GCaMP changes lead pupil fluctuations by approximately 0.7 s. Inset: Cross-correlation of the HDB and GP/SI GCaMP signals with pupil fluctuations. Individual data points depict the time value corresponding to the peak of the cross-correlograms from individual mice. Mean ± SEM values are provided at left and right. (H) Tapered fiber imaging of the ACh3.0 fluorescence during pupil videography. Scale bar depicts a five pixel diameter change. (I) Mean ± SEM coherence of ACtx ACh3.0 with pupil-indexed arousal in isoluminous conditions without any explicit environmental stimuli or task demands. N = 10 mice. Pupil coherence was qualitatively similar to GP/SI GCaMP coherence, which is expected on account of its stronger anatomical projection to ACtx. (J) ACtx ACh3.0 changes lead pupil fluctuations by approximately 0.6 s. Inset: Cross-correlation of the ACtx ACh3.0 signal with pupil fluctuations. Individual data points depict the time value corresponding to the peak of the cross-correlograms from individual mice. Mean ± SEM values are provided at left and right.
-
Figure 1—source data 1
Counts of GCaMP-expressing and ChAT-expressing cells in horizontal limb of the diagonal band of Broca (HDB), globus pallidus and substantia innominata (GP/SI), and the rostral and caudal caudate putamen.
- https://cdn.elifesciences.org/articles/69514/elife-69514-fig1-data1-v2.xlsx
Figure 1—figure supplement 1
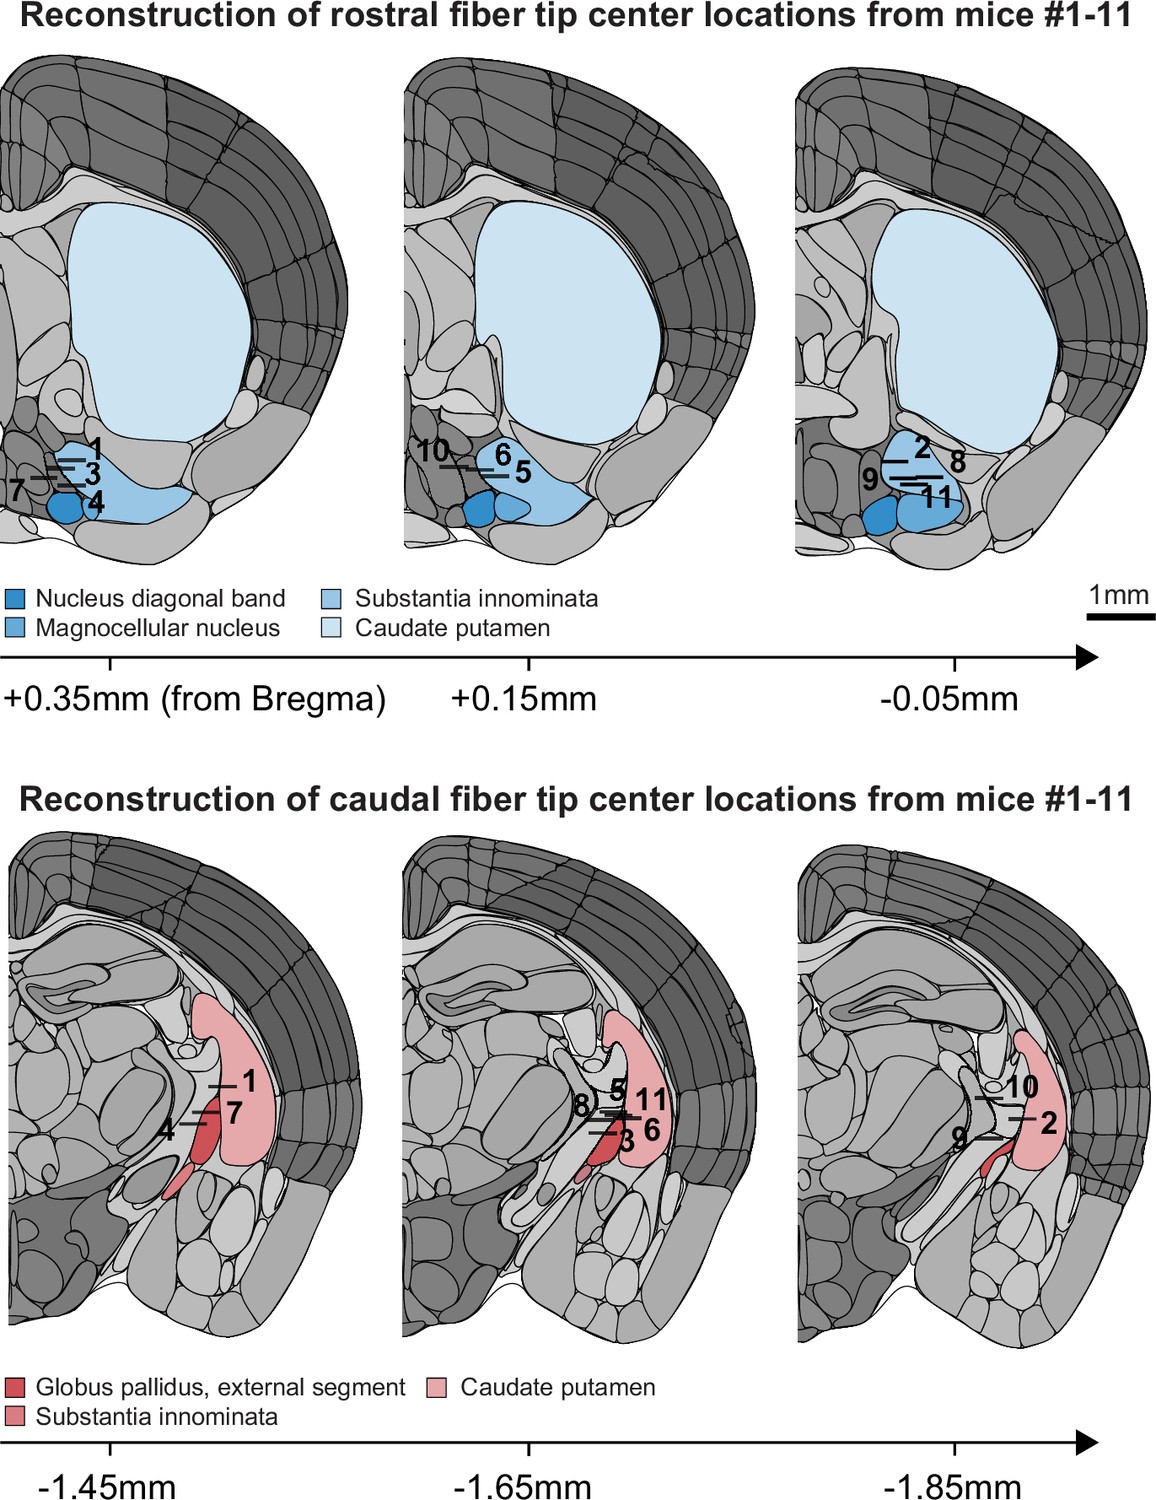
Anatomical locations of horizontal limb of the diagonal band of Broca (HDB) and globus pallidus and substantia innominata (GP/SI) fiber tips.
The center of each 0.4 mm fiber implanted in rostral (top) and caudal (bottom) locations of the basal forebrain were identified in post-mortem sections of the 11 mice used throughout our study. Coronal diagrams are adapted from the 2011 adult mouse coronal reference atlas created by the Allen Institute for Brain Science. Approximate distance from Bregma was identified from corresponding sections from the 2008 P56 mouse coronal atlas also created by the Allen Institute for Brain Science (Lein et al., 2007).
© 2011, Allen Institute for Brain Science. Coronal diagrams are from the Allen Mouse Brain Atlas, available at https://mouse.brain-map.org/static/atlas (plates #50, 52, 54, 68, 70 and 72 used in this figure supplement). These diagrams are not available under the terms of a Creative Commons Attribution License, and further reproductions of these diagrams should adhere to the Allen Institute's Citation policy (https://alleninstitute.org/legal/citation-policy/).
Figure 2 with 2 supplements
Strong, rapidly habituating responses to unconditioned auditory - but not visual – stimuli in globus pallidus and substantia innominata (GP/SI) cholinergic neurons.
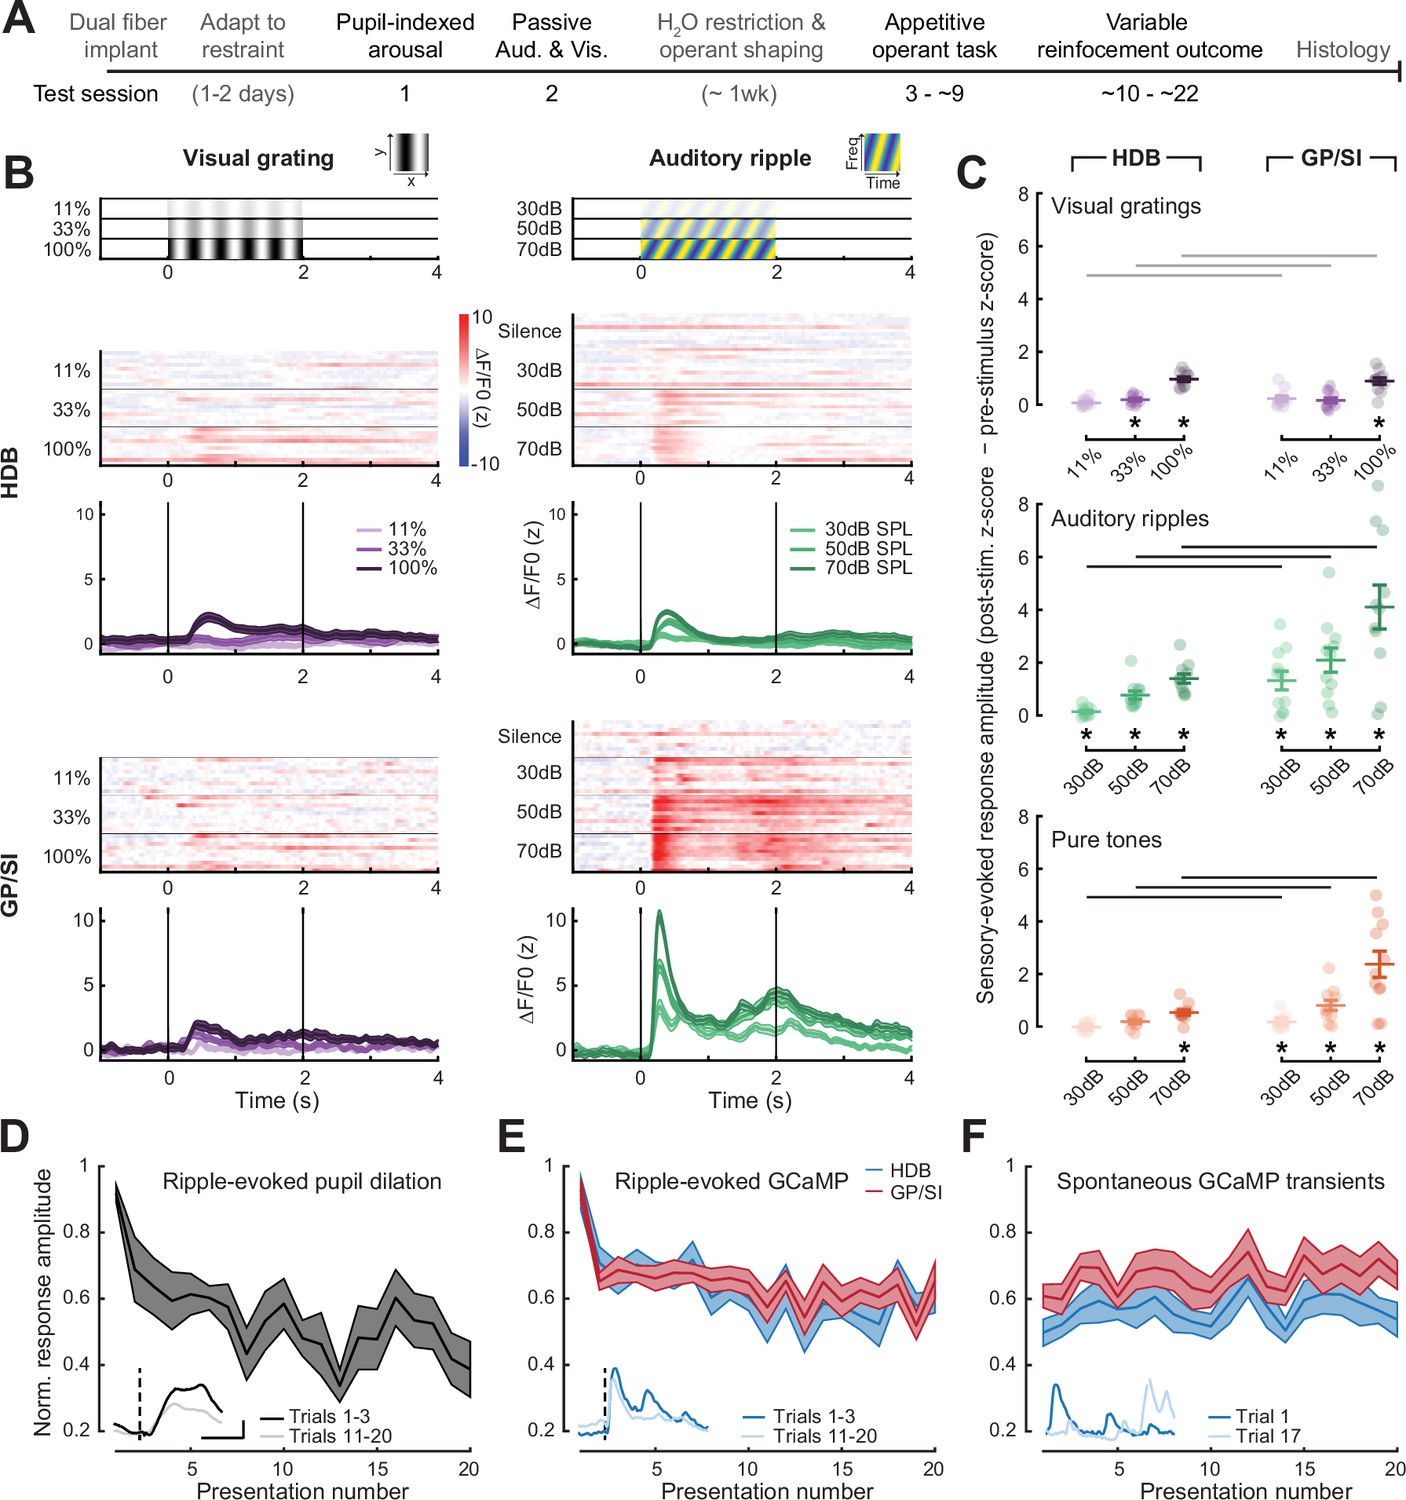
(A) Timeline for measurement sessions (black text) and procedures (gray text) performed in each of 11 ChAT-Cre-Δneo × Ai148 mice. Basal forebrain cholinergic neuron (BFCN) responses to unconditioned auditory and visual stimuli described below were measured during test session 2. (B) BFCN responses to drifting visual gratings of varying contrast (left) and auditory spectrotemporal ripples of varying sound levels (right) are shown for an example mouse. Heatmaps depict fractional change values for individual trials in horizontal limb of the diagonal band of Broca (HDB) (top row) and GP/SI (bottom row). Line plots depict mean ± SEM z-scored fractional change across all trials. Vertical bars denote onset and offset of the 2 s stimulus period. (C) Evoked response amplitudes to auditory and visual stimuli in HDB (left column) and GP/SI (right column). Circles denote individual mice (N = 11 for all conditions), bars denote sample mean and SEM sensory response amplitudes. Responses at variable stimulus intensities are averaged across horizontal/vertical visual orientations (top), upward and downward auditory frequency modulation (middle), and low, middle, and high auditory pure tone frequencies (bottom). Refer to Figure 2—figure supplement 1 for a comparison of responses to each direction of visual and auditory stimulus change. Sensory-evoked cholinergic responses to visual gratings and auditory ripples increase with intensity and contrast, but are stronger overall in GP/SI, particularly in the auditory modality (three-way repeated measures ANOVA with structure, stimulus level, and modality as independent variables: main effect for structure, F = 10.09, p = 0.01; main effect for stimulus level, F = 63.52, p = 2 × 10⁻⁹; main effect for modality, F = 20.83, p = 0.001; modality × structure × level interaction term, F = 9.1, p = 0.002). Asterisks denote a significant difference in the peak post- and pre-stimulus response (paired t-test, p < 0.05, corrected for multiple comparisons). Black and gray horizontal bars denote significant and non-significant differences, respectively, in sensory-evoked response amplitudes between HDB and GP/SI (paired t-test, p < 0.05, corrected for multiple comparisons). (D) Mean ± SEM normalized pupil dilations evoked by 70 dB SPL auditory ripples significantly decreased over 20 presentations (one-way repeated measures ANOVA, F = 2.85, p = 0.0003; N = 7 mice). Inset: Mean sound-evoked pupil diameter change in an example mouse for trials 1–3 vs. 11–20. Inset scale bar = 1 z-score and 2 s and applies to all inset panels below. Vertical dashed line = onset of the 2 s stimulus. (E) Mean ± SEM normalized BFCN response to auditory ripples were significantly and equivalently reduced in HDB and GP/SI over 20 presentations (two-way repeated measures ANOVA with structure and presentation number as independent variables: main effect for structure, F = 0.51, p = 0.49; main effect for presentation number, F = 6.11, p = 5 × 10–12; N = 11 mice). Insets: Mean response from an HDB fiber of an example mouse for trials 1–3 vs. 11–20. Figure 2—figure supplement 2 presents habituation functions for other auditory and visual stimulus types at varying stimulus intensities. (F) Mean ± SEM normalized BFCN spontaneous GCaMP transient amplitudes did not change over 20 measurement blocks (two-way repeated measures ANOVA with structure and presentation number as independent variables: main effect for structure, F = 0.80, p = 0.70; presentation number × structure interaction term, F = 0.57, p = 0.93; N = 11 mice). Insets: Spontaneous transients from an HDB fiber in two trials for which no stimulus was presented.
Figure 2—figure supplement 1
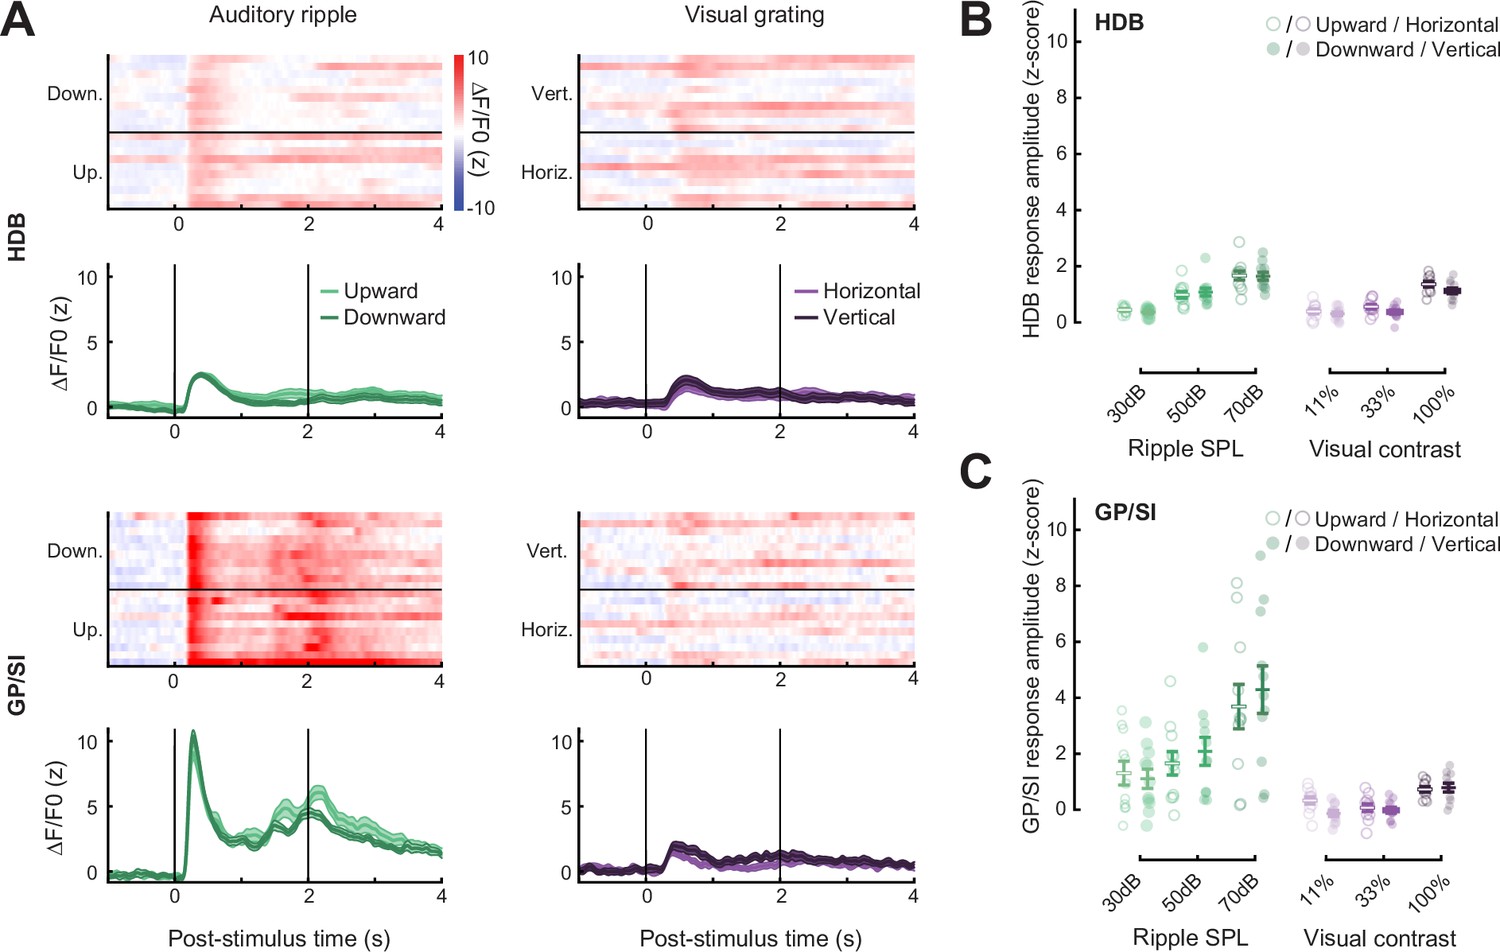
Equivalent basal forebrain cholinergic neuron (BFCN) responses to varying directions of auditory and visual drifting gratings.
(A) BFCN responses to auditory spectrotemporal ripples (left column) and visual gratings (right column) of varying direction are shown for an example mouse. Heatmaps depict fractional change values for individual trials in horizontal limb of the diagonal band of Broca (HDB) (top row) and globus pallidus and substantia innominata (GP/SI) (bottom row). Line plots depict mean ± SEM z-scored fractional change across all trials. Vertical bars denote onset and offset of the 2 s stimulus period. (B–C) Evoked response amplitudes to auditory and visual stimuli in HDB (B) and GP/SI (C). Circles denote individual mice (N = 11 for all conditions), bars denote sample mean and SEM sensory response amplitudes. Responses at variable stimulus intensities are plotted for each direction of spatial and spectral change, but no differences in response amplitude were identified for visual or auditory direction (three-way repeated measures ANOVAs with structure, stimulus level, and direction as independent variables: main effect for visual grating direction, F = 1.37, p = 0.26; main effect for ripple direction, F = 0.37, p = 0.55).
Figure 2—figure supplement 2
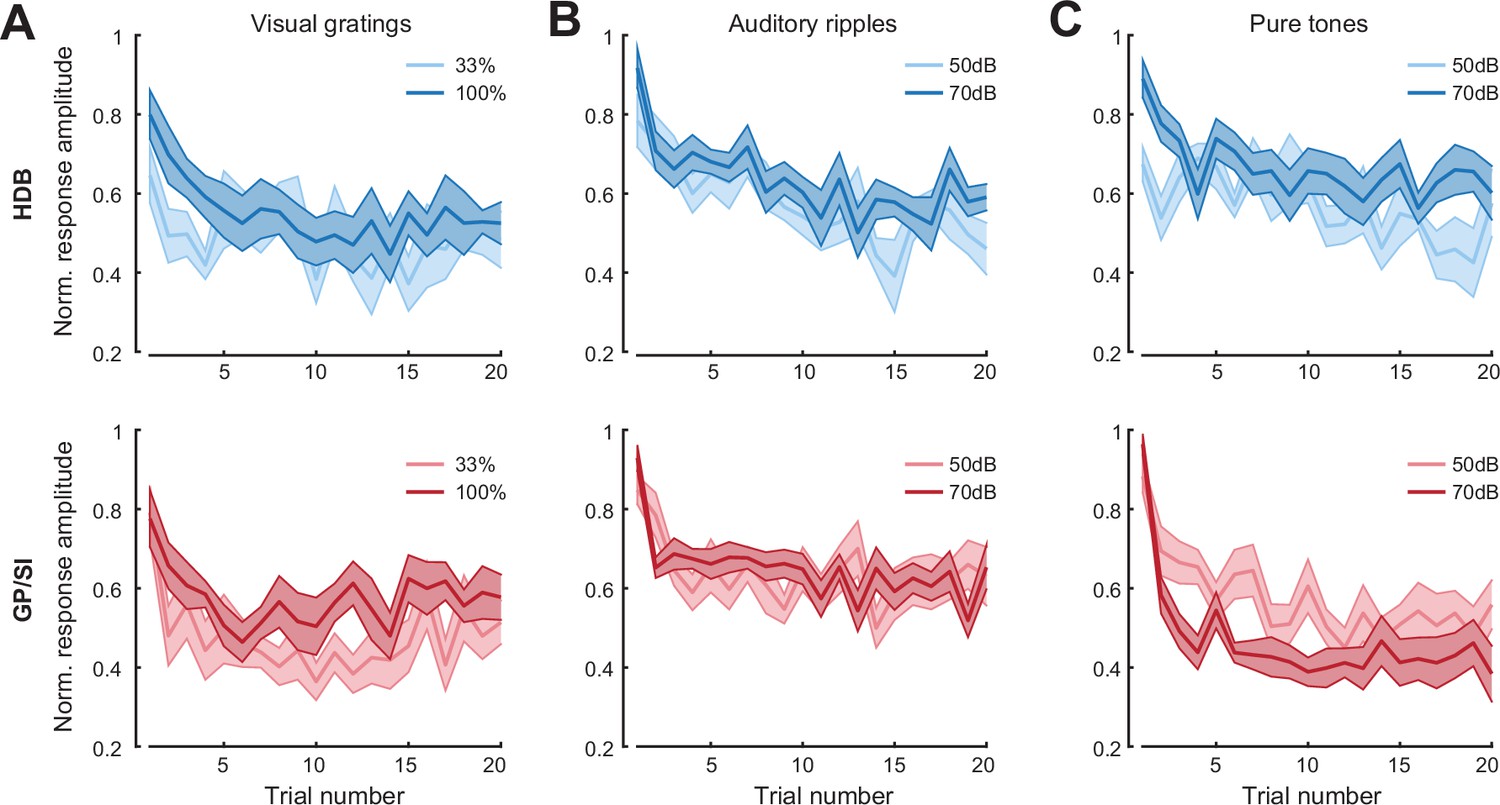
Basal forebrain cholinergic neuron (BFCN) responses to unconditioned sensory cues rapidly habituate across stimulus type, modality, and intensity.
(A) Mean ± SEM normalized BFCN response to visual drifting gratings were significantly and equivalently reduced in horizontal limb of the diagonal band of Broca (HDB) (top) and globus pallidus and substantia innominata (GP/SI) (bottom) over 20 presentations. Three-way repeated measures ANOVA with structure, trial number, and intensity as independent variables: main effect for structure, F = 0.006, p = 0.94; main effect for trial number, F = 2.76, p = 0.0002; main effect for intensity, F = 47.69, p = 0.00004; trial × level interaction term, F = 0.6, p = 0.9; N = 11 mice. (B) Mean ± SEM normalized BFCN response to auditory ripples were significantly and equivalently reduced in HDB (top) and GP/SI (bottom) over 20 presentations. Three-way repeated measures ANOVA with structure, trial number, and intensity as independent variables: main effect for structure, F = 2.77, p = 0.13; main effect for trial number, F = 5.95, p = 2 x 10–11; main effect for intensity, F = 2.16, p = 0.17; trial × level interaction term, F = 1.43, p = 0.12; N = 11 mice. (C) Mean ± SEM normalized BFCN response to pure tones were significantly reduced in HDB (top) and GP/SI (bottom) over 20 presentations. Three-way repeated measures ANOVA with structure, trial number, and intensity as independent variables: main effect for structure, F = 4.64, p = 0.06; main effect for trial number, F = 9.26, p = 2 x 10–18; main effect for intensity, F = 0.08, p = 0.78; structure × intensity interaction term, F = 15.09, p = 0.003; N = 11 mice.
Figure 3 with 1 supplement
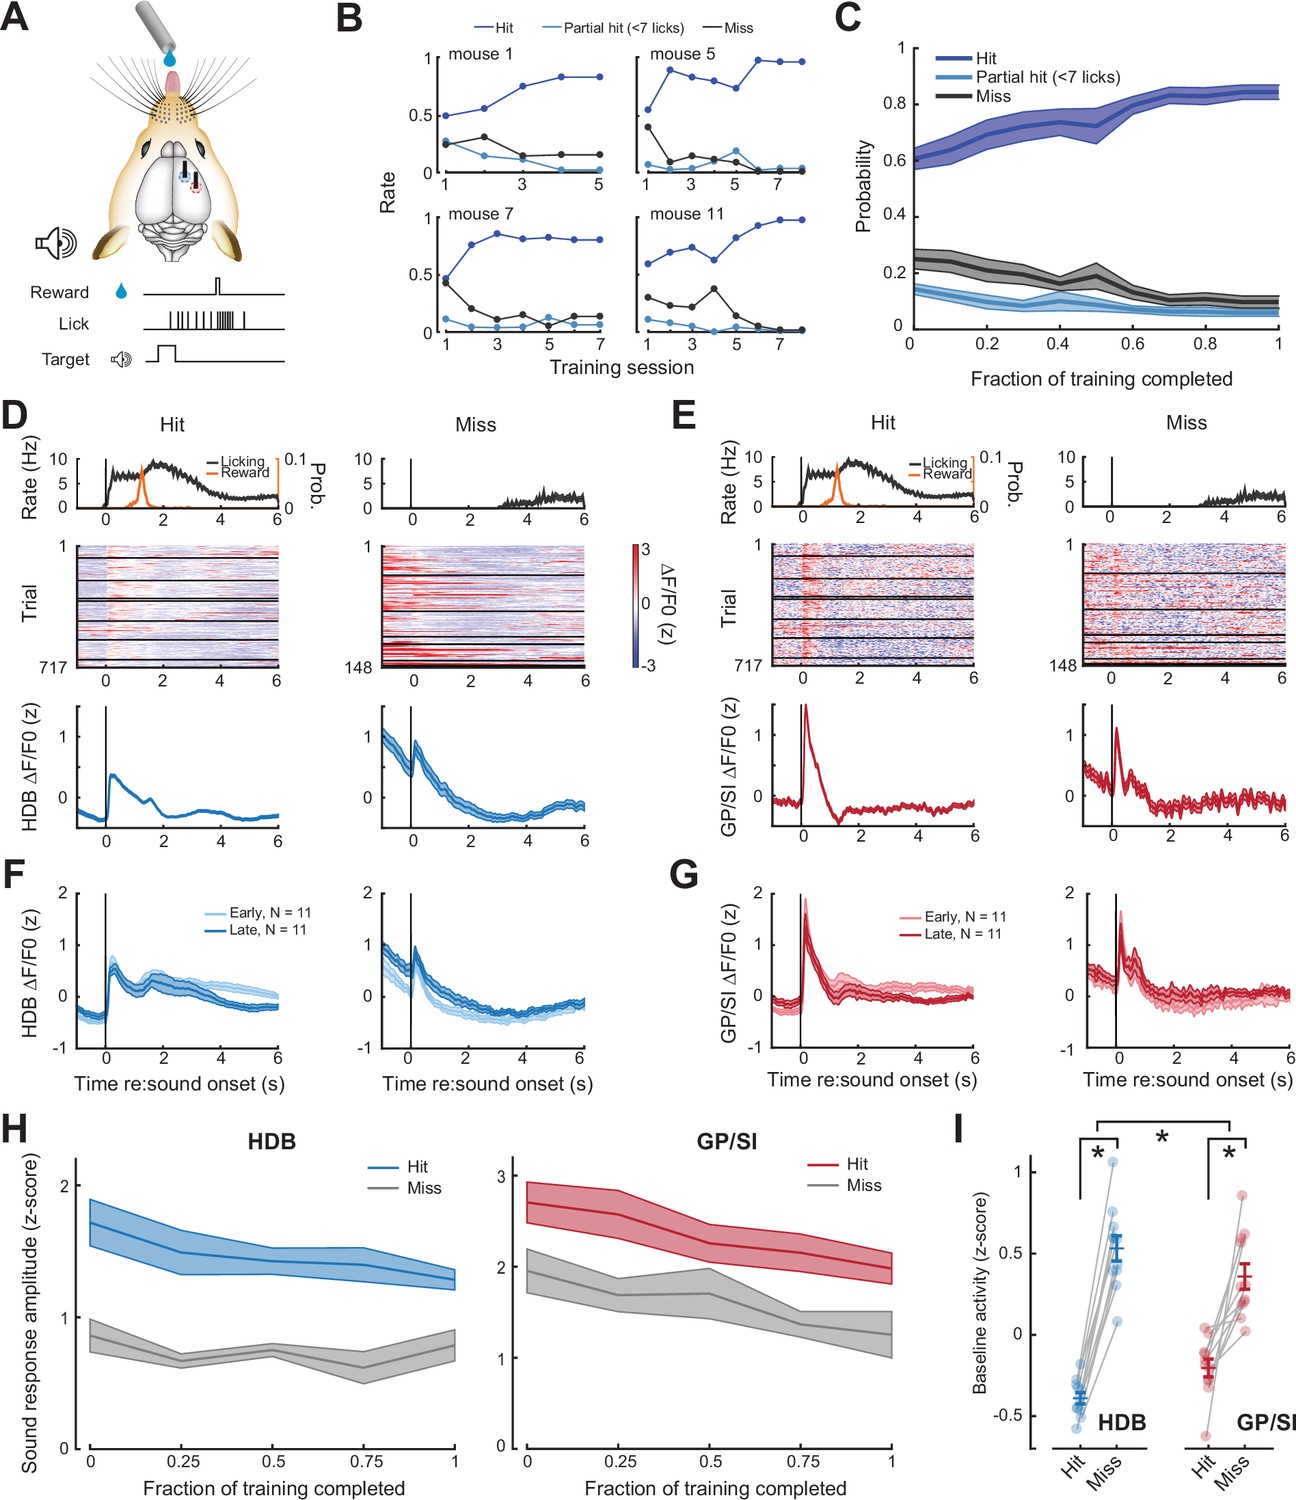
Pre-stimulus cholinergic basal forebrain activity distinguishes behavioral hit and miss trials during an auditory detection task.
(A) Mice were rewarded for producing a vigorous bout of licking (at least 7 licks in 2.8 s) shortly after a low-, mid-, or high-frequency tone. (B) Learning curves from four example mice that became competent in the detection task at slightly different rates. (C) Mean ± SEM probability of hit, partial hit, and miss trial outcome as fraction of training completed in N = 11 mice. (D–E) Tone-evoked cholinergic GCaMP responses from the horizontal limb of the diagonal band of Broca (HDB) (D) and globus pallidus and substantia innominata (GP/SI) (E) of a single mouse from 717 hit and 148 miss trials distributed over eight appetitive conditioning sessions. Left columns present the timing of lickspout activity, reward probability, heatmaps single trial fractional change values, and mean ± SEM fractional change values. Right columns present the same data on miss trials. Horizontal black lines in heatmaps denote different daily recording sessions. Vertical lines denote tone onset. (F–G) Plotting conventions match D–E, except that data are averaged across all mice (N = 11) and the first third of training trials (early) are plotted separately from the last third of training trials (late). Training-related changes in the sensory-evoked responses were not observed, though see Figure 3—figure supplement 1 for an analysis of small differences in the sustained response. (H) Mean ± SEM sound-evoked response amplitudes in all 11 mice were calculated by subtracting the mean activity during a 2 s pre-stimulus baseline period from the peak of activity within 400 ms of sound onset. Each behavior session was assigned to one of five different discrete time bins according to the fraction of total training completed. Although sound-evoked responses are reduced on miss trials compared to hit trials, they remain relatively stable across all conditions as mice learn to associate neutral sounds with reward (three-way repeated measures ANOVA with training time, trial type, and structure as independent variables: main effect for training time, F = 2.46, p = 0.08; main effect for trial type, F = 14.74, p = 0.012; training time × trial type × structure interaction, F = 0.56, p = 0.7). (I) Mean baseline activity during a 1 s period preceding stimulus onset on hit and miss trials. Circles denote individual mice (N = 11 for all conditions), bars denote sample mean and SEM. Pre-stimulus baseline activity was significantly higher on miss trials than hit trials, particularly in HDB (two-way repeated measures ANOVA with trial type and structure as independent variables: main effect for trial type, F = 102.04, p = 1 × 10⁻⁶; trial type× structure interaction, F = 7.89, p = 0.02). Asterisks denote significant differences based on within-structure post hoc pairwise contrasts (p < 0.001 for both) or the trial type × structure interaction term (p = 0.2).
Figure 3—figure supplement 1
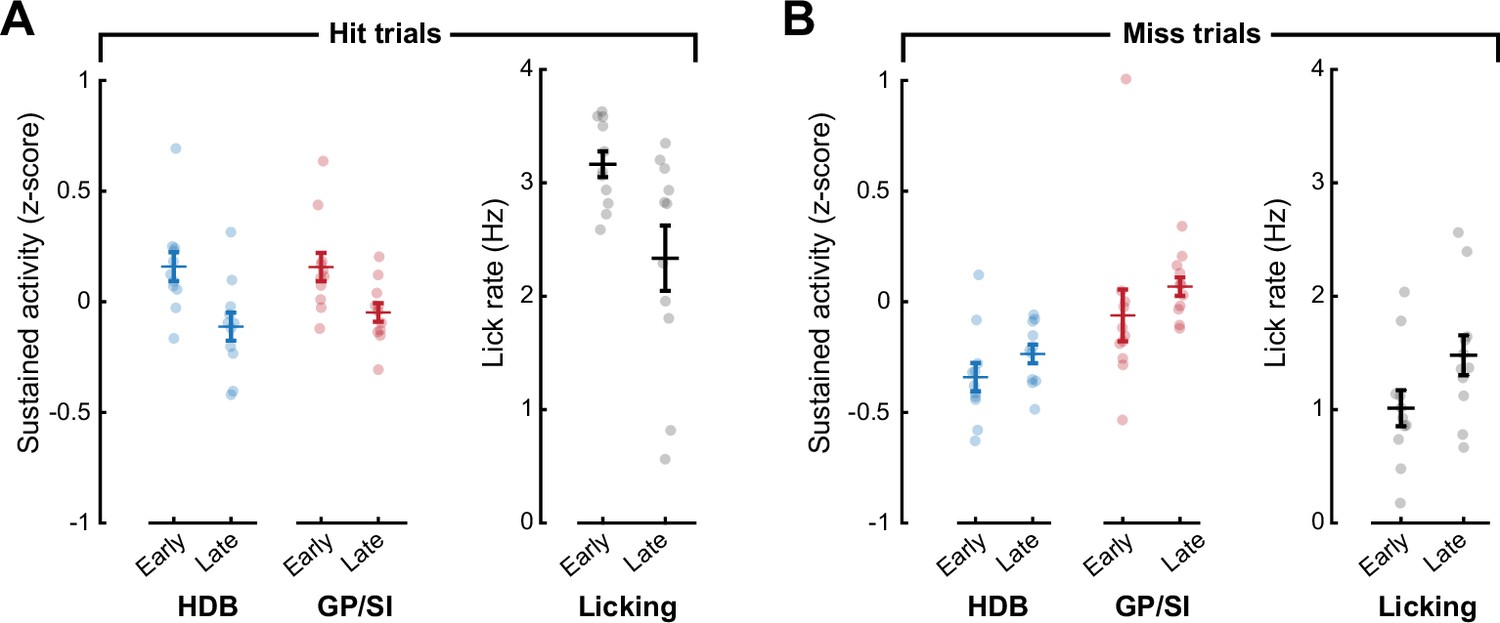
Lick rates may account for subtle differences in sustained basal forebrain cholinergic neuron (BFCN) sustained activity across learning.
(A) On hit trials, sustained BFCN activity (3–6 s following the onset of the auditory cue) is greater in early training than later in the training period, but so is the lick rate measured during the same time period. (B) On miss trials, sustained BFCN activity (3–6 s following the onset of the auditory cue) is greater in early training than later in the training period, but so is the lick rate measured during the same time period.
Figure 4
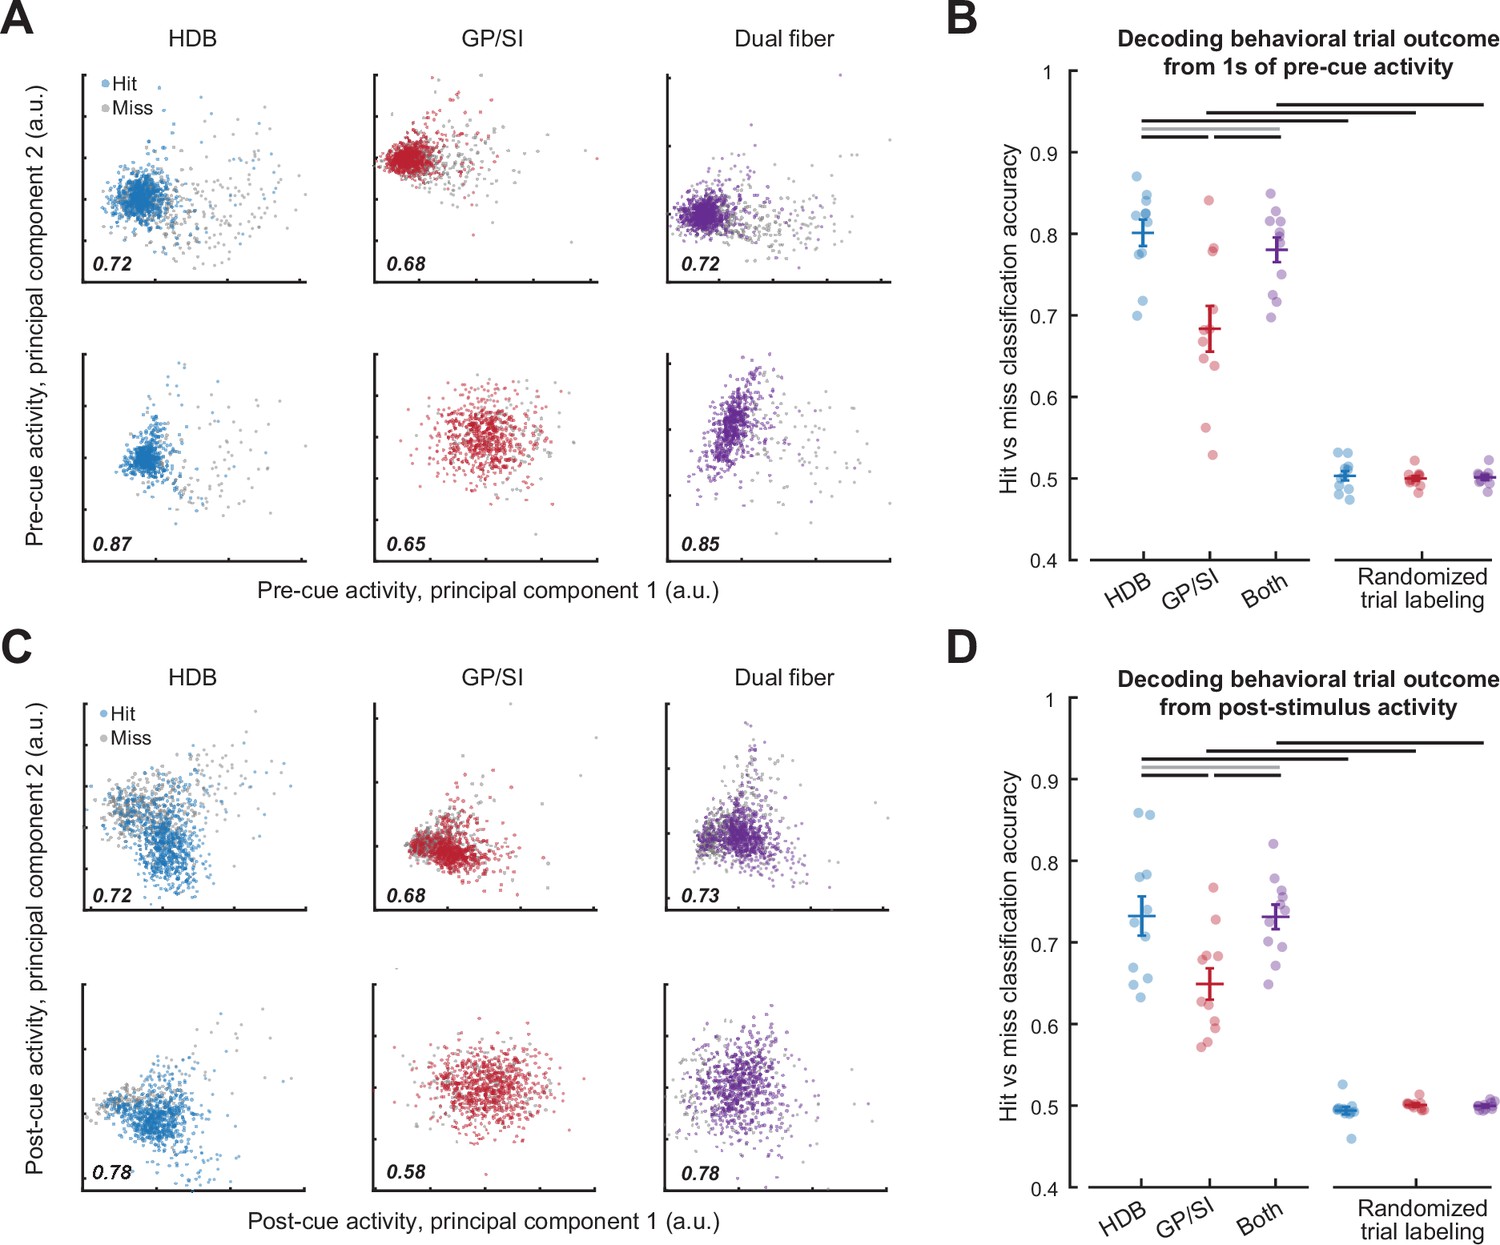
Pre- and post-cue basal forebrain cholinergic neuron (BFCN) activity predicts behavioral accuracy.
(A) Bulk BFCN activity measured 1 s prior to tone onset for two representative mice. Circles denote activity from individual hit and miss trials projected onto the first two principal components. A support vector machine was used to assign principal component projections for individual trials to hit and miss outcomes. Classification accuracy is provided as the fraction of correctly assigned individual trials for horizontal limb of the diagonal band of Broca (HDB), globus pallidus and substantia innominata (GP/SI), and the simultaneous activity measured from both fibers (blue, red, and purple, respectively). (B) Accuracy for support vector machine classification of behavioral trial outcome based on 1 s of activity immediately preceding cue onset. Circles denote mean accuracy for the HDB, GP/SI, or both fibers in each individual mouse. Bars denote mean ± SEM. Baseline HDB activity more accurately decodes forthcoming trial outcome than GP/SI and is no worse than both fibers combined, though all conditions are significantly above chance (two-way repeated measures ANOVA with randomization and structure as independent variables: main effect for randomization, F = 339.37, p = 5 × 10⁻⁹; main effect for structure, F = 11.64, p = 0.0004). Black and gray horizontal lines indicate significant (p < 0.01 for all) and non-significant (p = 0.05) pairwise contrasts, respectively, after correcting for multiple comparisons. (C) Plotting conventions match A, except that data come from the 400 ms period immediately following cue onset. (D) Plotting conventions match B, except that data come from the 400 ms period immediately following cue onset. Post-cue HDB activity is less accurate at decoding forthcoming trial accuracy overall than baseline activity, though accuracy is still greater than chance and still relatively better in HDB than GP/SI (three-way repeated measures ANOVA with activity period, randomization, and structure as independent variables: main effect for activity period, F = 10.57, p = 0.009; main effect for randomization, F = 339.37, p = 5 × 10⁻⁹; main effect for structure, F = 11.6, p = 4 × 10⁻⁴). Black and gray horizontal lines indicate significant (p < 0.04 for all) and non-significant (p = 0.96) pairwise contrasts, respectively, after correcting for multiple comparisons.
Figure 5 with 1 supplement
Motor-related activation of the cholinergic basal forebrain.
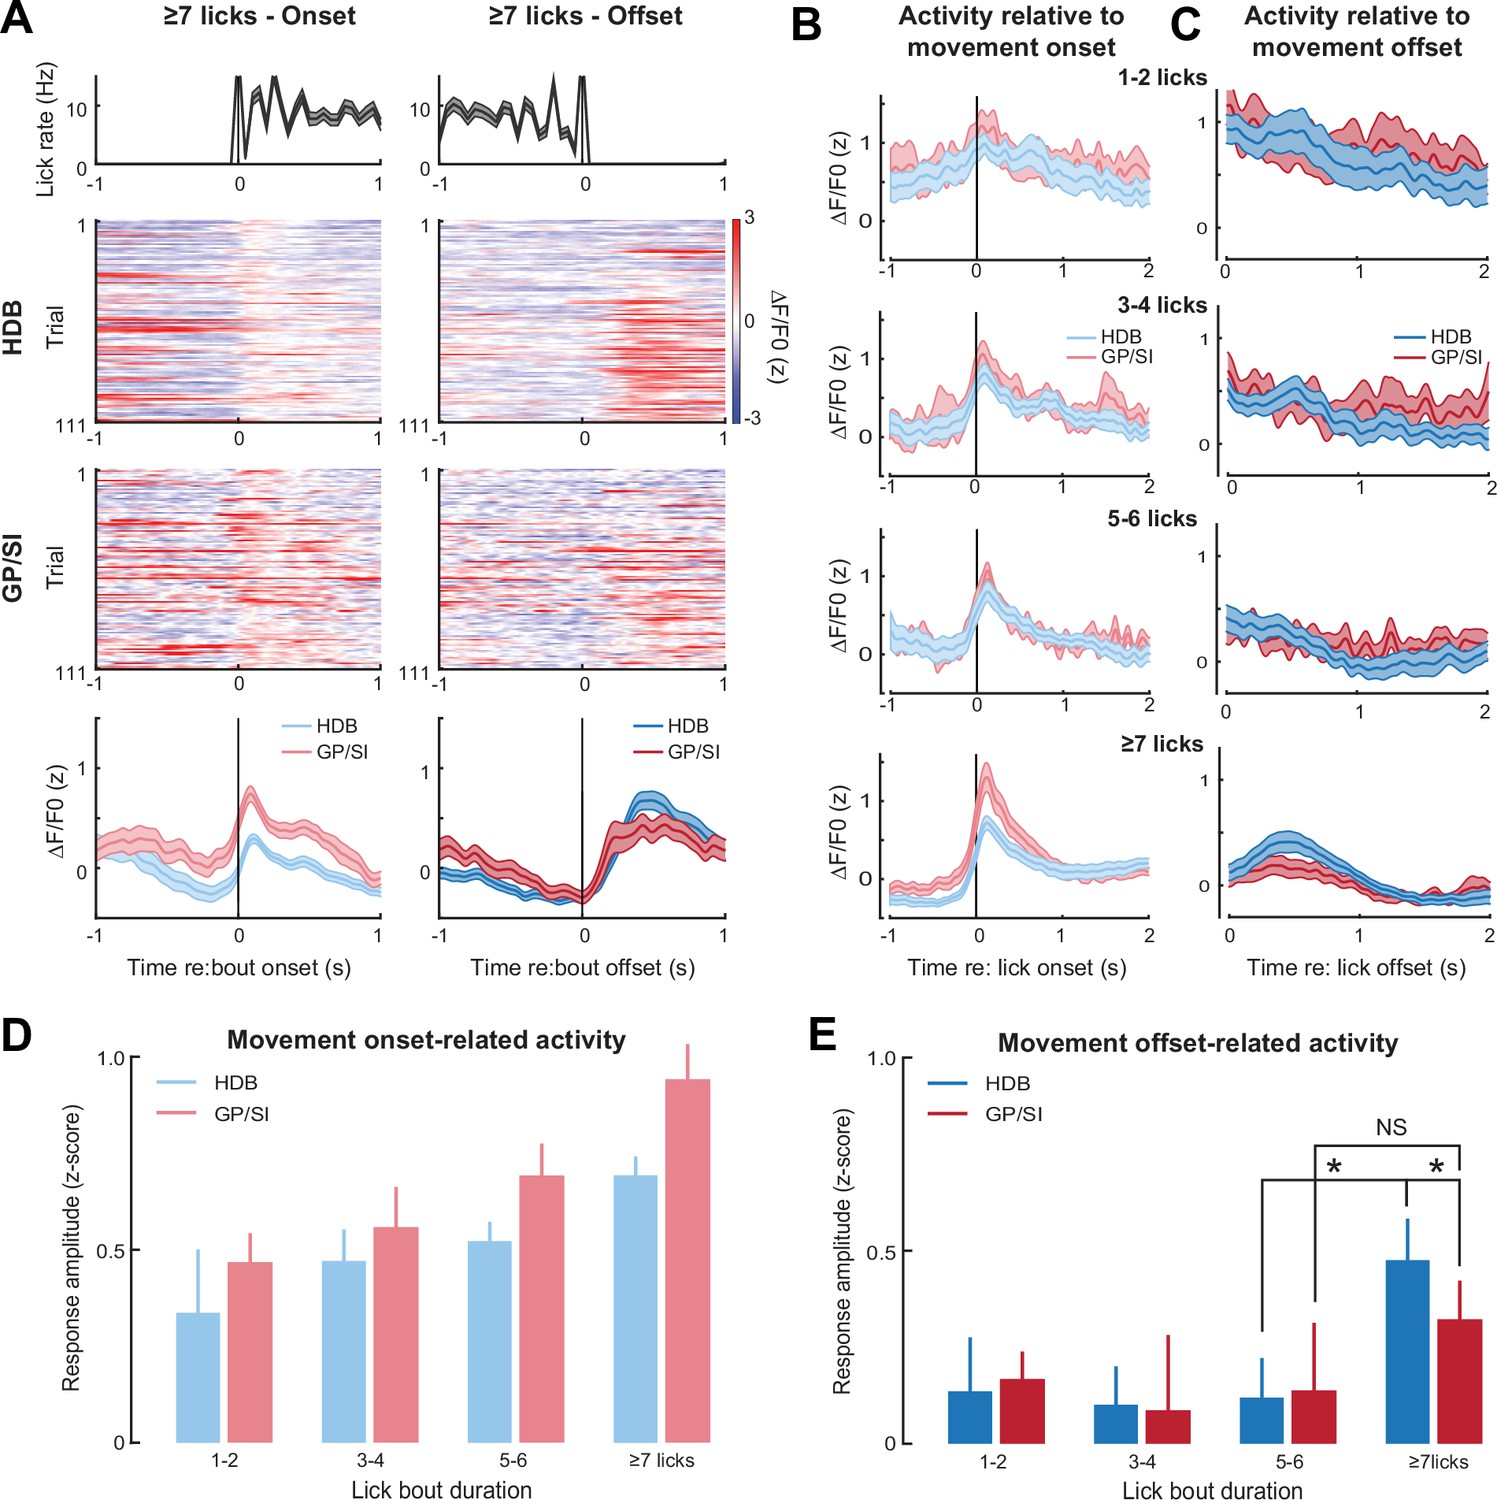
(A) Horizontal limb of the diagonal band of Broca (HDB) and globus pallidus and substantia innominata (GP/SI) activity from an example mouse related to the onset (left column) and offset (right column) of vigorous lick bouts during the inter-trial period of the appetitive operant task. Line plots in top and bottom row reflect mean ± SEM. (B–C) Inter-trial lick bouts were binned according to whether they contained 1–2, 3–4, 5–6, or the full 7+ licks that would have triggered reward delivery if produced at the appropriate time during the operant task. Mean ± SEM activity from N = 11 mice related to the onset (B) or offset (C) of different lick bout durations. (D) Response amplitudes related to lick bout onset were calculated by subtracting the maximum activity from the 250 ms period preceding bout onset from the maximum activity occurring within 700 ms following lickspout contact. Movement-related responses increased with lick bout duration and were greater overall in GP/SI than HDB (two-way repeated measures ANOVA with bout duration and structure as independent variables: main effect for bout duration, F = 6.92, p = 0.001; main effect for structure, F = 6.33, p = 0.03). (E) Response amplitudes related to lick bout offset were calculated by subtracting the maximum activity from the 400 ms period preceding lick bout offset from the maximum activity occurring within 700 ms following lick spout offset. Overall, the offset of licking did not elicit a response (two-way repeated measures ANOVA with bout duration and structure as independent variables: main effect for bout duration, F = 1.47, p = 0.24). In HDB, a response was observed at the offset of licking, but only for intense bouts of ≥7 licks (pairwise post hoc contrast: 7+ vs. 5–6, p = 0.01). No comparable response was observed in GP/SI (pairwise post hoc contrast: 7+ vs. 5–6, p = 1; 7+ GP/SI vs. HDB, p = 0.03). Asterisks denote pairwise contrast p-values < 0.05 after correcting for multiple comparisons. NS = not significant.
Figure 5—figure supplement 1
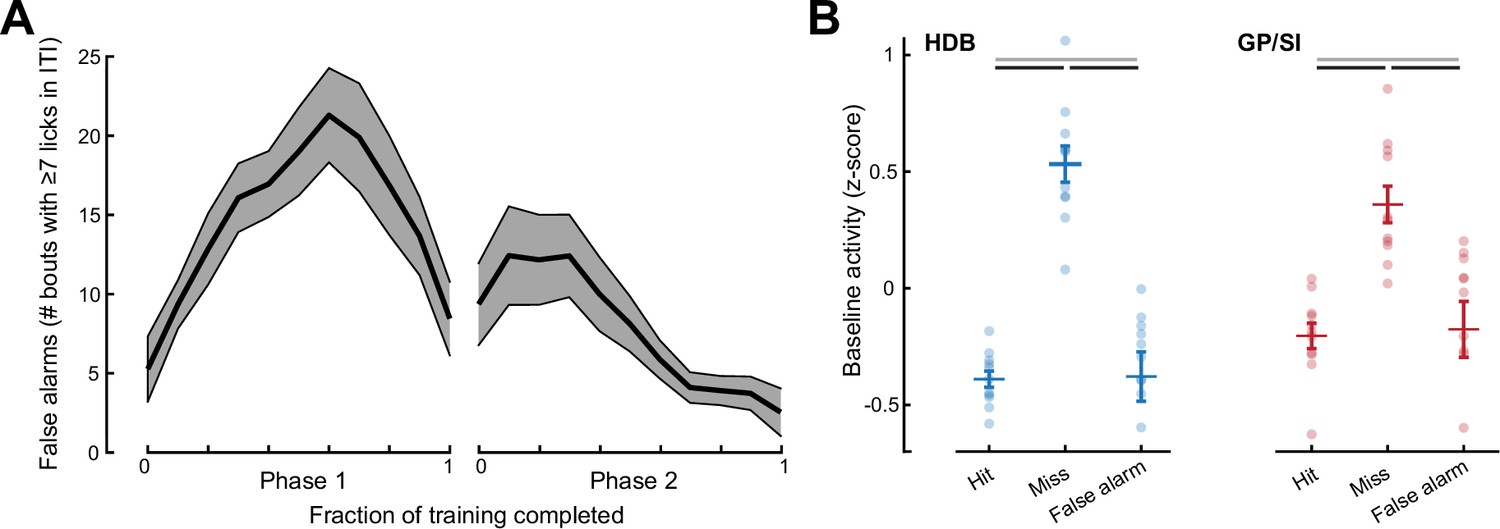
False alarms were relatively uncommon and were not associated with elevated baseline basal forebrain cholinergic neuron (BFCN) activity.
(A) Mean ± SEM incidence of false alarm events during the inter-trial interval (ITI) period measured during Phase 1 (all frequencies rewarded) and Phase 2 (variable reinforcement outcome) of the operant learning task (N = 11). (B) Mean horizontal limb of the diagonal band of Broca (HDB) and globus pallidus and substantia innominata (GP/SI) activity measured during a 1 s period immediately preceding false alarm events are compared with the pre-cue activity preceding hit and miss trials. Hit and miss data are replotted from Figure 3I. Black lines reflect statistically significant differences after correcting for multiple comparisons (p < 0.03 for each). Gray lines denote non-significant differences for HDB (p = 0.91) and GP/SI (p = 0.79).
Figure 6 with 1 supplement
Differential responses of horizontal limb of the diagonal band of Broca (HDB) and globus pallidus and substantia innominata (GP/SI) basal forebrain cholinergic neurons (BFCNs) to reward, punishment, and reward omission.
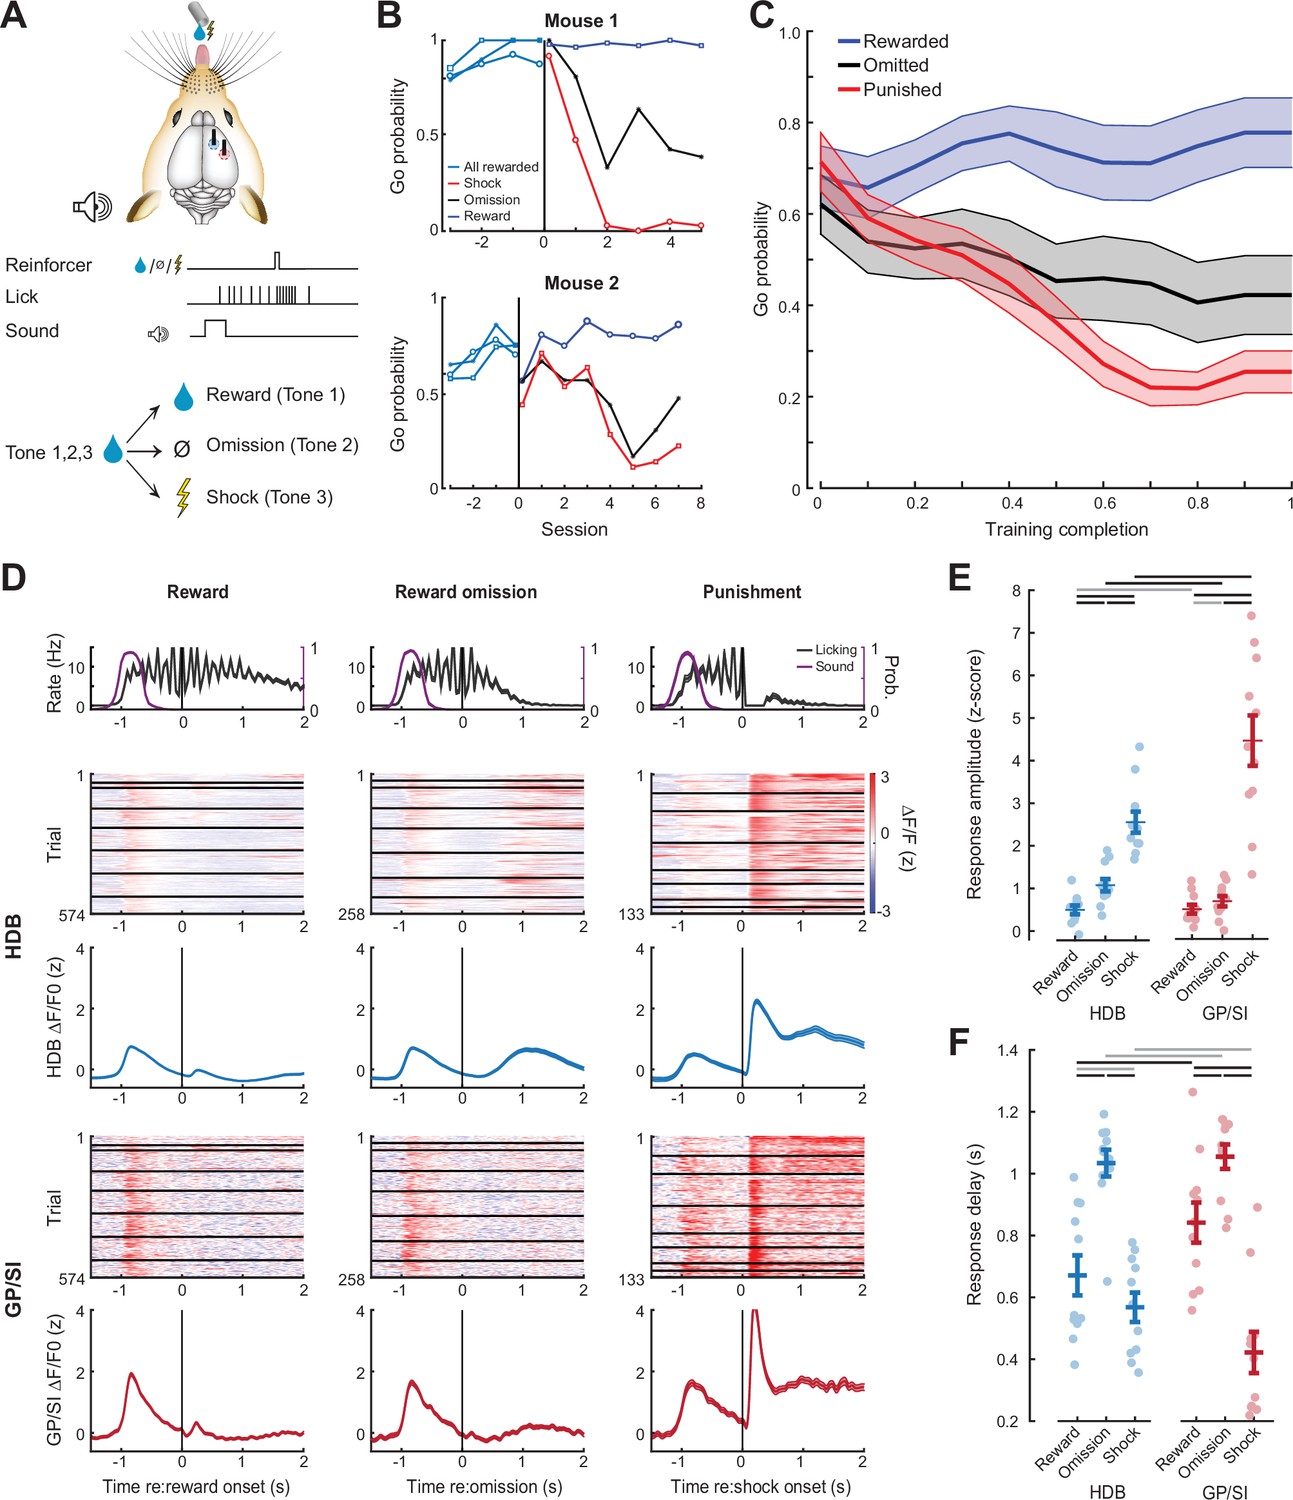
(A) Once mice were reliably licking for reward following the onset of the low-, mid-, or high-frequency tone, the reinforcement outcome was changed such that ≥7 licks in 2.8 s elicited a tongue shock for one frequency and the omission of reward for the other. (B) Go (≥7 licks in 2.8 s) probability for all three tones when they were all associated with reward and after the reinforcement outcome was changed for two of the tones. Data are shown for two mice that modify the behavior to the change in reinforcement outcome at different rates. Vertical line denotes the transition from all rewarded (Phase 1) to variable outcome (Phase 2). Circle, asterisk, and squares indicate low-, mid-, and high-frequency tones, respectively. (C) Mean ± SEM Go probability for each reinforcement outcome as fraction of training completed in N = 11 mice. (D) Tone-evoked cholinergic GCaMP responses from HDB (rows 2–3) and GP/SI (rows 4–5) of a single mouse from 965 Go trials distributed over eight behavioral sessions following the change in reinforcement outcome. All data are plotted relative to reinforcement onset. Top row: Timing of lickspout activity (black) and tone onset probability (purple). Rows 2 and 4: Heatmaps of single trial fractional change values in HDB (row 2) and GP/SI (row 4). Horizontal black lines in heatmaps denote different daily recording sessions. Rows 3 and 5: Mean ± SEM corresponding to each of the heatmaps above. Vertical lines denote reinforcement onset. (E) Reinforcement-related response amplitudes were calculated by subtracting the mean activity during a 2 s pre-stimulus baseline period from the peak activity occurring within 2 s following the 7th lick. Circles denote individual mice (N = 11 for all conditions), bars denote sample mean and SEM. Two-way repeated measures ANOVA with reinforcement type and structure as independent variables: Reinforcement type, F = 80.62, p = 3 × 10⁻¹⁰; structure, F = 5.7, p = 0.03; reinforcement type × structure interaction, F = 8.01, p = 0.003. Black and gray horizontal lines denote significant (p < 0.05) and non-significant pairwise contrasts after correcting for multiple comparisons. (F) Reinforcement-related response latency was defined as the mean latency of the single trial peak responses relative to the offset of the 7th lick. Circles denote individual mice (N = 11 for all conditions), bars denote sample mean and SEM. Two-way repeated measures ANOVA with reinforcement type and structure as independent variables: Reinforcement type, F = 51.28, p = 1 × 10⁻⁸; structure, F = 0.08, p = 0.78; reinforcement type × structure interaction, F = 7.52, p = 0.004. Black and gray horizontal lines denote significant (p < 0.05) and non-significant pairwise contrasts after correcting for multiple comparisons.
Figure 6—figure supplement 1
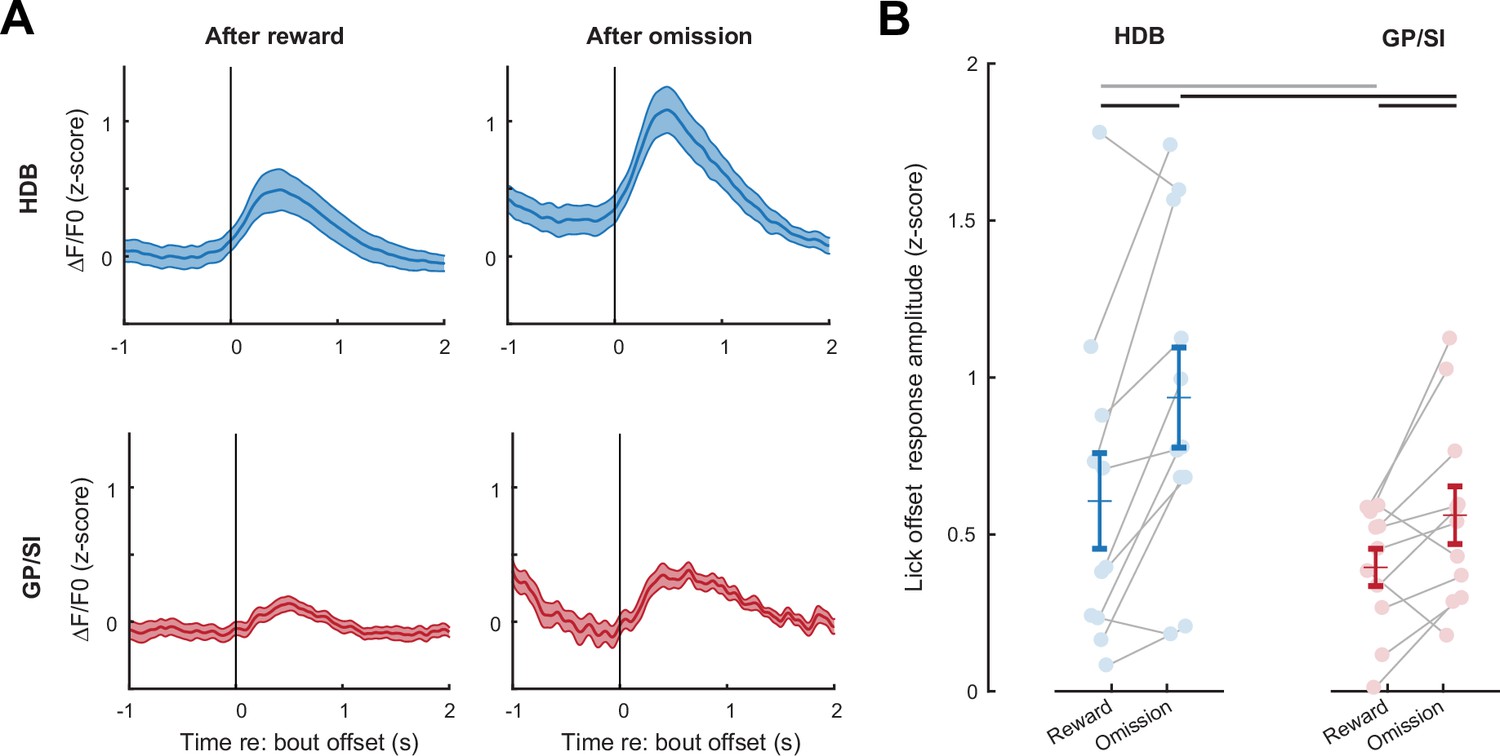
Basal forebrain responses on omission trials reflect reinforcement prediction error, not a motor-related signal.
(A) Mean ± SEM tone-evoked GCaMP activity in horizontal limb of the diagonal band of Broca (HDB) and globus pallidus and substantia innominata (GP/SI) (N = 11 mice) relative to the offset of licking on rewarded (left column) and omission (right column) trials. (B) Response amplitudes in reward and omission trials were calculated by subtracting the maximum activity from the 400 ms preceding lick bout offset from the maximum activity occurring within 700 ms following lick spout offset. Circles denote individual mice (N = 11 for all conditions), bars denote sample mean and SEM. Response amplitude at the offset of licking was greater in HDB overall and significantly greater in omission trials than rewarded trials, suggesting that they reflect reward prediction error and not only a motor-related signal (two-way repeated measures ANOVA with trial type and structure as independent variables: main effect for trial type, F = 10.97, p = 0.007; main effect for structure, F = 8.55, p = 0.02). Black and gray horizontal lines denote significant (p < 0.05) and non-significant pairwise contrasts after correcting for multiple comparisons.
Figure 7

Enhanced basal forebrain cholinergic neuron (BFCN) responses to punishment-predicting cues in globus pallidus and substantia innominata (GP/SI), not horizontal limb of the diagonal band of Broca (HDB).
(A–B) Mean ± SEM tone-evoked GCaMP activity in HDB (N = 11, A) and GP/SI (B) for the tone frequency associated with reward (left column), reward omission (middle column), and punishment (right column). Mean cue-evoked responses are shown during Phase 1 of the task, in which all frequencies were associated with reward (gray), and for three subsequent sessions following the transition to Phase 2, where variable reinforcement outcomes were introduced. (C) Mean ± SEM tone-evoked response amplitudes in HDB and GP/SI (N = 11) were calculated by subtracting the mean activity during a 2 s pre-stimulus baseline period from the peak of activity within 400 ms of sound onset. Phase 2 behavior sessions were assigned to one of five different discrete time bins according to the fraction of total training completed. Learning-related enhancement was only noted for the punishment-predicting tone in GP/SI (three-way repeated measures ANOVA with training time, reinforcement type, and structure as independent variables: main effect for training time, F = 1.62, p = 0.18; main effect for reinforcement type, F = 3.99, p = 0.03; main effect for structure, F = 23.38, p = 0.0006; training time × reinforcement type × structure interaction, F = 2.2, p = 0.04). (D) Within- and between-session dynamics in tone-evoked HDB (left) and GP/SI (right) responses are shown during the initial passive characterization session (see Figure 2) and all subsequent Phase 1 and Phase 2 training sessions for three mice exemplifying varying degrees of enhanced GP/SI response amplitude and habituation for punishment-predicting sounds. Mouse (M) number corresponds to the fiber locations shown in Figure 1—figure supplement 1. Each individual line presents the smoothed average (7-point median filter) for all trials within a given behavioral session for two tone frequencies. Dashed lines denote the linear slope measurement for within-session habituation. (E) Within-session habituation of tone-evoked responses during the initial passive characterization session, measured as the linear slope over the first 10 trials. Tones (T) A, B, and C denote the frequencies that will ultimately be associated with reward, omission, and punishment in Phase 2 of the operant task. Habituation is significantly greater in GP/SI than HDB but does not differ between tone frequencies (two-way repeated measures ANOVA with structure and tone frequency as independent variables: main effect for structure, F = 13.41, p = 0.004 [denoted by black lines and asterisk]; main effect for tone frequency, F = 0.08, p = 0.92). Gray horizontal lines denote non-significant pairwise differences after correcting for multiple comparisons (p > 0.58 for each). (F) Within-session habituation of tone-evoked responses during Phases 1 and 2 of the operant task, measured as the linear slope from the first 20% of trials within each session. Mean ± SEM habituation slope for frequencies associated with reward and reward omission are not changed over time or reinforcement type (three-way ANOVA with time, reinforcement type, and structure as independent variables: main effect for reinforcement type, F = 1.0, p = 0.34; main effect for time; F = 0.77, p = 0.66; N = 11).
Figure 8
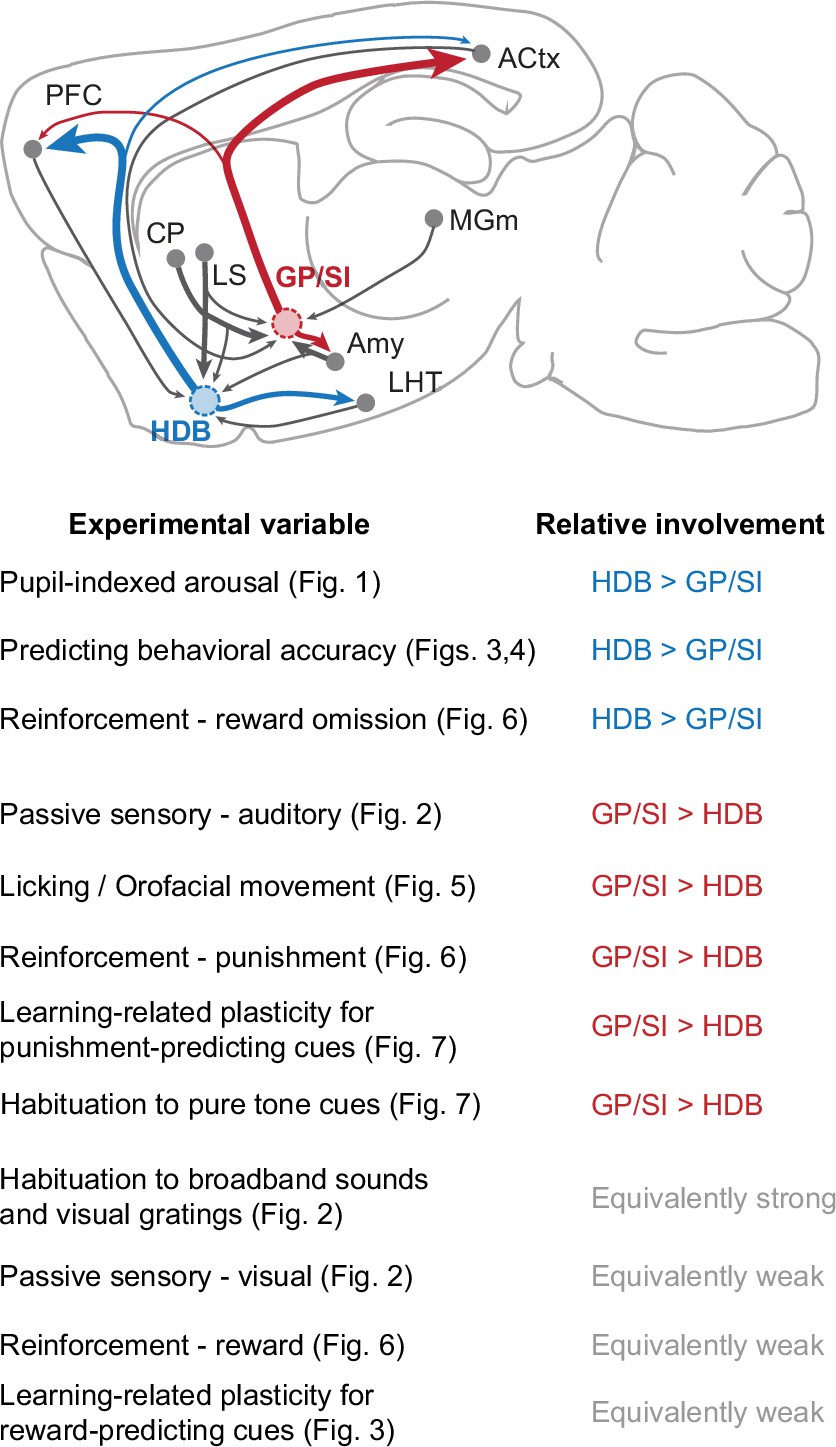
Summary of functional specializations in the rostral and caudal basal forebrain.
A summary of the relative involvement of horizontal limb of the diagonal band of Broca (HDB) and globus pallidus and substantia innominata (GP/SI) across all experimental variables tested in this study.
Author response image 1
Tables
Key resources table
| Reagent type (species) or resource | Designation | Source or reference | Identifiers | Additional information |
|---|---|---|---|---|
| Genetic reagent (Mus musculus) | B6.129S-Chattm1(cre)Lowl/MwarJ | Jackson Laboratory | RRID:IMSR_JAX:031661 | Male |
| Genetic reagent (Mus musculus) | B6.Cg-Igs7tm148.1(tetO-GCaMP6f,CAG-tTA2)Hze/J | Jackson Laboratory | RRID:IMSR_JAX:030328 | Female |
| Antibody | Anti-ChAT (goat polyclonal) | Millipore Sigma | Cat #: AB144PRRID: AB_2079751 | (1:100) |
| Antibody | Anti-Goat (donkey polyclonal) | Abcam | Cat#: AB150132RRID: AB_2810222 | (1:500) |
| Recombinant DNA reagent | ACh sensor | Dr Yulong Li | GRABACh3.0 | |
| Software, algorithm | Labview | National Instruments | RRID: SCR_014325 | Version 2015 |
| Software, algorithm | MATLAB | Mathworks | RRID: SCR_001622 | Version R2021a |
| Other | DAPI stain | Vectorlabs | Cat #: H-1500–10RRID:AB_2336788 | |
| Other | Allen Brain Atlas | Lein et al., 2007 | RRID:SCR_013286 |
Additional files
Download links
A two-part list of links to download the article, or parts of the article, in various formats.
Downloads (link to download the article as PDF)
Open citations (links to open the citations from this article in various online reference manager services)
Cite this article (links to download the citations from this article in formats compatible with various reference manager tools)
A functional topography within the cholinergic basal forebrain for encoding sensory cues and behavioral reinforcement outcomes
eLife 10:e69514.
https://doi.org/10.7554/eLife.69514


