Oncogenic PKA signaling increases c-MYC protein expression through multiple targetable mechanisms
- Division of Hematology/Oncology, Helen Diller Family Comprehensive Cancer Center, University of California, San Francisco, United States
- Quantitative Biosciences Institute (QBI), University of California San Francisco, United States
- Department of Medicine, Harvard Medical School, United States
- Massachusetts General Hospital Cancer Center, United States
- Department of Cellular and Molecular Pharmacology, University of California San Francisco, United States
- J. David Gladstone Institute, United States
- Department of Surgery and Northwest Liver Research Program, University of Washington, United States
- Department of Biomedical Sciences, College of Veterinary Medicine, Cornell University, United States
- Department of Pharmacology, University of Washington Medical Center, United States
Figures
Figure 1
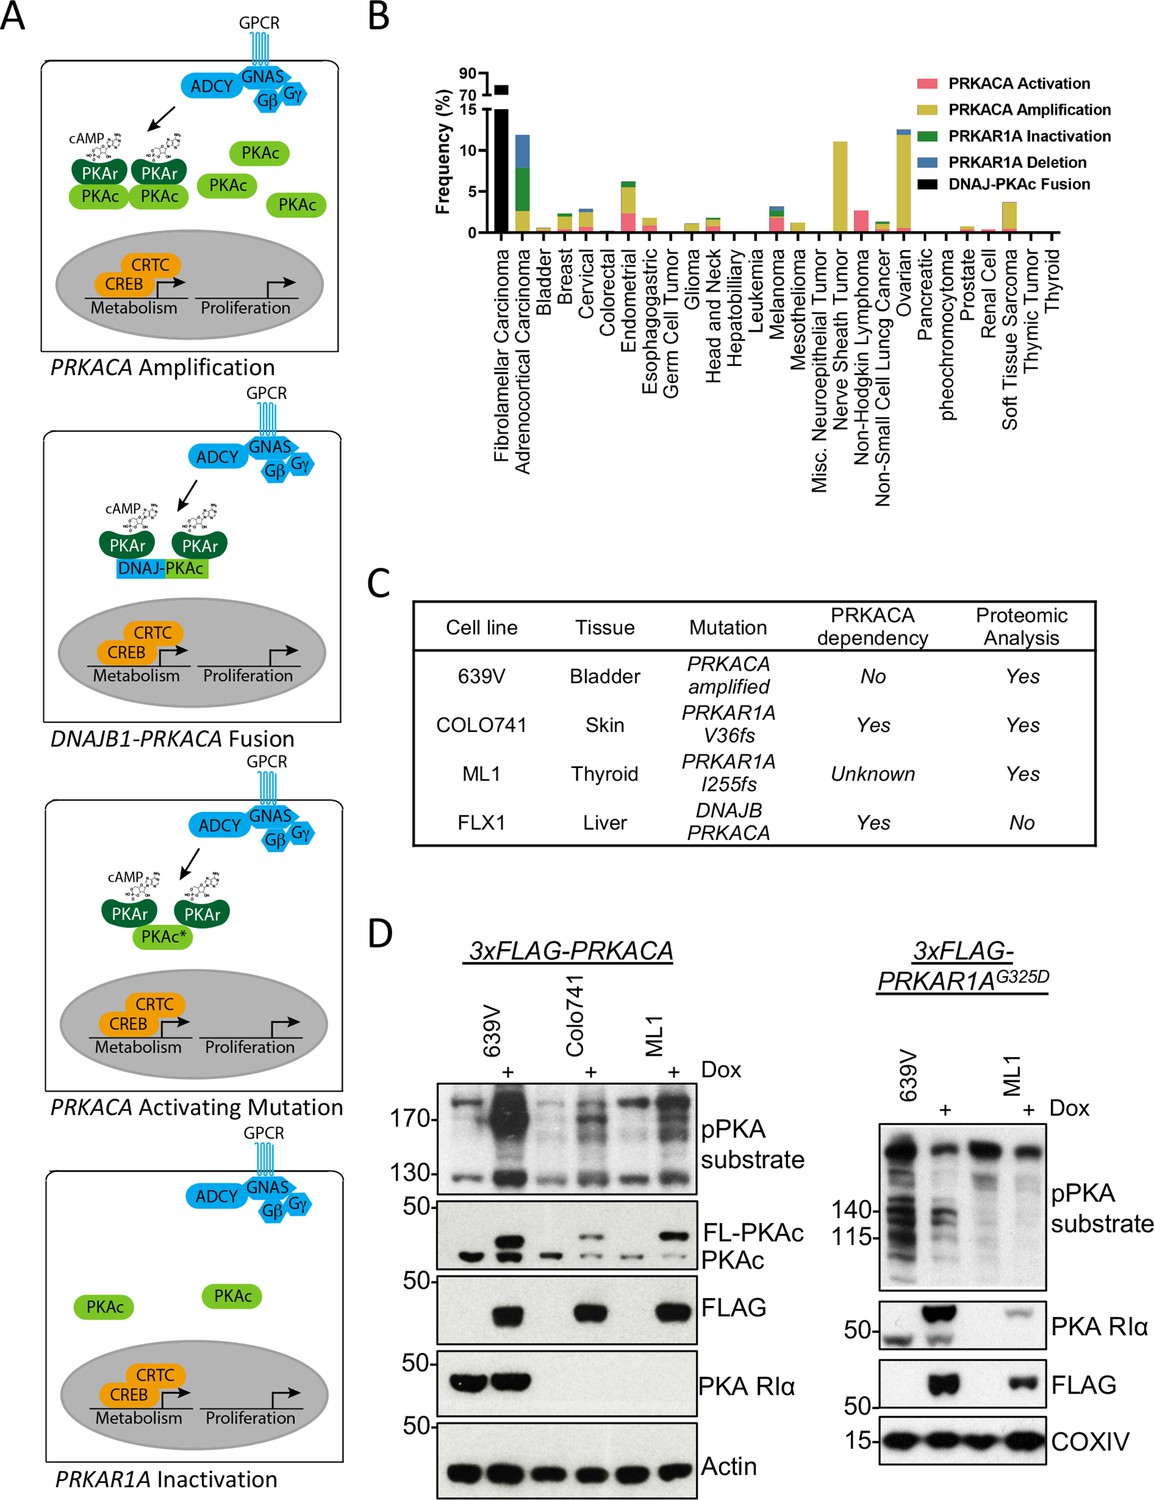
Recurrent PKA activating somatic alterations in human cancer.
(A) Pathway illustrations of different PKA activating genomic alterations in order from top: PRKACA amplification, DNAJB1-PRKACA fusion, PRKACA activating mutation, and PRKAR1A inactivation or deletion. (B) TCGA PanCancer Project analysis showing the frequency of PRKACA gain-of-function (red and yellow) and PRKAR1A loss-of-function (green and blue) alterations in various cancer types. The reported frequency of DNAJB1-PRKACA fusion in fibrolamellar carcinoma (FLC) clinical samples is also included. (C) Cell lines used in this study, their PKA-related mutation, PRKACA dependency, and inclusion in proteomic analyses. (D) Immunoblots showing the change of PKA activity, as indicated by phospho-PKA substrate, in different cell lines with dox-inducible 3xFLAG-PRKACA or PRKAR1AG325D with 1 µg/ml doxycycline (dox) for 48 hr. Left: engineered cell lines with inducible 3xFLAG-PRKACA. Right: engineered cell lines with inducible 3xFLAG- PRKAR1AG325D.
-
Figure 1—source data 1
Images for Figure 1A.
- https://cdn.elifesciences.org/articles/69521/elife-69521-fig1-data1-v3.zip
-
Figure 1—source data 2
Table for Figure 1B.
- https://cdn.elifesciences.org/articles/69521/elife-69521-fig1-data2-v3.xlsx
-
Figure 1—source data 3
Images for Figure 1D part 1/3.
- https://cdn.elifesciences.org/articles/69521/elife-69521-fig1-data3-v3.zip
-
Figure 1—source data 4
Images for Figure 1D part 2/3.
- https://cdn.elifesciences.org/articles/69521/elife-69521-fig1-data4-v3.zip
-
Figure 1—source data 5
Images for Figure 1D part 3/3.
- https://cdn.elifesciences.org/articles/69521/elife-69521-fig1-data5-v3.zip
Figure 2
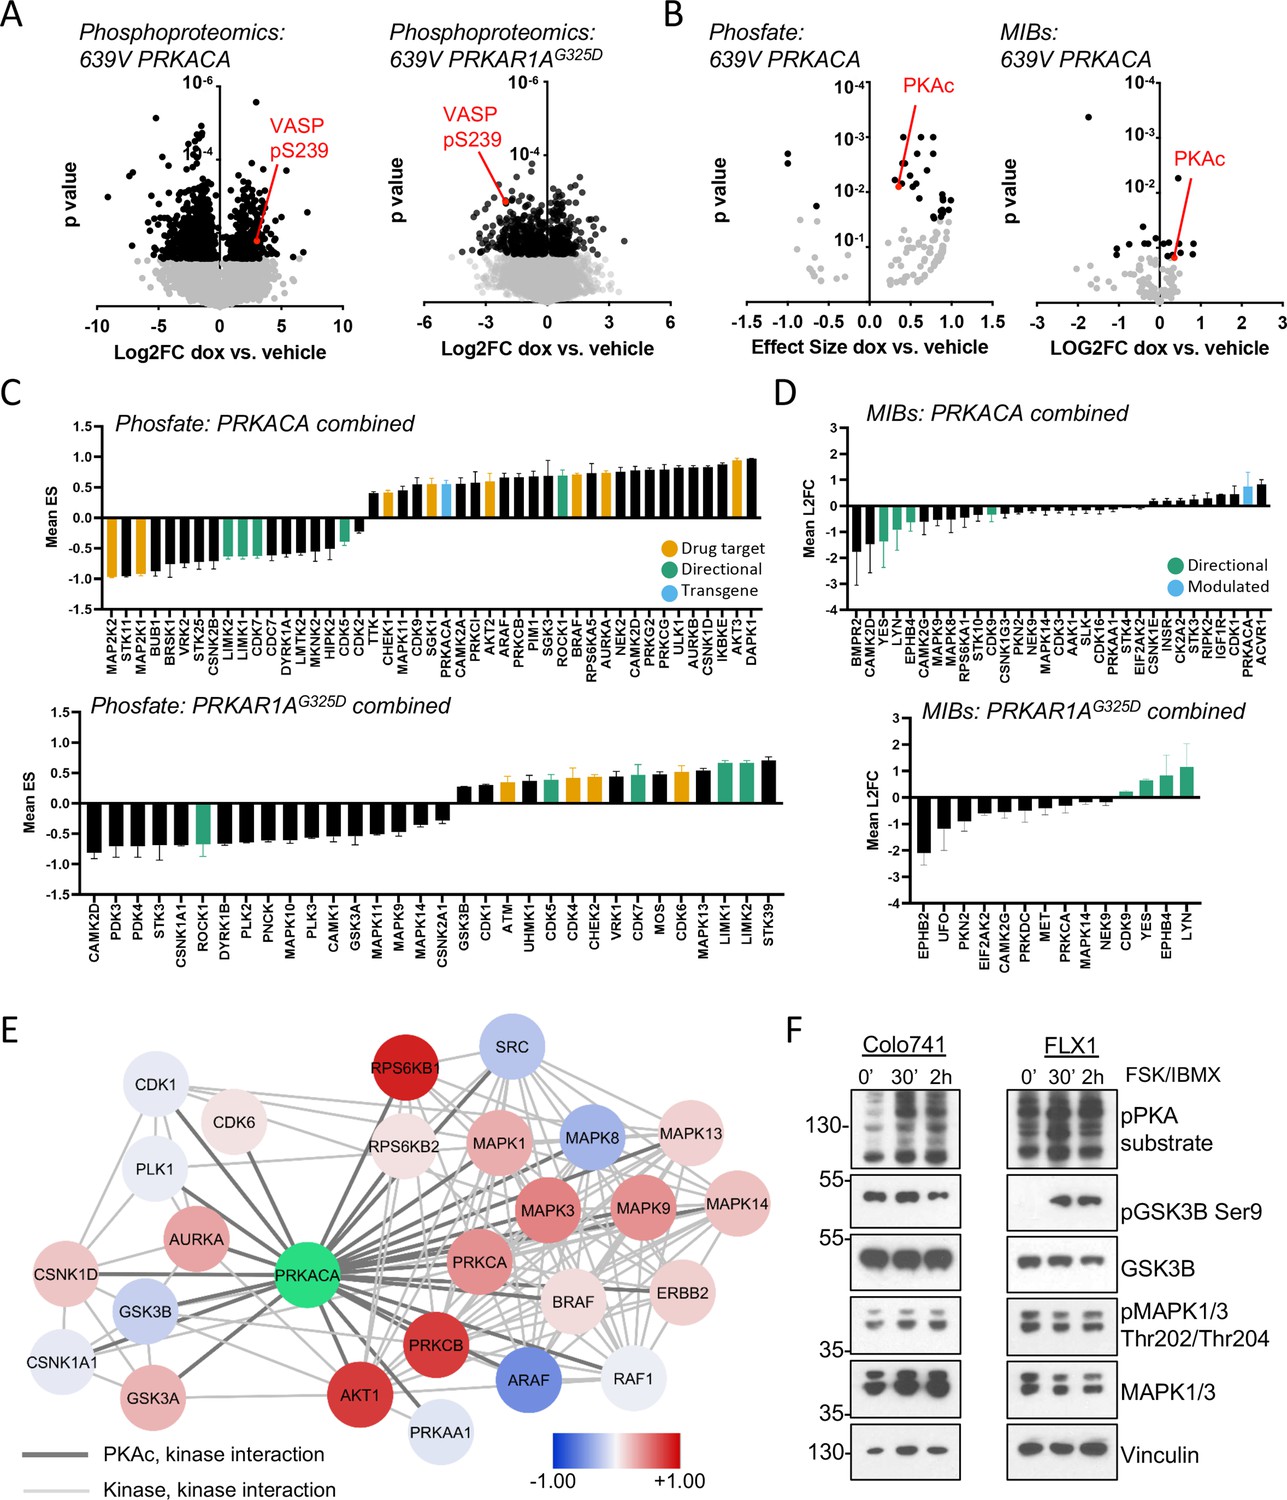
Kinome profiling to identify signaling nodes downstream of PRKACA.
(A) Global phosphorylation changes in 639V with induction of 3xFLAG-PRKACA or 3xFLAG-PRKAR1AG325D; VASP is shown as a positive control for PKA activation, technical replicates shown. (B) Change in kinase activity from Phosfate analysis or multiplex inhibitor beads (MIBs) pipeline using 639V with induction of 3xFLAG-PRKACA compared to control; PKA catalytic (PKAc) shown as a positive control. Technical replicates shown. (C) Summary of overlapping activity in Phosfate data sets: effect size for all inferred kinases identified in at least two samples were averaged, shown with SD. Top panel shows results from 3xFLAG-PRKACA induction, bottom panel from 3xFLAG-PRKAR1AG325D induction. (D) Summary of overlapping activity in MIBs data sets: abundance of all bead-enriched kinases identified in at least two samples were averaged, shown with SD. Top panel shows results from 3xFLAG-PRKACA induction, bottom panel from 3xFLAG- PRKAR1AG325D induction. (E) Network integration of MIBs and Phosfate kinome profiles from 639V, Colo741, and ML1 with doxycycline (dox)-inducible 3xFLAG-PRKACA and 639V and ML1 with dox-inducible 3xFLAG-PRKAR1AG325D. Kinases marked in red show increased activity in PRKACA data sets and/or decreased activity in PRKAR1AG325D data sets, while those marked in blue show the converse. (F) Confirmation of PKA-induced signaling changes: Colo741 and FLX1 were treated with 50 μM forskolin (FSK)/3-isobutyl-1-methylxanthine (IBMX) for 30 or 120 min and then analyzed by immunoblot.
-
Figure 2—source data 1
Tables for Figure 2A.
- https://cdn.elifesciences.org/articles/69521/elife-69521-fig2-data1-v3.zip
-
Figure 2—source data 2
Tables for Figure 2B.
- https://cdn.elifesciences.org/articles/69521/elife-69521-fig2-data2-v3.zip
-
Figure 2—source data 3
Tables for Figure 2C.
- https://cdn.elifesciences.org/articles/69521/elife-69521-fig2-data3-v3.zip
-
Figure 2—source data 4
Tables for Figure 2D.
- https://cdn.elifesciences.org/articles/69521/elife-69521-fig2-data4-v3.zip
-
Figure 2—source data 5
Tables for Figure 2E.
- https://cdn.elifesciences.org/articles/69521/elife-69521-fig2-data5-v3.zip
-
Figure 2—source data 6
Images for Figure 2F.
- https://cdn.elifesciences.org/articles/69521/elife-69521-fig2-data6-v3.zip
Figure 3 with 1 supplement
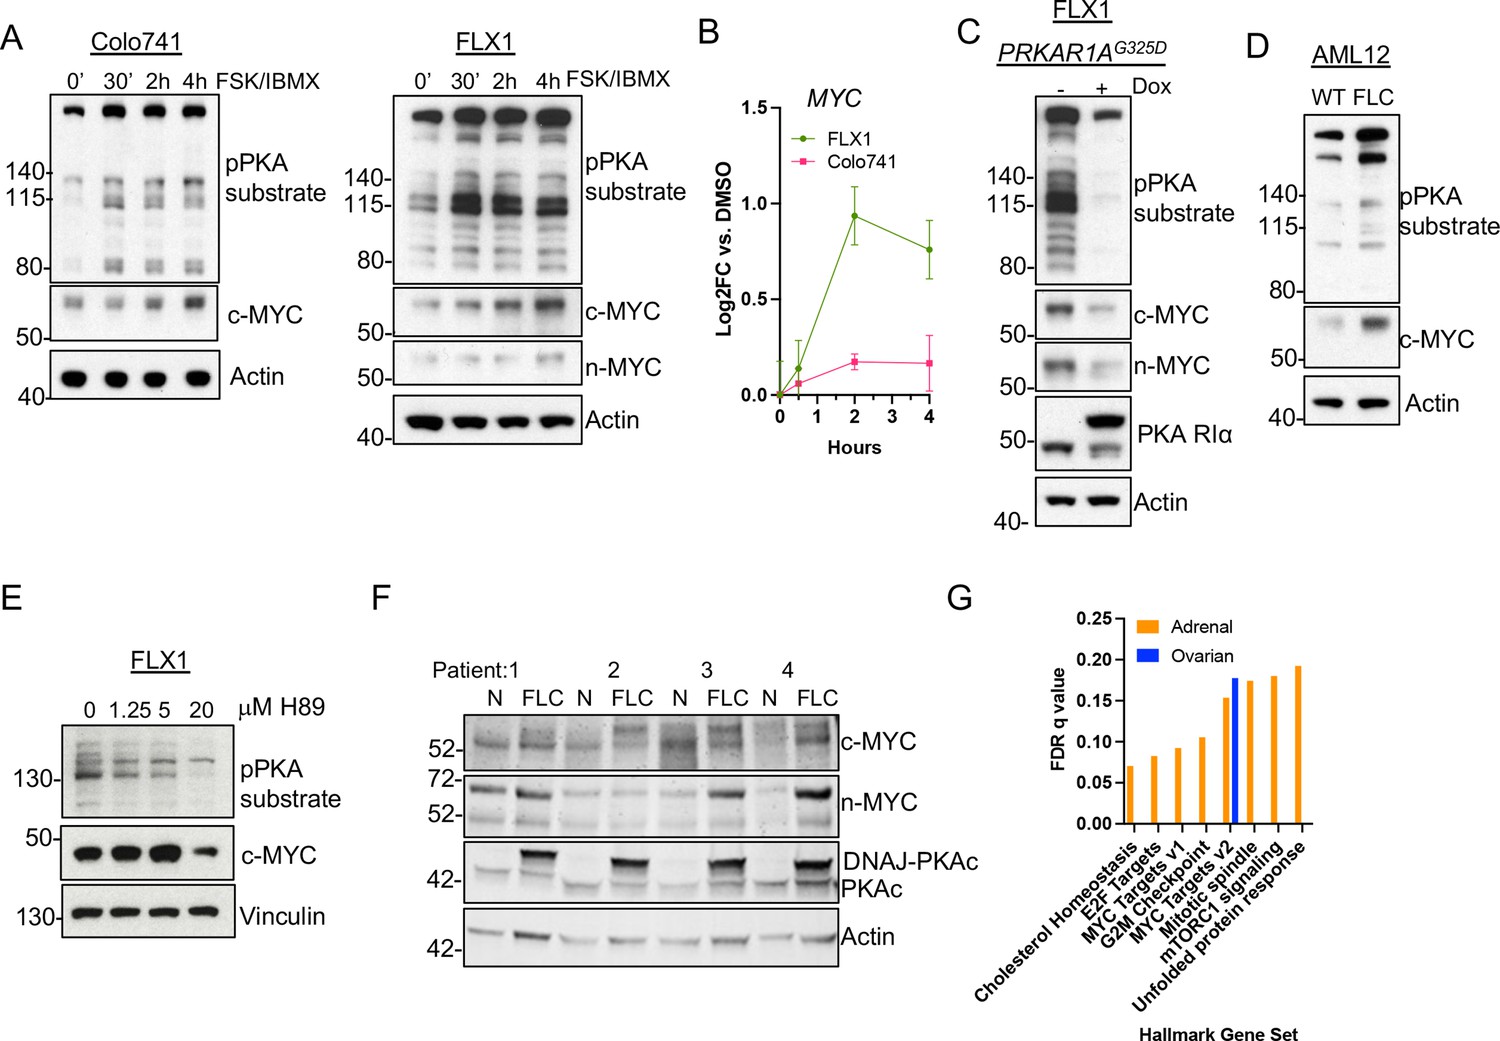
PKA activity correlates with c-MYC and n-MYC protein levels.
(A) Immunoblots showing the change of PKA activity, as indicated by phospho-PKA substrate, and c-MYC and n-MYC expression in Colo741 and FLX1 cells after treatment with 50 μM forskolin (FSK) and 3-isobutyl-1-methylxanthine (IBMX) for 30 min, 2 hr, or 4 hr. n-MYC was not detected in Colo741 so is not shown. (B) Impact of 0–4 hr treatment with FSK/IBMX on MYC mRNA levels in Colo741 and FLX1; ± SD. Technical replicates from a representative experiment shown. (C) Immunoblots showing the change of PKA activity and c-MYC and n-MYC levels in engineered FLX1 cells with doxycycline (dox)-inducible 3xFLAG- PRKAR1AG325D with or without dox for 72 hr. (D) Immunoblots showing the basal level of PKA activity with phosphorylated PKA substrate and c-MYC expression in AML12 wild type (WT; left) and AML12DNAJ-PKAc cells (right). (E) Effect of 4 hr treatment with PKA-inhibiting tool compound H89 over a dose range from 1.25 to 20 μM on PKA substrate phosphorylation and c-MYC level. (F) Immunoblot showing the presence of DNAJ-PKAc and different level of c-MYC and n-MYC in fibrolamellar carcinoma (FLC) tumor samples (FLC) vs adjacent liver (N) from four FLC patients. (G) Summary gene set enrichment analysis (GSEA) of PRKACA amplified/mutant and PRKAR1A inactivated adrenocortical carcinoma or ovarian serous carcinoma vs. WT from TCGA. All significant ‘Hallmark’ gene sets are shown.
-
Figure 3—source data 1
Images for Figure 3A.
- https://cdn.elifesciences.org/articles/69521/elife-69521-fig3-data1-v3.zip
-
Figure 3—source data 2
Tables for Figure 3B.
- https://cdn.elifesciences.org/articles/69521/elife-69521-fig3-data2-v3.xlsx
-
Figure 3—source data 3
Images for Figure 3C.
- https://cdn.elifesciences.org/articles/69521/elife-69521-fig3-data3-v3.zip
-
Figure 3—source data 4
Images for Figure 3D.
- https://cdn.elifesciences.org/articles/69521/elife-69521-fig3-data4-v3.zip
-
Figure 3—source data 5
Images for Figure 3E.
- https://cdn.elifesciences.org/articles/69521/elife-69521-fig3-data5-v3.zip
-
Figure 3—source data 6
Images for Figure 3F.
- https://cdn.elifesciences.org/articles/69521/elife-69521-fig3-data6-v3.zip
-
Figure 3—source data 7
Tables for Figure 3G.
- https://cdn.elifesciences.org/articles/69521/elife-69521-fig3-data7-v3.xlsx
Figure 3—figure supplement 1
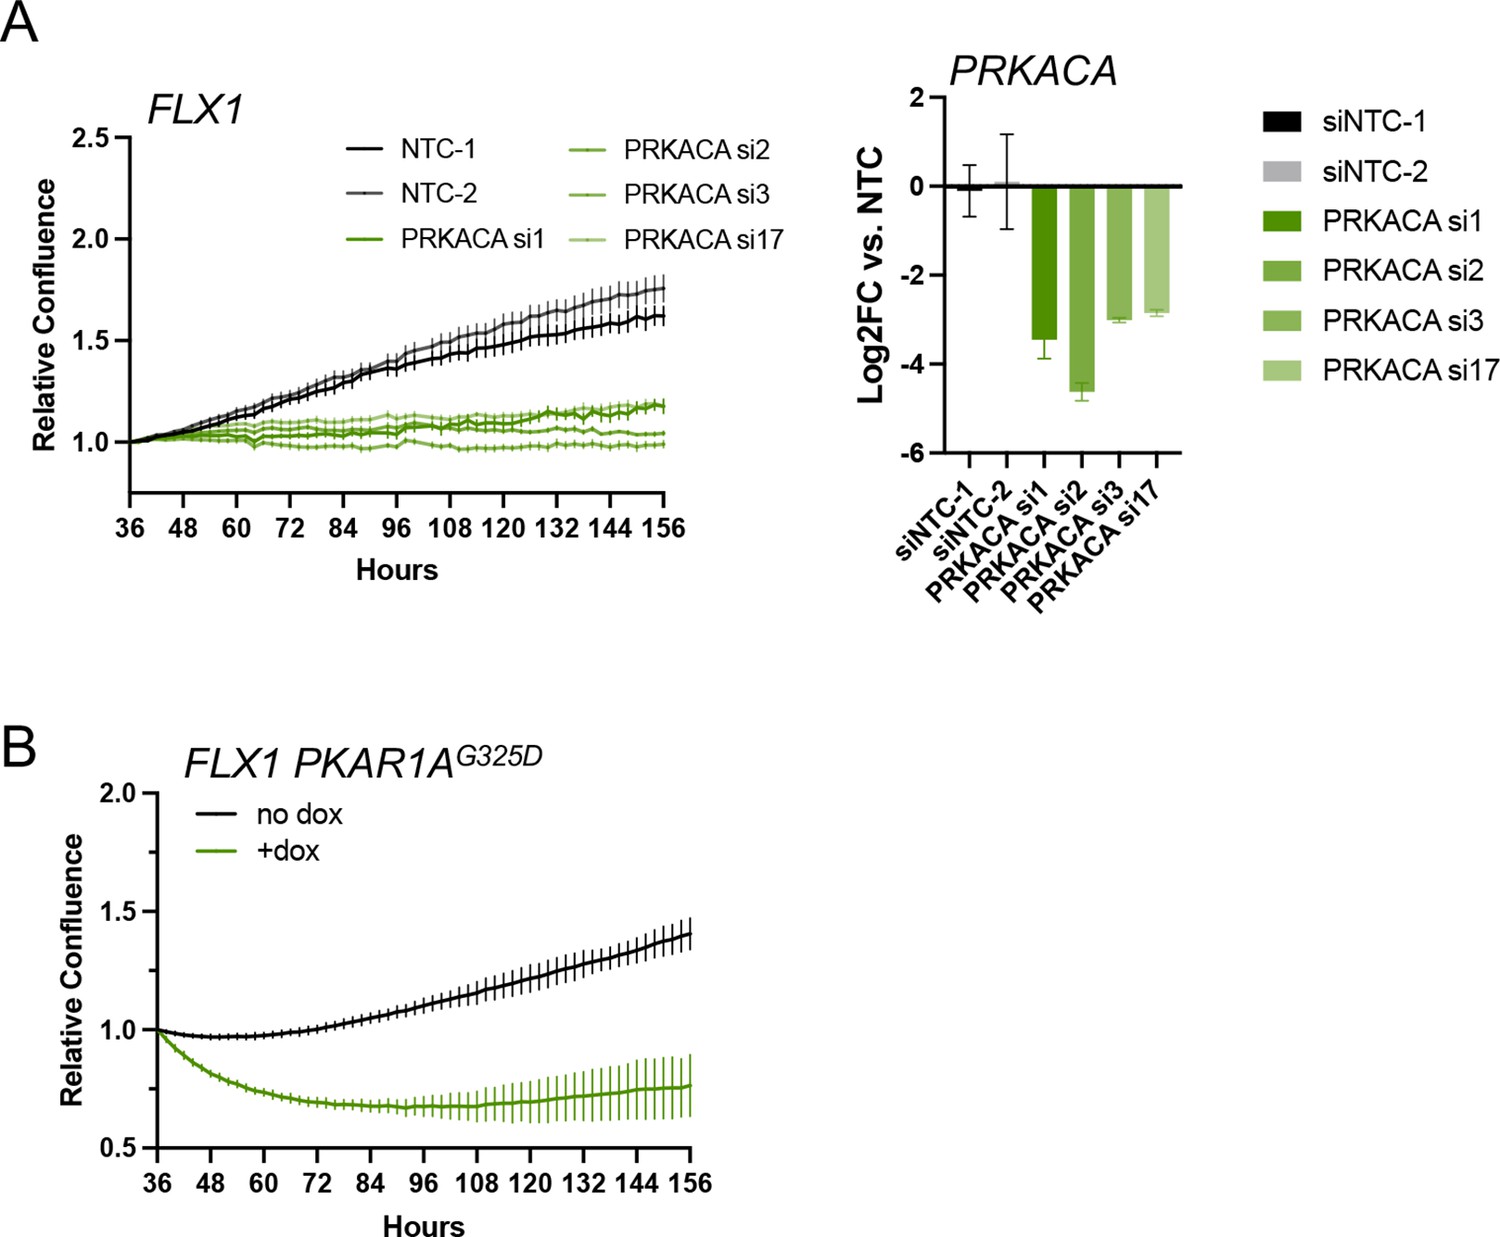
Effects of PKA inhibition on FLX1 cell proliferation.
(A) Impact of individual PRKACA-targeting siRNAs on relative cell confluence in FLX1. Confirmation of knockdown shown on right. Experiment was done in duplicate, the representative results shown with mean ± SD, n=6 wells for each siRNA. (B) Relative cell confluence of FLX1 cells with doxycycline (dox)-inducible 3xFLAG- PRKAR1AG325D in 96 well plates after treatment with or without 1 μg/ml dox. Experiment was done in duplicate, the representative results shown with mean ± SD, n=15 wells for each condition.
-
Figure 3—figure supplement 1—source data 1
Tables for Figure 3—figure supplement 1A.
- https://cdn.elifesciences.org/articles/69521/elife-69521-fig3-figsupp1-data1-v3.xlsx
-
Figure 3—figure supplement 1—source data 2
Tables for Figure 3—figure supplement 1B.
- https://cdn.elifesciences.org/articles/69521/elife-69521-fig3-figsupp1-data2-v3.xlsx
Figure 4 with 1 supplement
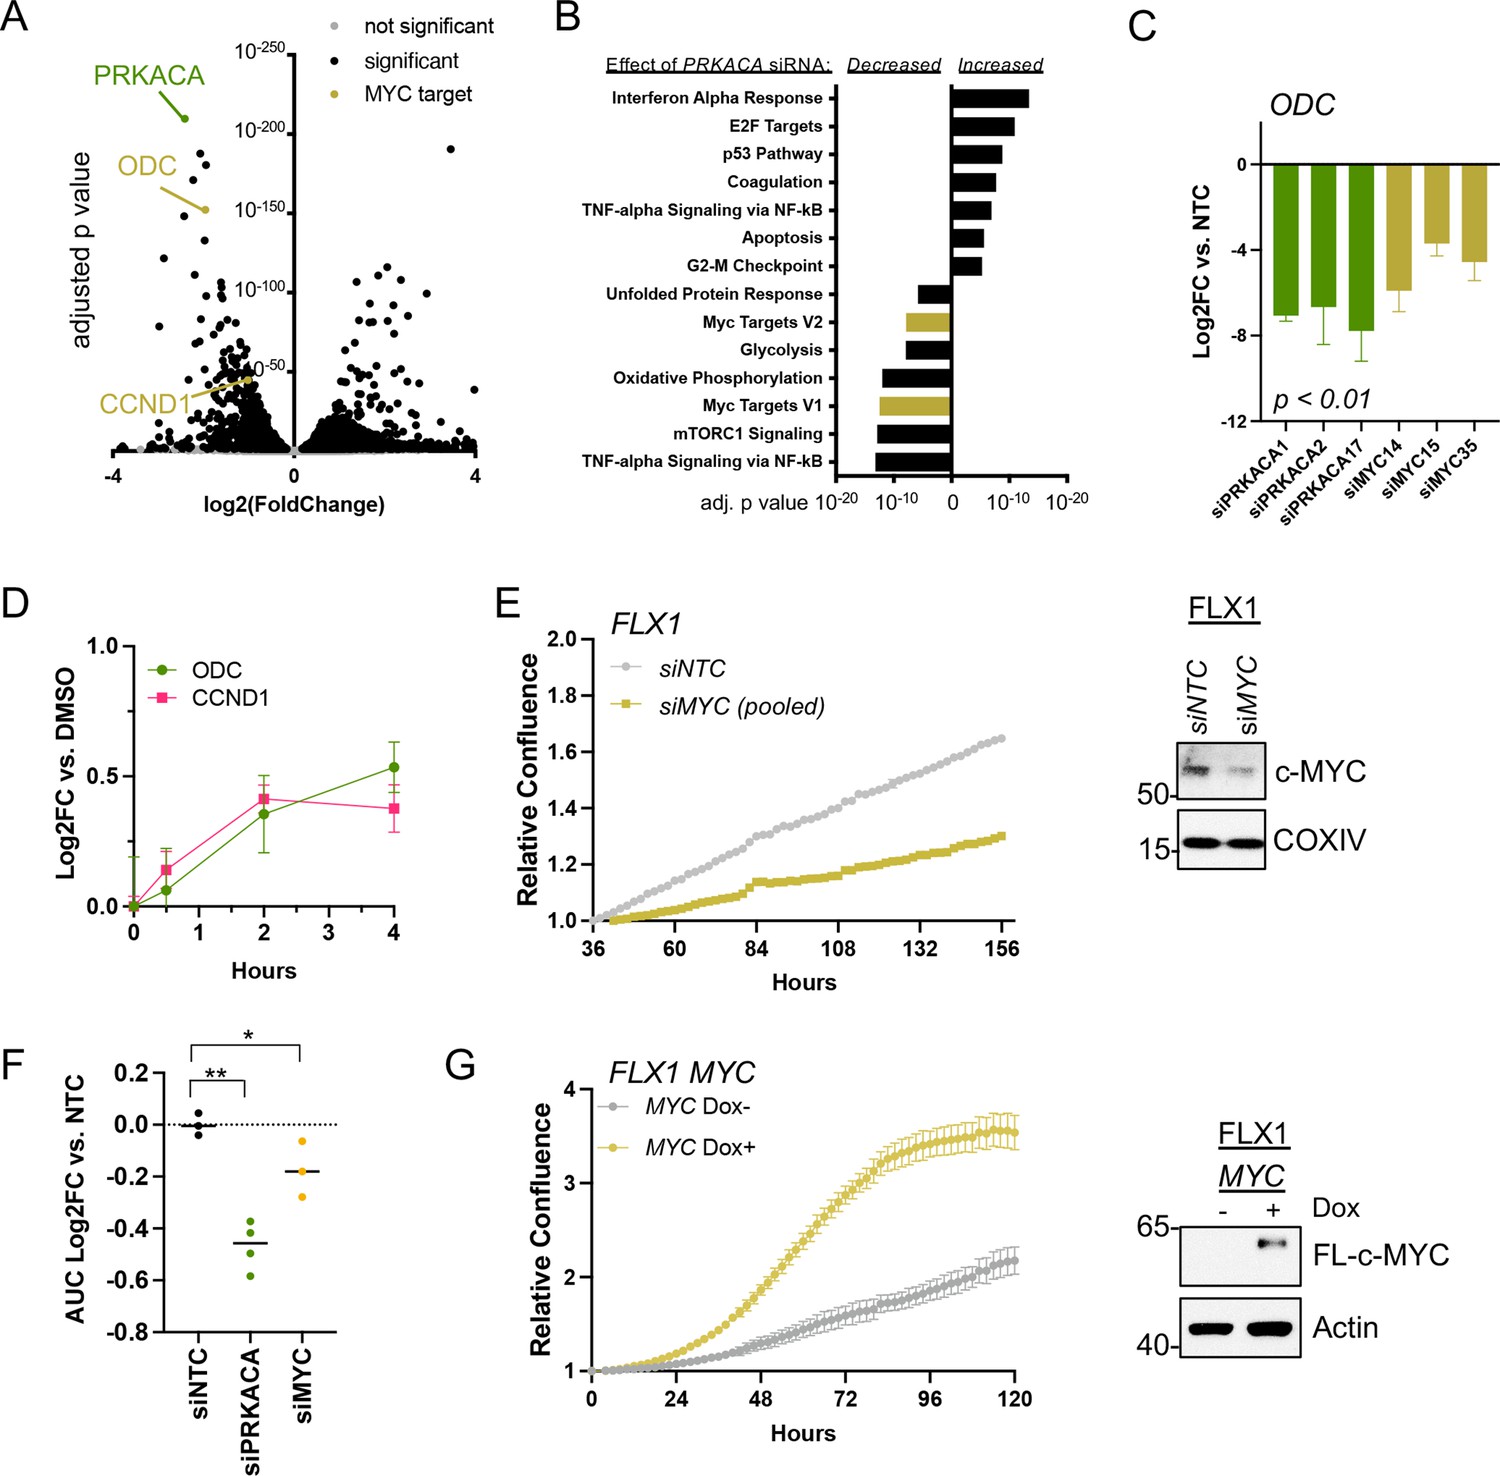
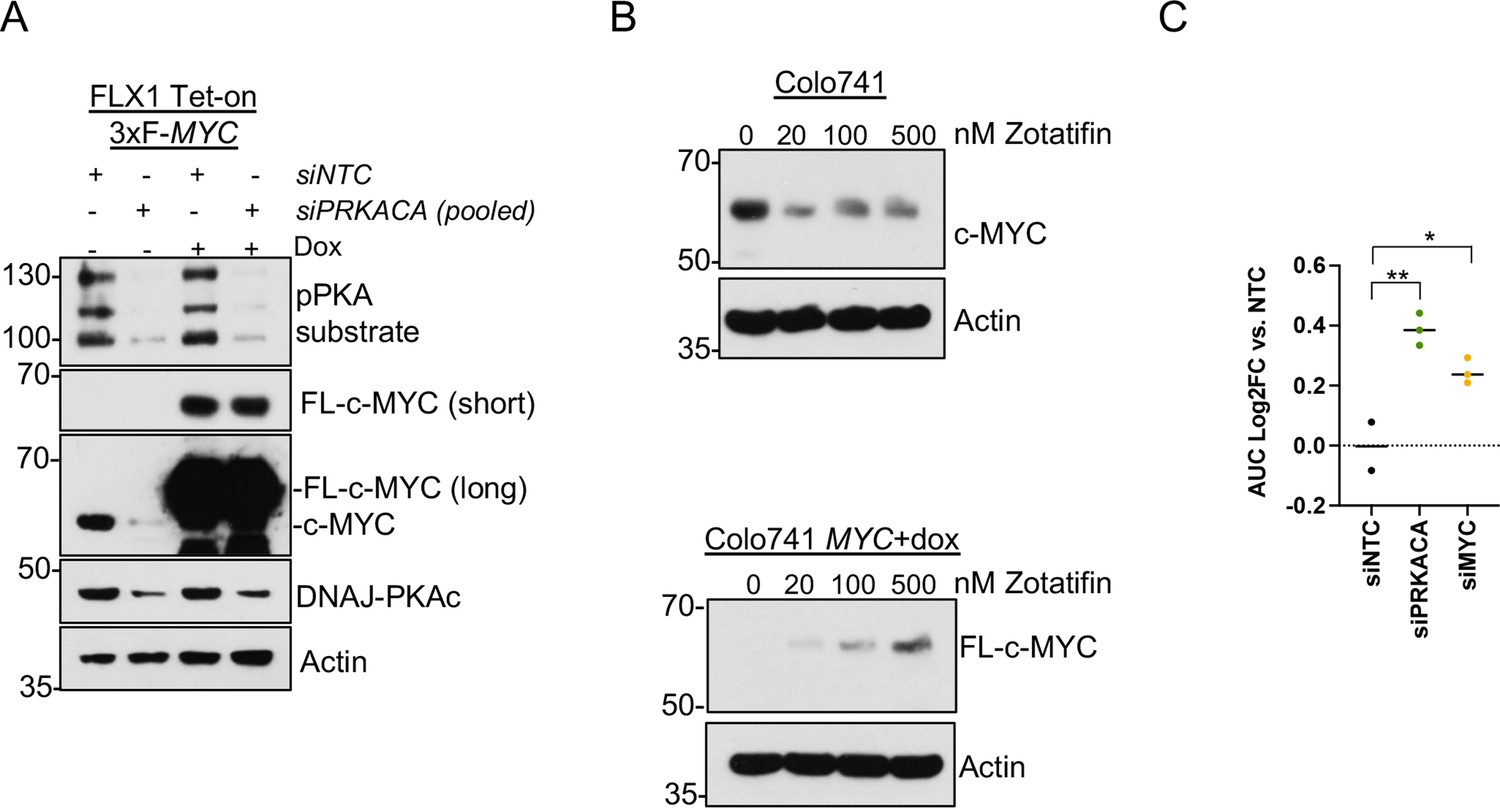
c-MYC alters transcription and proliferation in PKA-dependent cell models.
(A) RNASEQ data from FLX1 cells after 48 hr treatment with four pooled siRNA against PRKACA. PRKACA, ornithine decarboxylase (ODC) and Cyclin D1 (CCND1) are highlighted. (B) Gene set enrichment analysis of Hallmark Gene Sets altered by PRKACA siRNA treatment. MYC Targets V1 and MYC Targets V2 are among the most significantly reduced. (C) Confirmation of overlapping effects of PKA and c-MYC on gene expression: FLX1 cells were transfected with individual siRNA directed against PRKACA and MYC. ODC expression was measured 48 hr later by quantitative RT-PCR (MYC and PRKACA knockdown shown in Figure 1C). Log(2)fold change vs. cells transfected with a non-targeting control (NTC) siRNA is shown ± SD; technical replicates shown from a representative experiment. p Value determined using two-tailed Student’s t-test (D) Impact of 0–4 hr treatment with forskolin (FSK)/3-isobutyl-1-methylxanthine (IBMX) on ODC and CCND1 mRNA levels in FLX1; ± SD. (E) Relative confluence of FLX1 cells in 96 well plates after MYC knockdown with four pooled siRNA. FLX1 cells were incubated 36 hr before recording to ensure attachment and then monitored with real-time microscopy for 120 hr. Experiments were done in duplicate, and representative results were shown with mean of technical replicates ± SD, n=10 for each condition; confirmation of knockdown shown by western blot. (F) Summary data of relative cell confluence shown as average AUC measurement from technical replicates of FLX1 treated with NTC or individual PRKACA and MYC-targeting siRNA. Representative results of technical replicates shown. p Value determined using two-tailed Student’s t-test, *p<0.05 and ** p<0.001. (G) Relative confluence of engineered FLX1 cells with doxycycline (dox)-controlled 3xFLAG-MYC in 96 well plates after treatment with or without 1 μg/ml dox. Experiment was duplicate, the representative results shown with mean of technical replicates ± SD, n=6 for each condition; induction confirmed by Immunoblot at 48 hr dox treatment. 3xFLAG-tagged c-MYC (FL-c-MYC) is shown.
-
Figure 4—source data 1
Tables for Figure 4A.
- https://cdn.elifesciences.org/articles/69521/elife-69521-fig4-data1-v3.xlsx
-
Figure 4—source data 2
Tables for Figure 4B.
- https://cdn.elifesciences.org/articles/69521/elife-69521-fig4-data2-v3.xlsx
-
Figure 4—source data 3
Tables for Figure 4C.
- https://cdn.elifesciences.org/articles/69521/elife-69521-fig4-data3-v3.xlsx
-
Figure 4—source data 4
Tables for Figure 4D.
- https://cdn.elifesciences.org/articles/69521/elife-69521-fig4-data4-v3.xlsx
-
Figure 4—source data 5
Tables for Figure 4E.
- https://cdn.elifesciences.org/articles/69521/elife-69521-fig4-data5-v3.xlsx
-
Figure 4—source data 6
Images for Figure 4E.
- https://cdn.elifesciences.org/articles/69521/elife-69521-fig4-data6-v3.zip
-
Figure 4—source data 7
Tables for Figure 4F.
- https://cdn.elifesciences.org/articles/69521/elife-69521-fig4-data7-v3.xlsx
-
Figure 4—source data 8
Tables for Figure 4G.
- https://cdn.elifesciences.org/articles/69521/elife-69521-fig4-data8-v3.xlsx
-
Figure 4—source data 9
Images for Figure 4G.
- https://cdn.elifesciences.org/articles/69521/elife-69521-fig4-data9-v3.zip
Figure 4—figure supplement 1
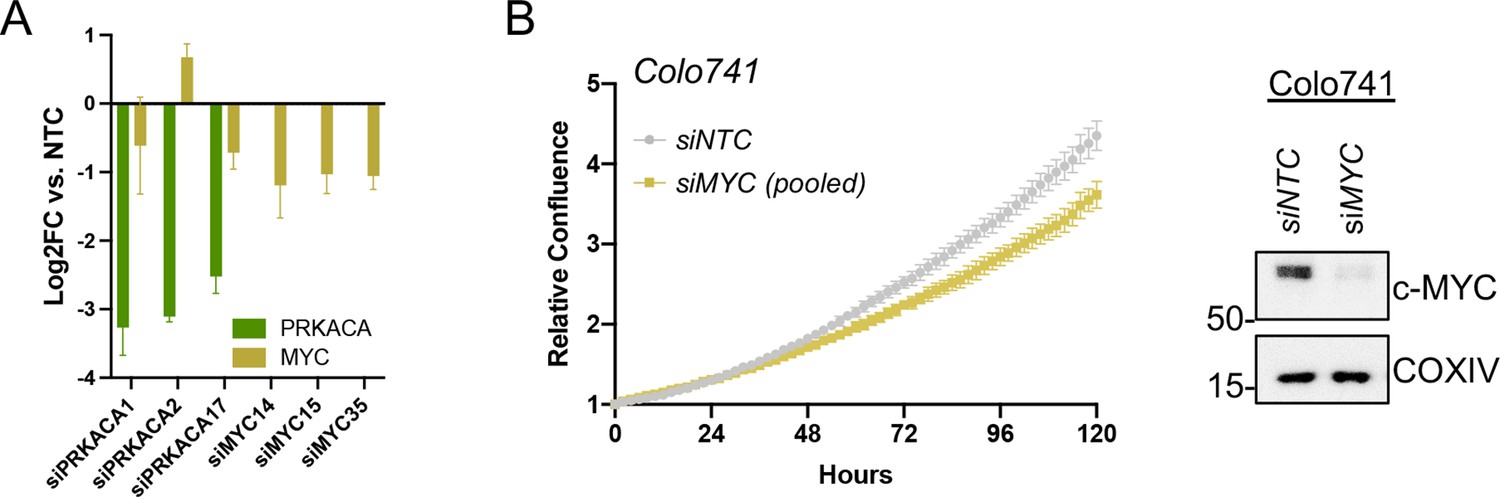
Data supporting c-MYC effects on transcription and proliferation.
(A) Confirmation of PRKACA and MYC knockdown for expression analysis in Figure 4E and proliferation data in Figure 4F; shown with mean of technical replicates ± SD. (B) Relative confluence of Colo741cells in 96 well plates after MYC knockdown with pooled siRNA over 120 hr. Experiments were done in duplicate, and representative results were shown with mean ± SD, n=10 wells for each condition; confirmation of knockdown shown by western blot.
-
Figure 4—figure supplement 1—source data 1
Tables for Figure 4—figure supplement 1A.
- https://cdn.elifesciences.org/articles/69521/elife-69521-fig4-figsupp1-data1-v3.xlsx
-
Figure 4—figure supplement 1—source data 2
Tables for Figure 4—figure supplement 1B.
- https://cdn.elifesciences.org/articles/69521/elife-69521-fig4-figsupp1-data2-v3.xlsx
-
Figure 4—figure supplement 1—source data 3
Images for Figure 4—figure supplement 1B.
- https://cdn.elifesciences.org/articles/69521/elife-69521-fig4-figsupp1-data3-v3.zip
Figure 5 with 2 supplements
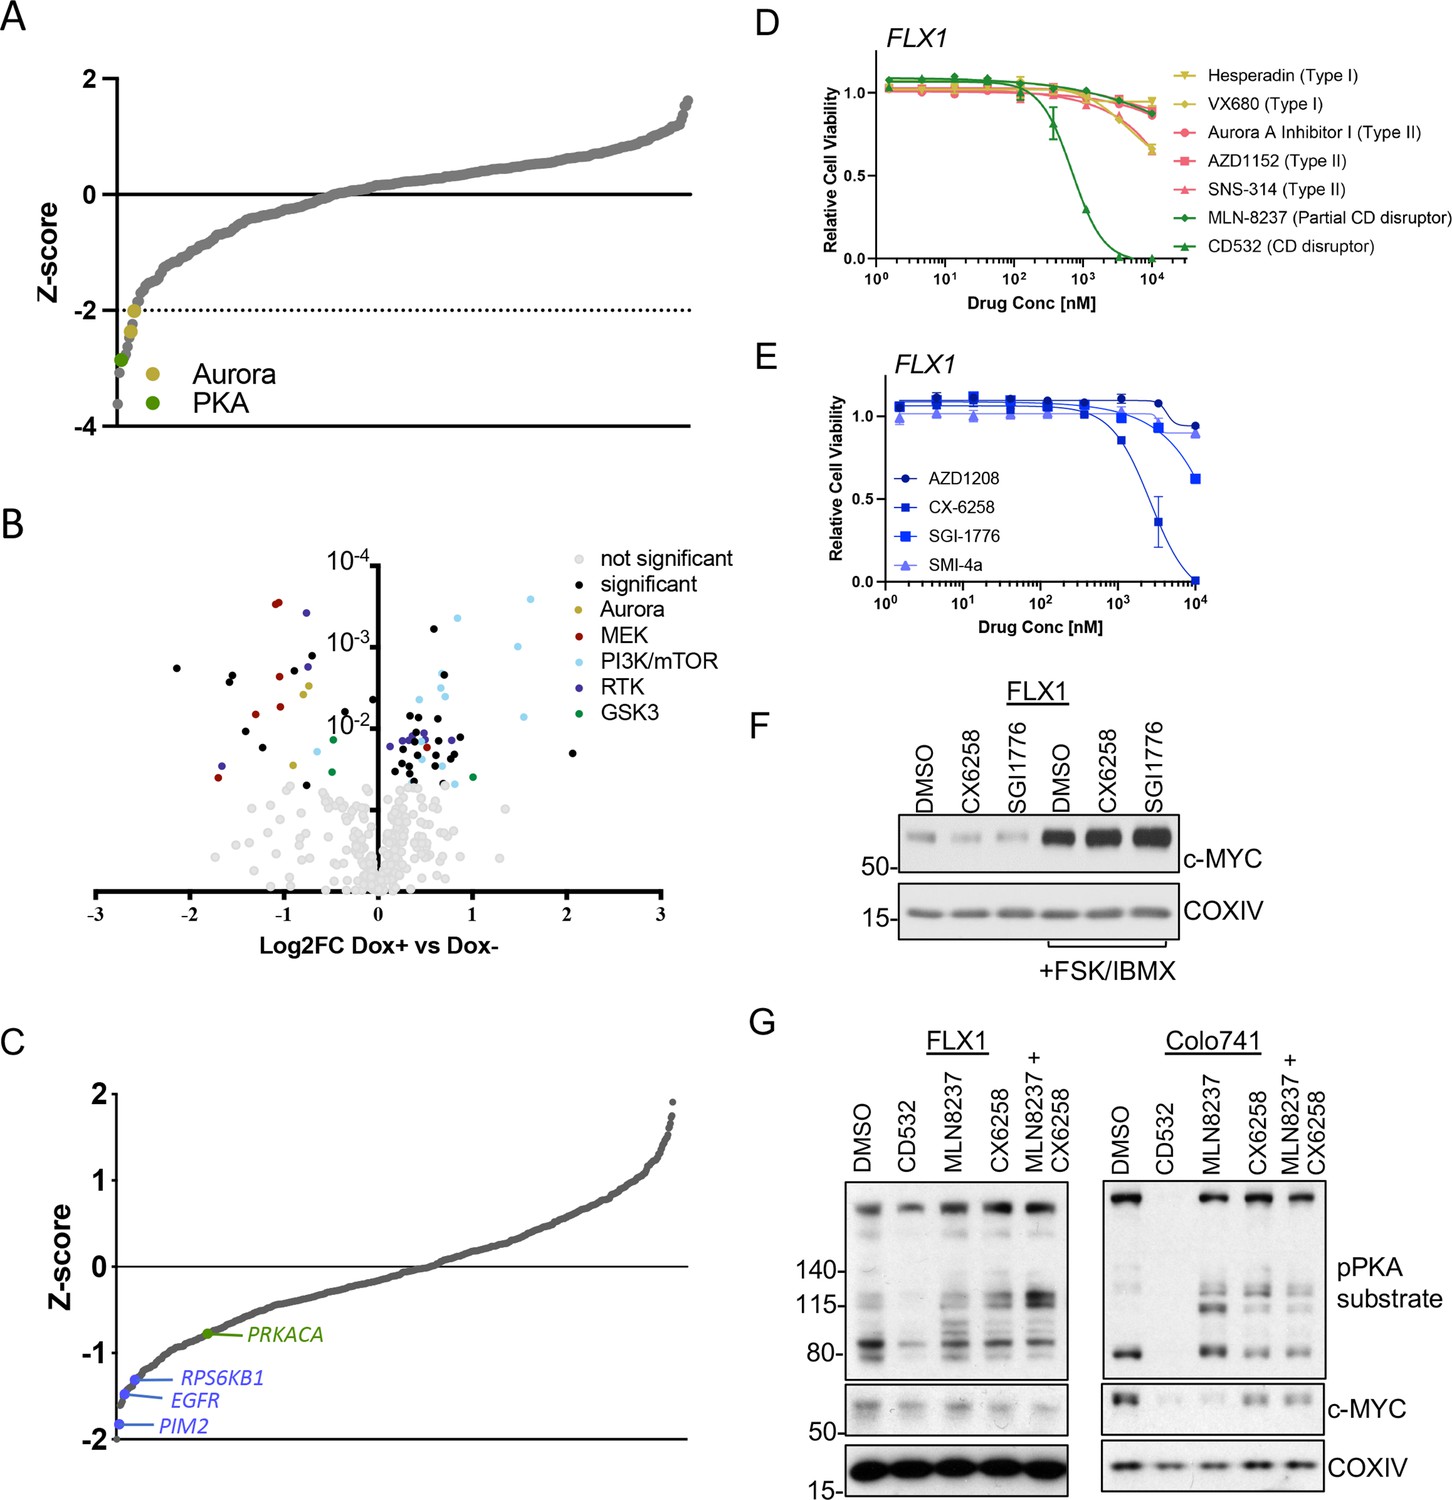
AURKA and GSK3B regulate c-MYC in PKA-dependent cell models.
(A) Summary data from the FLX1 cell line treated with 352 kinase inhibitors from an advanced clinical compound library at 2 μM for 120 hr. The targets of selected compounds with a z-score ≥2 are highlighted, with the PKA inhibiting tool compound H89 shown. Average of three biological replicates is shown. (B) Impact of doxycycline (dox) induction of 3xFLAG-PRKAR1AG325D on drug sensitivity in FLX1: Cells were incubated with 1 μg/ml dox overnight and compound added on the following day; log2FC vs. median was derived ± dox, and then subtracted to identify those compounds whose activity was altered by 3xFLAG-PRKAR1AG325D. Data are averaged from three biological replicates. Inhibitors with p<0.05 were marked. Selected inhibitors were color coded based on their targets. (C) Kinase pooled siRNA library screen with FLX1 in 384 well plates shows the effect of each target kinase on cell proliferation (average of four biological replicates). Selected non-metabolic kinases that decrease cell proliferation with z-score –1 were marked. (D) FLX1 cells treated with dose curves of multiple AURKA inhibitors for 120 hr. Relative cell viability was measured by CTG assay vs. untreated control samples. Results are the mean ± SEM of triple biological replicates, three technical replicates per biological replicate. Inhibitors are color coded based on their binding mode. (E) FLX1 cells treated with dose curves of multiple PIM inhibitors as in B. (F) Effect of 24 hr treatment with 5 μM of different PIM inhibitors ±4 hr treatment with 50 μM forskolin (FSK)/3-isobutyl-1-methylxanthine (IBMX). (G) Immunoblot showing the change of PKA activity, as indicated by phospho-PKA substrate, and c-MYC and n-MYC levels in Colo741 and FLX1 cells after treatment with DMSO, 1 μM CD532, MLN8237, CX6258, or combination of 1 μM MLN8237 and 1 μM CX6258 for 24 hr.
-
Figure 5—source data 1
Tables for Figure 5A.
- https://cdn.elifesciences.org/articles/69521/elife-69521-fig5-data1-v3.xlsx
-
Figure 5—source data 2
Tables for Figure 5B.
- https://cdn.elifesciences.org/articles/69521/elife-69521-fig5-data2-v3.xlsx
-
Figure 5—source data 3
Tables for Figure 5C.
- https://cdn.elifesciences.org/articles/69521/elife-69521-fig5-data3-v3.xlsx
-
Figure 5—source data 4
Tables for Figure 5D.
- https://cdn.elifesciences.org/articles/69521/elife-69521-fig5-data4-v3.xlsx
-
Figure 5—source data 5
Tables for Figure 5E.
- https://cdn.elifesciences.org/articles/69521/elife-69521-fig5-data5-v3.xlsx
-
Figure 5—source data 6
Images for Figure 5F.
- https://cdn.elifesciences.org/articles/69521/elife-69521-fig5-data6-v3.zip
Figure 5—figure supplement 1
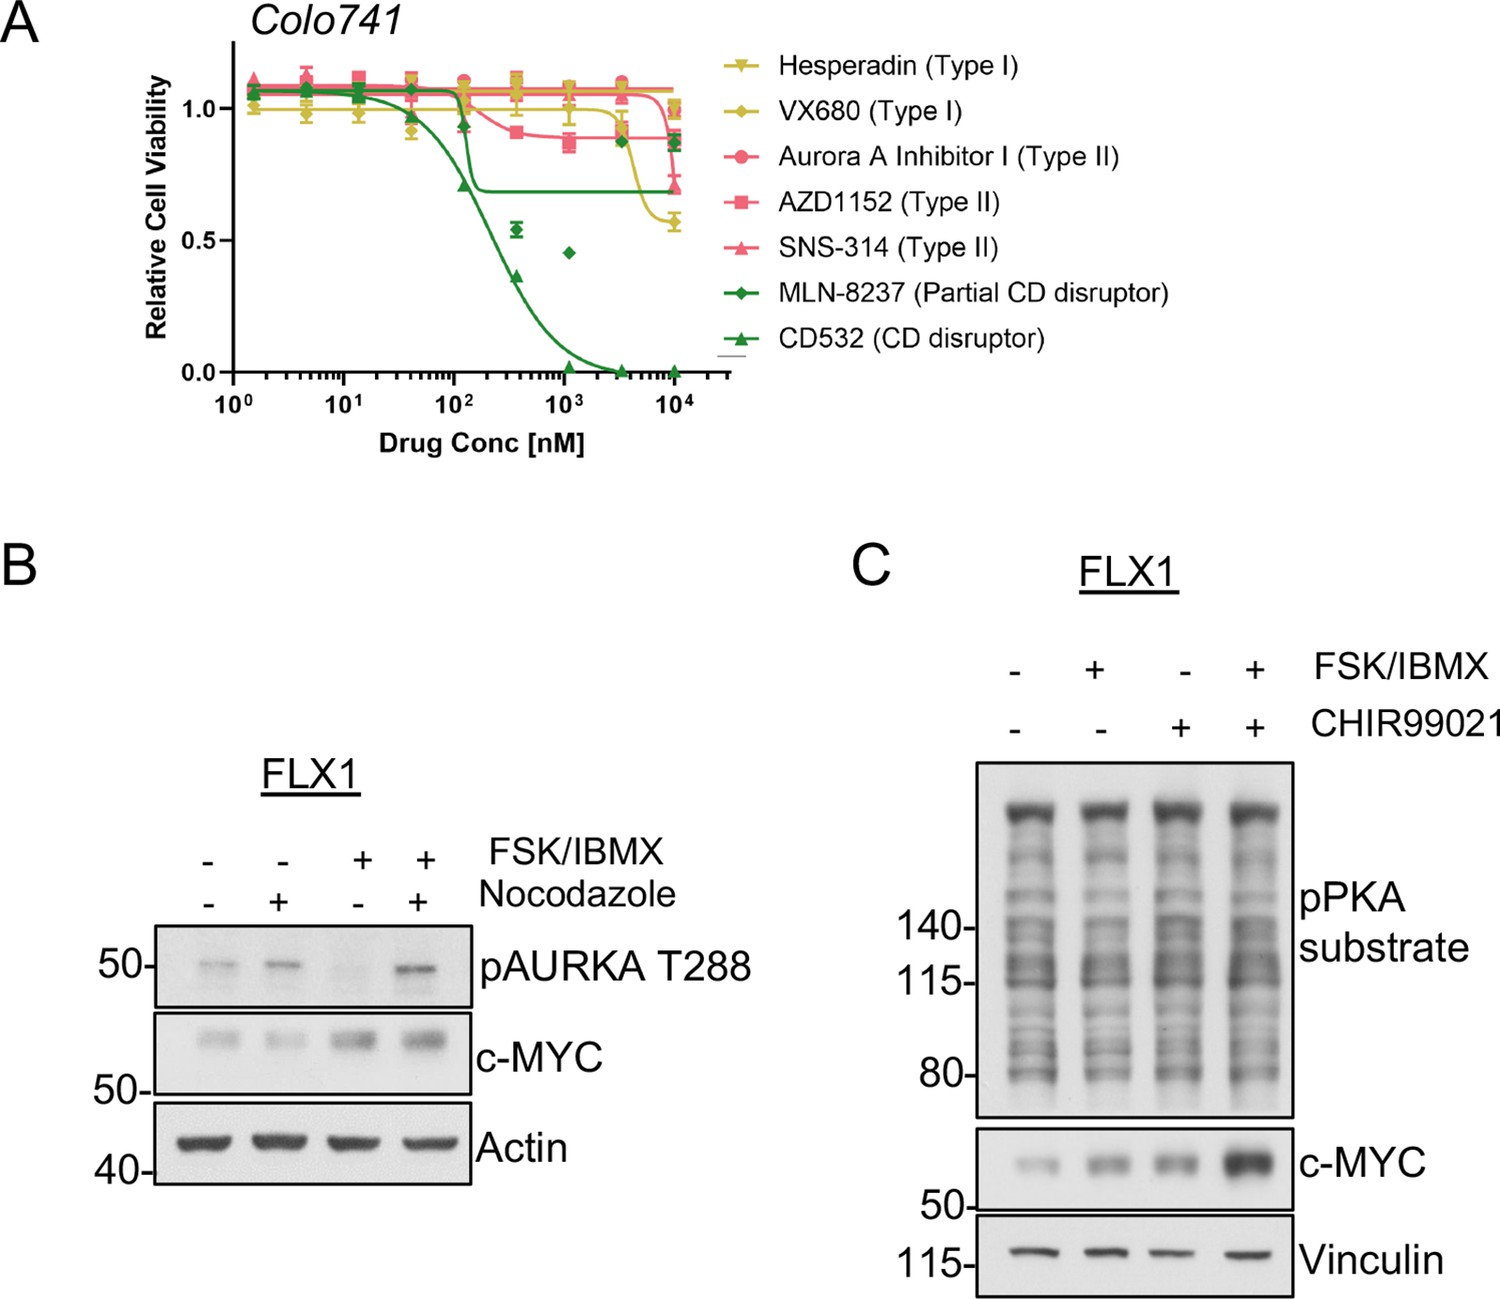
Signaling effects on c-MYC in PKA-driven cells.
(A) Colo741 cells treated with dose curves of multiple AURKA inhibitors for 72 hr. Relative cell viability was measured by CTG assay vs. untreated control samples. Results are the mean ± SEM of three biological replicates and three technical replicates per biological replicate. Inhibitors are color coded based on their binding mode. (B) Immunoblots showing the levels of pAURKA T288 in FLX1 cells either spontaneously cycling or synchronized overnight with nocodazole and treated with 50 μM forskolin (FSK)/3-isobutyl-1-methylxanthine (IBMX) for 4 hr. Total AURKA was not clearly detected so is not included. (C) Immunoblots showing the expression of c-MYC FLX1 cells after treating with 1 μM of the GSK3A/B inhibitor CHIR99021 for 24 hr and/or 50 μM FSK/IBMX for 2 hr.
-
Figure 5—figure supplement 1—source data 1
Tables for Figure 5—figure supplement 1A.
- https://cdn.elifesciences.org/articles/69521/elife-69521-fig5-figsupp1-data1-v3.xlsx
-
Figure 5—figure supplement 1—source data 2
Images for Figure 5—figure supplement 1B.
- https://cdn.elifesciences.org/articles/69521/elife-69521-fig5-figsupp1-data2-v3.zip
-
Figure 5—figure supplement 1—source data 3
Images for Figure 5—figure supplement 1C.
- https://cdn.elifesciences.org/articles/69521/elife-69521-fig5-figsupp1-data3-v3.zip
Figure 5—figure supplement 2
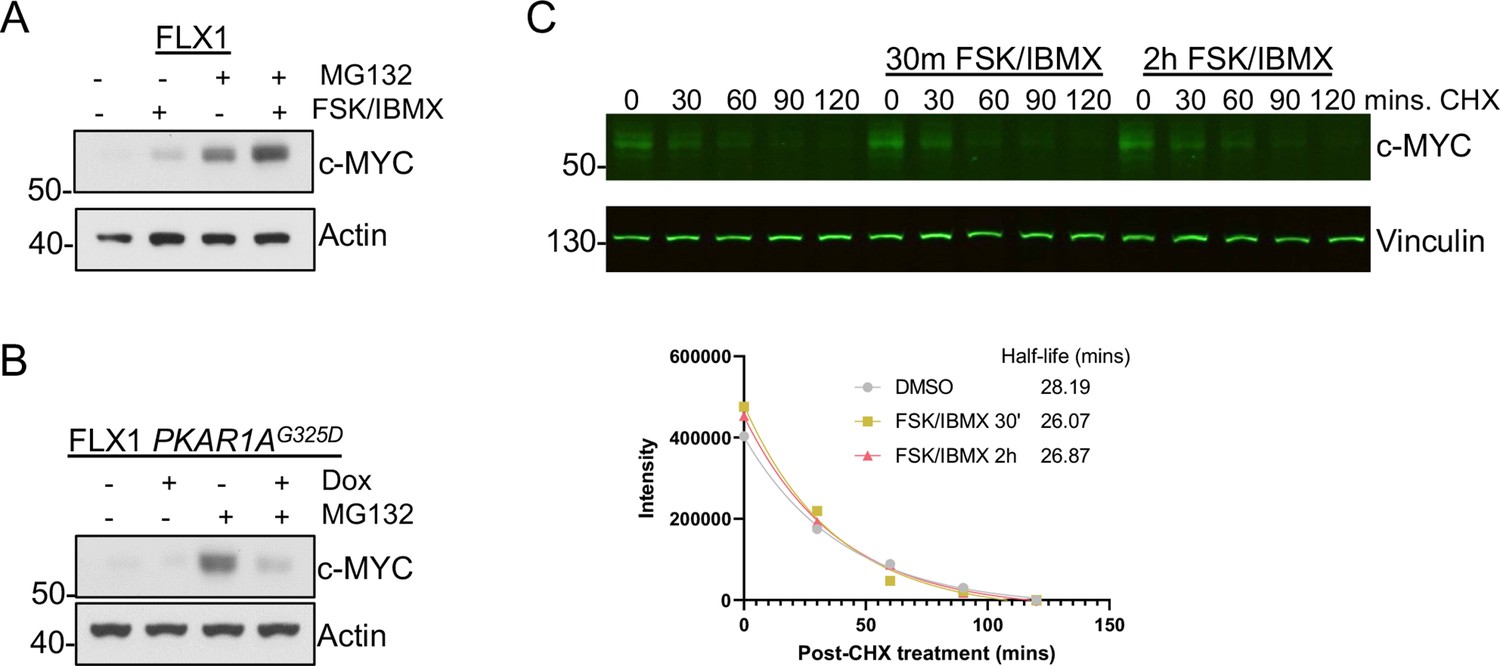
Proteasome-independent PKA effects on c-MYC, (A) immunoblots showing the change of c-MYC protein in FLX1 cells after treatment with 50 μM forskolin (FSK)/3-isobutyl-1-methylxanthine (IBMX) and/or 20 μM MG132 for 2 hr.
(B) Immunoblots showing the change of c-MYC level in engineered FLX1 cells with doxycycline (dox)-inducible 3xFLAG- PRKAR1AG325D after dox for 24 hr and/or 20 μM MG132 for 2 hr. (C) Li-Cor western blot analysis showing the change of c-MYC level in FLX1 during a cycloheximide chase after stimulation with 50 μM FSK/IBMX for 2 hr and 30 min. Degradation curve and half-life of c-MYC as quantified by Li-Cor from individual samples shown below, T1/2 calculated using nonlinear regression in GraphPad Prism.
-
Figure 5—figure supplement 2—source data 1
Images for Figure 5—figure supplement 2A.
- https://cdn.elifesciences.org/articles/69521/elife-69521-fig5-figsupp2-data1-v3.zip
-
Figure 5—figure supplement 2—source data 2
Images for Figure 5—figure supplement 2B.
- https://cdn.elifesciences.org/articles/69521/elife-69521-fig5-figsupp2-data2-v3.zip
-
Figure 5—figure supplement 2—source data 3
Images and tables for Figure 5—figure supplement 2C.
- https://cdn.elifesciences.org/articles/69521/elife-69521-fig5-figsupp2-data3-v3.zip
Figure 6
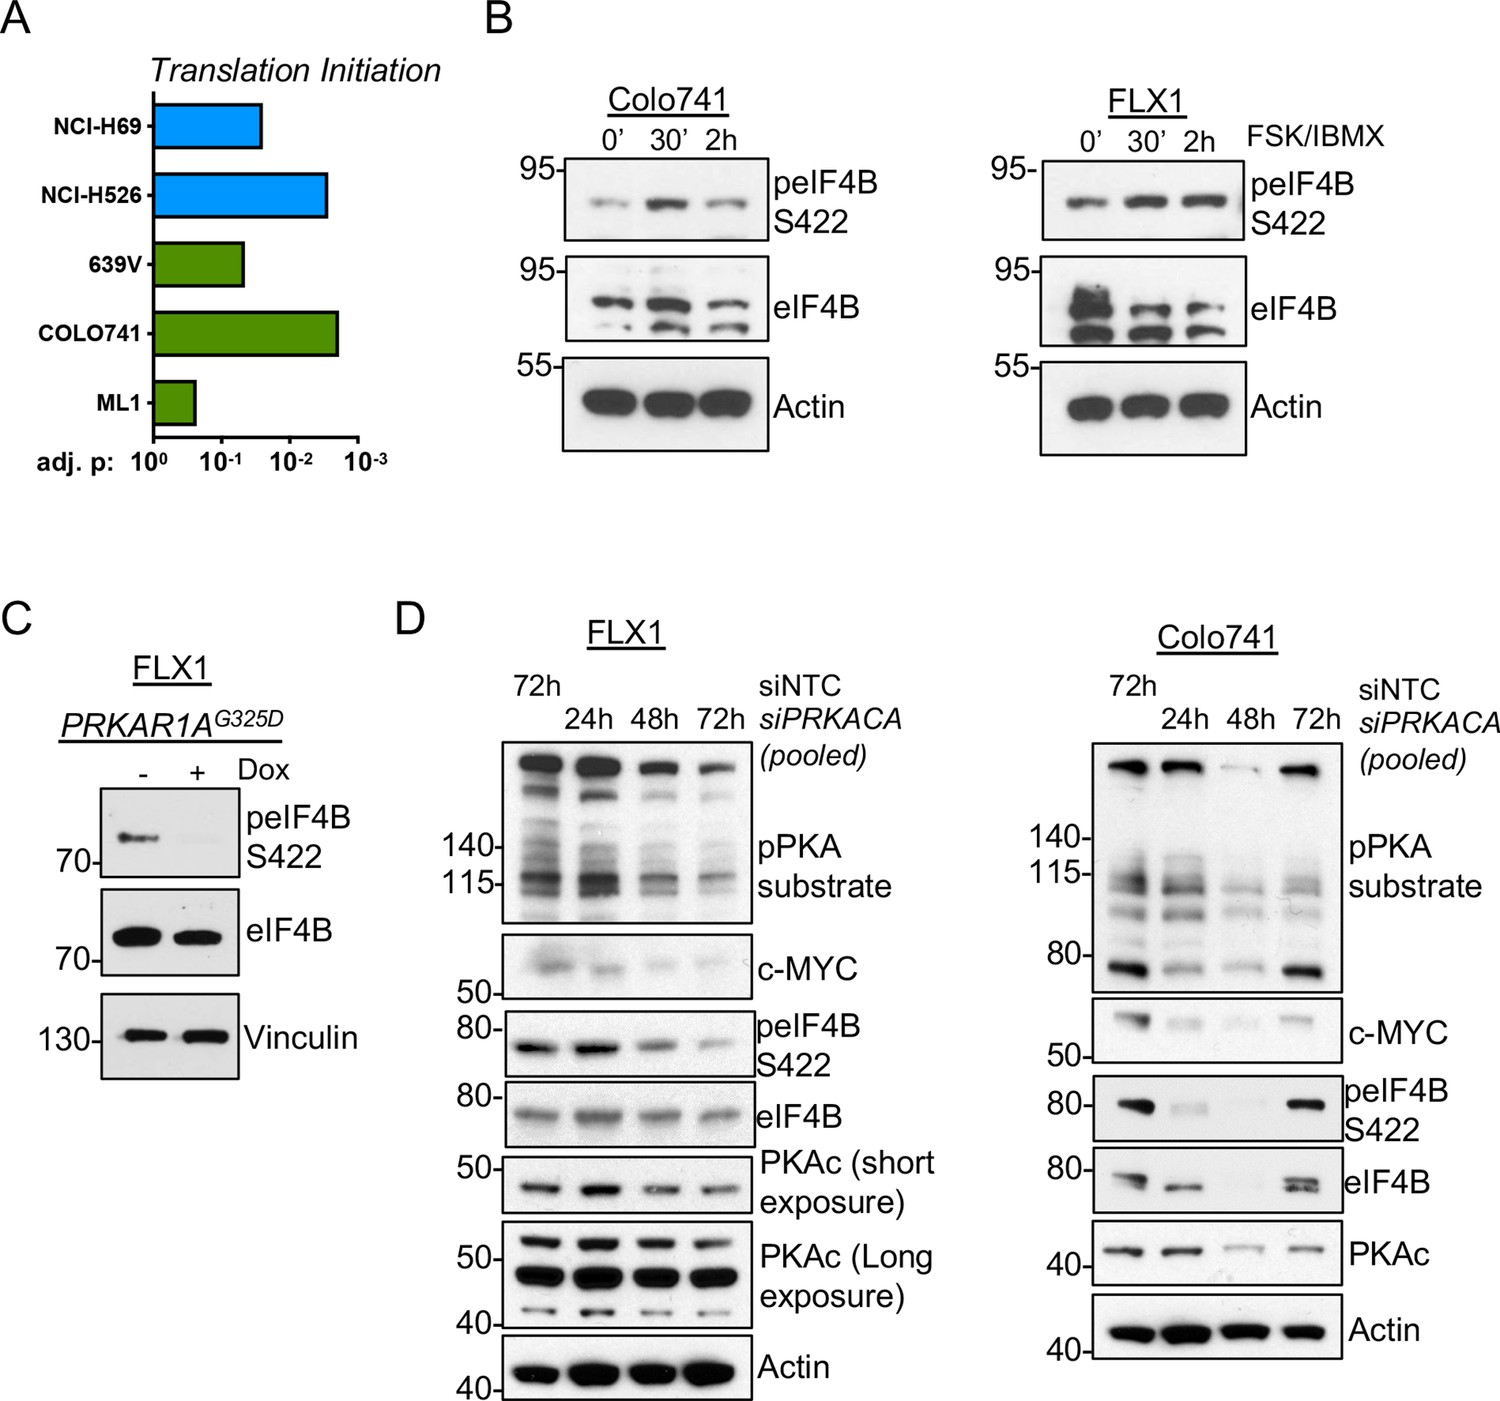
PKA signaling supports translation initiation.
(A) Gene set enrichment analysis (GSEA) of significantly altered phosphoproteins following doxycycline (dox) induction of PKA in proteomics data from this study or chemical PKA stimulation in our prior publications. Results are shown for Hallmark gene sets, with statistically significant enrichment of altered phosphoproteins annotated to be involved in translation initiation. (B) Time course of forskolin (FSK)/3-isobutyl-1-methylxanthine (IBMX) in Colo741 and FLX1 showing increased phosphorylation of eIF4B Ser422. (C) Impact of 24 hr dox treatment on phosphorylation of eIF4B at Ser422 in engineered FLX1 cells with dox-inducible 3xFLAG-PRKAR1AG325D. (D) Immunoblots showing the change of PKA activity and PKAc and c-MYC expression and phosphorylation of eIF4B Ser422 in Colo741 and FLX1 cells after pooled PRKACA siRNA knockdown for 24, 48, and 72 hr vs. 72 hr with non-targeting control (NTC). Long and short exposures are used in FLX1 to show knockdown effect in wild type (WT) PKAc and the DNAJ-PKAc fusion.
-
Figure 6—source data 1
Tables for Figure 6A.
- https://cdn.elifesciences.org/articles/69521/elife-69521-fig6-data1-v3.xlsx
-
Figure 6—source data 2
Images for Figure 6B.
- https://cdn.elifesciences.org/articles/69521/elife-69521-fig6-data2-v3.zip
-
Figure 6—source data 3
Images for Figure 6C.
- https://cdn.elifesciences.org/articles/69521/elife-69521-fig6-data3-v3.zip
-
Figure 6—source data 4
Images for Figure 6D part 1/4.
- https://cdn.elifesciences.org/articles/69521/elife-69521-fig6-data4-v3.zip
-
Figure 6—source data 5
Images for Figure 6D part 2/4.
- https://cdn.elifesciences.org/articles/69521/elife-69521-fig6-data5-v3.zip
-
Figure 6—source data 6
Images for Figure 6D part 3/4.
- https://cdn.elifesciences.org/articles/69521/elife-69521-fig6-data6-v3.zip
-
Figure 6—source data 7
Images for Figure 6D part 4/4.
- https://cdn.elifesciences.org/articles/69521/elife-69521-fig6-data7-v3.zip
Figure 7 with 1 supplement
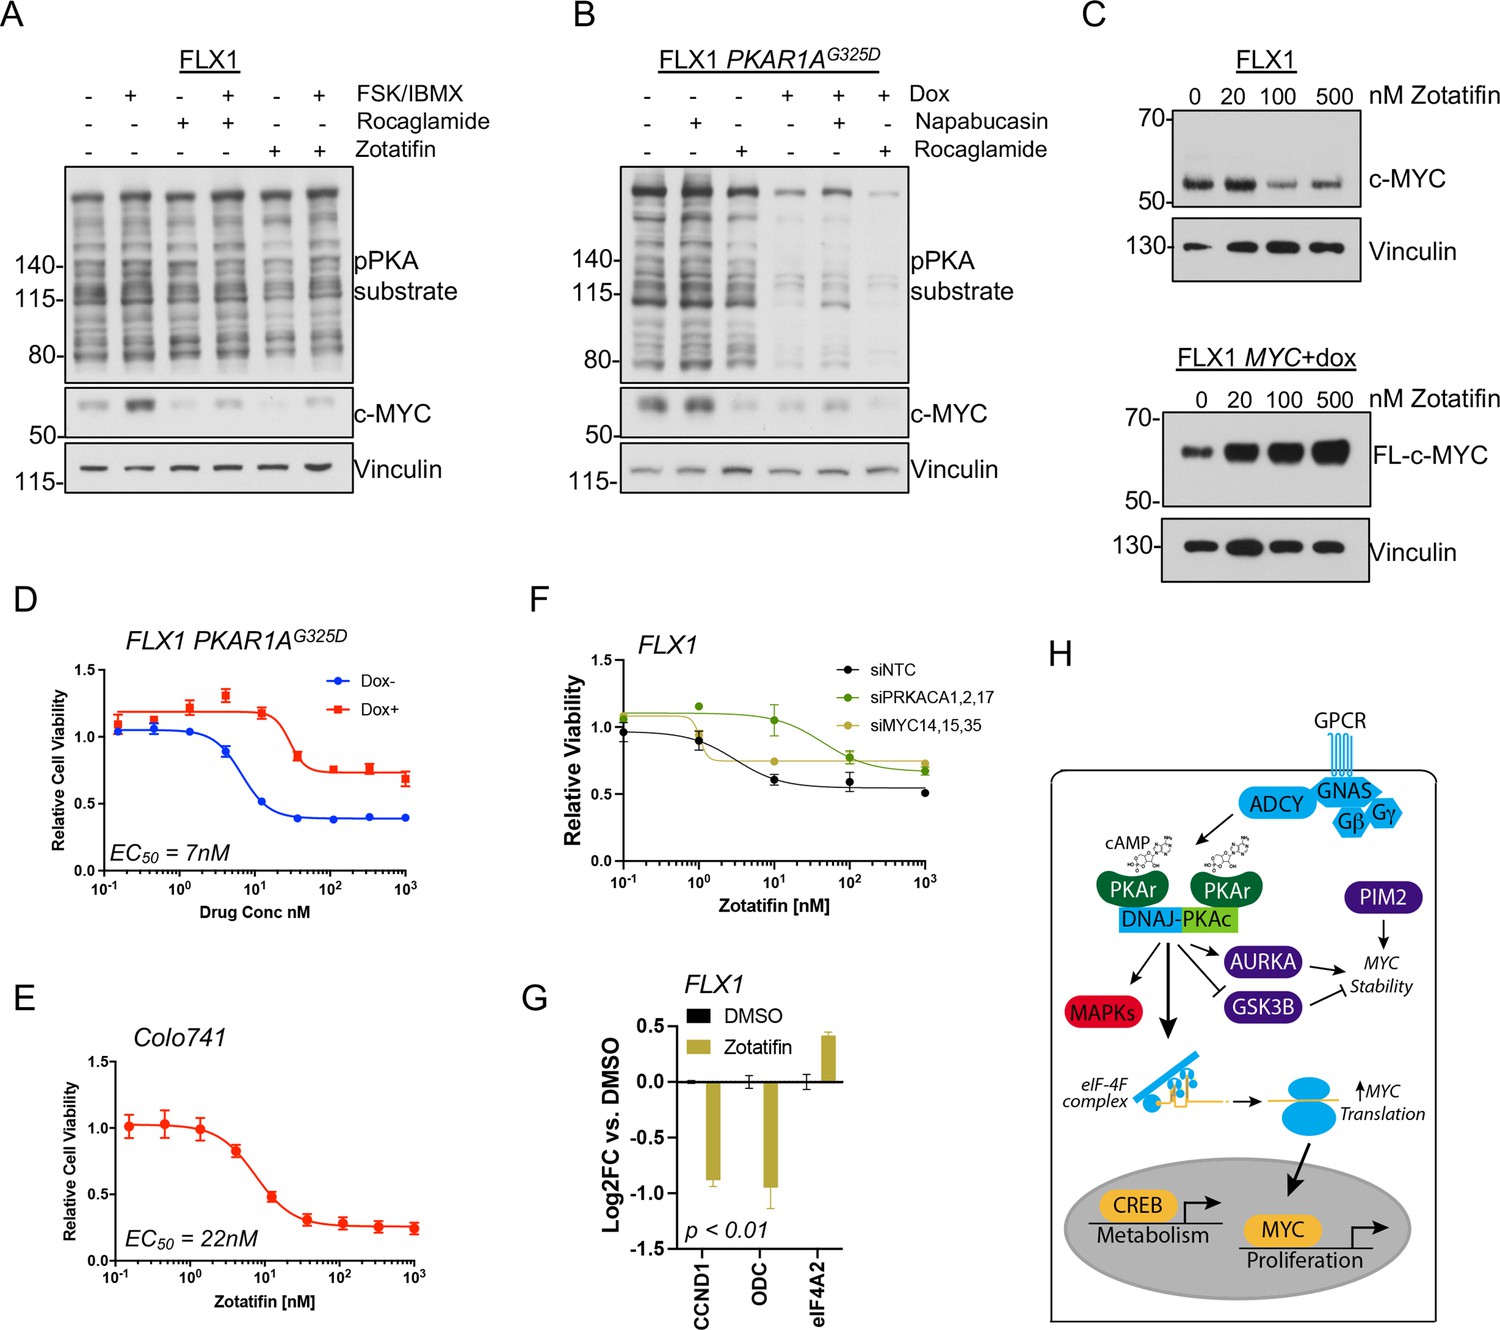
PKA effects on c-MYC are blocked by eIF4A inhibition.
(A) Immunoblots showing the c-MYC protein levels in FLX1 cells after treatment with 100 nM rocaglamide or zotatifin for 24 hr and/or 50 μM forskolin (FSK)/3-isobutyl-1-methylxanthine (IBMX) for 4 hr. (B) Immunoblots showing the change of c-MYC level in engineered FLX1 cells with doxycycline (dox)-inducible 3xFLAG-PRKAR1AG325D after dox induction for 48 hr and treatment with 1 μM napabucasin or 100 nM rocaglamide for 24 hr. (C) Parental FLX1 cells or FLX1 with 48 hr dox-induced 3xFLAG-MYC lacking a 5’UTR treated with escalating doses of zotatifin for 24 hr and blotted for c-MYC. (D) Impact of 72 hr of a dose curve of zotatifin alone or in combination with dox-induced 3xFLAG- PRKAR1AG325D on FLX1 viability by Cell Titer-Glo. Results from technical replicates of a representative experiment ± SD relative to DMSO for each curve. (E) Parental Colo741 treated as in D. (F) Zotatifin sensitivity tested in FLX1 as in D, following siRNA knockdown of PRKACA or MYC. Results combined from three siRNA. Quantitative RT-PCR (qRT-PCR) confirmation of knockdown is shown in Figure 1C. (G) Impact of 24 hr 100 nM zotatifin on c-MYC targets by qRT-PCR; eIF-4A2 induction is a known effect of zotatifin and is shown as a control. Mean of technical replicates from one representative experiment is shown ± SD, p value determined with two-tailed Student’s t-test. (H) Schematic of DNAJ-PKAc mediating cell proliferation in fibrolamellar carcinoma (FLC) by increasing c-MYC expression by increased translation, with additional effects via GSK3B, AURKA, and PIM2.
-
Figure 7—source data 1
Images for Figure 7A.
- https://cdn.elifesciences.org/articles/69521/elife-69521-fig7-data1-v3.zip
-
Figure 7—source data 2
Images for Figure 7B.
- https://cdn.elifesciences.org/articles/69521/elife-69521-fig7-data2-v3.zip
-
Figure 7—source data 3
Images for Figure 7C.
- https://cdn.elifesciences.org/articles/69521/elife-69521-fig7-data3-v3.zip
-
Figure 7—source data 4
Tables for Figure 7D.
- https://cdn.elifesciences.org/articles/69521/elife-69521-fig7-data4-v3.xlsx
-
Figure 7—source data 5
Tables for Figure 7E.
- https://cdn.elifesciences.org/articles/69521/elife-69521-fig7-data5-v3.xlsx
-
Figure 7—source data 6
Tables for Figure 7F.
- https://cdn.elifesciences.org/articles/69521/elife-69521-fig7-data6-v3.xlsx
-
Figure 7—source data 7
Tables for Figure 7G.
- https://cdn.elifesciences.org/articles/69521/elife-69521-fig7-data7-v3.xlsx
-
Figure 7—source data 8
Images for Figure 7H.
- https://cdn.elifesciences.org/articles/69521/elife-69521-fig7-data8-v3.zip
Figure 7—figure supplement 1
Data supporting reversal of PKA effects on c-MYC by eIF4A inhibition.
(A) Immunoblot showing the effect of 48 hr of non-targeting control (NTC) or four pooled PRKACA siRNA on endogenous c-MYC or overexpressed c-MYC lacking a 5’UTR. Doxycycline (dox) treatment was 1 μg/ml for 24 hr prior to harvest. (B) Parental Colo741 cells or Colo741 with dox-inducible 3xFLAG-MYC lacking a 5’UTR were treated with escalating doses of zotatifin and analyzed for c-MYC expression. (C) AUC determination for each siRNA used for zotatifin viability experiment in Figure 4F. Average of three technical replicates shown. p Value determined using two-tailed Student’s t-test, *p<0.05, and ** p<0.01.
-
Figure 7—figure supplement 1—source data 1
Images for Figure 7—figure supplement 1A.
- https://cdn.elifesciences.org/articles/69521/elife-69521-fig7-figsupp1-data1-v3.zip
-
Figure 7—figure supplement 1—source data 2
Images for Figure 7—figure supplement 1B.
- https://cdn.elifesciences.org/articles/69521/elife-69521-fig7-figsupp1-data2-v3.zip
-
Figure 7—figure supplement 1—source data 3
Tables for Figure 7—figure supplement 1A.
- https://cdn.elifesciences.org/articles/69521/elife-69521-fig7-figsupp1-data3-v3.xlsx
Author response image 1
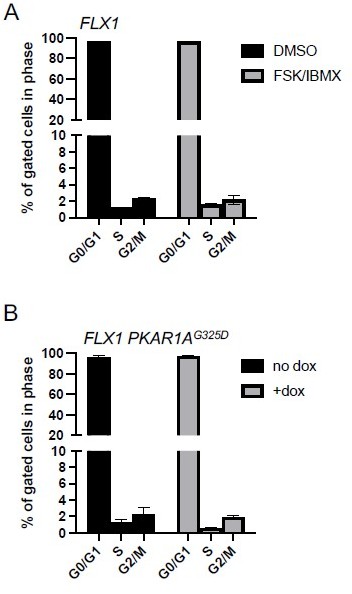
PKA effects on cell cycle distribution in FLX1.
(A) FLX1 parental cells were treated with DMSO or 50 μM FSK/IBMX for 4 hours, with BrdU added for the last 20 minutes. Cells were then stained for nuclear content with 7-AAD and active DNA synthesis with anti-BrdU antibody, then acquired by FACS. Average of 3 samples is shown. Statistically significant increase in S-phase% with FSK/IBMX was noted by one-tailed Student’s t-Test (p = 0.002). (B) FLX1 cells with dox-inducible 3xFLAG-PKAR1AG325D were treated with ±dox for 48 hours and then analyzed as above. Statistically significant decrease in S-phase% with dox was noted by one-tailed Student’s t-Test (p = 0.03). We note the markedly low S-phase percentage shown here. FLX1 cells have a >72 hour doubling time, and the same labeling/staining conditions show significantly higher S-phase% in many other tumor cell lines in our hands.
Author response image 2
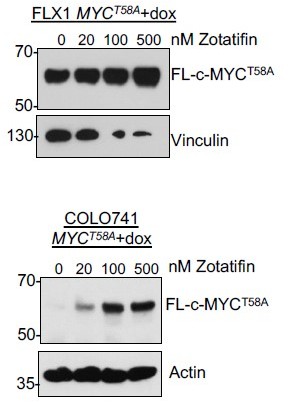
FLX1 and Colo741 with dox-induced 3xFLAG-c-MYC lacking a 5’UTR and including the stabilizing T58A mutation.
Dox treatment was 1 μG/mL for 40 hours prior to harvest with zotatifin or DMSO for 24 hours. Of note, the MYCT58A allele was toxic in both cells but particularly in FLX1, resulting in reduced expression of vinculin and other housekeeping proteins.
Author response image 3
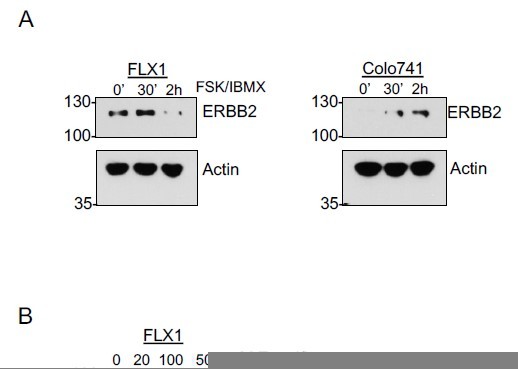
FSK/IBMX and zotatifin effects on other translationally regulated transcripts.
(A) Time course of FSK/IBMX in Colo741 and FLX1 showing increased expression of ERBB2; kinetics are somewhat different between the two cell lines. (B) Effect of 24 hour treatment with 100 nM zotatifin on ERBB2 protein levels performed on same samples as shown in Figure 7C.
Tables
Author response table 1
| CRISPR | ||
|---|---|---|
| PRKACA | MYC | |
| Average | -0.24 | -1.46 |
| 639V | -0.14 | -0.67 |
| Colo741 | -0.35 | -1.38 |
| siRNA | ||
| PRKACA | MYC | |
| Average | -0.15 | -0.48 |
| Colo741 | -1.38 | -0.35 |
Additional files
-
Supplementary file 1
Summary of TCGA analysis.
- https://cdn.elifesciences.org/articles/69521/elife-69521-supp1-v3.xlsx
-
Supplementary file 2
Individual phosphoproteomic, phosfate, and multiplex inhibitor beads (MIBs) datasets.
- https://cdn.elifesciences.org/articles/69521/elife-69521-supp2-v3.xlsx
-
Supplementary file 3
Network propagation results.
- https://cdn.elifesciences.org/articles/69521/elife-69521-supp3-v3.xlsx
-
Supplementary file 4
RNASEQ primary data.
- https://cdn.elifesciences.org/articles/69521/elife-69521-supp4-v3.xlsx
-
Supplementary file 5
Drug screen in FLX1.
- https://cdn.elifesciences.org/articles/69521/elife-69521-supp5-v3.xlsx
-
Supplementary file 6
Drug screen in FLX1 with dox-inducible PRKAR1AG325D.
- https://cdn.elifesciences.org/articles/69521/elife-69521-supp6-v3.xlsx
-
Supplementary file 7
siKINOME final results.
- https://cdn.elifesciences.org/articles/69521/elife-69521-supp7-v3.xlsx
-
MDAR checklist
- https://cdn.elifesciences.org/articles/69521/elife-69521-mdarchecklist1-v3.docx
Download links
A two-part list of links to download the article, or parts of the article, in various formats.
Downloads (link to download the article as PDF)
Open citations (links to open the citations from this article in various online reference manager services)
Cite this article (links to download the citations from this article in formats compatible with various reference manager tools)
Oncogenic PKA signaling increases c-MYC protein expression through multiple targetable mechanisms
eLife 12:e69521.
https://doi.org/10.7554/eLife.69521


