An autoinhibitory clamp of actin assembly constrains and directs synaptic endocytosis
- Department of Biology, Brandeis University, United States
- Department of Biochemistry and NCCR Chemical Biology, University of Geneva, Switzerland
- Department of Mathematics, Brandeis University, United States
Figures
Figure 1 with 2 supplements
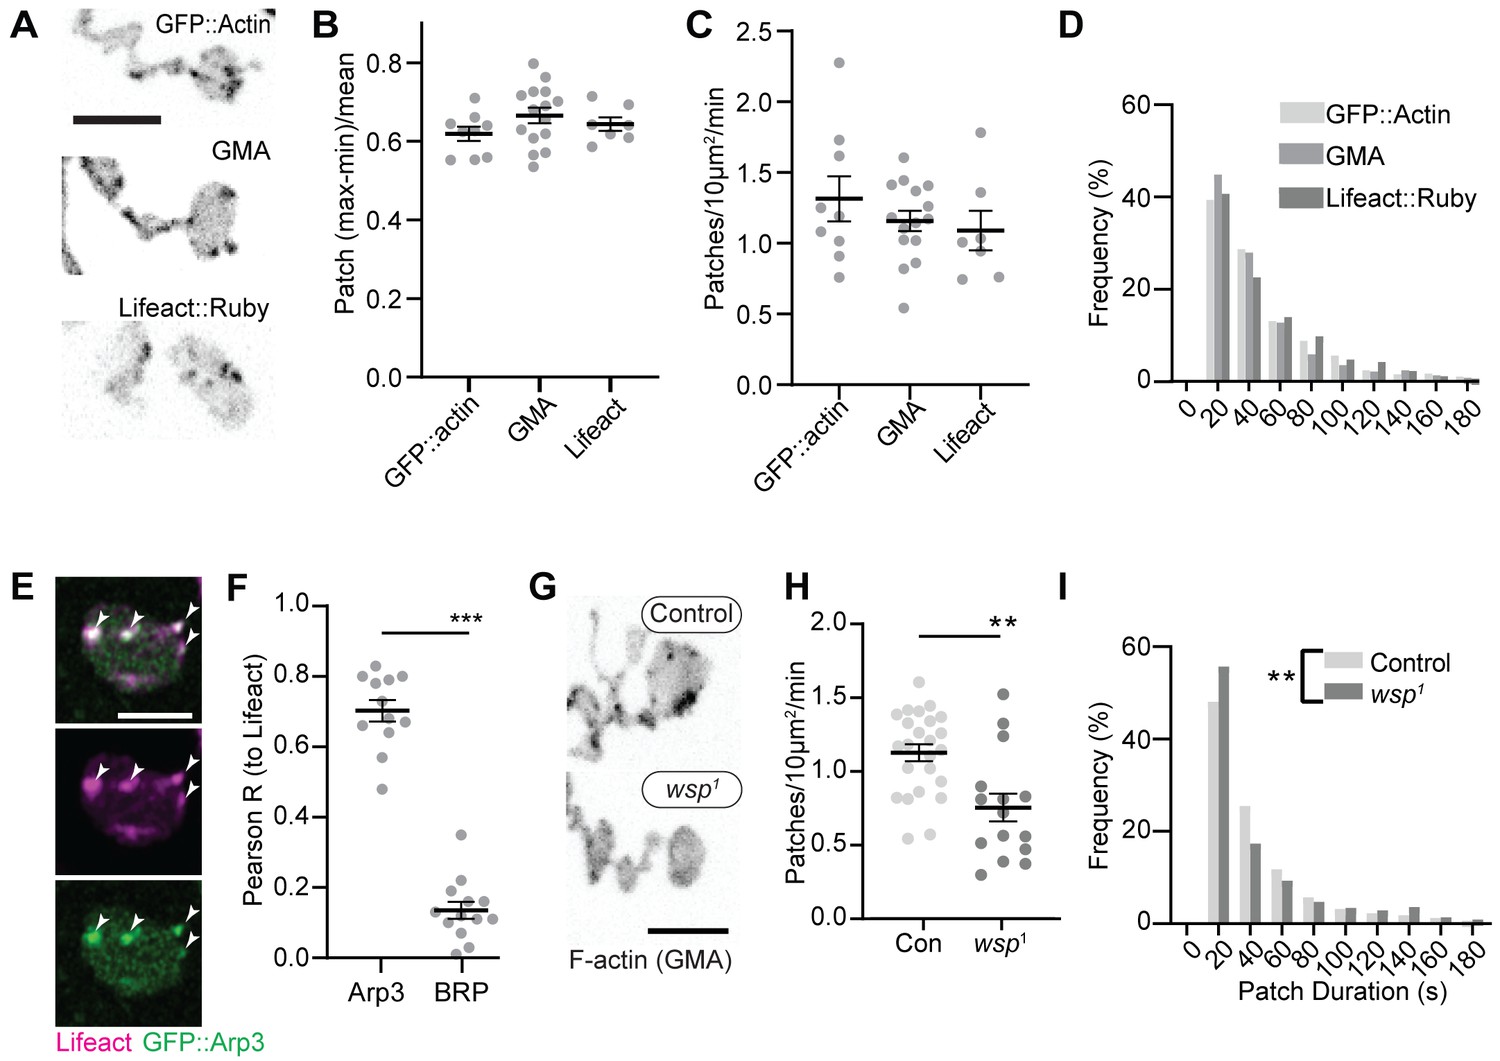
Synaptic actin patches are dynamic WASp-dependent structures.
(A) Representative maximum intensity projections (MaxIPs) of single spinning disc confocal microscopy time points, showing C155-Gal4-driven actin probes GFP::actin, GMA, and Lifeact::Ruby. (B–D) Automatic detection and analysis of movies acquired at 0.25 Hz of F-actin patch intensity amplitude (B), frequency (C), and duration distribution (D) show similar dynamics for different reporters. (E, F) Single plane Airyscan image of a live muscle 6/7 neuromuscular junction (NMJ) expressing Lifeact::Ruby (magenta) and Arp3::GFP (green). Actin patches colocalize extensively with Arp3::GFP. (F) Quantification of colocalization by Pearson’s coefficient. Arp3 colocalizes with Lifeact significantly more than BRP::GFP, a similarly punctate and membrane-associated negative control. Graph shows mean ± sem; n represents NMJs. (G–I) Patch assembly requires the Arp2/3 activator WASp. GMA patch dynamics in control and WASp mutant animals imaged at 0.25 Hz. (G) MaxIPs of single spinning disc confocal microscopy time points, showing pan-neuronally expressed GMA localization in control and wsp1 mutant muscle 6/7 NMJs. (H) Quantification of patch frequency. Graph shows mean ± sem; n represents NMJs. (I) Quantification of patch-duration distribution. Bins are 20 s; X-axis values represent bin centers. n represents patches. Scale bars in (A) and (G) are 5 µm, and scale bar in (E) is 2.5 µm. Associated with Figure 1—figure supplement 1, Figure 1—figure supplement 2, and Video 1.
-
Figure 1—source data 1
Source data for Figure 1 and associated figure supplements.
Source data quantifying raw actin patch dynamics data for control actin markers. Source data quantifying Pearson’s correlation values between Lifeact::Ruby, clc::GFP, BRP::GFP, and Arp3::GFP. Source data quantifying actin patch dynamics data for control and WASp mutant neuromuscular junctions (NMJs). Source data quantifying raw actin patch dynamics data for control and WASp mutant NMJs. Source data quantifying raw data measuring WASp::Myc levels at control and Wsp RNAi NMJs. Source data quantifying raw patch frequency values in control NMJs and % difference between control and WASp mutant NMJs measured over the indicated parameter space. Samples analyzed are the same video dataset as in Figure 1G–I.
- https://cdn.elifesciences.org/articles/69597/elife-69597-fig1-data1-v1.zip
Figure 1—figure supplement 1
Additional characterization of actin patches.
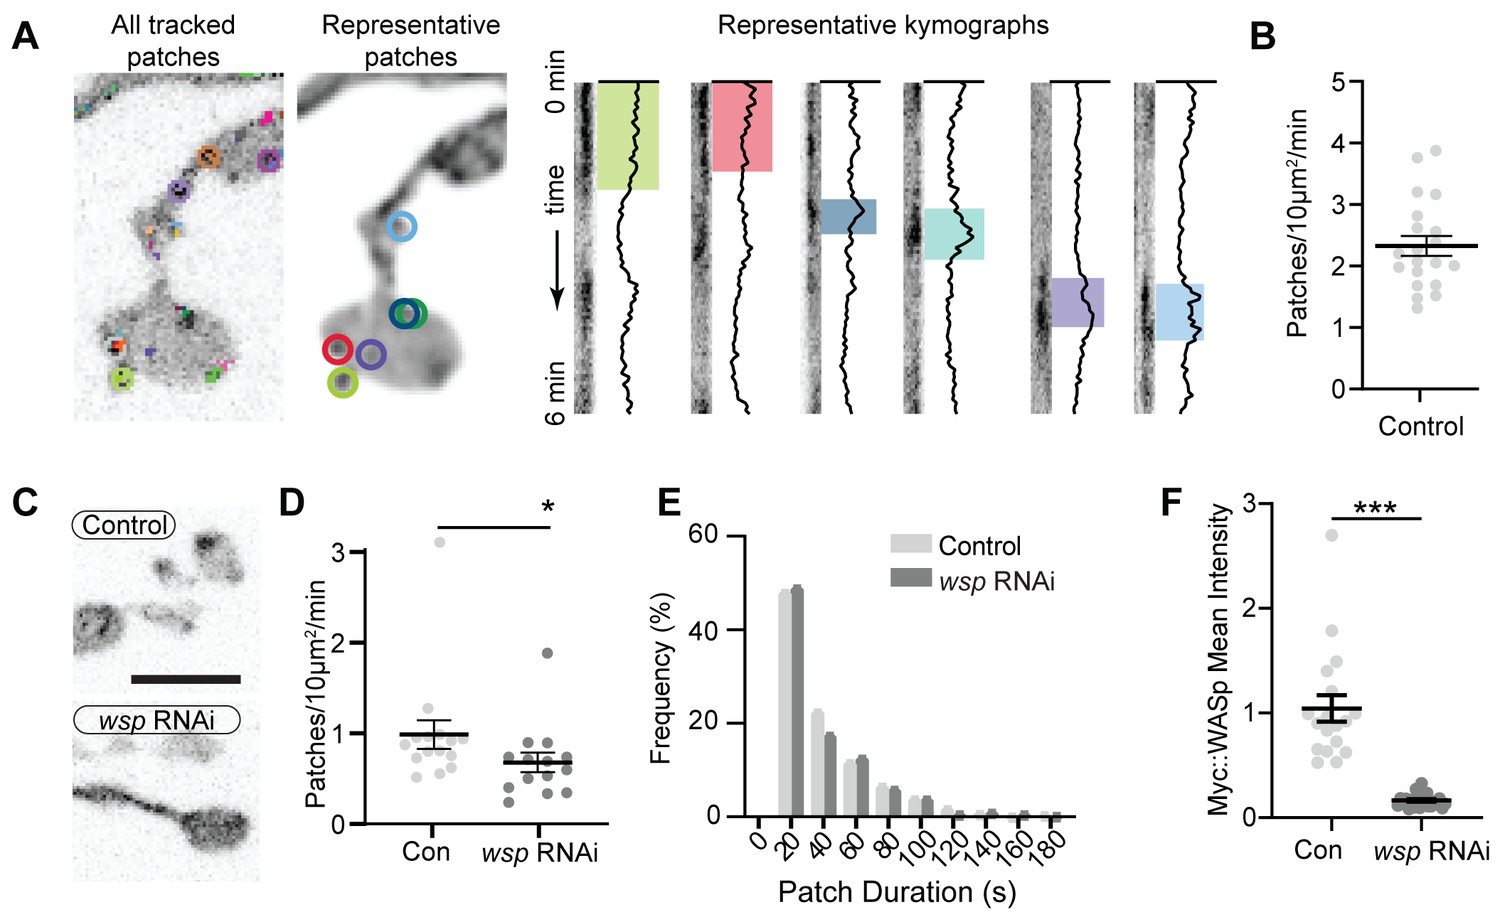
(A) Images from Video 1 highlighting patch structures and dynamics. All patch and track regions of interest are color coded identically in all panels. Left - last frame of the GMA video from Video 1 showing all patch tracks (colored lines) and current patch detections (colored circles). Center - sum intensity projection of the video with locations of representative patches circled. Right - representative kymographs and intensity traces of patches. Kymograph represents entire timelapse from time 0 (top) to 6 min (bottom), with patch dynamics highlighted by color. As discussed in the text, not all patches are tracked due to overlapping signals or missing frames. (B) Quantification of patch frequency in neuromuscular junctions (NMJs) expressing GMA and imaged at 1 Hz. Data are from the same experiment as controls in Figure 6A–C. (C) Representative maximum intensity projections (MaxIPs) of single spinning disc confocal microscopy time points of neuronally expressed GMA in control and WASp RNAi (expressed in neurons via C155-GAL4) NMJs. (D, E) Quantitative analysis of patch frequency and patch-duration distribution (imaged at 0.25 Hz) shows that presynaptic WASp RNAi recapitulates the decreased patch frequency observed at WASp mutant NMJs. Histogram bins are 20 s; X-axis values represent bin centers. (F) Validation of wsp RNAi knockdown by quantification of presynaptic myc::WASp accumulation. Scale bars in (A) and (C) are 5 µm. Graphs show mean ± sem; n represents NMJs. Associated with Figure 1, Video 1.
Figure 1—figure supplement 2
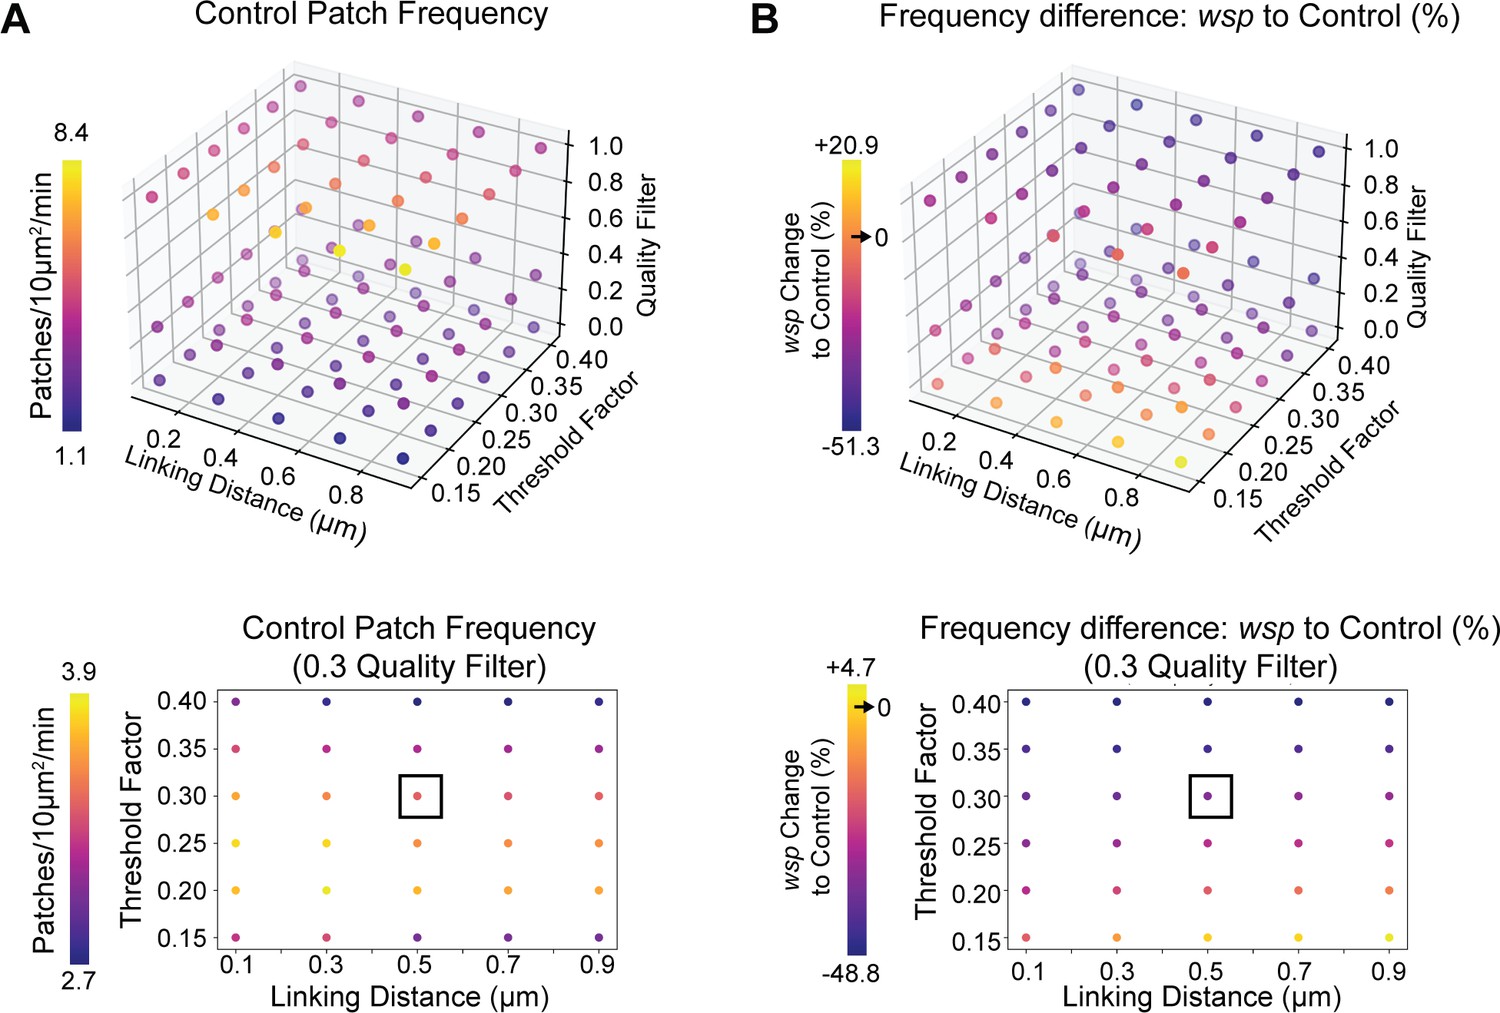
Actin dynamics analysis is robust to tracking parameters.
(A) Quantification of patch frequency in the control genotype of Figure 1G–I across a range of patch detection and tracking parameters. Link distance and patch detection threshold have a small effect on patch frequency. Lower graph highlights the effect of linking distance vs detection threshold specifically at 0.3 quality filter (as used in all analyses). (B) Quantification of the percent difference in patch frequency between WASp mutant neuromuscular junctions (NMJs) and controls, from the same experiment shown in Figure 1G–I. Across the majority of the parameter space, WASp mutants show a decrease in patch frequency, as reported. Results diverge only at extreme tracking and detection parameters. Lower graph highlights the effect of linking distance vs detection threshold at 0.3 quality filter. Associated with Figure 1.
Figure 2

Periactive zone proteins accumulate broadly across the NMJ.
(A) The periactive zone (PAZ) proteins Nwk (magenta) and Dap160 (green) accumulate in a micron-scale mesh adjacent to active zones (AZ) (Bruchpilot, blue). Image shows maximum intensity projection (MaxIP) of a structured illumination microscopy (SIM) Z-stack. (B) Surface projection (top) and medial optical section (bottom) SIM images of live-imaged endogenous Nwk::GFP showing abundant and specific membrane recruitment, similar to fixed imaging. (C–F) PAZ proteins partially colocalize with actin patches. Optical slices of SIM micrographs showing F-actin (labeled with GMA) localization with presynaptically expressed WASp::Myc and Nwk (C) or Dap160 (E). (D, F) Quantification of colocalization between GMA and WASp::Myc, and Nwk (D) or Dap160 (F). (D, F) Quantification (Pearson correlation coefficient R) of colocalization between the indicated pairs of proteins. Graphs show mean ± sem; n represents neuromuscular junctions (NMJs).
-
Figure 2—source data 1
Source data for Figure 2.
Source data quantifying Pearson R values between Nwk, WASp, and GMA. Source data quantifying Pearson R values between Dap160, WASp, and GMA.
- https://cdn.elifesciences.org/articles/69597/elife-69597-fig2-data1-v1.zip
Figure 3 with 2 supplements
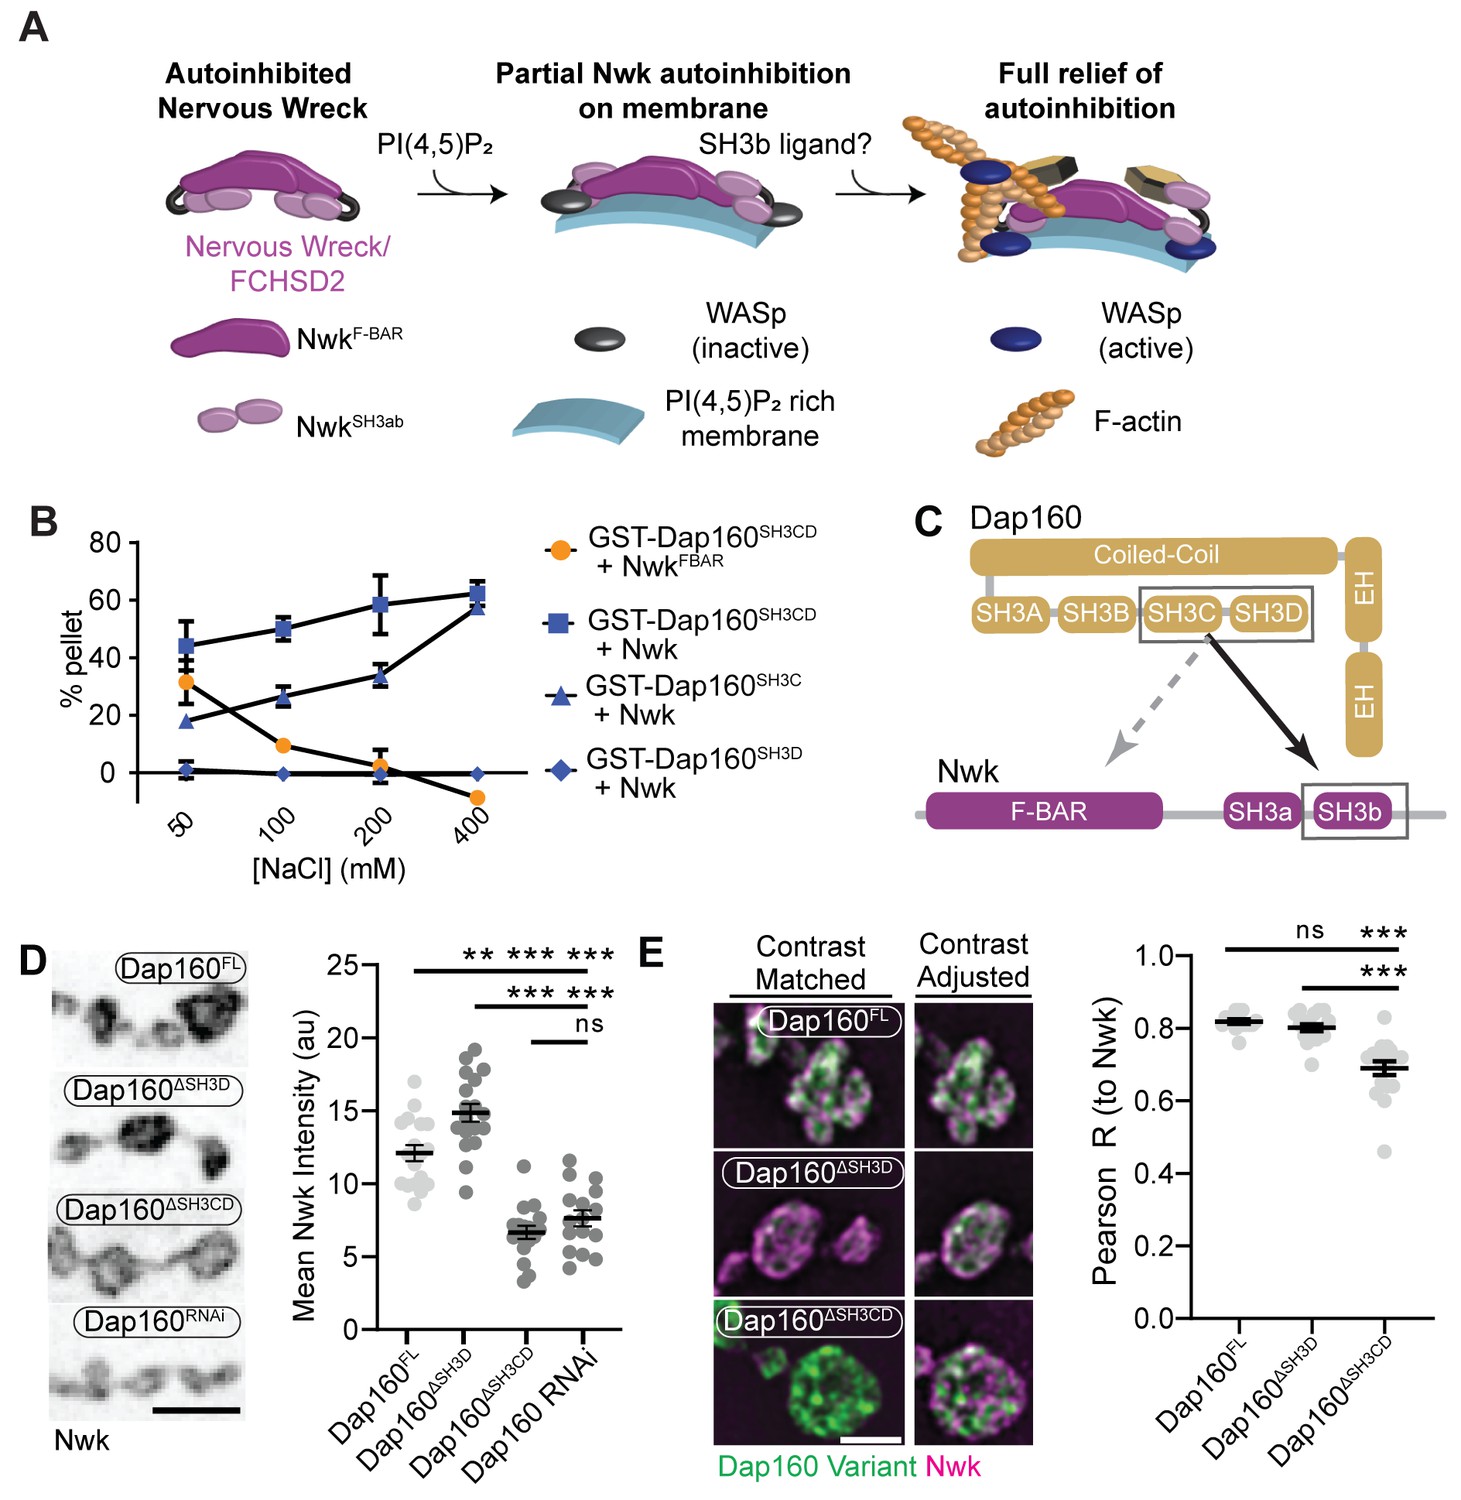
Distinct SH3-SH3 and SH3-BAR domain interactions drive Dap160-Nwk association in vitro and at synapses.
(A) Model for autoinhibition of Nwk membrane binding and WASp activation. Neither membrane-bound nor membrane-free Nwk efficiently activates WASp-mediated actin polymerization, due to persistent SH3b-mediated autoinhibitory interactions, suggesting that an SH3b domain ligand is required for activation. (B) Dap160SH3CD exhibits electrostatic and hydrophobic interactions with the Nwk F-BAR and SH3 domains, respectively. Glutathione-S-transferase (GST) fusion proteins were immobilized on glutathione agarose and incubated with the indicated purified proteins. Pellets and supernatants were fractionated by sodium dodecyl sulphate–polyacrylamide gel electrophoresis (SDS-PAGE), Coomassie stained, and quantified by densitometry. Graphs show the average ± sem of three independent reactions. [NwkF-BAR] = 1.5 μM, [Nwk] = 0.8 μM, [GST-Dap160SH3CD] = 1.6 μM, [GST-Dap160SH3C/D] = 1.2 μM. (C) Summary of Dap160SH3CD-NwkSH3ab interactions. Gray and black arrows indicate electrostatic and hydrophobic interactions, respectively. (D, E) Maximum intensity projection (MaxIP) spinning disc confocal (D) or single Z-plane structured illumination microscopy (SIM) micrographs (E) of muscle 4 neuromuscular junctions (NMJs) expressing C155-GAL4-driven UAS-Dap160 rescue transgene variants in a dap160 null background (dap160Δ1/Df). Loss of the Dap160SH3CD domains (Dap160ΔSH3CD), but not the SH3D domain alone (Dap160ΔSH3D), decreases the abundance of Nwk (D, right) and Dap160-Nwk colocalization (E, right) at synapses. Contrast-matched panels in (E) are displayed with the same brightness/contrast. Adjacent panels are contrast-adjusted per image to facilitate comparison of Nwk-Dap160 colocalization. Graphs show mean ± sem; n represents NMJs. Scale bars in (D) and (E) are 5 μm and 2.5 μm, respectively. Associated with Figure 3—figure supplements 1–2.
-
Figure 3—source data 1
Source data for Figure 3 and associated figure supplements.
Whole Coomassie gels measuring the interaction between GST-Dap160 fragments and Nwk proteins, as indicated in each file name. Collected and annotated gels for Figure 3B with lanes and constructs labeled. Quantification of blots for Figure 3B. Quantification of Nwk intensity in Dap160 rescue larvae, also containing raw data for Figure 3—figure supplement 2B (Dap160 transgene abundance). Source data quantifying Nwk-Dap160 transgene colocalization and intensity in Dap160 rescue larvae; also containing raw data for Figure 3—figure supplement 2C (Dap160 transgene abundance). Collected and annotated gels measuring Dap160 fragment pulldowns of Nwk SH3b for Figure 3—figure supplement 1A with lanes and constructs labeled. Raw gels for Figure 3—figure supplement 1A. Raw data quantifying Figure 3—figure supplement 1A. Collected and annotated gels measuring Dap160 fragment pulldowns of Nwk FBAR in Figure 3—figure supplement 1B with lanes and constructs labeled. Raw gels for Figure 3—figure supplement 1B. Data quantifying Dap160 fragment pulldowns of Nwk FBAR. Raw data quantifying Dap160 abundance in control and dap160 rnai-expressing NMJs.
- https://cdn.elifesciences.org/articles/69597/elife-69597-fig3-data1-v1.zip
Figure 3—figure supplement 1
Domain specific interactions between Dap160 and Nwk.
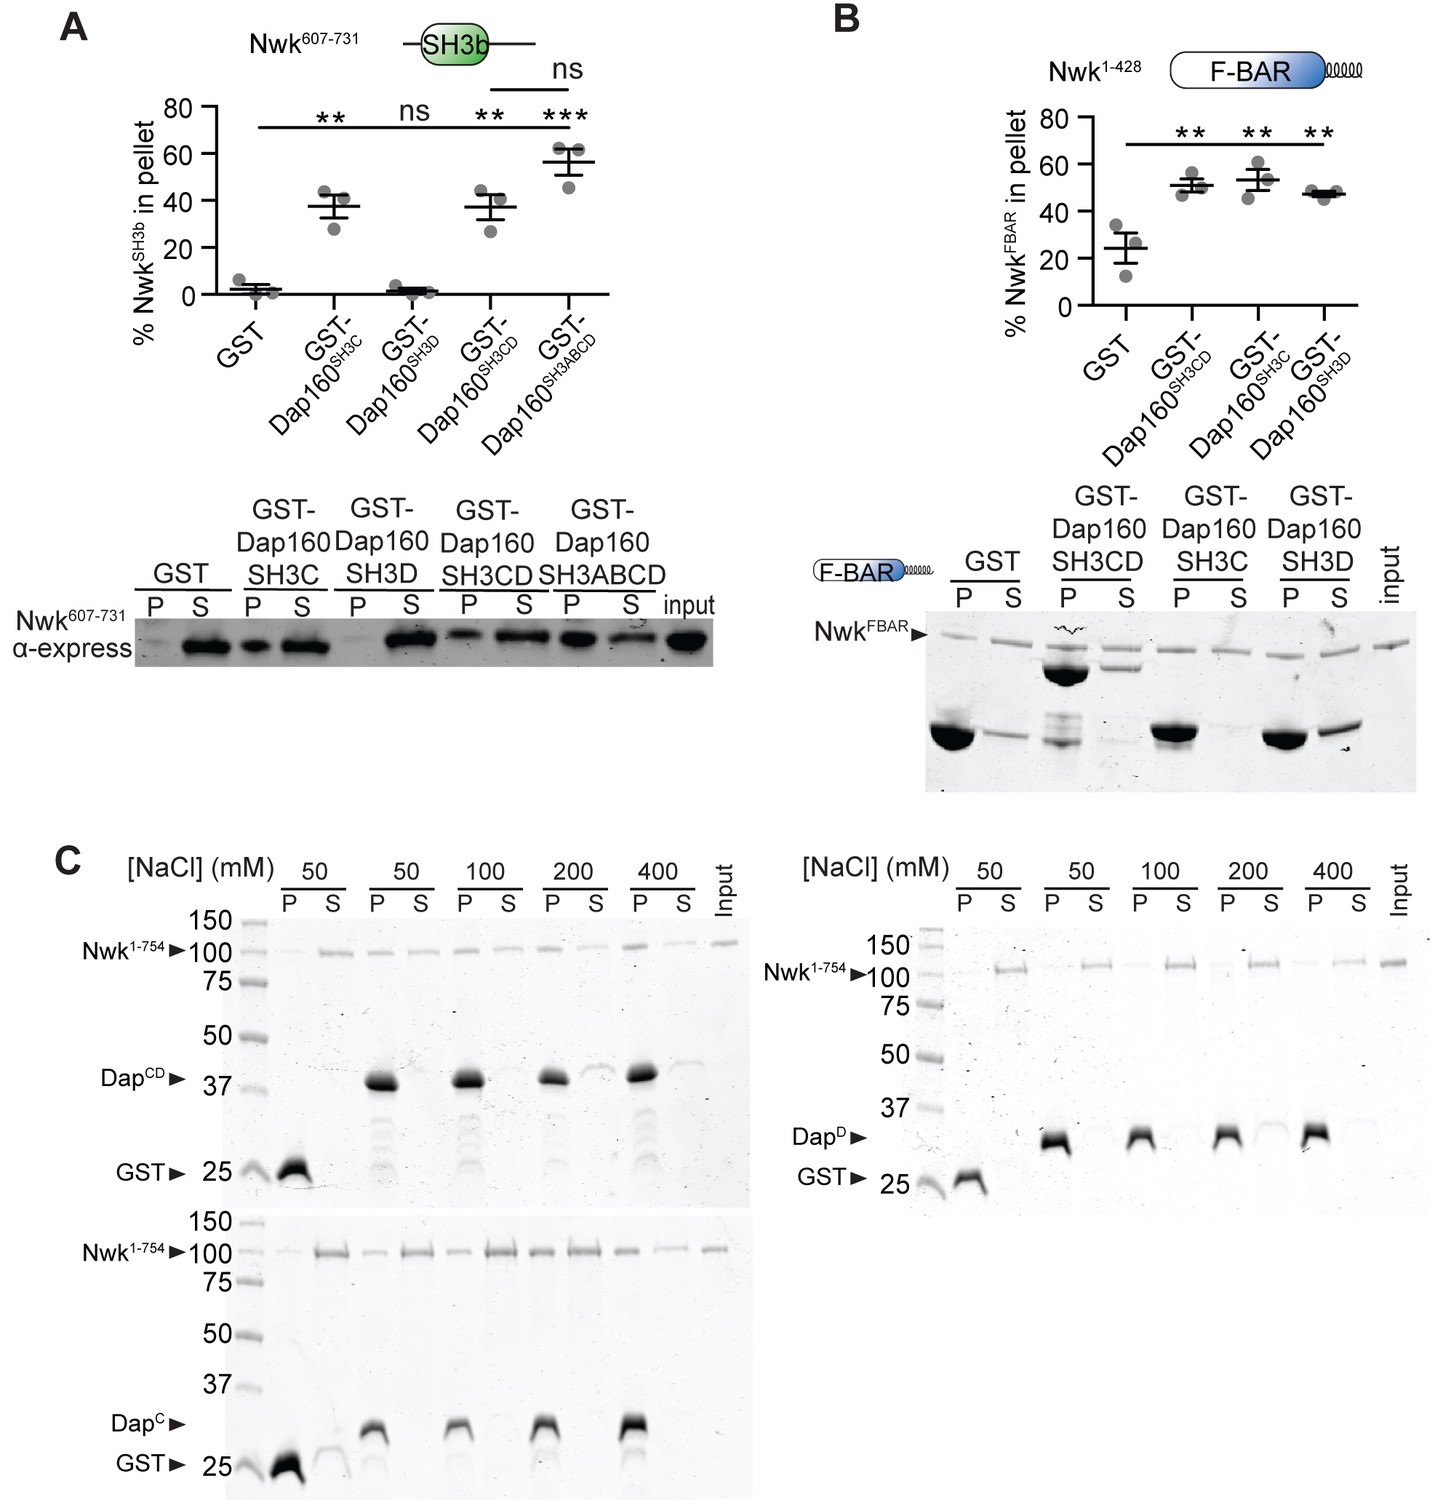
(A, B) Glutathione-S-transferase (GST) fusion proteins were immobilized on glutathione agarose and incubated with the indicated purified proteins. Pellets and supernatants were fractionated by sodium dodecyl sulphate–polyacrylamide gel electrophoresis (SDS-PAGE), immunoblotted (A) or Coomassie stained (B), and quantified by densitometry. (A) NwkSH3b interacts directly with Dap160SH3C, Dap160SH3CD, or Dap160SH3ABCD, but not with Dap160SH3D alone. [NwkSH3b] = 7 μM. (B) The Nwk F-BAR domain interacts directly with Dap160SH3, Dap160SH3D, and Dap160SH3CD. [NwkF-BAR] = 1.5 μM, [GST-Dap160SH3CD] = 8.5 μM, [GST-Dap160SH3C/D] = 11 μM. (C) Representative Coomassie-stained gels for Figure 3B. Associated with Figure 3.
Figure 3—figure supplement 2
Validation of Dap160 transgene rescue and knockdown experiments.
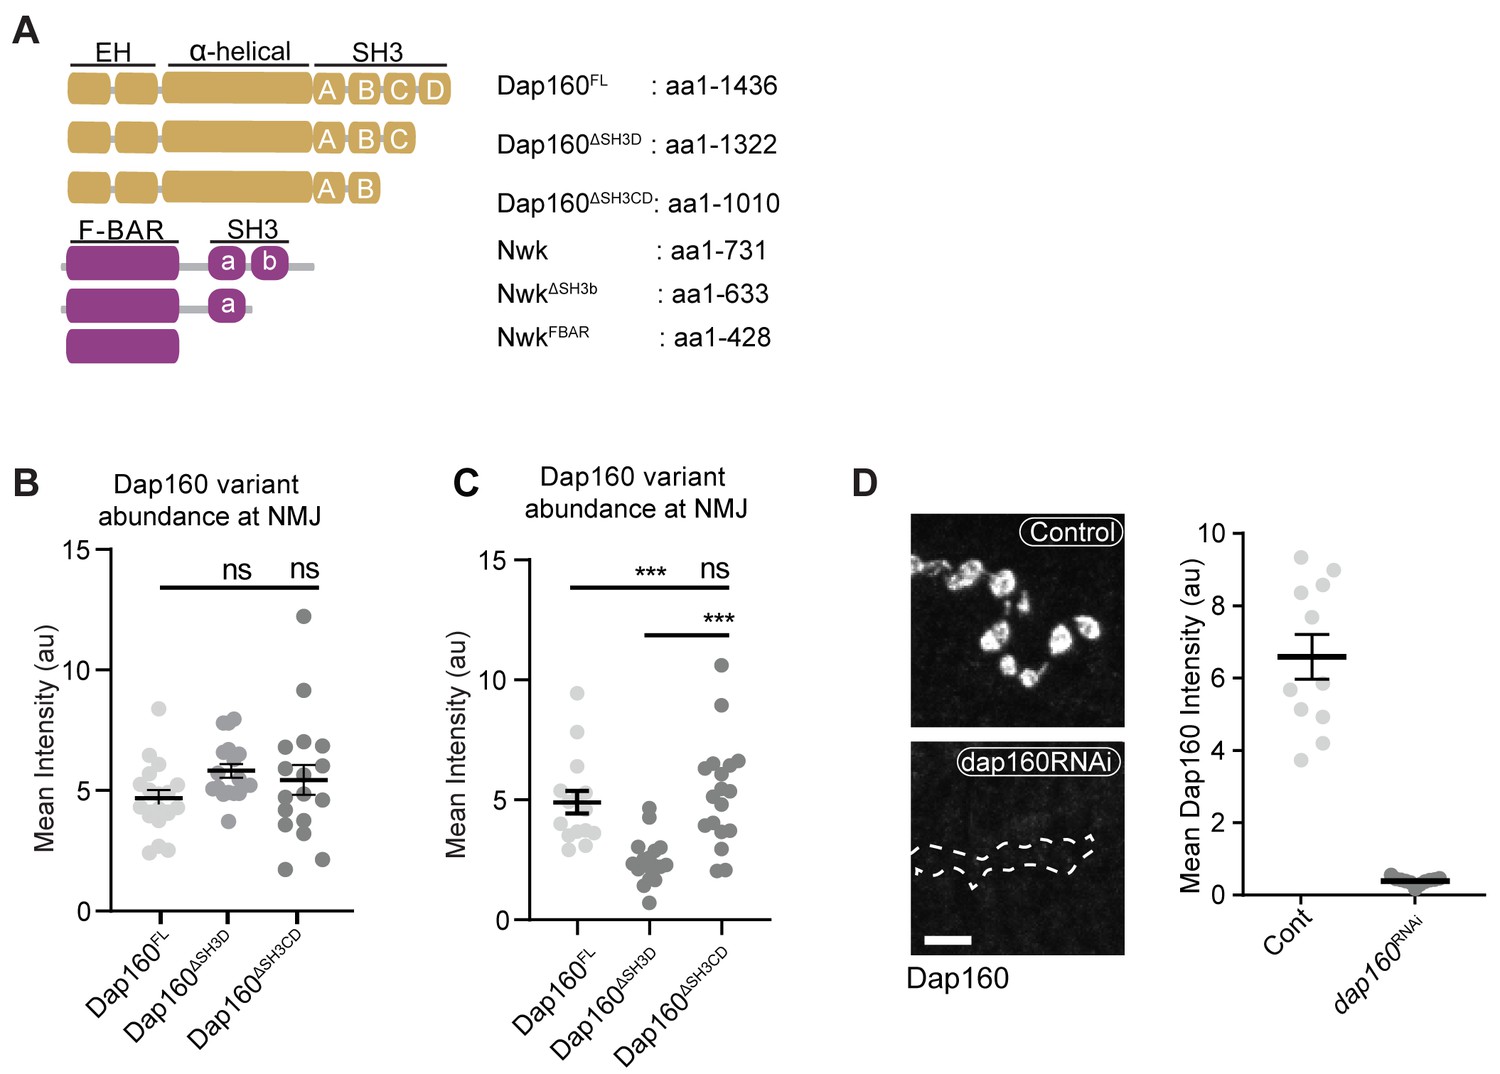
(A) Schematic of Dap160 rescue transgenes used in in vivo and Nwk fragments used in in vitro experiments. (B, C) Quantification of Dap160 variant transgene expression (mCherry signal) at neuromuscular junctions (NMJs) from datasets in Figure 3D and Figure 3E, respectively. All transgenes were expressed in neurons by C155-GAL4 in a dap160 null background (dap160Δ1/Df). (D) Maximum intensity projections (MaxIPs) (left) and quantification (right) of spinning disc confocal micrographs of control and dap160 RNAi-expressing NMJs showing knockdown of Dap160 protein levels, using the same conditions as in Figure 3D. Associated with Figure 3.
Figure 4
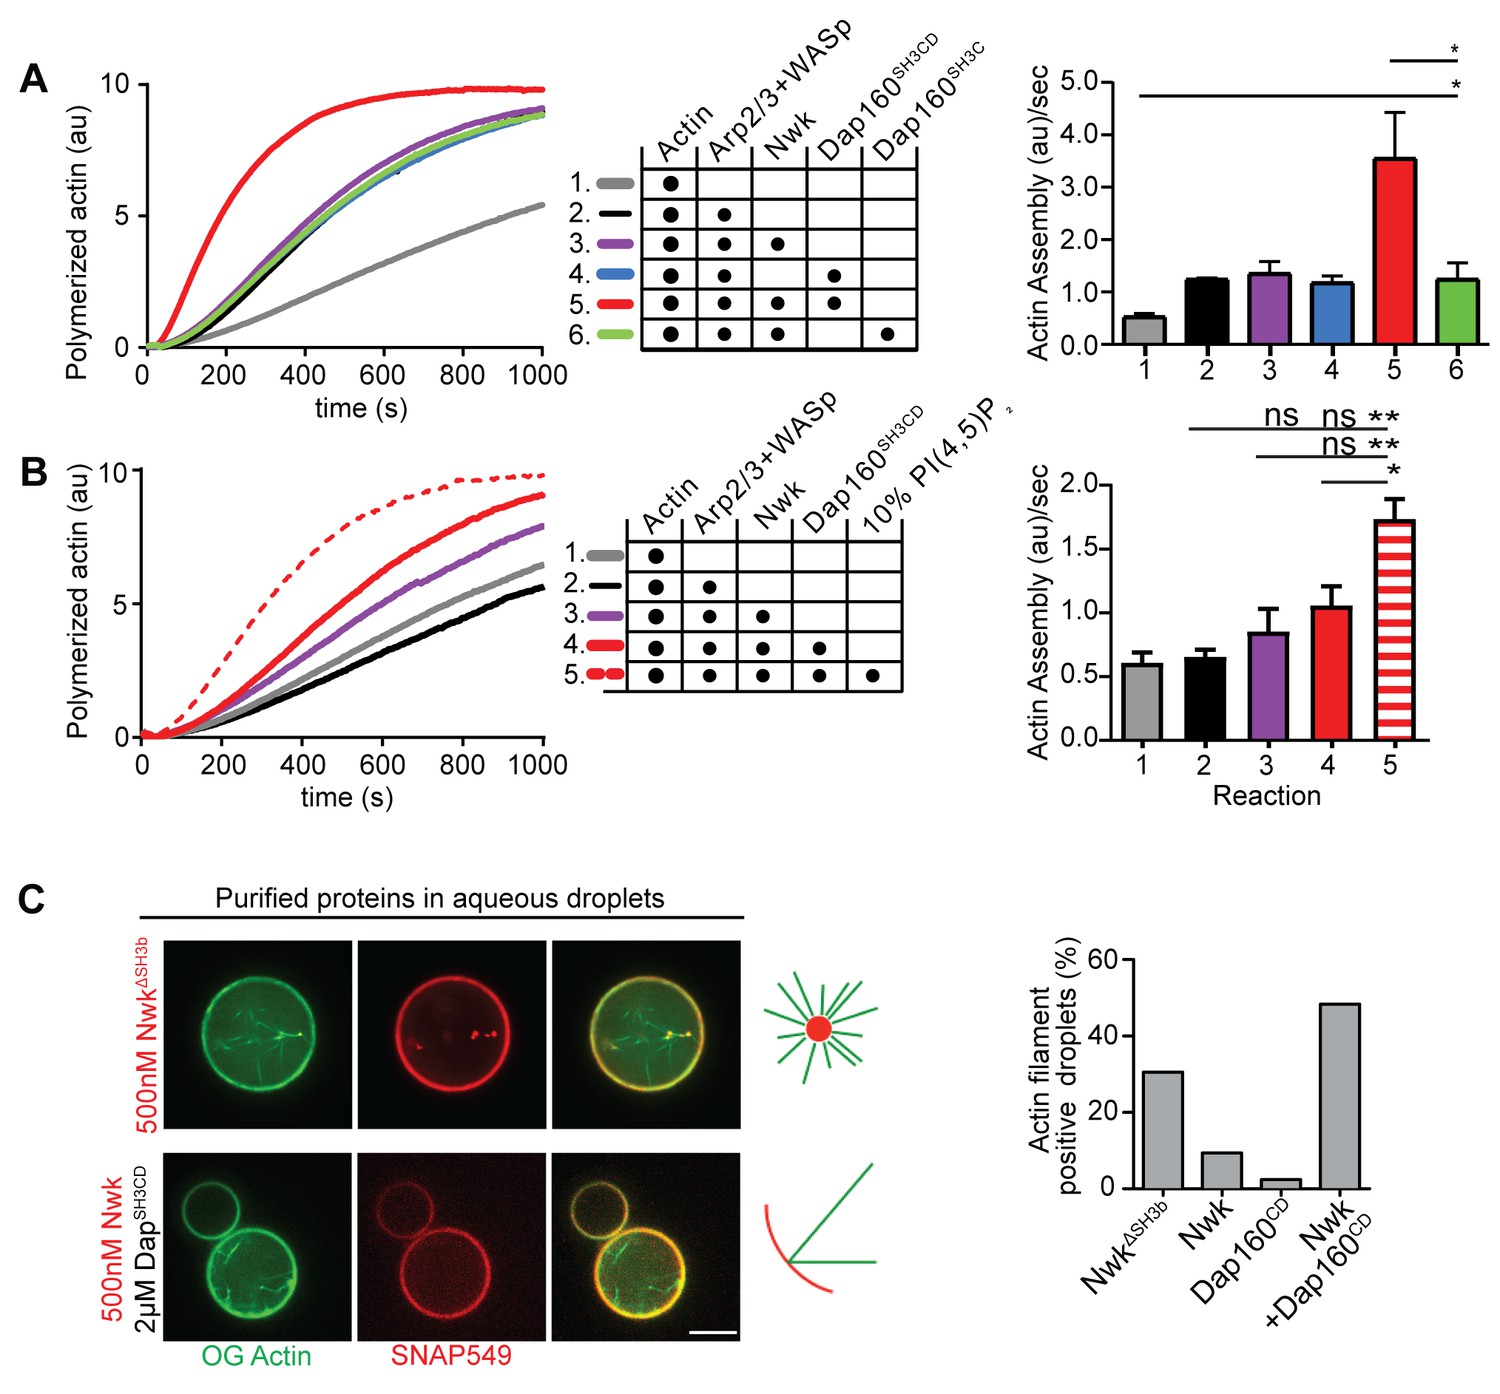
Nwk, Dap160, and PI(4,5)P2 potentiate WASp-mediated actin assembly at membranes.
(A, B) Pyrene-actin assembly assay (2.5 µM actin, 5% pyrene-labeled). Curves are representative single experiments demonstrating actin assembly kinetics; graphs represent rates calculated from the linear range of assembly from at least two independent experiments. (A) The combination (red trace) of Nwk and Dap160SH3CD enhances WASp-Arp2/3-mediated actin assembly. Either alone (magenta and blue traces) has no effect on WASp activity. [Nwk] = 500 nM, [Dap160] = 2 µM, [WASp] = 50 nM, [Arp2/3] = 50 nM. (B) PI(4,5)P2 enhances Nwk-Dap160 activation of WASp-mediated actin assembly. Nwk alone or in combination with 10% PI(4,5)P2 liposomes fails to activate WASp, while the addition of Dap160SH3CD and PI(4,5)P2 synergistically enhances WASp-mediated actin assembly. [Nwk] = 100 nM, [Dap160] = 500 nM, [WASp] = 50 nM, [Arp2/3] = 50 nM. (C) Single slices from spinning disc confocal micrographs of water-droplet actin assembly assay: SNAP-labeled Nwk constructs (red) and Oregon Green actin (green) were mixed with the indicated proteins in an aqueous solution and emulsified in 97.5% 1,2-diphytanoyl-sn-glycero-3-phosphocholine (DPHPC), 2.5% PI(4,5)P2 in decane. Both deregulated NwkΔSH3b and Nwk + Dap160SH3CD promote F-actin assembly in droplets. However, while Nwk - Dap160SH3CD derived F-actin associates with the lipid interface, de-regulated NwkΔSH3b promotes actin assembly from asters that do not associate with membranes. [Nwk1-xxx] = 500 nM, [Dap160] = 2 µM, [WASp] = 50 nM, [Arp2/3] = 50 nM. Graph indicates percentage of droplets with observable actin filament assembly. Scale bar in (C) is 10 µm.
-
Figure 4—source data 1
Source data for Figure 4.
Raw data quantifying pyrene-actin assembly kinetics with Nwk, Dap160, and WASp. Raw data quantifying pyrene-actin assembly kinetics with Nwk, Dap160, WASp, and liposomes.
- https://cdn.elifesciences.org/articles/69597/elife-69597-fig4-data1-v1.zip
Figure 5 with 1 supplement
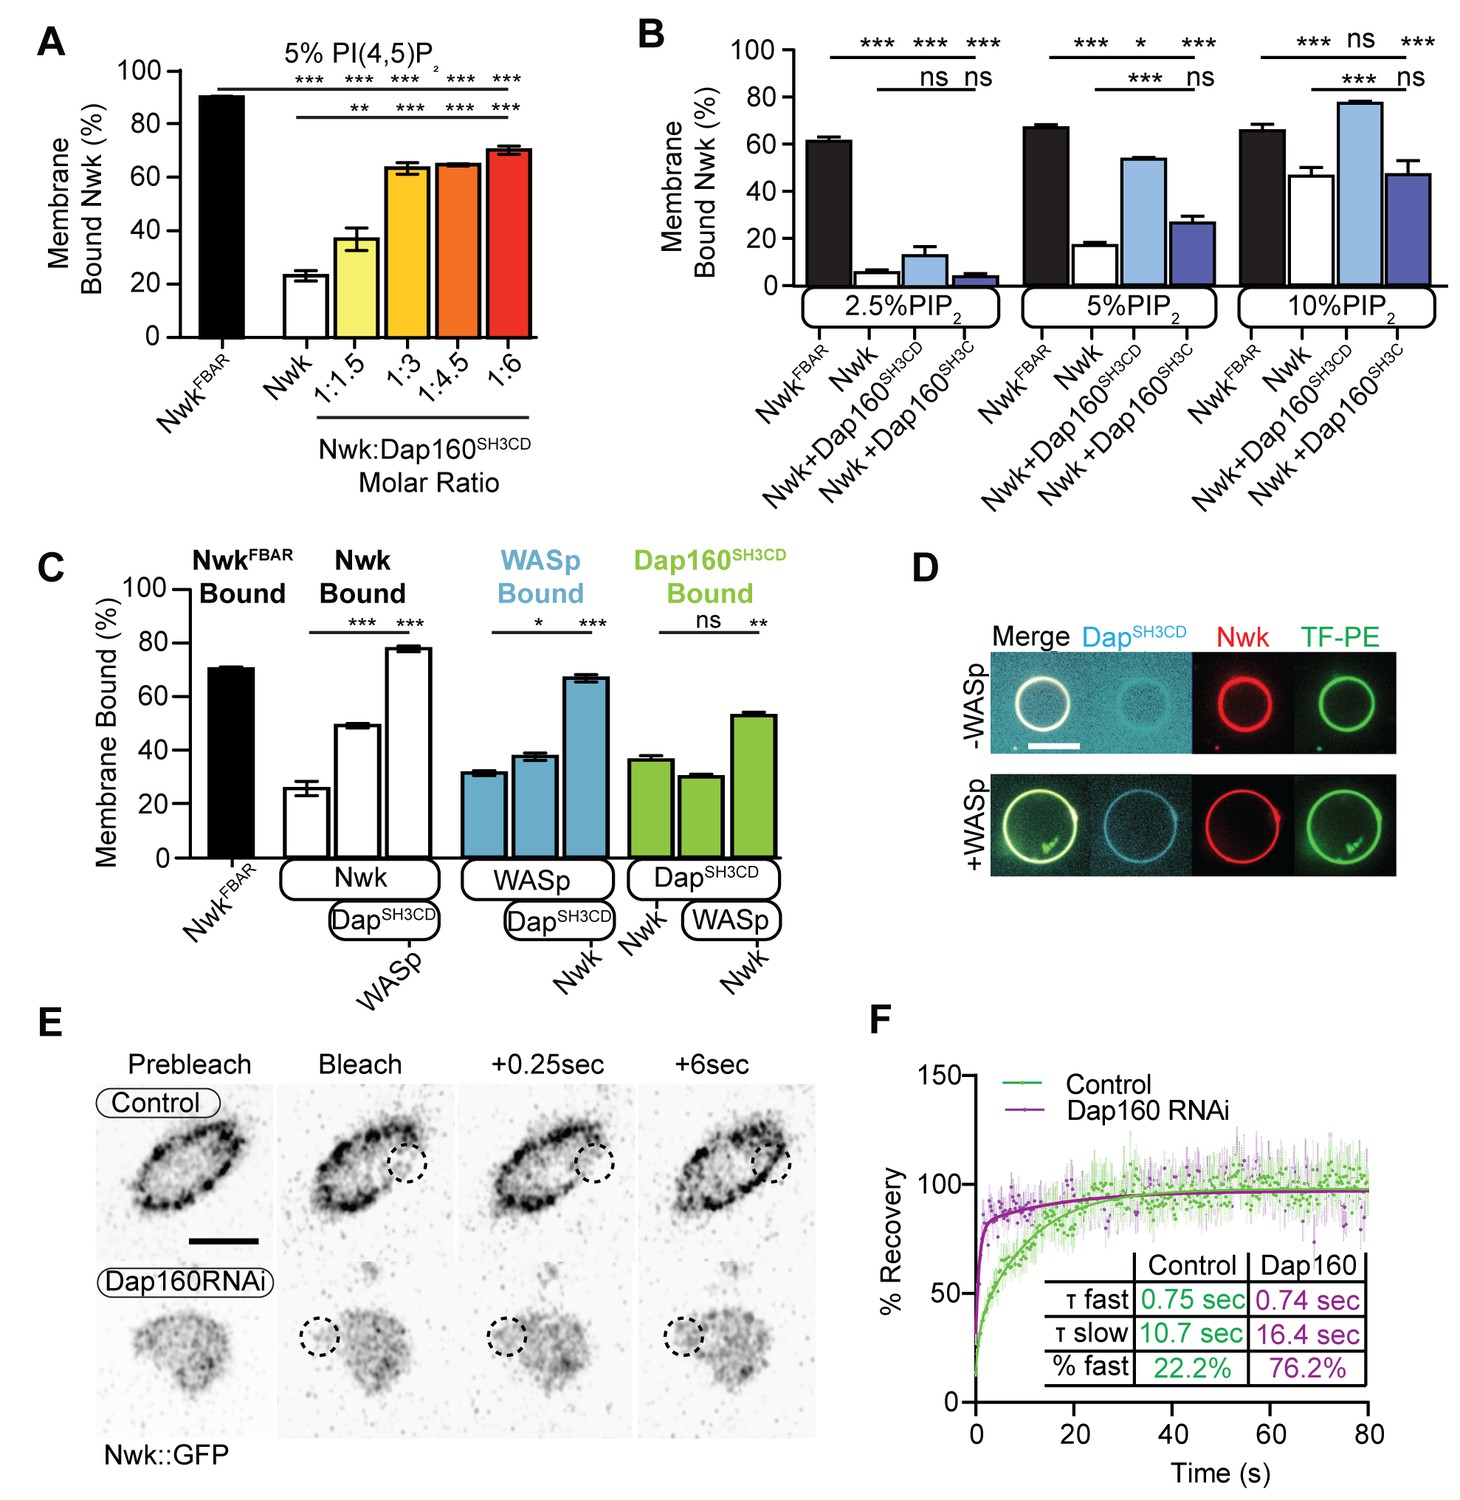
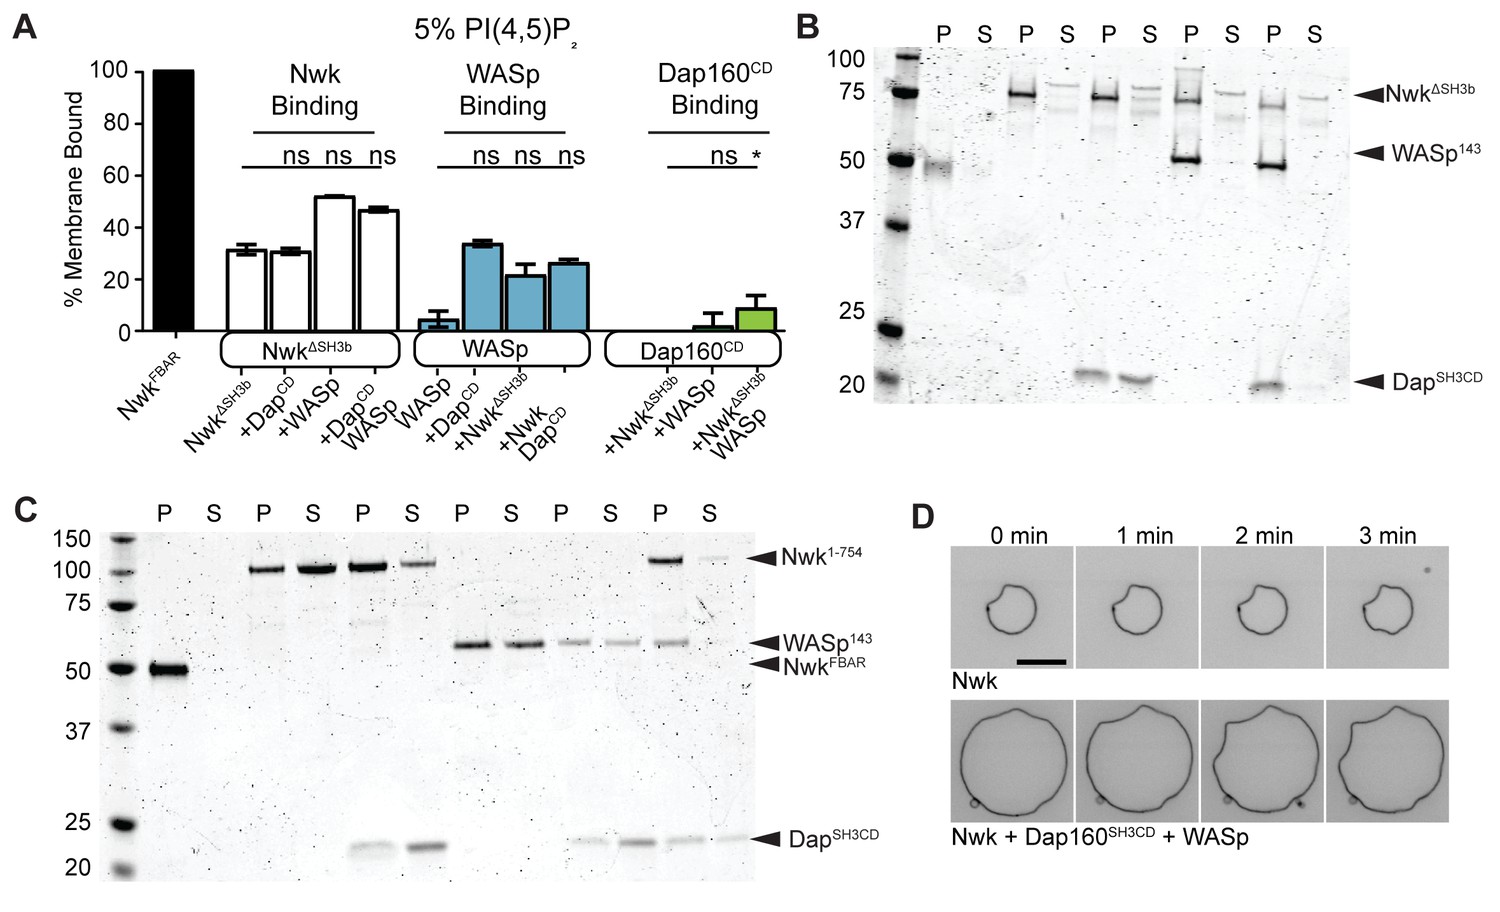
Dap160SH3CD and WASp promote Nwk membrane association.
(A–C) Liposome cosedimentation assays between the indicated purified proteins and liposomes composed of [mol% = DOPC/DOPE/DOPS/PI(4,5)P2 = 80-x/15/5/x], with x representing PI(4,5)P2 concentration as noted. Quantification from Coomassie-stained gels represents the mean fraction of total protein that cosedimented with the liposome pellet ± sem. (A) 1:3 Nwk:Dap160SH3CD saturates enhancement of Nwk membrane association at 5% PI(4,5)P2, but not to the level of the isolated Nwk F-BAR alone (NwkF-BAR, black bar). [NwkF-BAR] = 3 µM, [Nwk] = 1.125 µM, [Dap160SH3CD] = 1.7–6.8 µM. (B) Dap160SH3CD (but not Dap160SH3C) enhances Nwk association with membranes at a range of PI(4,5)P2 concentrations. Maximum binding (comparable to NwkF-BAR) occurs only at 5–10% PI(4,5)P2 concentrations. [Nwk1-xxx] = 2 µM, [Dap160] = 6 µM. (C) Nwk, WASp, and Dap160SH3CD mutually enhance membrane recruitment. Addition of Dap160SH3CD and WASp additively enhances Nwk membrane association, while Dap160SH3CD and WASp show maximum recruitment to 10% PI(4,5)P2 liposomes in the presence of both other proteins. [Nwk] = 1 µM, [WASp] = 1 µM, [Dap160SH3CD] = 3 µM. (D) Giant unilamellar vesicle (GUV) decoration assay, with 10% PI(4,5)P2 GUVs labeled with <1% TopFluor-PE. The addition of WASp to Nwk (red) and Dap160SH3CD (blue) enhances the recruitment of Dap160SH3CD to the membrane (green, note diffuse blue signal in (-) WASp condition). [Nwk] = 250 nM, [WASp] = 250 nM, [Dap160SH3CD] = 1 µM. Scale bar is 10 μm. (E, F) Fluorescence recovery after photobleaching (FRAP) assay of endogenously labeled Nwk in control and C155-GAL4/UAS-Dicer-driven Dap160RNAineuromuscular junctions (NMJs). Images show individual medial optical sections of Airyscan confocal images at the indicated time point. Control Nwk signal shows membrane association (see strong peripheral signal) and slower recovery kinetics, while loss of Dap160 eliminates the strong peripheral accumulation of Nwk::GFP and increases the recovery kinetics of Nwk::GFP in the bleached region (dashed circles). Graph shows mean ± sem; n represents NMJs. Scale bar is 5 μm. Associated with Figure 5—figure supplement 1.
-
Figure 5—source data 1
Source data for Figure 5 and associated figure supplements.
Source data quantifying liposome cosedimentation of Nwk with increasing concentrations of Dap160SH3CD. Annotated gels quantifying liposome cosedimentation of Nwk with increasing concentrations of Dap160SH3CD. Raw gels quantifying liposome cosedimentation of Nwk with increasing concentrations of Dap160SH3CD. Annotated gels quantifying liposome cosedimentation of Nwk and Dap160 fragments with increasing concentrations of PI(4,5)P2. Raw gels quantifying liposome cosedimentation of Nwk and Dap160 fragments with increasing concentrations of PI(4,5)P2. Source data quantifying liposome cosedimentation of Nwk and Dap160 fragments with increasing concentrations of PI(4,5)P2. Source data quantifying FRAP recovery and curve fitting of Nwk::GFP in control and dap160 RNAi-expressing neuromuscular junctions (NMJs). Annotated gels quantifying liposome cosedimentation of NwkΔSH3b and Dap160 fragments. Raw gels quantifying liposome cosedimentation of NwkΔSH3b and Dap160 fragments. Source data quantifying liposome cosedimentation of NwkΔSH3b and Dap160 fragments.
- https://cdn.elifesciences.org/articles/69597/elife-69597-fig5-data1-v1.zip
Figure 5—figure supplement 1
Membrane binding and bending by Dap160-WASp-Nwk.
(A) Cosedimentation assay between the indicated purified proteins and liposomes composed of [mol% = DOPC/DOPE/DOPS/PI(4,5)P2 = 75/15/5/5]. Dap160SH3CD is unable to enhance membrane binding of NwkΔSH3b (which lacks the autoinhibitory and Dap160-binding SH3b domain) or WASp. Conversely, NwkΔSH3b is unable to promote membrane recruitment of Dap160SH3CD. Quantification from Coomassie-stained gels represents the mean fraction of total protein that cosedimented with the liposome pellet ± sem. [NwkΔSH3b] = 1 µM, [WASp] = 1 µM, [Dap160] = 3 µM. Graph shows mean ± sem. (B) Representative Coomassie-stained gel from (A). (C) Representative Coomassie-stained gel from Figure 5C. (D) Confocal timelapse of deformation of GUVs (10% PI(4,5)P2, labeled with <1% TopFluor-PE) decorated with the indicated proteins [Nwk1-xxx] = 250 nM, [WASp] = 250 nM, [Dap160] = 1.25 µM. The Nwk-Dap160-WASp complex retains the same membrane-remodeling activity as Nwk alone. Associated with Figure 5.
Figure 6 with 2 supplements
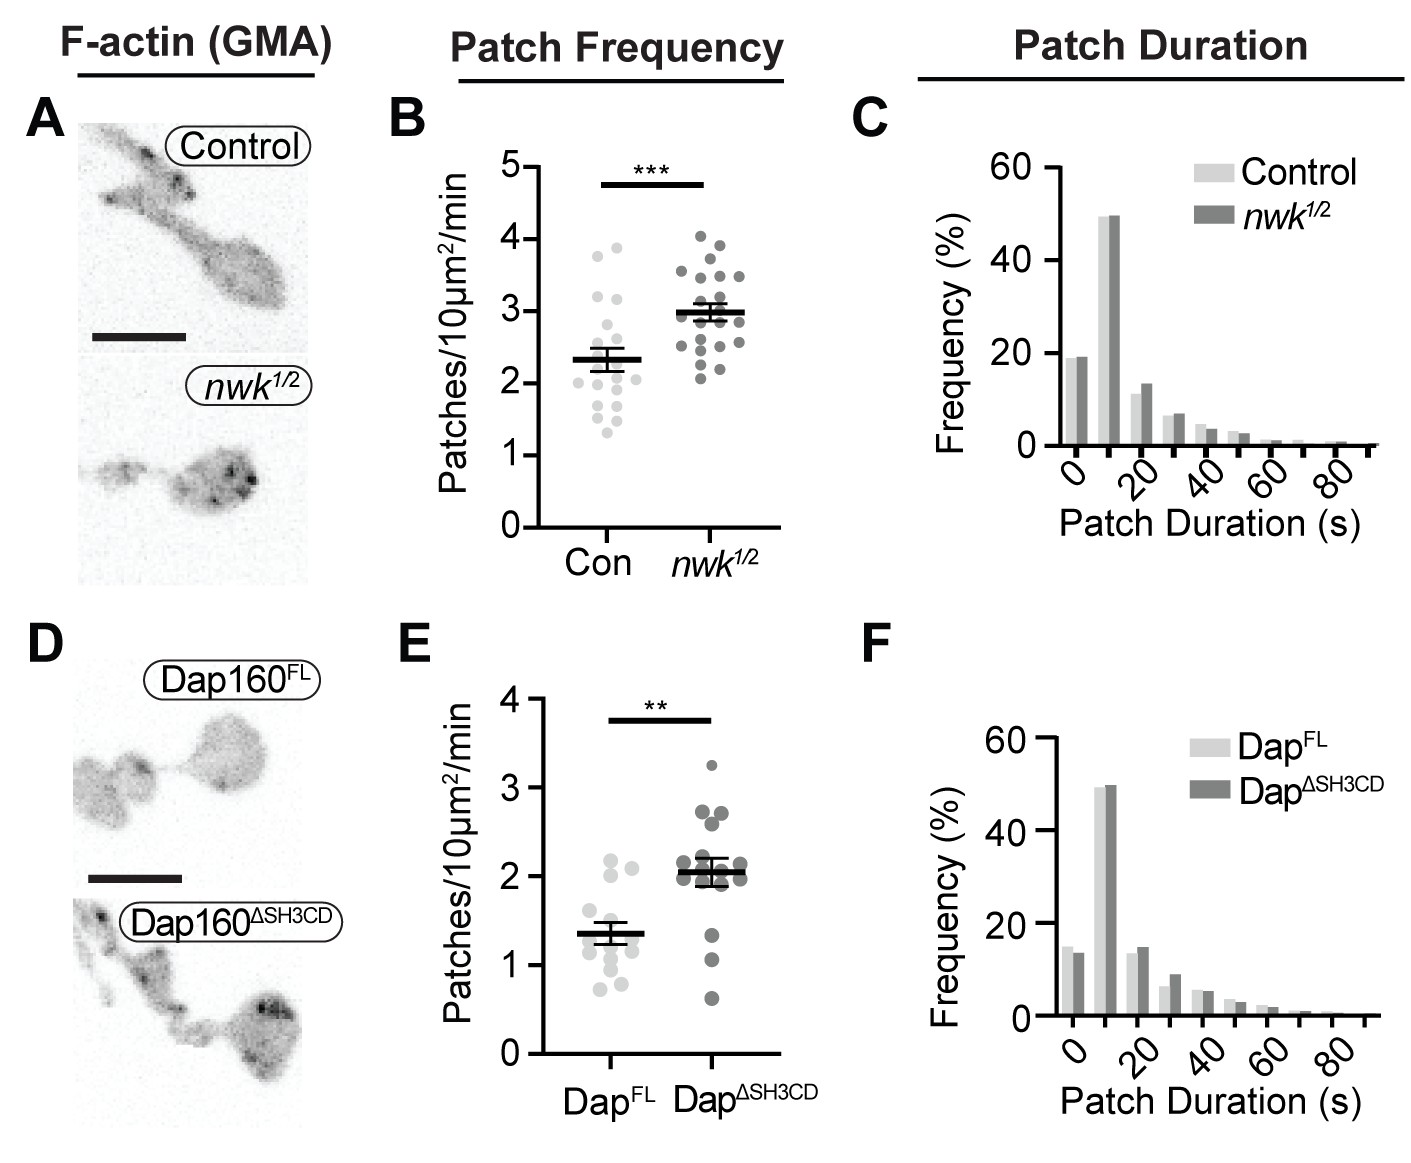
Loss of the Dap160-Nwk interaction disrupts actin patch dynamics at synapses in vivo.
(A, D) Maximum intensity projections (MaxIPs) of live spinning disc confocal micrographs of presynaptically expressed GMA in muscle 6/7 neuromuscular junctions (NMJs) of the indicated genotypes, imaged at 1 Hz. Graphs quantify patch frequency (B, E) and distribution of patch durations (C, F). Loss of nwk (A–C) or of the Nwk-interacting Dap160SH3CD domain (D–F) increases the frequency of actin patch assembly. In both cases, there is no change in the distribution of patch durations (C, F). Scale bars in (A, D) are 5 μm. Associated with Figure 6—figure supplements 1–2, Video 2.
-
Figure 6—source data 1
Source data for Figure 6 and associated figure supplements.
Source data quantifying actin patch dynamics in control and nwk mutant neuromuscular junctions (NMJs). Source data quantifying actin patch dynamics in control and Dap160 transgene rescue NMJs. Source data showing raw patch frequency values in control NMJs and % difference between control and nwk mutant NMJs measured over the indicated parameter space. Samples are the same video dataset as in Figure 6A–C. Data showing the coefficient of variation over time of GMA signal intensity in control and nwk mutant NMJs. Samples are the same video dataset as in Figure 6A–C. Data showing the area fraction of highly variant (Std Dev over time) pixels in control and nwk mutant NMJs, thresholded by two methods. Samples are the same video dataset as in Figure 6A–C.
- https://cdn.elifesciences.org/articles/69597/elife-69597-fig6-data1-v1.zip
Figure 6—figure supplement 1
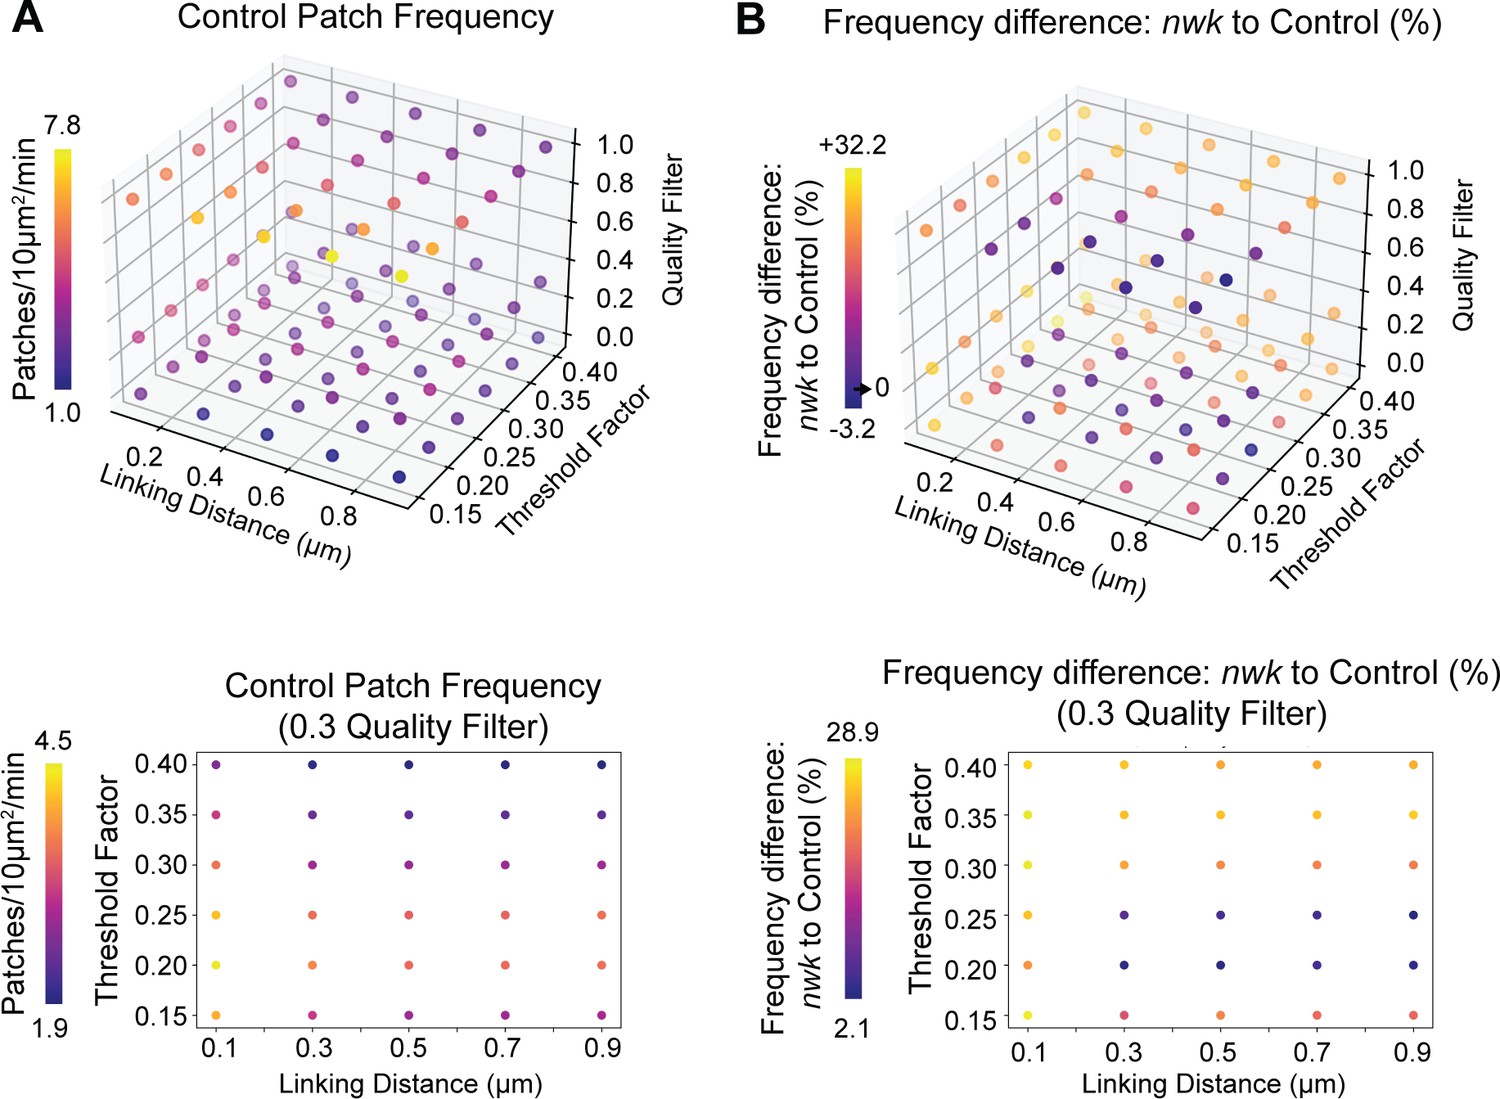
Analysis of actin dynamics is robust to tracking parameters at 1 Hz imaging.
(A) Quantification of patch frequency in the control genotype of Figure 6A–C across a range of patch detection and tracking parameters. Consistent with the 0.25 Hz imaging (Figure 1—figure supplement 2), link distance and patch detection threshold have a small effect on patch frequency. Lower graph highlights the effect of linking distance vs detection threshold specifically at the 0.3 quality filter (as used in all analyses). (B) Quantification of the percent difference in patch frequency between nwk mutant neuromuscular junctions (NMJs) and controls, from the same experiment shown in Figure 6A–C. Across the majority of the parameter space, nwk mutants show an increase in patch frequency, as reported. Lower graph highlights the effect of linking distance vs detection threshold at the 0.3 quality filter. Associated with Figure 6.
Figure 6—figure supplement 2
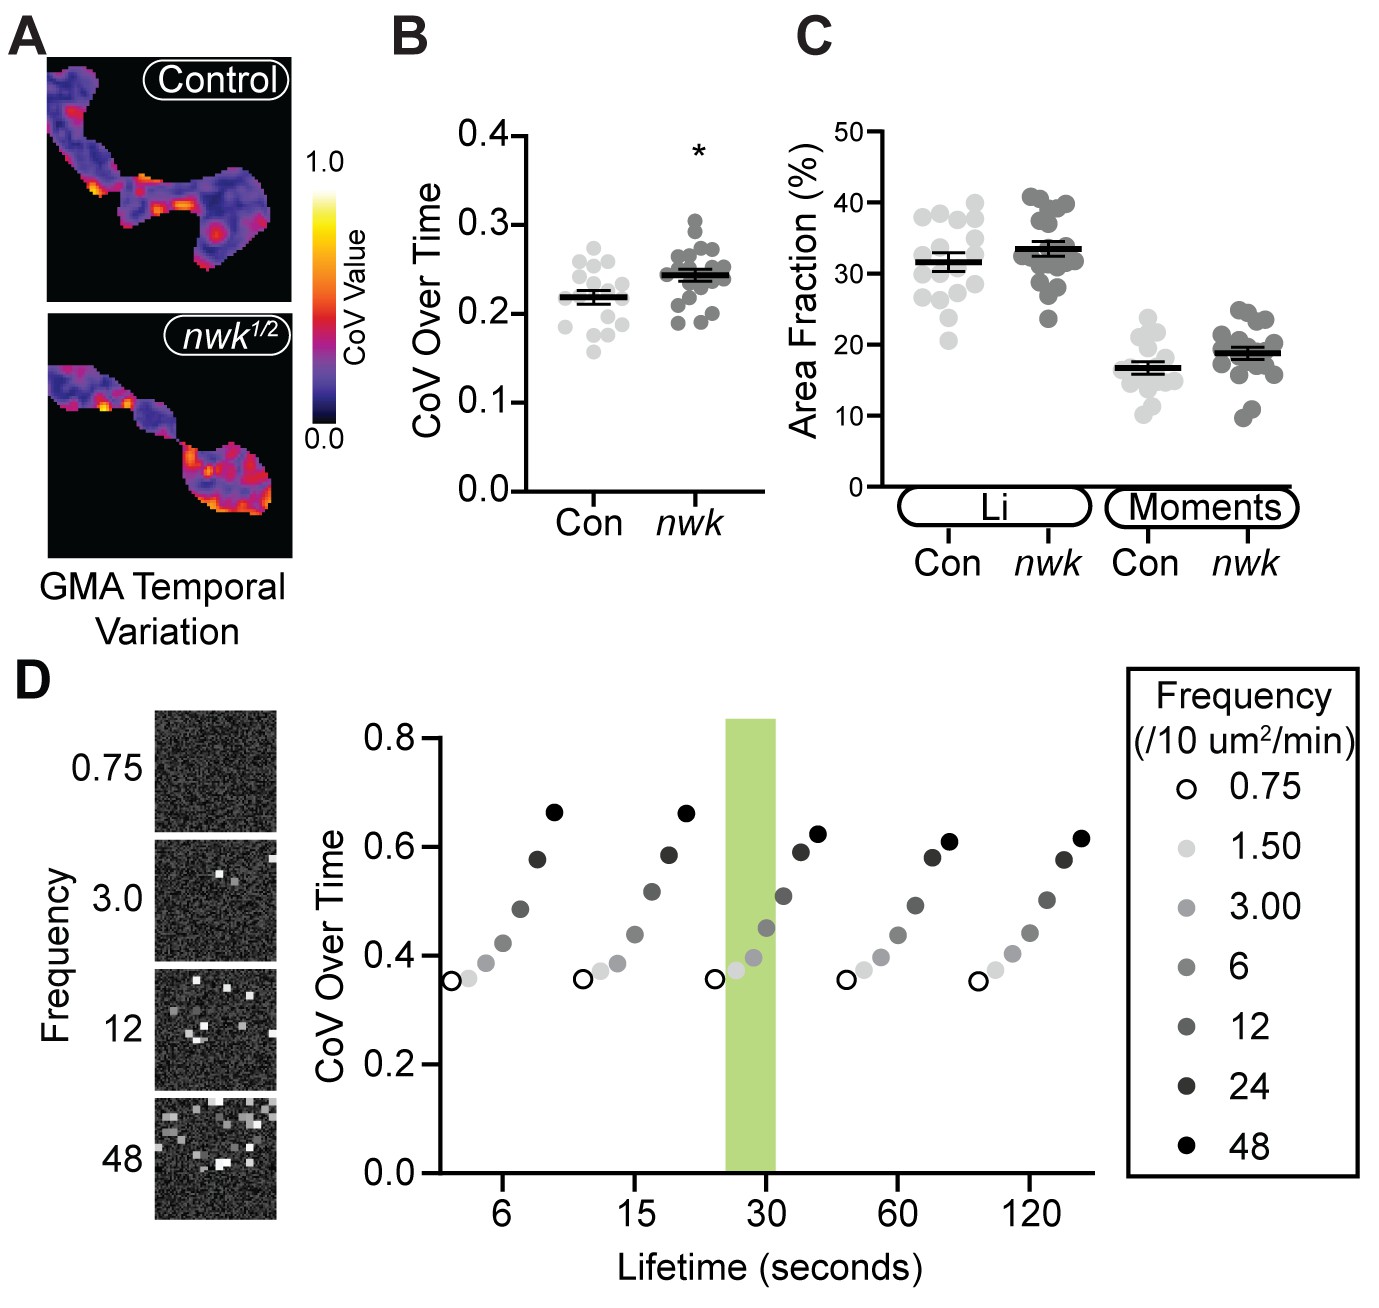
Validation of actin particle analysis in nwk mutants.
(A) Coefficient of variation (CoV) projections of timelapse videos of GMA dynamics in control and nwk mutant neuromuscular junctions (NMJs) (analysis of the same dataset as shown in Figure 6A–C; different representative images shown).(B) Average temporal CoV values across NMJs. nwk mutants exhibit greater temporal variation in GMA signal than controls. (C) Quantification of the fraction of NMJ area covered by ‘high’ CoV pixels (identified by automated thresholding using either Li (Li and Tam, 1998) or Moments (Tsai, 1995) algorithm). nwk mutants show no difference in the fraction of high CoV pixels, suggesting that actin dynamics are confined to a restricted region of the synapse and vary more over time rather than space. (D) Example of results from temporal CoV analysis of synthetic data, in which the frequency and lifetime were systematically varied. (Left) Representative images of synthetic data created using a custom FIJI script. (Right) Quantification of CoV over time. Shaded green region indicates values that most closely match in vivo measurements drawn from Patchtracker particle-based analysis. In this regime, our model indicates that the nwk mutant effect size in panel (B) corresponds to a 43% increase in patch frequency, slightly higher than the particle-based measurement of 28%. Associated with Figure 6.
Figure 7 with 3 supplements
Actin patches and the Nwk-Dap160 interaction are associated with synaptic endocytosis.
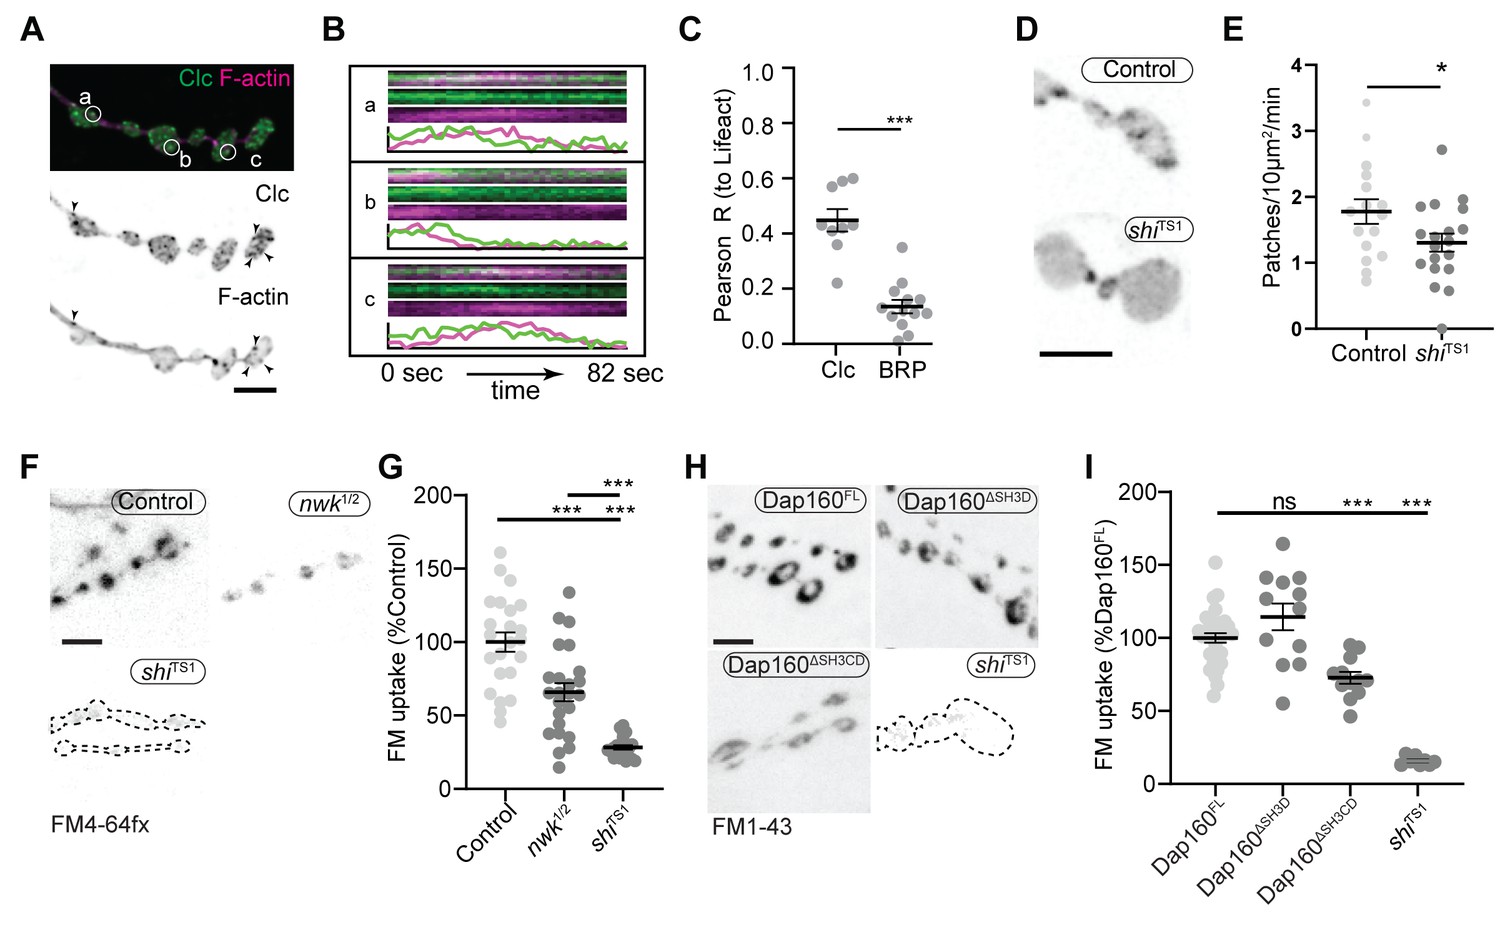
(A, B) Sum intensity projection (A) and representative kymographs (B) of spinning disc confocal timelapse of presynaptically expressed Lifeact::Ruby and clc::GFP. (A) Sum projection of 41 frames (82 s) highlights overlapping intensities of clc and Lifeact (circles and arrowheads). Circles indicate locations of kymographs in panel (B). (B) Kymographs of clc and Lifeact signals. Kymographs span the full duration of the movie from left (0 s) to right (82 s). Intensity profiles were normalized per channel from the minimum to the maximum value of each profile. (C) Quantification of colocalization between Lifeact::Ruby and Clc::GFP. Presynaptically expressed Lifeact::Ruby was co-expressed with either presynaptically expressed Clc::GFP or a BRP::GFP knockin and imaged in 3D stacks by Airyscan. Bruchpilot (BRP) control is the same dataset as in Figure 1F (all data were acquired contemporaneously). (D, E) Normal patch assembly requires dynamin activity. (D) Maximum intensity projections (MaxIPs) of single spinning disc confocal microscopy time points, showing pan-neuronally expressed GFP::actin in control and shiTS1 mutant muscle 6/7 neuromuscular junctions (NMJs), imaged at 1 Hz, at the restrictive temperature of 31oC under stimulating conditions to drive the terminal shiTS1 phenotype (45 mM KCl, 2 mM CaCl2). Graph shows mean ± sem. n represents NMJs. (E) Quantification of patch frequency. (F–I) FM dye uptake assays at muscle 6/7 NMJs following 5 min of 90 mM potassium stimulation at 36°C. (F, H) MaxIPs of spinning disc confocal micrographs of FM dye uptake assays. Dotted lines highlight synapse outline in shiTS1 NMJs. (F, G) nwk mutants exhibit partially defective FM4-64fx dye uptake relative to shiTS1 mutants. (H, I) Loss of Dap160-Nwk interactions in a Dap160ΔSH3CD truncation (but not Dap160ΔSH3D) exhibits partially defective FM1-43 dye uptake relative to shiTS1, similar to nwk mutants. Graphs show mean ± sem; n represents NMJs. Scale bars are 2.5 µm (A, B) or 5 µm (D, F, H). Associated with Figure 7—figure supplements 1–3, Video 3.
-
Figure 7—source data 1
Source data for Figure 7 and associated figure supplements.
Source data showing intensity dynamics over time from the kymographs shown in Figure 7A. Contains raw Pearson’s correlation values between Lifeact::Ruby, clc::GFP, BRP::GFP, and Arp3::GFP. Source data quantifying actin dynamics in control and shiTS1 mutant neuromuscular junctions (NMJs). Source data quantifying FM dye uptake in control and nwk mutant NMJs. Source data quantifying FM dye uptake in control and Dap160 transgene rescue NMJs. Source data quantifying the radial distribution (from edge to center of boutons) of AP2 and Clc. Source data quantifying colocalization between AP2 and Lifeact::Ruby. Source data quantifying satellite bouton counts in Dap160 transgene rescue NMJs. Source data quantifying FM dye uptake and unloading in control and nwk mutant NMJs. Source data quantifying FM dye uptake and unloading in control and Dap160 transgene rescue NMJs.
- https://cdn.elifesciences.org/articles/69597/elife-69597-fig7-data1-v1.zip
Figure 7—figure supplement 1
Colocalization of actin with AP2α and Clathrin light chain.
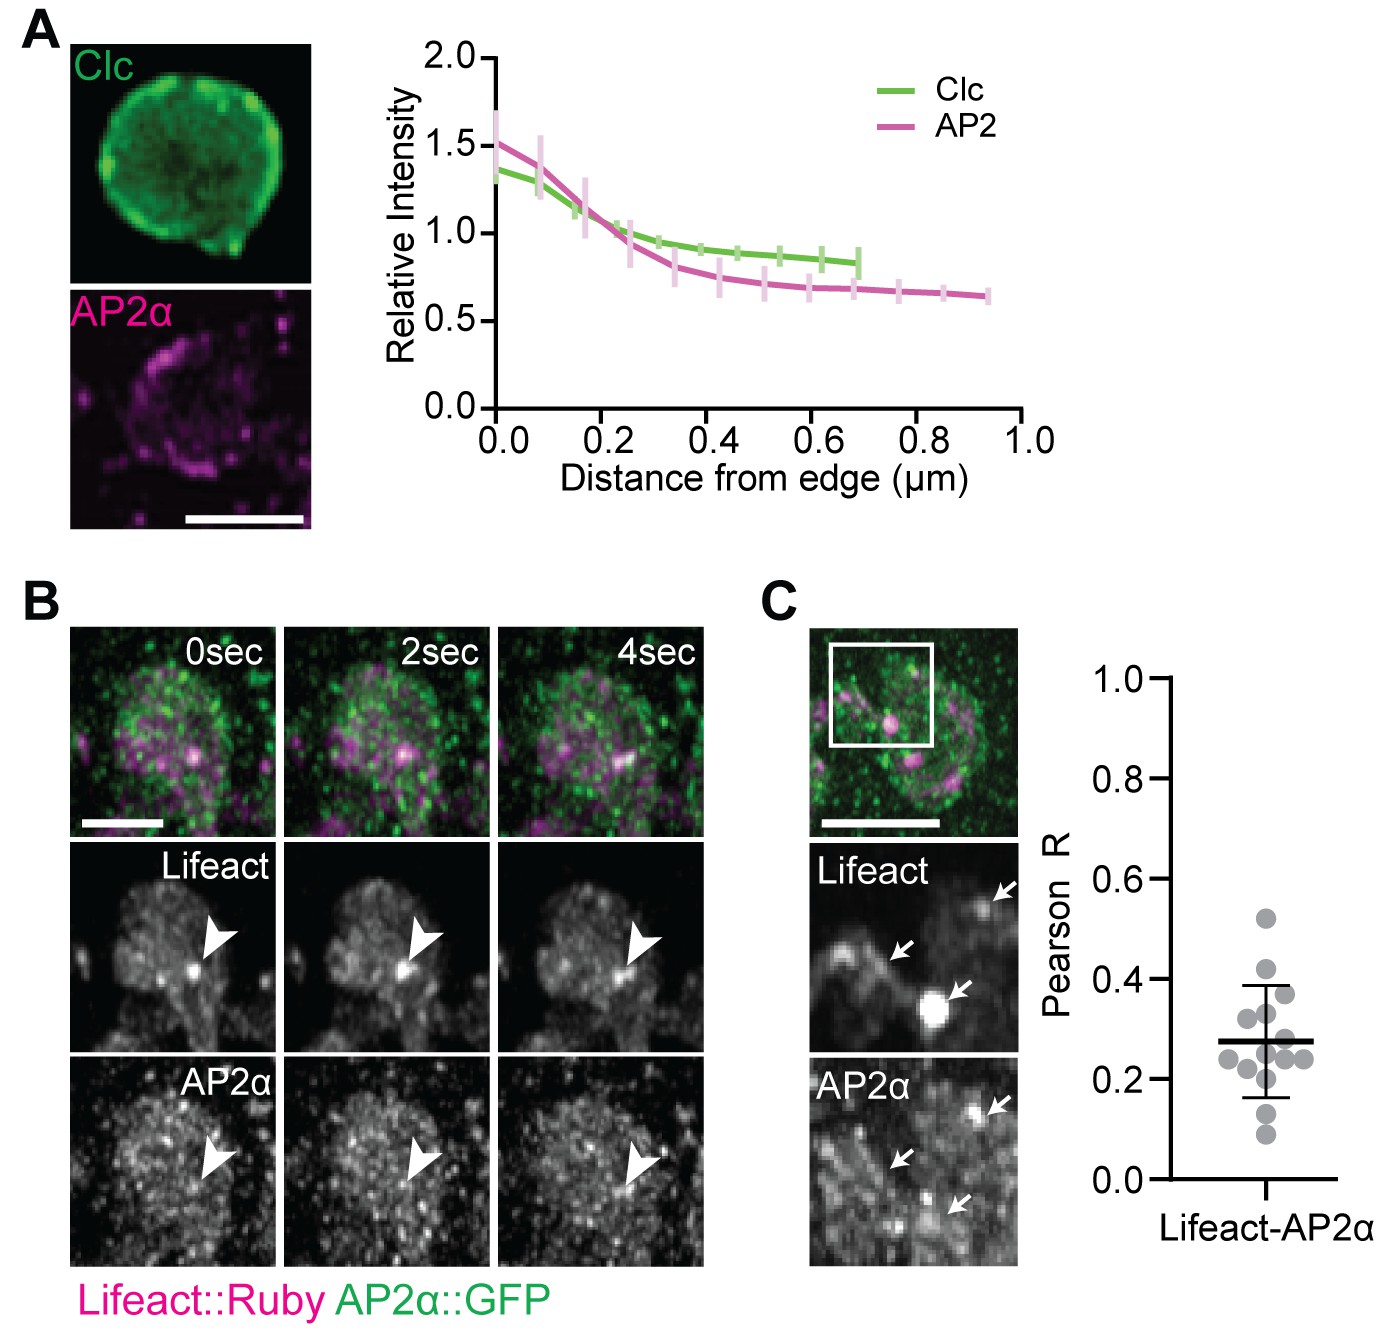
(A) Clc::GFP and AP2α::GFP are enriched at the synaptic plasma membrane. Images show single plane Z-slices of the mid-bouton region (effectively a cross-section through the bouton) from live Airyscan imaging of presynaptically expressed Clc::GFP (green) and endogenously tagged AP2α::GFP (magenta). Right: radial intensity profile from the outside edge (left) to the center (right) of boutons similar to those shown (values are mean ± Std Dev across n = 6 (Clc::GFP) or 7 (AP2 α::GFP) boutons). (B, C) Spinning disc confocal imaging maximum intensity projections (MaxIPs) of Airyscan micrographs of endogenously tagged AP2α::GFP (green) and Lifeact::Ruby (magenta) in live (B) or fixed (C) preparations. (C) Actin and AP2α partially colocalize; note a significant fraction of endogenously labeled AP2α::GFP is postsynaptic. Graph shows quantification of colocalization by Pearson’s coefficient. Scale bars in (A) and (B) are 2.5 μm. Associated with Figure 7.
Figure 7—figure supplement 2
All Dap160 transgenes rescue dap160 satellite bouton phenotype.
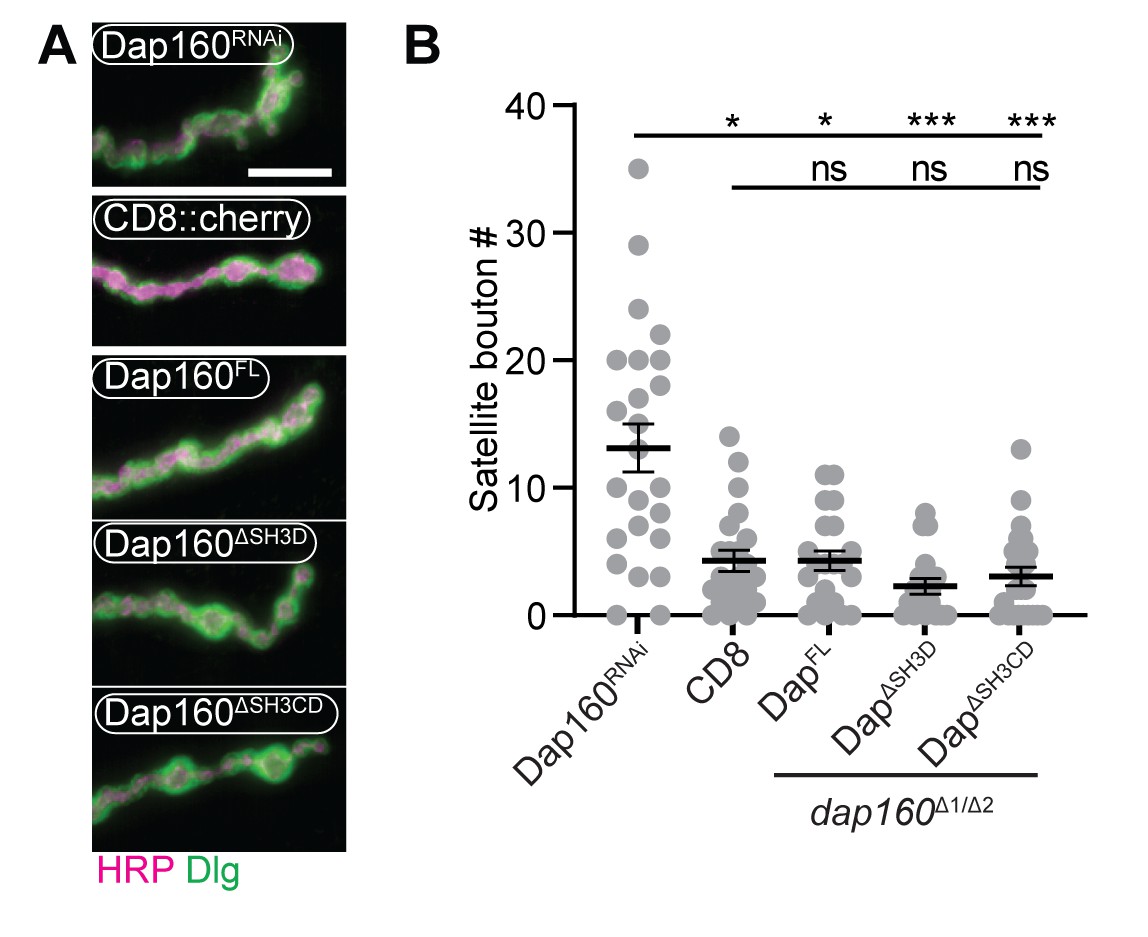
(A) Maximum intensity projections (MaxIPs) of epifluorescence micrographs of muscle 4 neuromuscular junctions (NMJs) stained for anti-HRP (magenta) and anti-Dlg (green). Dap160 RNAi-expressing NMJs exhibit many satellite boutons, which are restored to normal levels by presynaptic expression of Dap160FL, Dap160ΔSH3D, or Dap160ΔSH3CD (in dap160Δ1/Df larvae). (B) Quantification of satellite boutons. Graph shows mean ± sem; n represents NMJs. Scale bar in (A) is 10 µm. Associated with Figure 7.
Figure 7—figure supplement 3
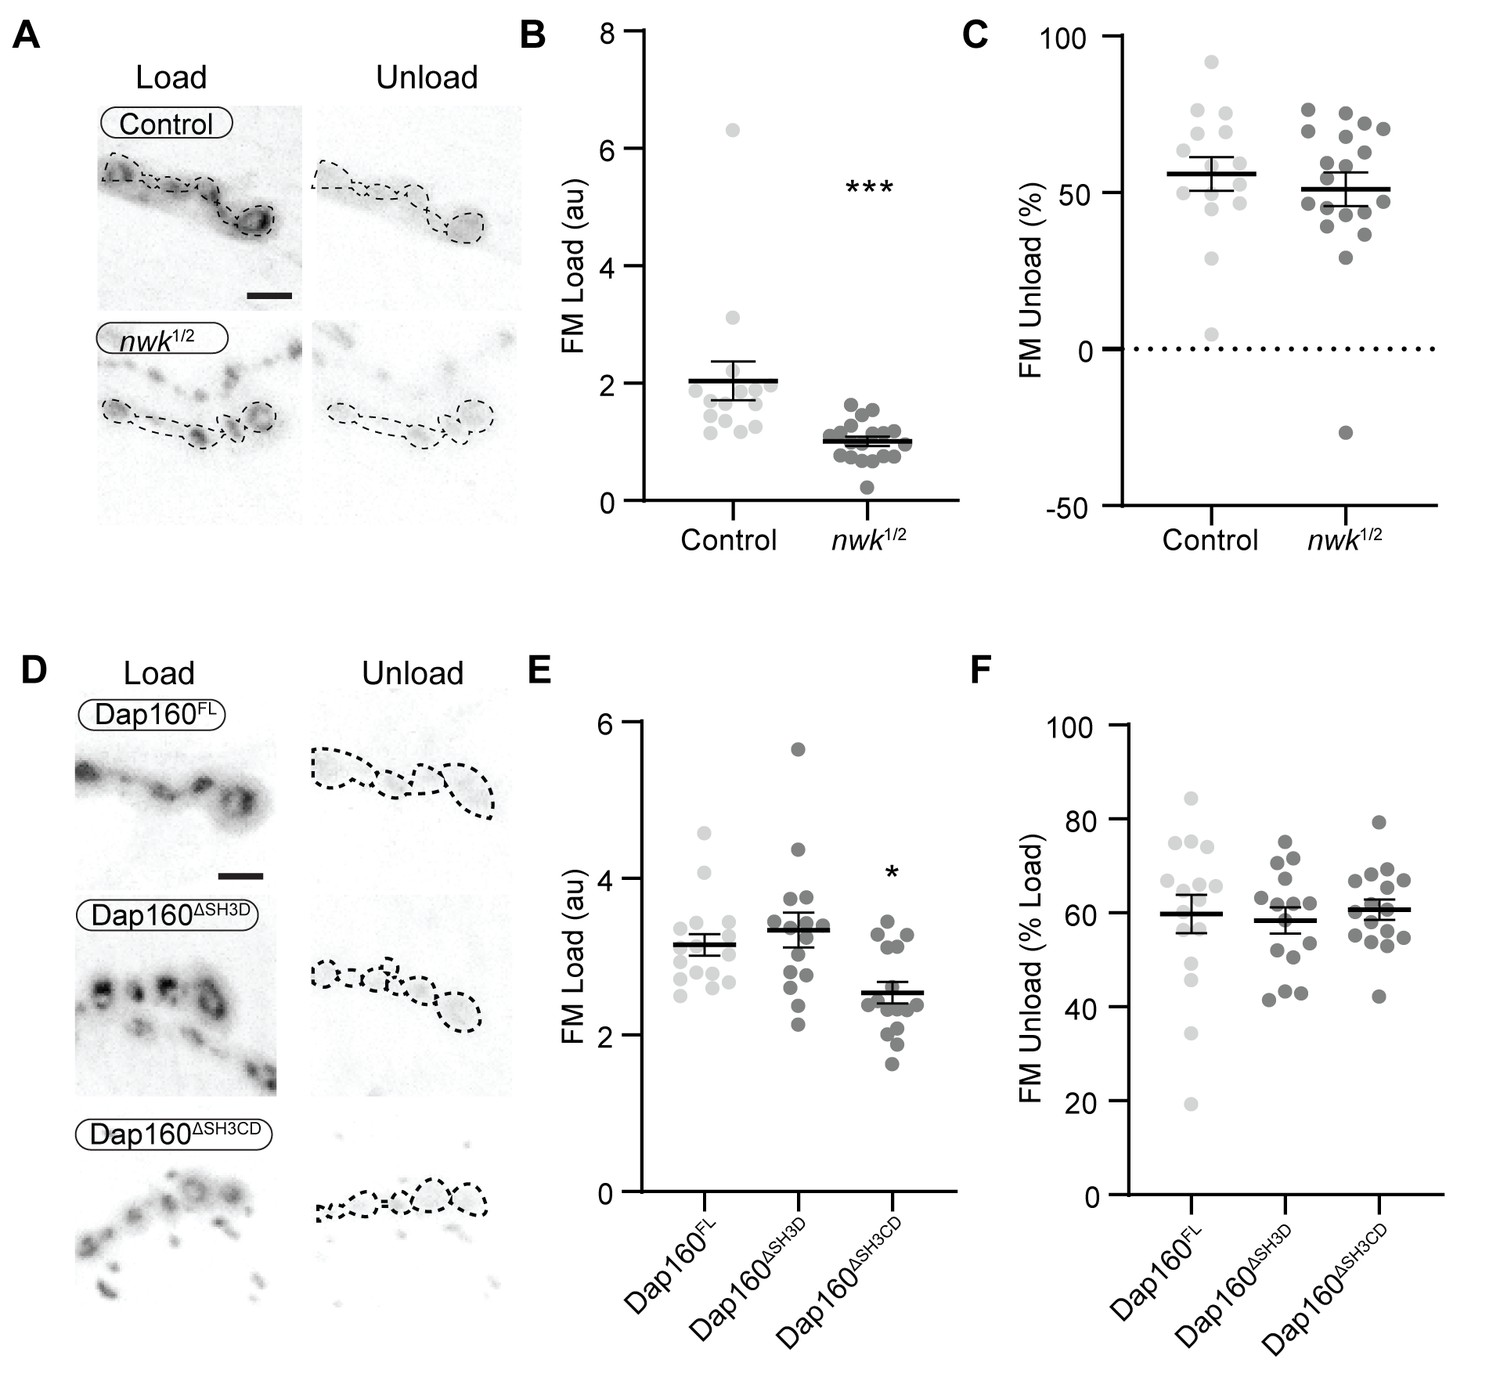
nwk and dap160 domain mutants do not disrupt FM dye unloading.
Loading and unloading of FM dyes in nwk and dap160 domain mutants by stimulation in 90 mM KCl + 2 mM CaCl2. (A, D) Maximum intensity projections (MaxIPs) of spinning disc confocal stacks acquired after loading (left) and unloading (right) of FM dyes. (B, C) Quantification of FM4-64 loading (B) and unloading (C) in nwk mutants. (E, F) Quantification of FM1-43 loading (E) and unloading (F) in dap160 domain mutants.
Videos
Video 1
Dynamics of actin patches labeled by complementary reporters.
Video 2
Loss of nwk increases the frequency of brief actin patches.
Video 3
Clc-GFP and Lifeact::Ruby partially colocalize.
Tables
Key resources table
| Reagent type (species) or resource | Designation | Source or reference | Identifiers | Additional information |
|---|---|---|---|---|
| Gene (Drosophila melanogaster) | nwk | GenBank | FLYB: FBgn0263456 | |
| Gene (D. melanogaster) | dap160 | GenBank | FLYB: FBgn0023388 | |
| Gene (D. melanogaster) | wsp | GenBank | FLYB: FBgn0024273 | |
| Gene (D. melanogaster) | shi | GenBank | FLYB: FBgn0003392 | |
| Gene (D. melanogaster) | clc | GenBank | FLYB: FBgn0024814 | |
| Gene (D. melanogaster) | AP-2α | GenBank | FLYB: FBgn0264855 | |
| Genetic reagent (D. melanogaster) | AP2α::GFP | This study | Maintained in Kaksonen Lab - see 'Methods' for description | |
| Genetic reagent (D. melanogaster) | w; UAS-WASp::TEV-Myc IIB (chromosome II insertion) | This study | Maintained in Rodal Lab - see 'Methods' for description | |
| Genetic reagent (D. melanogaster) | w; UAS-GFP::Moesin Actin Binding Domain (GMA) | Bloomington Drosophila Stock Center | BDSC:31776; FLYB: FBti0131132; RRID:BDSC_31777 | FlyBase symbol: P{UAS-GMA}3 |
| Genetic reagent (D. melanogaster) | w; UAS-Lifeact::Ruby | Bloomington Drosophila Stock Center | BDSC:35545; FLYB: FBst0035545; RRID:BDSC_35545 | FlyBase symbol: P{UAS-Lifeact-Ruby}VIE-19A |
| Genetic reagent (D. melanogaster) | w; UAS-Arp3::GFP | Bloomington Drosophila Stock Center | BDSC: 39722; FLYB: FBst0039722; RRID:BDSC_39722 | FlyBase symbol: P{w[+mC]=UASp-Arp3.GFP}3 |
| Genetic reagent (D. melanogaster) | w; e1, wsp1/TM6b,Tb | Bloomington Drosophila Stock Center | BDSC: 51657; FLYB: FBst0051657; RRID:BDSC_51657 | FlyBase symbol: e[1] WASp[1] |
| Genetic reagent (D. melanogaster) | w; UAS-GFP::actin | Bloomington Drosophila Stock Center | BDSC: 9258; FLYB: FBst0009258; RRID:BDSC_9258 | FlyBase symbol: P{w[+mC]=UASp-GFP.Act5C}2-1 |
| Genetic reagent (D. melanogaster) | yv; P{TRiP.HMC03360}attP40 - Wasp RNAi | Bloomington Drosophila Stock Center | BDSC: 51802; FLYB: FBst0051802; RRID:BDSC_51802 | FlyBase symbol: P{y[+t7.7] v[+t1.8]=TRiP.HMC03360}attP40 |
| Genetic reagent (D. melanogaster) | yw; UAS-luciferase RNAi | Bloomington Drosophila Stock Center | BDSC: 31603; FLYB: FBst0031603; RRID:BDSC_31603 | FlyBase symbol: P{y[+t7.7] v[+t1.8]=TRiP.JF01355}attP2 |
| Genetic reagent (D. melanogaster) | w; UAS-Dap160ΔSH3D::mCherry VK00027 | This study | Maintained in Rodal Lab - see 'Methods' for description | |
| Genetic reagent (D. melanogaster) | w; UAS-Dap160ΔSH3CD::mCherry VK00027 | This study | Maintained in Rodal Lab - see 'Methods' for description | |
| Genetic reagent (D. melanogaster) | w; UAS-Dap160FL::mCherry VK00027 | This study | Maintained in Rodal Lab - see 'Methods' for description | |
| Genetic reagent (D. melanogaster) | yw; UAS-Dap160-RNAi | Bloomington Drosophila Stock Center | BDSC: 25879; FLYB: FBst0025879; RRID:BDSC_25879 | FlyBase symbol: P{y[+t7.7] v[+t1.8]=TRiP.JF01918}attP2 |
| Genetic reagent (D. melanogaster) | yw; Mi{PT-GFSTF.1}nwkMI05435-GFSTF.1 | Bloomington Drosophila Stock Center | BDSC: 64445; FLYB: FBst0064445; RRID:BDSC_64445 | FlyBase symbol: Mi{PT-GFSTF.1}nwk[MI05435-GFSTF.1] |
| Genetic reagent (D. melanogaster) | w; nwk2,h | Coyle et al., 2004 | FLYB: FBal0154818 | FlyBase symbol: nwk[2] |
| Genetic reagent (D. melanogaster) | w; nwk1 | Bloomington Drosophila Stock Center | BDSC: 51626; FLYB: FBst0051626; RRID:BDSC_51626 | FlyBase symbol: nwk[1] |
| Genetic reagent (D. melanogaster) | w; dap160Δ1 | Bloomington Drosophila Stock Center | BDSC: 24877; FLYB: FBst0024877; RRID:BDSC_24877 | FlyBase symbol: Dap160[Delta1] |
| Genetic reagent (D. melanogaster) | w; Df(2L)Exel6047, P{XP-U}Exel6047/CyOGFP (Dap160Df) | Bloomington Drosophila Stock Center | BDSC: 7529; FLYB: FBst0007529; RRID:BDSC_7529 | FlyBase symbol: Df(2L)Exel6047, P{w[+mC]=XP-U}Exel6047 |
| Genetic reagent (D. melanogaster) | dvglut(X)-GAL4 | Daniels et al., 2008 | FLYB: FBti0129146 | FlyBase symbol: P{VGlut-GAL4.D}NMJX |
| Genetic reagent (D. melanogaster) | elavc155-GAL4 | Bloomington Drosophila Stock Center | BDSC: 458; FLYB: FBst0000458; RRID:BDSC_458 | FlyBase symbol: P{w[+mW.hs]=GawB}elav[C155] |
| Genetic reagent (D. melanogaster) | UAS-Dcr2 | Bloomington Drosophila Stock Center | BDSC: 24646; FLYB: FBst0024646; RRID:BDSC_24646 | FlyBase symbol: P{w[+mC]=UAS-Dcr-2.D}1 |
| Genetic reagent (D. melanogaster) | CD8-mCherry | Bloomington Drosophila Stock Center | BDSC:32218; FLYB: FBst0032218; RRID:BDSC_32218 | FlyBase symbol: P{y[+t7.7] w[+mC]=10XUAS-IVS-mCD8::RFP}attP2 |
| Antibody | Rabbit α-Nwk Polyclonal | Coyle 2004 | #970 RRID:AB_2567353 | IF(1:1000), WB (1:1000) |
| Antibody | Mouse α-Brp Monoclonal | DSHB | RRID:AB_2314866 | IF(1:100) |
| Antibody | Mouse α-Myc Monoclonal | DSHB | RRID:AB_2266850 | IF(1:50) |
| Antibody | Rabbit α-Dap160 Polyclonal | Davis/Kelly | RRID:AB_2569367 | IF(1:1000) |
| Antibody | Mouse α-Xpress Monoclonal | ThermoFisher | RRID:AB_2556552 | WB(1:1000) |
| Antibody | Mouse α-Tubulin Monoclonal | Sigma | RRID:AB_477579 | WB(1:1000) |
| Antibody | α-HRP Polyclonal | Jackson ImmunoResearch | RRID:AB_2338967 | IF(1:500) |
| Recombinant DNA reagent | His-Nwk607-731 | Kelley et al., 2015 | ||
| Recombinant DNA reagent | GST | Kelley et al., 2015 | ||
| Recombinant DNA reagent | 6His-Dap160SH3C | This study | Maintained in Rodal Lab - see 'Methods' for description | |
| Recombinant DNA reagent | 6His-Dap160SH3D | This study | Maintained in Rodal Lab - see 'Methods' for description | |
| Recombinant DNA reagent | 6His-Dap160SH3CD | This study | Maintained in Rodal Lab - see 'Methods' for description | |
| Recombinant DNA reagent | GST-Dap160SH3C | This study | Maintained in Rodal Lab - see 'Methods' for description | |
| Recombinant DNA reagent | GST-Dap160SH3D | This study | Maintained in Rodal Lab - see 'Methods' for description | |
| Recombinant DNA reagent | GST-Dap160SH3CD | This study | Maintained in Rodal Lab - see 'Methods' for description | |
| Recombinant DNA reagent | His-Nwk1-428 | Becalska et al., 2013 | ||
| Recombinant DNA reagent | His-Nwk1-633 | Kelley et al., 2015 | ||
| Recombinant DNA reagent | His-Nwk1-731 | Kelley et al., 2015 | ||
| Recombinant DNA reagent | His-WASp1-143 | Rodal et al., 2008 | ||
| Recombinant DNA reagent | His-SNAP-Nwk1-731 | Kelley et al., 2015 | ||
| Recombinant DNA reagent | His-SNAP-Nwk1-633 | This study | Maintained in Rodal Lab - see 'Methods' for description | |
| Recombinant DNA reagent | His-SNAP-Dap160SH3CD | This study | Maintained in Rodal Lab - see 'Methods' for description | |
| Sequence-based reagent | UAS-Dap160SH3ΔCD-FWD | This paper | PCR primers | ATGAACTCGGCGGTGGATGCGTGG |
| Sequence-based reagent | UAS-Dap160SH3ΔCD-REV | This paper | PCR primers | CCACATCAGCCTTTTGGACAT |
| Sequence-based reagent | UAS-Dap160SH3ΔD-FWD | This paper | PCR primers | ATGAACTCGGCGGTGGATGCGTGG |
| Sequence-based reagent | UAS-Dap160SH3ΔD-REV | This paper | PCR primers | GAGAACCTTCACGTAAGTGGC |
| Sequence-based reagent | UAS-Dap160SH3FL-FWD | This paper | PCR primers | ATGAACTCGGCGGTGGATGCGTGG |
| Sequence-based reagent | UAS-Dap160SH3FL-REV | This paper | PCR primers | TCTTCTTGGTGGTGCCATTTG |
| Sequence-based reagent | His/GST-Dap160SH3C-FWD | This paper | PCR primers | GGAATGCGTGCCAAGCGG |
| Sequence-based reagent | His/GST-Dap160SH3C-REV | This paper | PCR primers | TTGGAGAACCTTCACGTAAGTGG |
| Sequence-based reagent | His/GST-Dap160SH3CD-FWD | This paper | PCR primers | GGAATGCGTGCCAAGCGG |
| Sequence-based reagent | His/GST-Dap160SH3CD-REV | This paper | PCR primers | TCACTTCTTGGTGGTGCCATTTGC |
| Sequence-based reagent | His/GST-Dap160SH3D-FWD | This paper | PCR primers | CAAGGTCATTGCTCTCTATCCG |
| Sequence-based reagent | His/GST-Dap160SH3D-REV | This paper | PCR primers | TCACTTCTTGGTGGTGCCATTTGC |
| Sequence-based reagent | His/GST-Dap160SH3ABCD-FWD | This paper | PCR primers | CACAGGCTCTTCCAGTGCTTGG |
| Sequence-based reagent | His/GST-Dap160SH3ABCD-REV | This paper | PCR primers | TCACTTCTTGGTGGTGCCATTTGC |
| Peptide, recombinant protein | Arp2/3 Complex | Cytoskeleton, Inc | RP01-P | |
| Biological sample (Oryctolagus cuniculus) | Rabbit Muscle | Pel-Freez | 41225 -2 | |
| Software, algorithm | Prism | Graphpad | RRID:SCR_002798 | |
| Software, algorithm | FIJI | FIJI | RRID:SCR_002285 | |
| Other | DOPC | Echelon | 1182 | |
| Other | DOPS | Avanti | 840035C | |
| Other | PI(4,5)P2 | Avanti | 840046X | |
| Other | TopFluor-PE | Avanti | 810282C | |
| Other | DOPE | Echelon | 2182 | |
| Other | FM1-43FX | ThermoFisher | F35355 | |
| Other | FM4-64FX | ThermoFisher | F34653 |
Additional files
-
Source code 1
This file contains the code used in this manuscript as follows.
Code used to generate toy data analyzed in Figure 6—figure supplement 2. Code used to analyze toy data analyzed in Figure 6—figure supplement 2. Code used to analyze channel intensity and distribution for Figure 1—figure supplement 1F, Figure 3D, Figure 3—figure supplement 2B-D, Figure 7F–I, Figure 7—figure supplement 3. Code used to analyze channel colocalization in 3D for Figure 1F, Figure 2D,F, Figure 3E, Figure 7C, Figure 7—figure supplement 1C.
- https://cdn.elifesciences.org/articles/69597/elife-69597-code1-v1.zip
-
Supplementary file 1
Summary of genotypes and statistics for all experiments in this study.
- https://cdn.elifesciences.org/articles/69597/elife-69597-supp1-v1.docx
-
Transparent reporting form
- https://cdn.elifesciences.org/articles/69597/elife-69597-transrepform-v1.docx
Download links
A two-part list of links to download the article, or parts of the article, in various formats.
Downloads (link to download the article as PDF)
Open citations (links to open the citations from this article in various online reference manager services)
Cite this article (links to download the citations from this article in formats compatible with various reference manager tools)
An autoinhibitory clamp of actin assembly constrains and directs synaptic endocytosis
eLife 10:e69597.
https://doi.org/10.7554/eLife.69597


