Modelling the impact of decidual senescence on embryo implantation in human endometrial assembloids
- Division of Biomedical Sciences, Warwick Medical School, University of Warwick, United Kingdom
- Centre for Early Life, Warwick Medical School, University of Warwick, United Kingdom
- Centre for Reproductive Medicine, University Hospitals Coventry and Warwickshire NHS Trust, United Kingdom
- Department of Physiology, Development and Neuroscience, University of Cambridge, United Kingdom
- Tommy’s National Centre for Miscarriage Research, University Hospitals Coventry & Warwickshire NHS Trust, United Kingdom
- Synthetic Mouse and Human Embryology Group, California Institute of Technology (Caltech), Division of Biology and Biological Engineering, United Kingdom
Figures
Figure 1
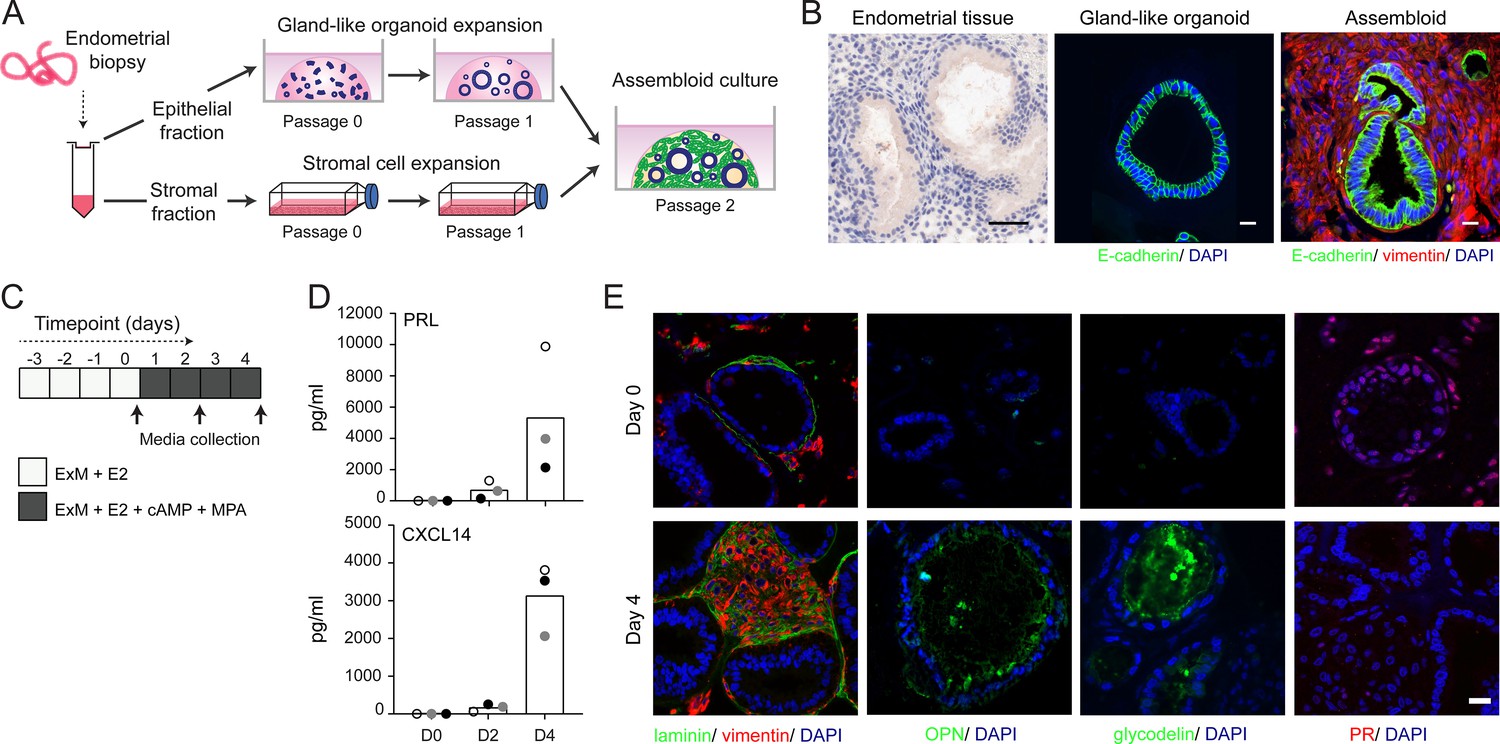
Establishment of endometrial assembloids.
(A) Schematic for establishing endometrial assembloids. (B) Structural appearance of hematoxylin and eosin stained secretory endometrium, E-cadherin labelled gland-like organoids, and E-cadherin and vimentin stained endometrial assembloids. Scale bar = 50 µm. (C) Schematic summary of experimental design. (D) Secreted levels of PRL and CXCL14 were measured by ELISA in spent medium at the indicated timepoints. Data points are coloured to indicate secretion in assembloids established from different endometrial biopsies (n = 3). (E) Representative immunofluorescence labelling of laminin and vimentin, progesterone receptor (PR), glycodelin, and osteopontin (OPN) in undifferentiated (day 0, top panels) and decidualized (day 4; bottom panels) assembloids. Nuclei were counterstained with DAPI. Scale bar = 50 µm. ELISA data in (B) are available in Figure 1—source data 1.
-
Figure 1—source data 1
Secretion of PRL and CXCL14 by endometrial assembloids.
Secretion of PRL and CXCL 14 (pg/ml) was measured by ELISA in spent medium from assembloids. Supports Figure 1D.
- https://cdn.elifesciences.org/articles/69603/elife-69603-fig1-data1-v2.xlsx
Figure 2

Characterization of a minimal differentiation medium for endometrial assembloids.
Parallel gland-like organoids (red) and assembloids (blue) were established from three endometrial biopsies and decidualized with 8-bromo-cAMP and MPA for 4 days in either expansion medium (ExM), base medium (BM), or BM with each exogeneous factor added back individually (+). Induction of PAEP and SPP1 was used to monitor the glandular differentiation. The grey bar indicates the composition of the minimal differentiation medium selected for further use (BM supplemented with NAC, E2, cAMP, and MPA). Data are presented as fold-change relative to expression levels in undifferentiated organoids or assembloids cultured in ExM+ E2. Bars present minimal, maximal, and median fold-change. * and ** indicate p<0.05 and p<0.01 obtained by Friedman’s test for matched samples. Relative expression values for biological replicates are available in Figure 2—source data 1.
-
Figure 2—source data 1
RTqPCR data associated with the minimal differentiation medium (MDM) experiments.
Parallel epithelial gland organoids and assembloids were established from endometrial biopsies and decidualized with 8-bromo-cAMP and MPA for 4 days in either expansion medium (ExM), base medium (BM), or BM with each exogeneous factor added back individually (red).
- https://cdn.elifesciences.org/articles/69603/elife-69603-fig2-data1-v2.xlsx
Figure 3 with 3 supplements
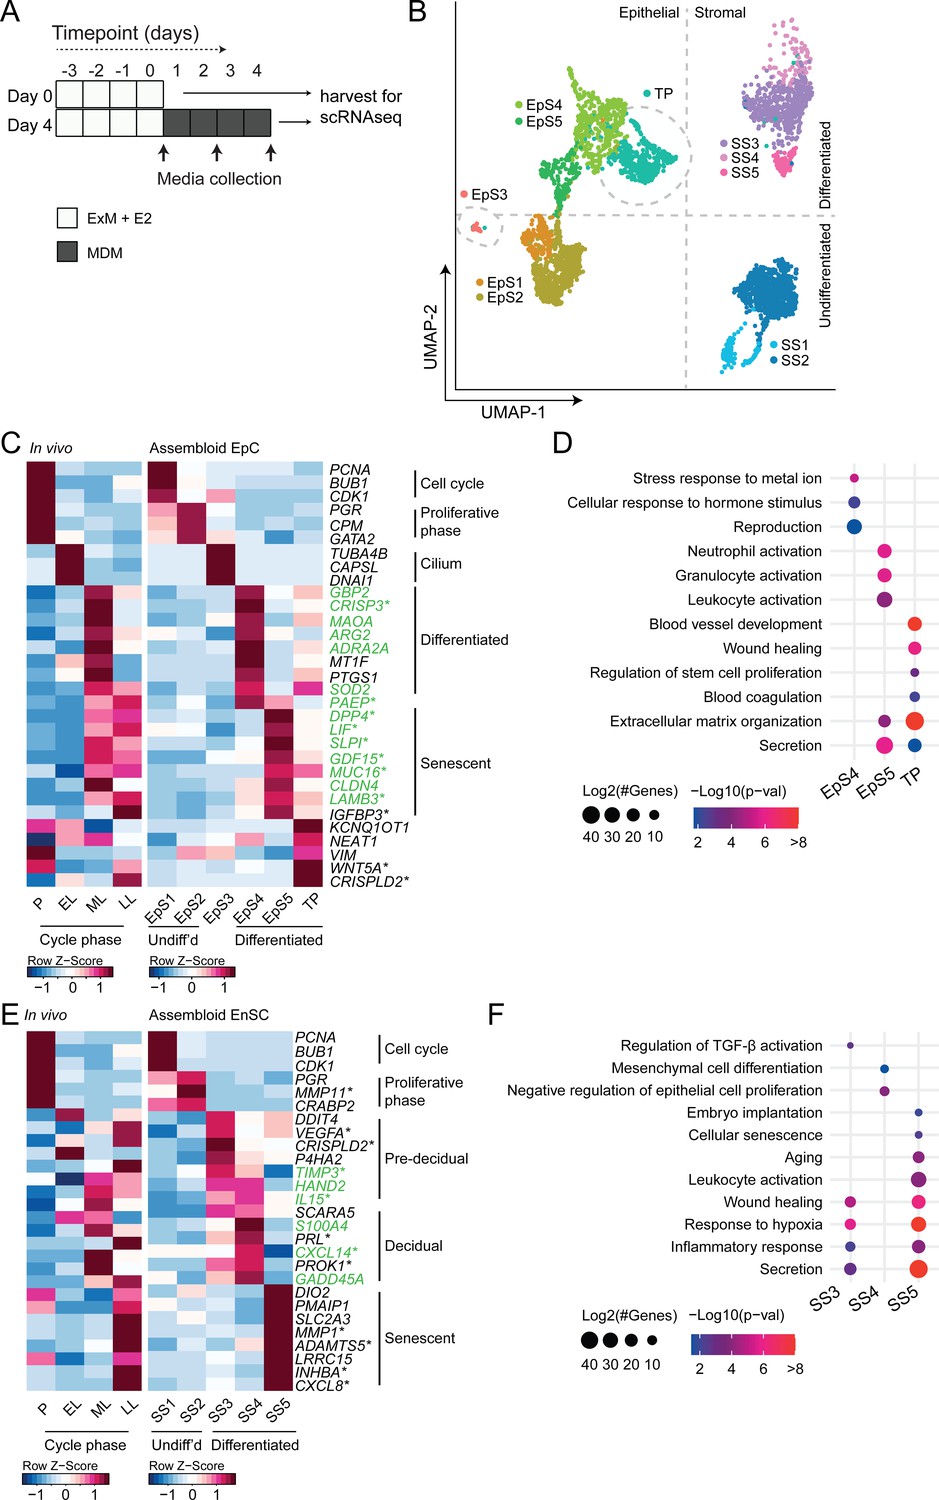
Decidualizing assembloids mimic midluteal endometrium.
(A) Schematic overview of experimental design. ExM: expansion medium; MDM: minimal differentiation medium. (B) Uniform Manifold Approximation and Projection (UMAP) visualizing epithelial and stromal subsets (EpS and SS, respectively) identified by single-cell transcriptomic analysis of undifferentiated and decidualized assembloids. A transitional population (TP) consisting of cells expressing epithelial and stromal markers is also shown. Dotted lines indicate the separation of EpS and SS in UMAP_1 and of undifferentiated and differentiated subpopulations in UMAP_2. Dotted circles indicate ciliated (EpS3) and TP, which did not fit these broad segregations. (C) Composite heatmaps showing relative expression (Z-scores) of epithelial marker genes across the menstrual cycle in vivo and in undifferentiated and decidualized assembloids. Highlighted in green are genes that mark the midluteal window of implantation (Díaz-Gimeno et al., 2011), whereas genes encoding secreted proteins are indicated by * (Uhlén et al., 2015). See also Figure 3—figure supplement 1. (D) Dot plots showing GO terms related to biological processes enriched in different epithelial populations in decidualizing assembloids. The dot size represents the number of genes in each GO term and the colour indicates FDR-corrected p-value. (E) Composite heatmaps showing relative expression (Z-scores) of stromal marker genes across the menstrual cycle in vivo and in undifferentiated and decidualized assembloids. Highlighted in green are genes that mark the midluteal window of implantation (Díaz-Gimeno et al., 2011), whereas genes encoding secreted proteins are indicated by * (Uhlén et al., 2015). (F) Dot plots showing GO terms related to biological processes enriched in different stromal subpopulations in decidualizing assembloids. See also Figure 3—figure supplements 1 and 2 and 3. Complete epithelial subpopulation marker lists can be found in Figure 3—source data 1. GO analysis outputs can be found in . Complete stromal subpopulation marker lists can be found in .
-
Figure 3—source data 1
Epithelial subpopulation markers.
Population markers were generated in Seurat v3 using FindMarkers on specified comparisons. Supports Figure 3C.
- https://cdn.elifesciences.org/articles/69603/elife-69603-fig3-data1-v2.xlsx
-
Figure 3—source data 2
GO analysis of differentiated subpopulations.
- https://cdn.elifesciences.org/articles/69603/elife-69603-fig3-data2-v2.xlsx
-
Figure 3—source data 3
Stromal sub-population markers.
Population markers were generated in Seurat v3 using FindMarkers on specified comparisons. Supports Figure 3E.
- https://cdn.elifesciences.org/articles/69603/elife-69603-fig3-data3-v2.xlsx
Figure 3—figure supplement 1
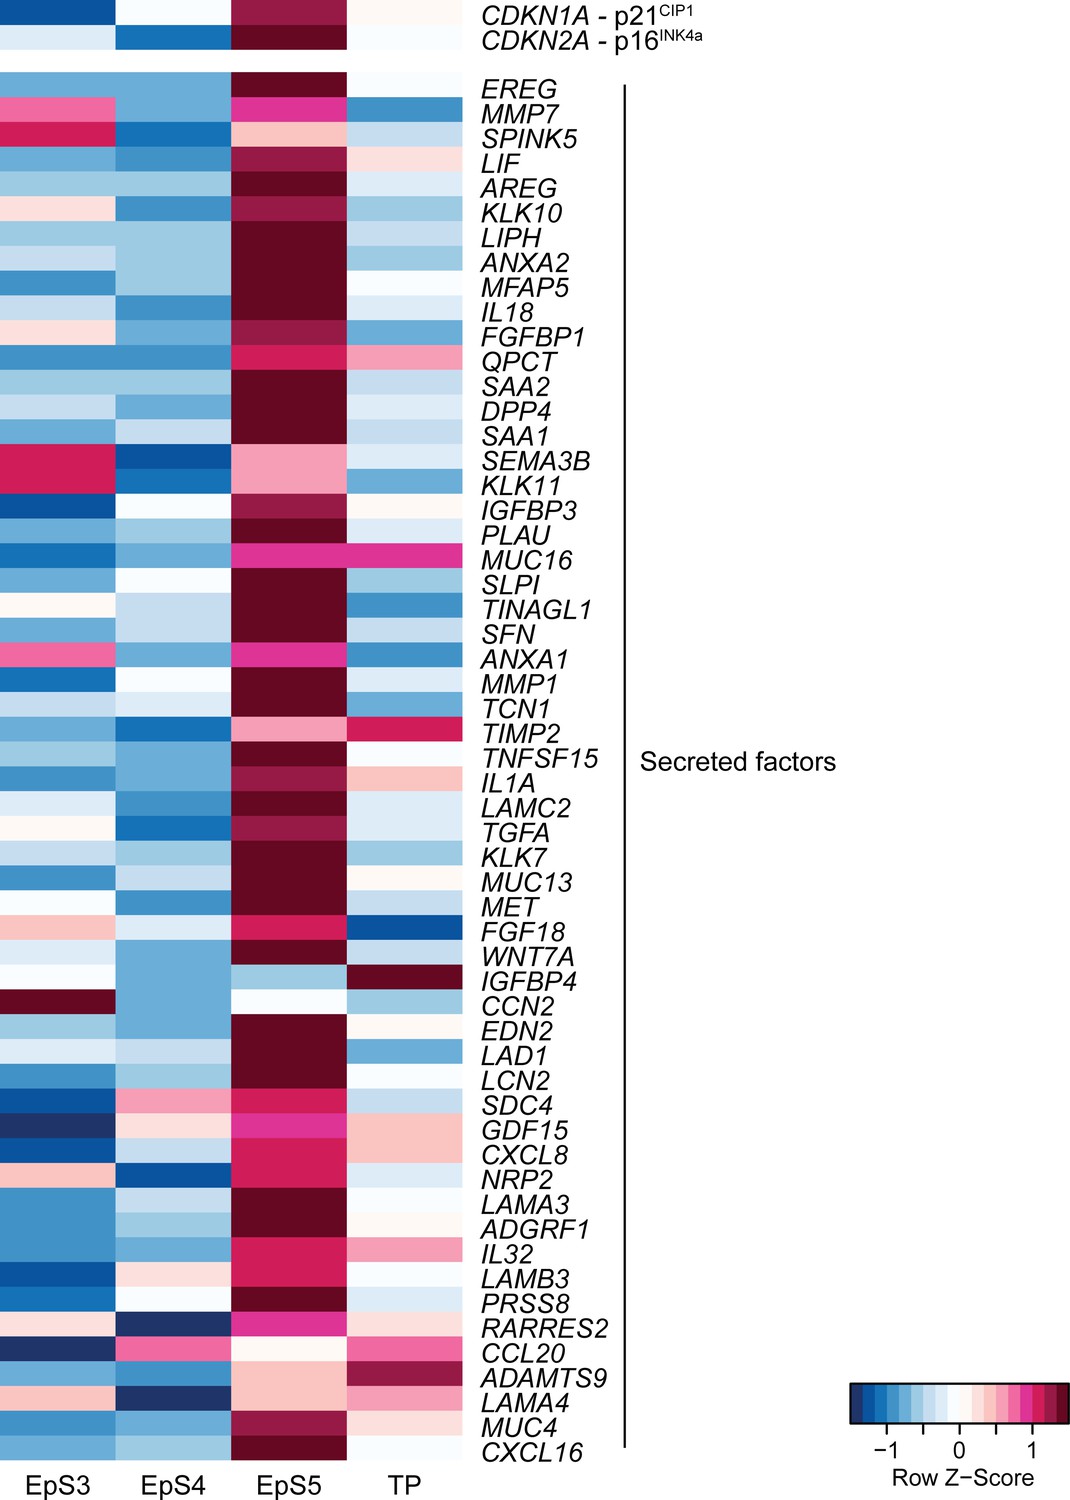
Heatmap showing relative expression (Z-scores) of genes encoding the cyclin-dependent kinase inhibitors p16INK4a and p21CIP1 as well as SASP-related genes in epithelial and transitional subpopulations in decidualizing assembloids.
Supports Figure 3C.
Figure 3—figure supplement 2
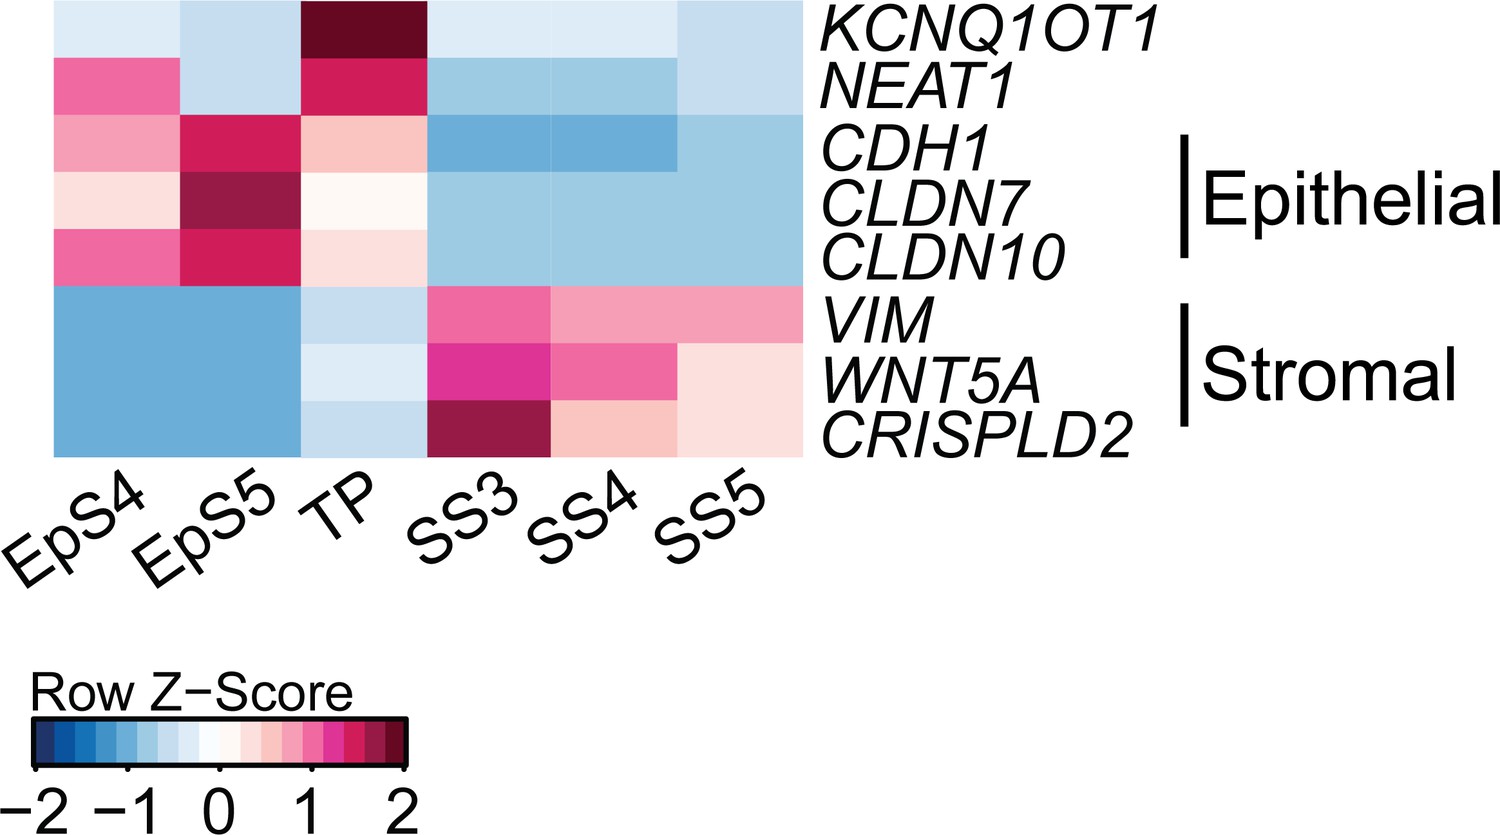
Heatmap showing relative expression (Z-scores) of epithelial-mesenchymal transition/mesenchymal-epithelial transition (EMT/MET), epithelial and mesenchymal marker genes in the transitional population (TP), epithelial (EpS4-5) and stromal (SS3-5) subpopulations in decidualizing assembloids.
Supports Figure 3C.
Figure 3—figure supplement 3
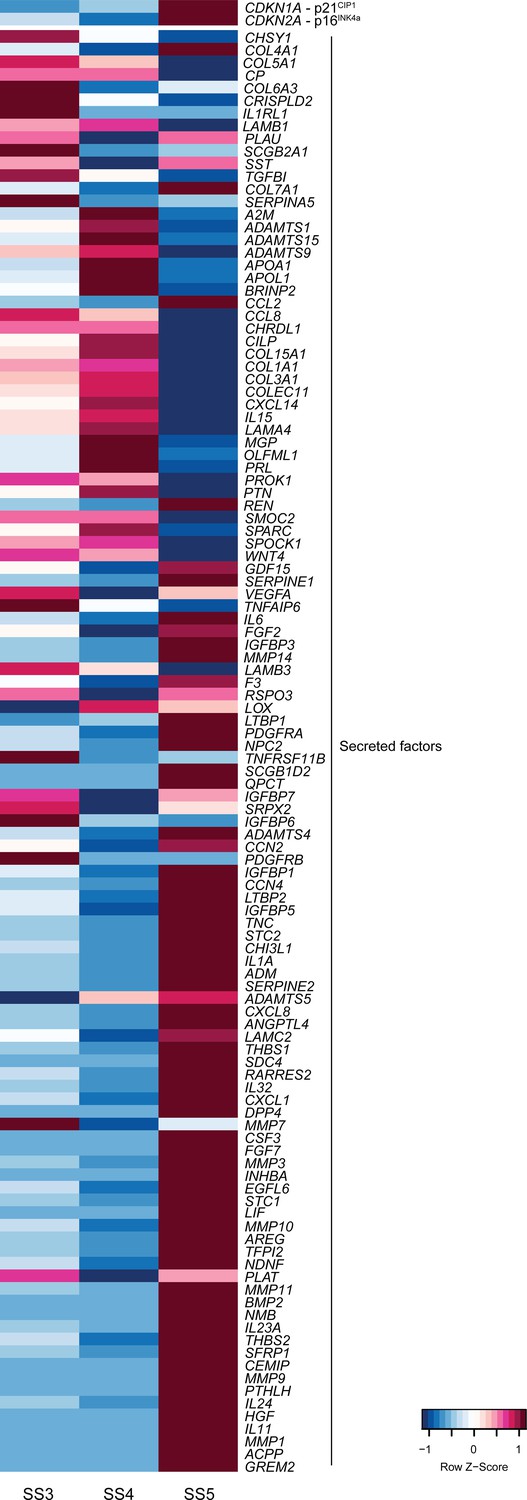
Heatmap showing relative expression (Z-scores) of genes encoding the cyclin-dependent kinase inhibitors p16INK4a and p21CIP1 as well as secretory and SASP-related genes in stromal subpopulations (SS3-5) in decidualizing assembloids.
Supports Figure 3D.
Figure 4
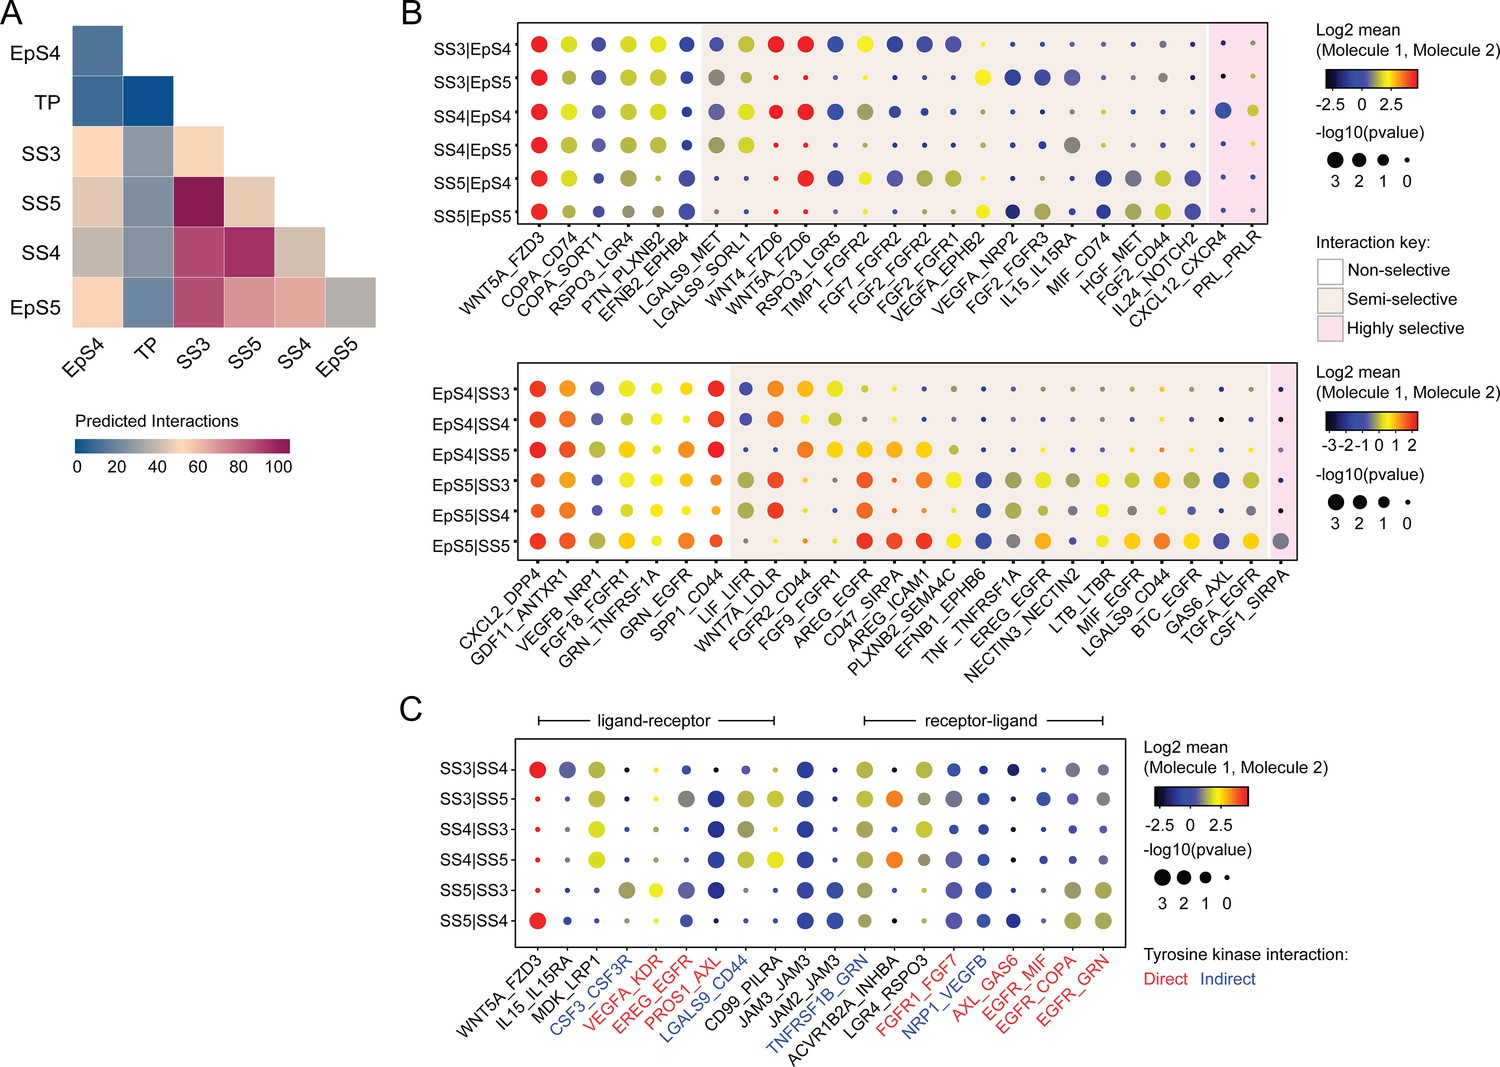
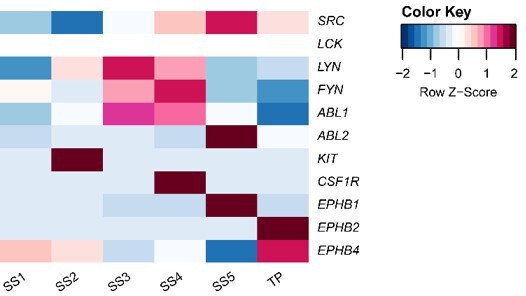
Putative receptor-ligand interactions in decidualizing assembloids.
(A) Heatmap showing the total number of cell-cell interactions predicted by CellPhoneDB between different subpopulations in decidualizing assembloids. (B) Dot plots of representative ligand-receptor interactions between stromal subsets (SS) and epithelial subsets (EpS) (upper panel) and EpS and SS (lower panel) in decidualizing assembloids. Circle size and colour indicate p-value and the means of the average expression value of the interacting molecules, respectively. Shaded boxes were used to group putative interactions by level of selectivity. (C) Dot plot of representative ligand-receptor and receptor-ligand interactions between stromal subpopulations in decidualizing assembloids. Direct and indirect tyrosine kinase interactions are indicated by red and blue labels, respectively. Complete tables of predicted ligand-receptor interactions can be found in Figure 4—source data 1.
-
Figure 4—source data 1
CellPhoneDB prediction of cell-cell interactions.
Ligand-receptor interactions were predicted using CellPhoneDB on counts data from Seurat v3.
- https://cdn.elifesciences.org/articles/69603/elife-69603-fig4-data1-v2.xlsx
Figure 5
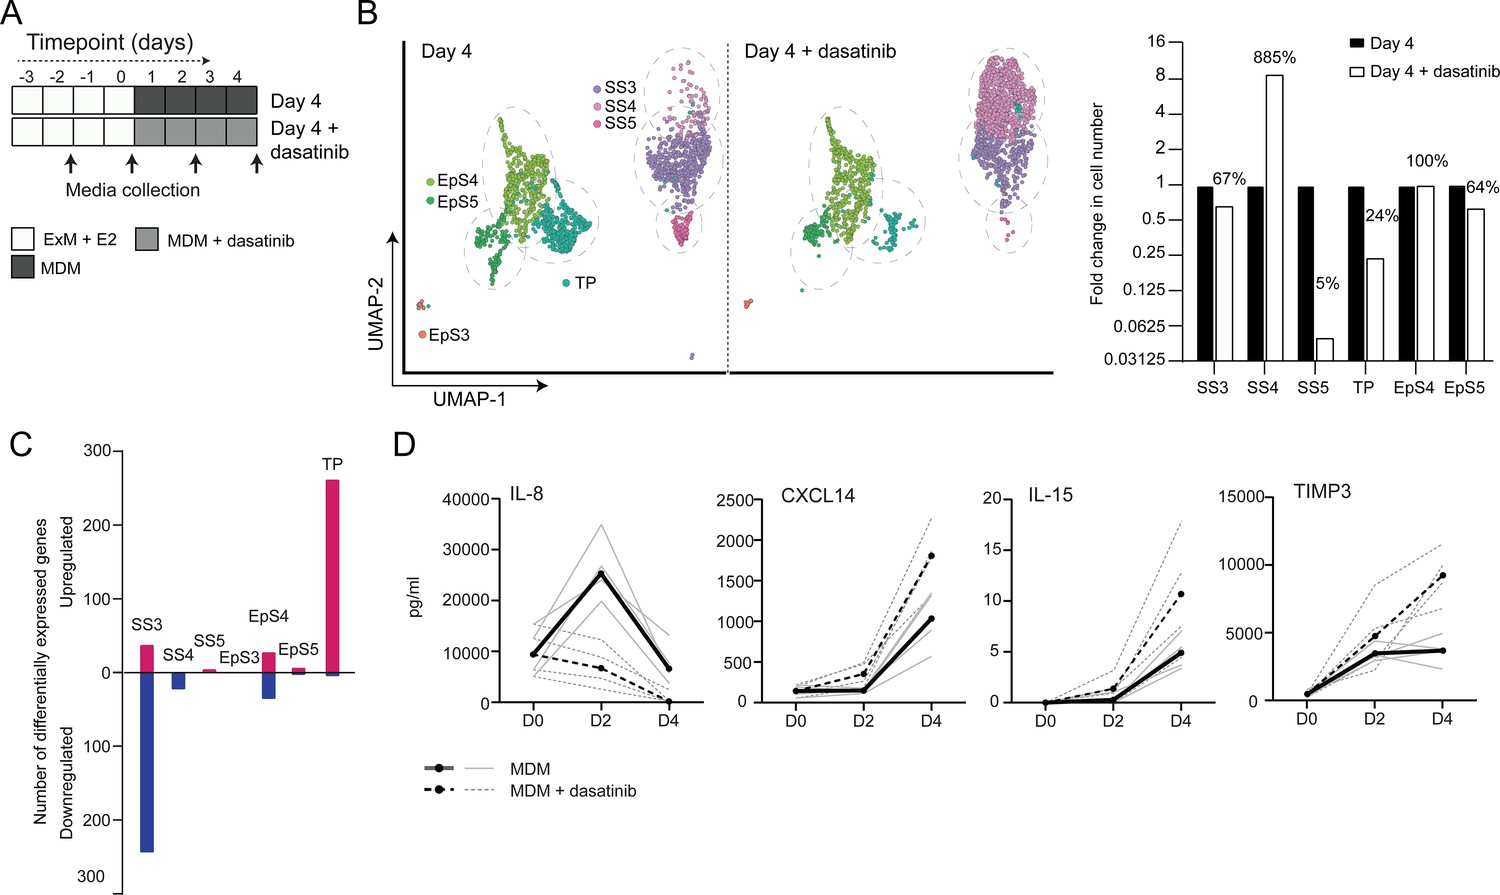
Tyrosine kinase-dependent stress responses determine the fate of decidual cells.
(A) Schematic overview of experimental design. ExM: expansion medium; MDM: minimal differentiation medium. (B) Uniform Manifold Approximation and Projection (UMAP) visualization (left panel) and relative proportions (right panel) of subpopulations in endometrial assembloid decidualized in the presence or absence of dasatinib. (C) Number of differentially expressed genes (DEGs) in each subpopulation in response to dasatinib pre-treatment. (D) Secreted levels of CXCL8 and decidual cell factors in spent medium from assembloids treated with or without dasatinib. Secreted levels in individual assembloids established from four different endometrial assembloids decidualized with or without dasatinib are shown by dotted and solid lines, respectively. Full lists of DEGs and associated GO analysis can be found in Figure 5—source data 1 and Figure 5—source data 2, respectively. Data used in (D) are available in Figure 5—source data 3.
-
Figure 5—source data 1
Differentially expressed genes for day 4 populations treated with and without dasatinib.
Specified pairwise comparisons were generated in Seurat v3 using FindMarkers. Supports Figure 5C.
- https://cdn.elifesciences.org/articles/69603/elife-69603-fig5-data1-v2.xlsx
-
Figure 5—source data 2
GO analysis for day 4 populations treated with and without dasatinib.
- https://cdn.elifesciences.org/articles/69603/elife-69603-fig5-data2-v2.xlsx
-
Figure 5—source data 3
ELISA data.
Secreted levels of key senescent (CXCL8) and decidual stromal cell markers (CXCL14, IL-15, TIMP3) (pg/ml) were examined by ELISA in spent medium from assembloids treated with or without dasatinib. Supports Figure 5D.
- https://cdn.elifesciences.org/articles/69603/elife-69603-fig5-data3-v2.xlsx
Figure 6 with 2 supplements
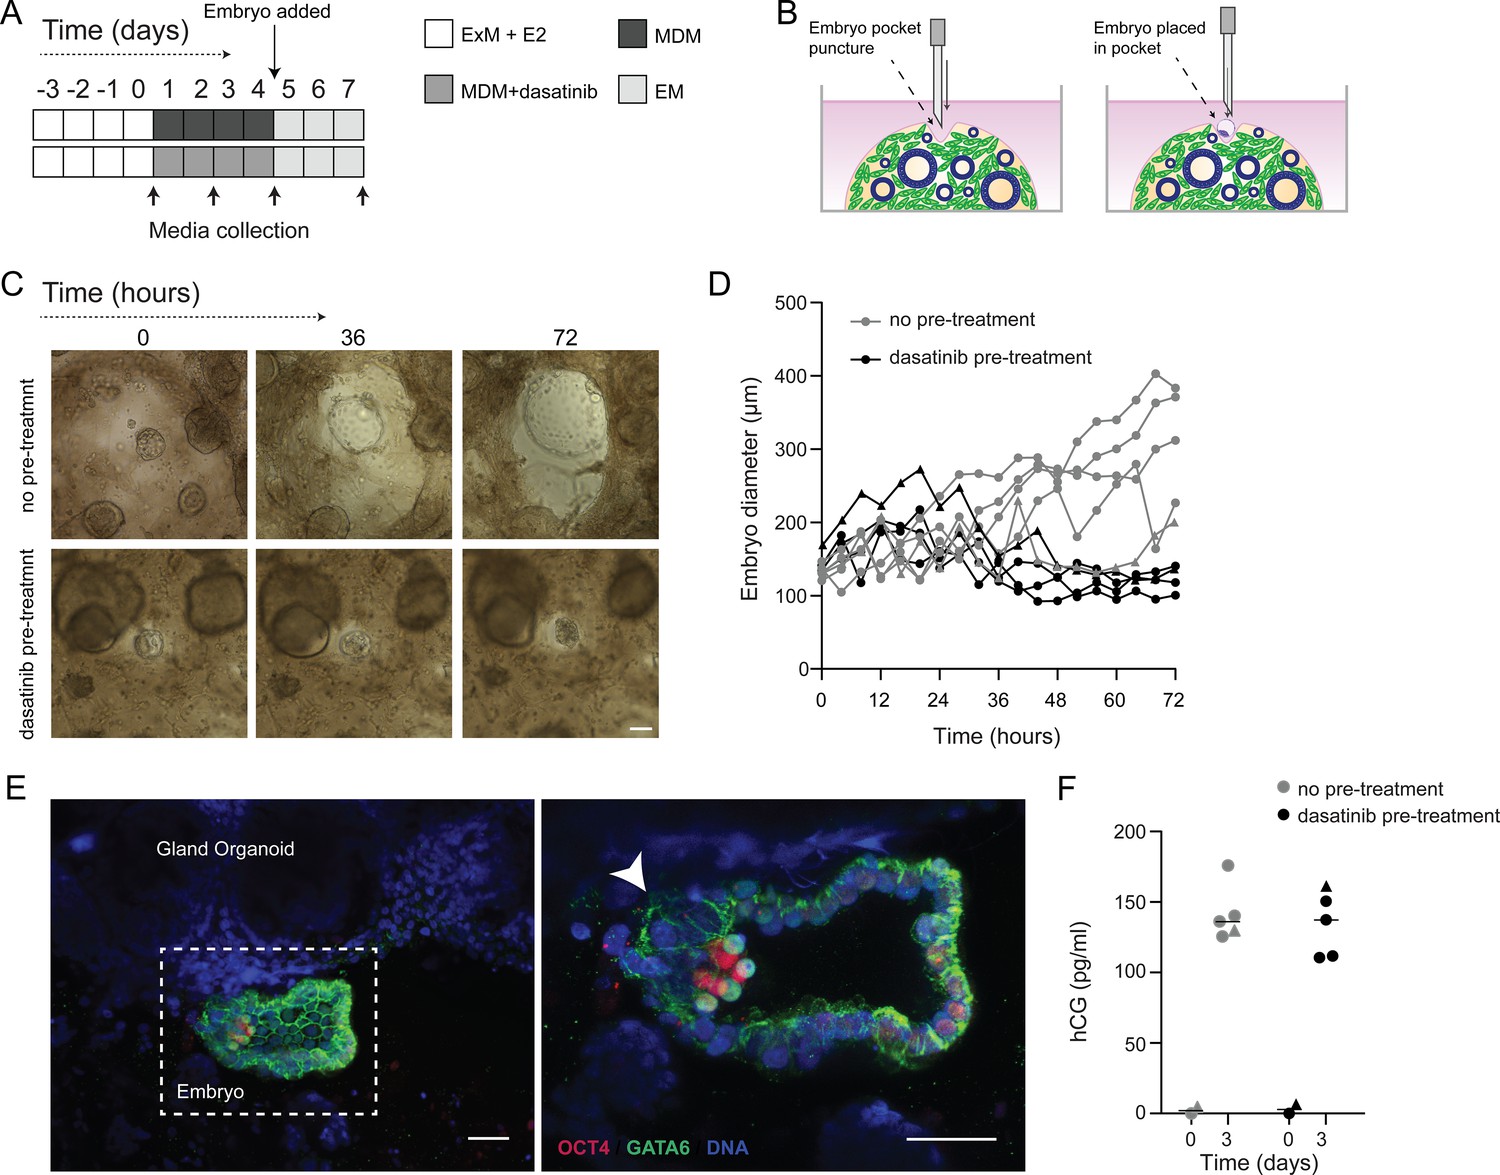
Impact of decidual senescence in assembloids on co-cultured human blastocysts.
(A) Diagram showing experimental design. ExM: expansion medium; MDM: minimal differentiation medium; EM: embryo medium. (B) Schematic drawing of co-culture method. (C) Representative time-lapse images of blastocysts embedded in assembloids following decidualization for 96 hr in the absence (upper panels) or presence (lower panels) of dasatinib. Scale bar = 100 µm. See also Figure 6—figure supplement 1. (D) Embryo diameters (µm) measured over 72 hr when embedded in decidualizing assembloids pre-treated with or without dasatinib. (E) OCT4 and GATA6 immunofluorescence marking the epiblast and hypoblast, respectively, in a blastocyst attached by proliferating polar trophectoderm (arrowhead) to decidual assembloids. Scale bar = 50 µM. (F) Secreted levels of human chorionic gonadotropin (hCG) in blastocyst-endometrial assembloid co-cultures. Individual embryo diameter measurements for biological replicates in (D) are available in Figure 6—source data 1. Individual ELISA data used in (F) are available in Figure 6—source data 2.
-
Figure 6—source data 1
Embryo expansion measurement.
Embryo diameters were measured over 72 hr co-culture with assembloids previously differentiated with or without dasatinib. Images were captured using time-lapse imaging. Supports Figure 6D.
- https://cdn.elifesciences.org/articles/69603/elife-69603-fig6-data1-v2.xlsx
-
Figure 6—source data 2
Embryo human chorionic gonadotropin (hCG) secretion.
Secreted levels of hCG (pg/ml) by embryos in co-culture with assembloids previously differentiated with or without dasatinib were examined by ELISA in spent medium. Supports Figure 6F.
- https://cdn.elifesciences.org/articles/69603/elife-69603-fig6-data2-v2.xlsx
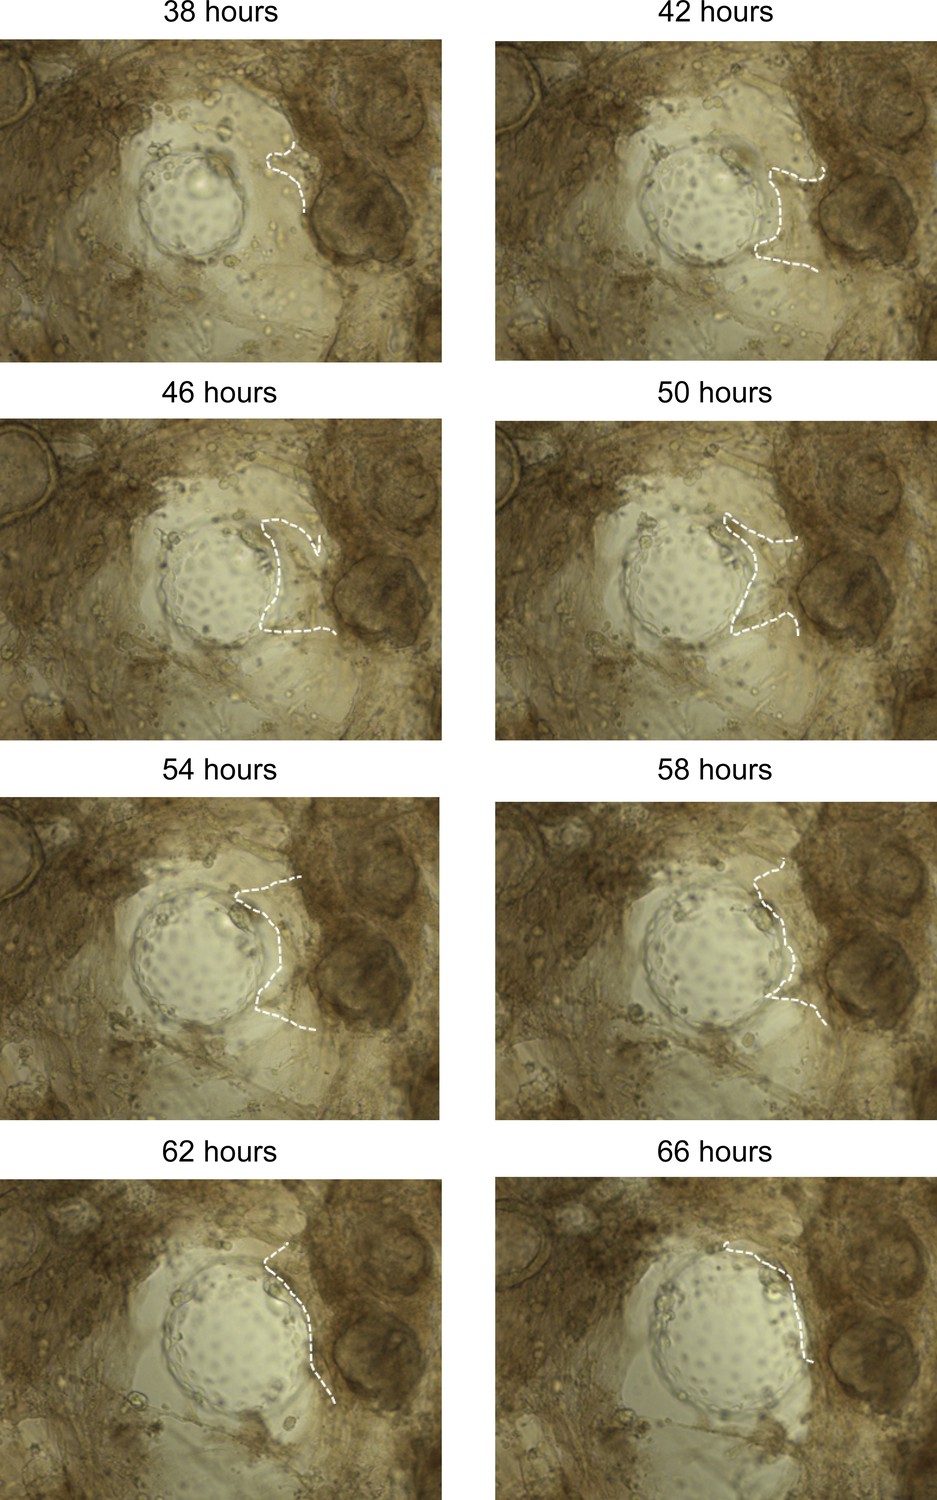
Figure 6—figure supplement 1
Stromal migration towards the polar trophectoderm of expanding embryos in differentiated endometrial assembloids.
Images were captured by time-lapse microscopy and annotated to indicate the frontier of the stromal egress (white dotted line).
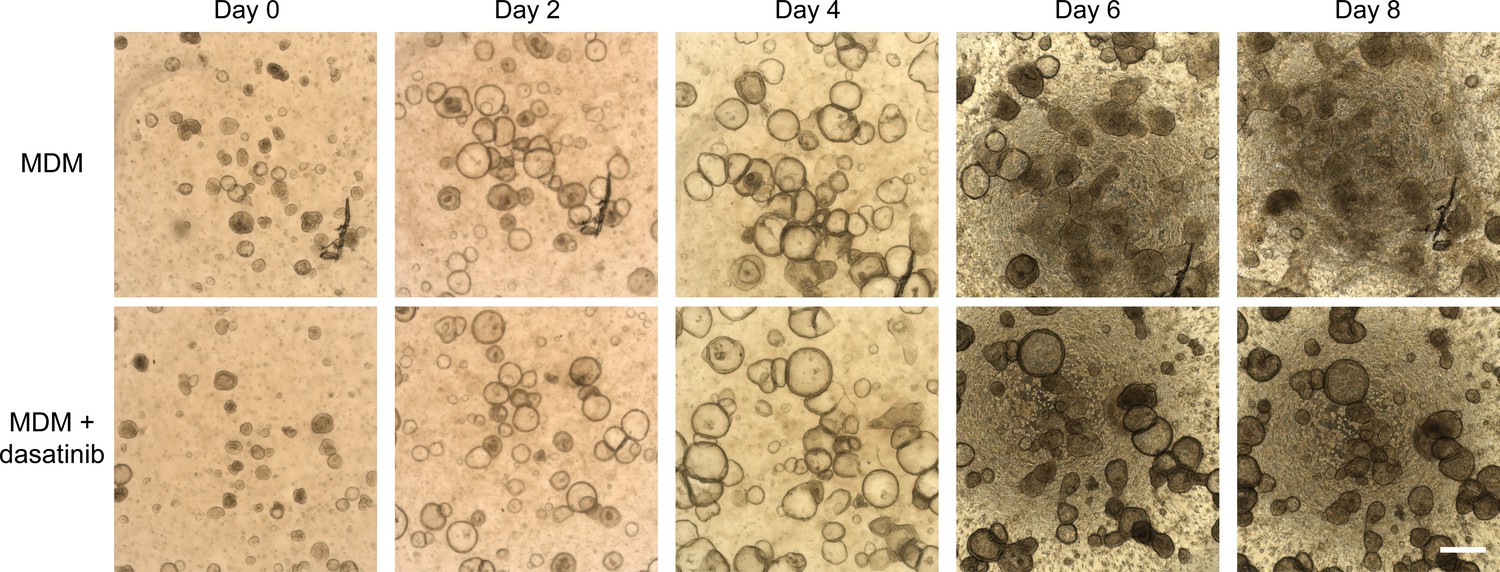
Figure 6—figure supplement 2
Dasatinib prevents disintegration of decidualizing assembloids.
Time-course images of endometrial assembloids in minimal differentiation medium (MDM) supplemented or not with dasatinib. Scale bar = 50 µm. Supports Figure 6C.
Author response image 1
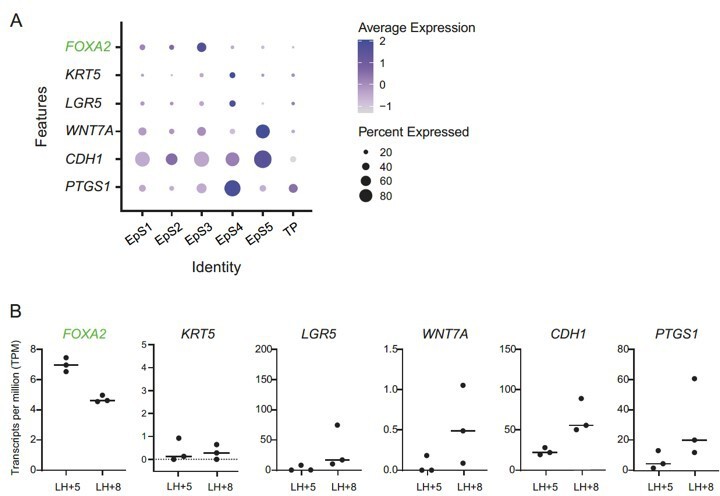
(A) Expression of FOXA2, a glandular epithelial marker (green font), and putative luminal epithelial marker genes (black font) in assembloid subpopulations.
Dot size indicates the proportion of cells expressing the marker, while colour indicates the level of expression. Note that none of the cell populations express a compelling luminal epithelial marker gene signature. (B) Expression of the same markers in laser-capture micro-dissected endometrial glands in vivo, obtained during the early- and mid-luteal phase (LH+5 and LH+8, respectively).
Author response image 2
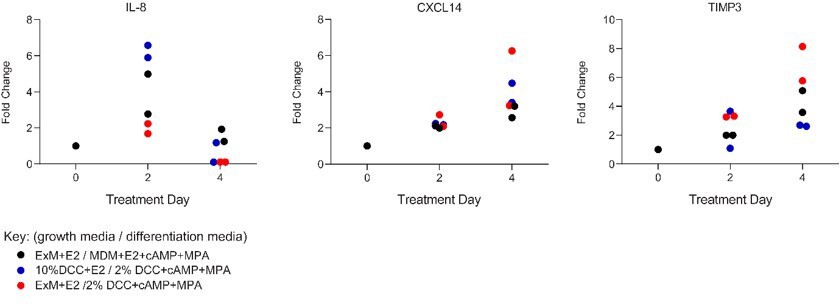
Comparison of secreted levels of IL-8, CXCL14 and TIMP3 in two independent primary endometrial stromal cells maintained in standard 2D cultures in response to standard growth medium (10% DCC-DMEM+E2) or assembloid expansion medium (ExM+E2) and standard differentiation medium (2% DCC-DMEM+cAMP+MPA) or assembloid differentiation medium (MDM+E2+cAMP+MPA), as indicated.
Author response image 3
Videos
Video 1
Time-lapse microscopy of a human blastocyst embedded in a decidualizing assembloid.
Representative video of a human blastocyst embedded in an assembloid, as imaged by time-lapse microscopy over 72 hr with images captured every 60 min.
Video 2
Time-lapse microscopy of a human blastocyst embedded in a decidualizing assembloid pre-treated with dasatinib.
Representative video of a human blastocyst embedded in an assembloid which had been pre-treated with dasatinib, as imaged by time-lapse microscopy over 72 hr with images captured every 60 min.
Additional files
-
Supplementary file 1
Supplementary tables 1-3.
Table 1. Culture media composition. Table 2. Patient demographics for endometrial samples. Table 3. Antibody details for immunofluorescence labelling.
- https://cdn.elifesciences.org/articles/69603/elife-69603-supp1-v2.xlsx
-
Transparent reporting form
- https://cdn.elifesciences.org/articles/69603/elife-69603-transrepform1-v2.docx
Download links
A two-part list of links to download the article, or parts of the article, in various formats.
Downloads (link to download the article as PDF)
Open citations (links to open the citations from this article in various online reference manager services)
Cite this article (links to download the citations from this article in formats compatible with various reference manager tools)
Modelling the impact of decidual senescence on embryo implantation in human endometrial assembloids
eLife 10:e69603.
https://doi.org/10.7554/eLife.69603


