In situ cryo-ET structure of phycobilisome–photosystem II supercomplex from red alga
- Key Laboratory for Protein Sciences of Ministry of Education, Beijing Advanced Innovation Center for Structural Biology & Frontier Research Center for Biological Structure, School of Life Sciences, Tsinghua University, China
- State Key Laboratory of Membrane Biology, Beijing Advanced Innovation Center for Structural Biology & Frontier Research Center for Biological Structure, School of Life Sciences, Tsinghua University, China
- Department of Biology, Southern University of Science and Technology, China
Figures
Figure 1 with 1 supplement
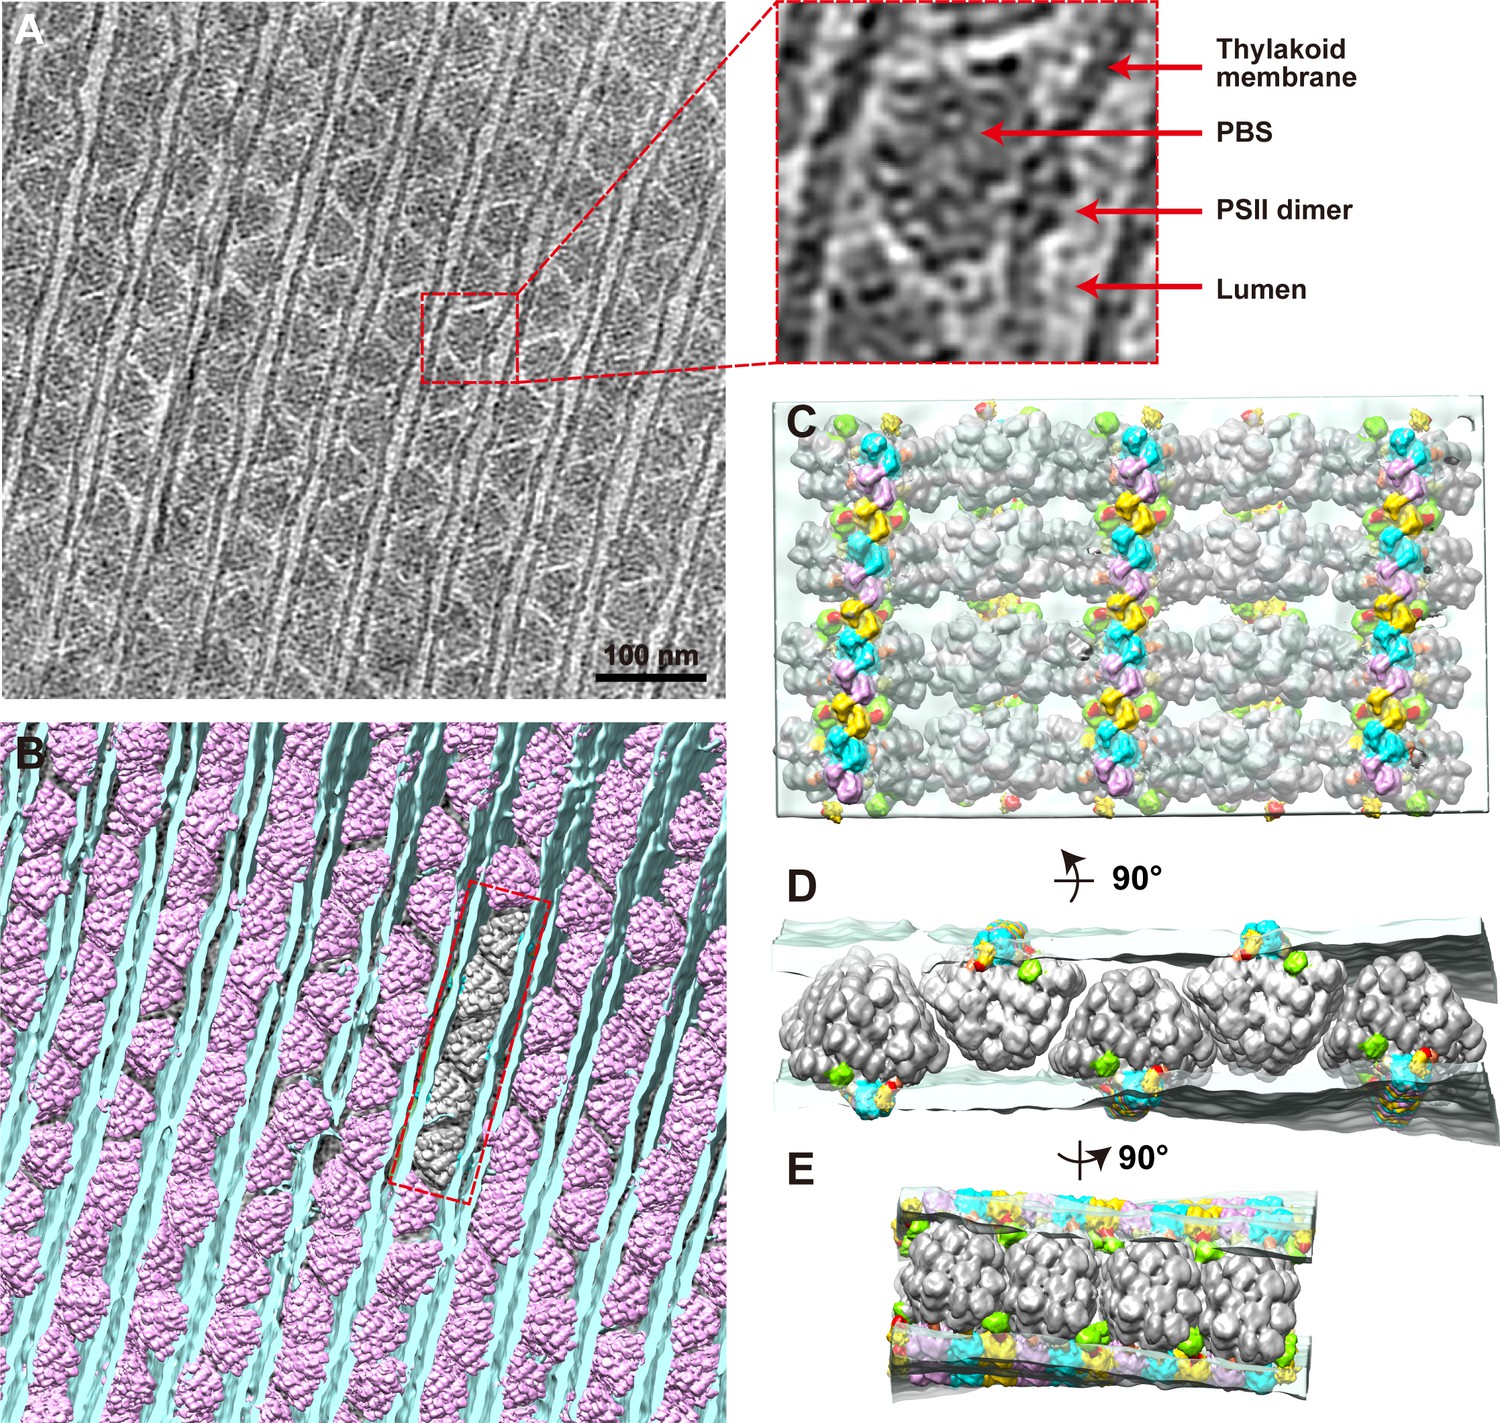
Organization of PBS–PSII supercomplexes on the thylakoid membrane.
(A) Representative tomogram slice in cross-section view. The box represents magnified details of PBS, a PSII dimer, the thylakoid membrane, and the lumen. (B) Spatial mapping of the PBS–PSII supercomplex (purple) and 3D segmentation of the thylakoid membrane (blue). (C–E) The magnified three presents perpendicular views of the organization of PBS–PSII in the thylakoid membrane boxed in (B). Thylakoid membrane, light blue; PBS, gray; Lateral hexamer, green; A1–A2 pair, purple; B1–B2 pair, cyan; C1–C2 pair, yellow; connector 1, coral; connector 2, khaki; connector 3, red.
Figure 1—figure supplement 1
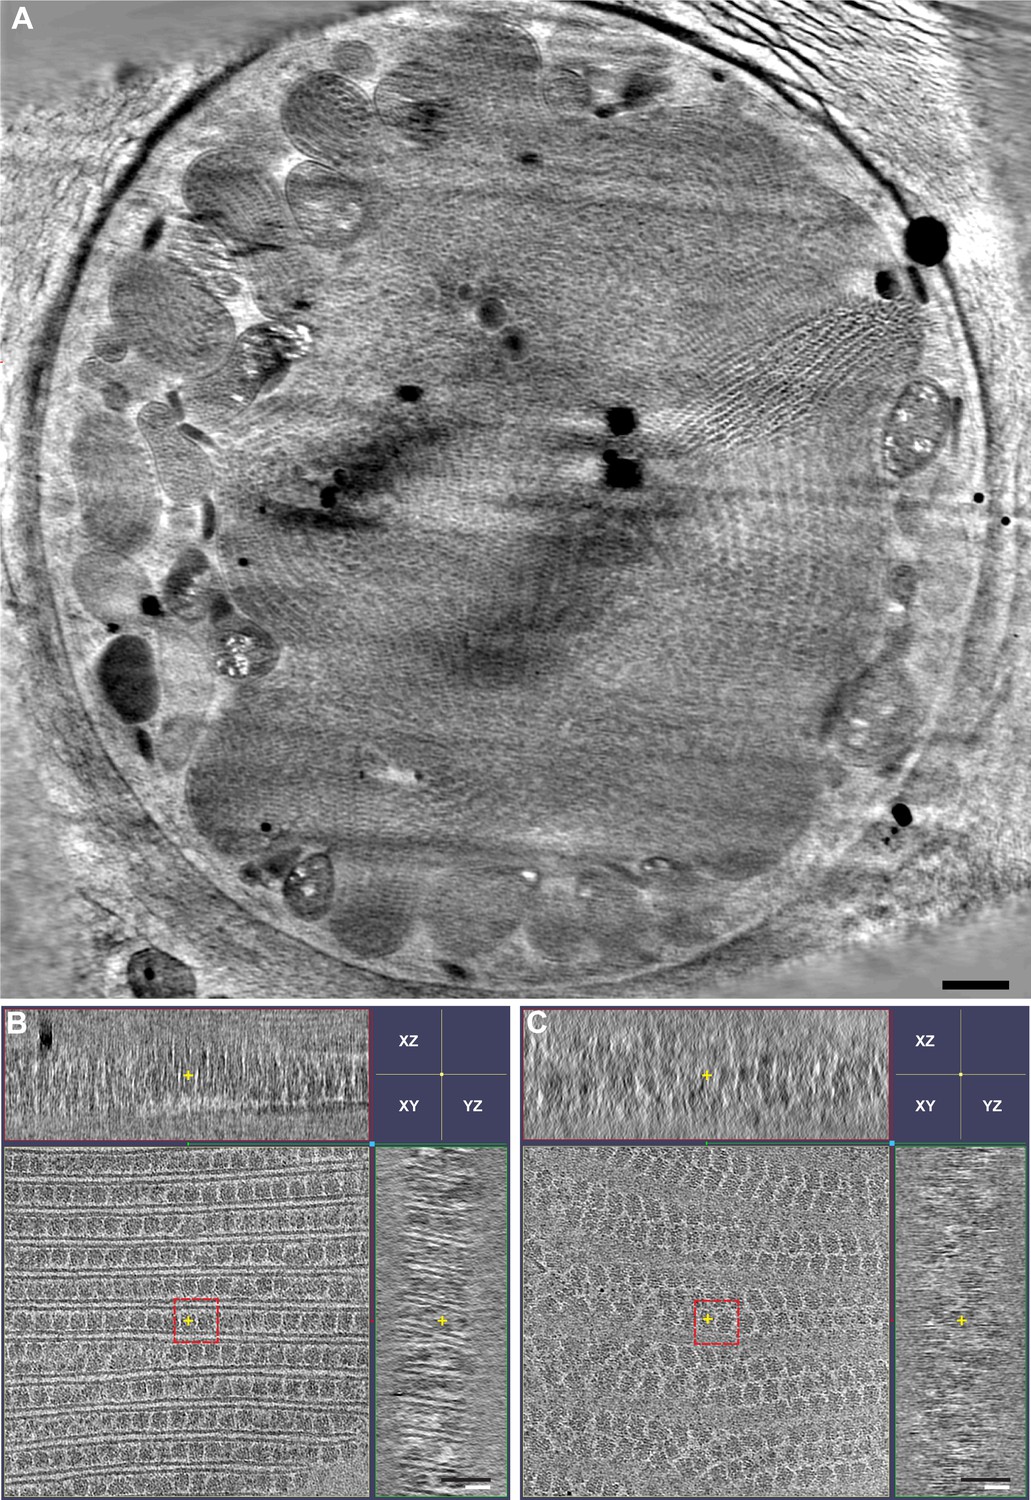
Tomographic slice of the whole cell and the PBS–PSII supercomplexes on the thylakoid membrane.
(A) Representative cross-section view of the whole cell. The PBS–PSII supercomplexes are neatly packed in most regions, while some PBS–PSII supercomplexes are randomly distributed. (B) Representative tomogram XYZ plane in cross-section view shows the longitudinal view of PBS–PSII supercomplex arrays. (C) Representative tomogram XYZ plane in cross-section view shows the grazing view of PBS–PSII supercomplex arrays. The red dashed boxes in (B) and (C) indicate the double PBS–PSII particles used for sub-tomogram averaging. The yellow cross indicates the center of XYZ plane. The scale bars indicate 500 nm in (A), 50 nm in (B) and (C).
Figure 2 with 5 supplements
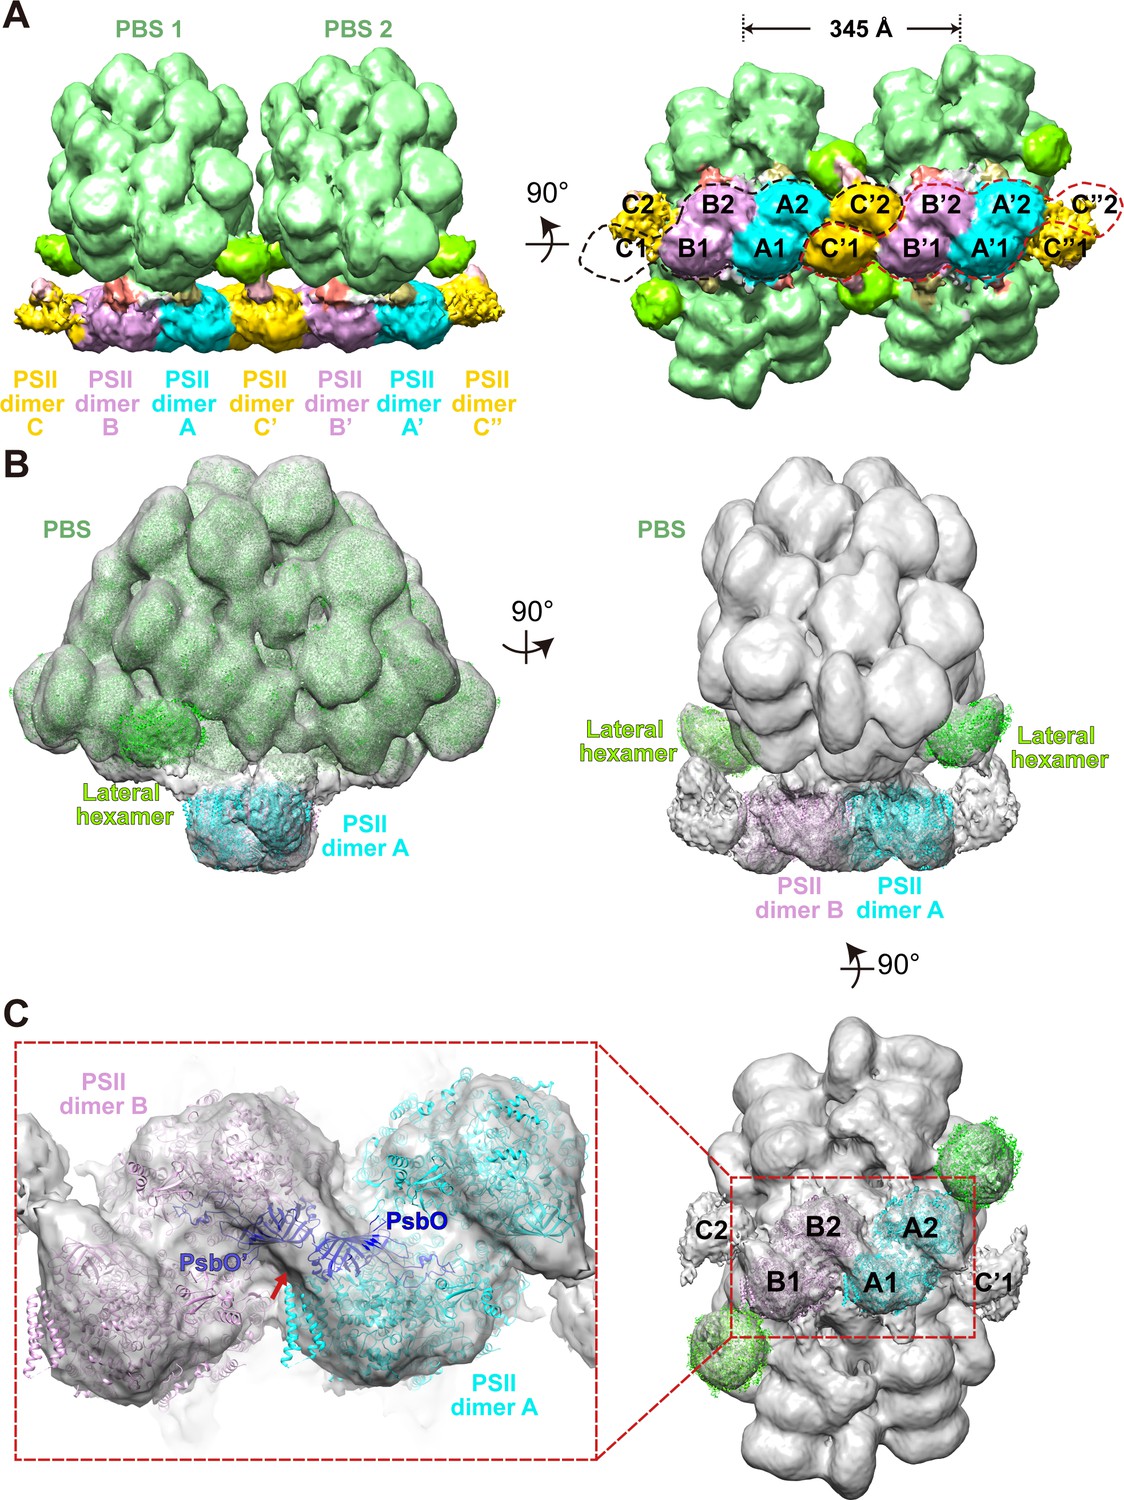
Overview of the PBS–PSII and double PBS–PSII structures.
(A) The density map of double PBS–PSII structures at a resolution of 15.6 Å, presented in two perpendicular views. The center-to-center distance of two adjacent PBSs is approximately 345 Å. Two random circles indicated by black or red dashed lines mark the six PSII monomers binding with each of the two PBSs. PBS1 is associated with PSII monomer A1, A2. B1, B2, C1, and C'2. PBS2 connects with A'1, A'2, B'1, B'2, C'2, and C’’1. The surface threshold is 0.09. (B) The density map of the PBS–PSII supercomplex at a resolution of 14.3 Å fitted with the single-particle model of PBS (EMDB code EMD-9976, PDB code 6 KGX) and X-ray structure of PSII (PDB code 4YUU), presented in two perpendicular views. The lateral hexamer was fitted with the single-particle model of the Rod a distal PE hexamer. The surface threshold is 0.059. (C) The magnified image shows that the two PsbO subunits bind with each other at the interface of the adjacent PSII dimers (Inset). A map of PSII dimers A and B, segmented from (B) with the same surface threshold level. The arrow indicates the binding site.
Figure 2—figure supplement 1
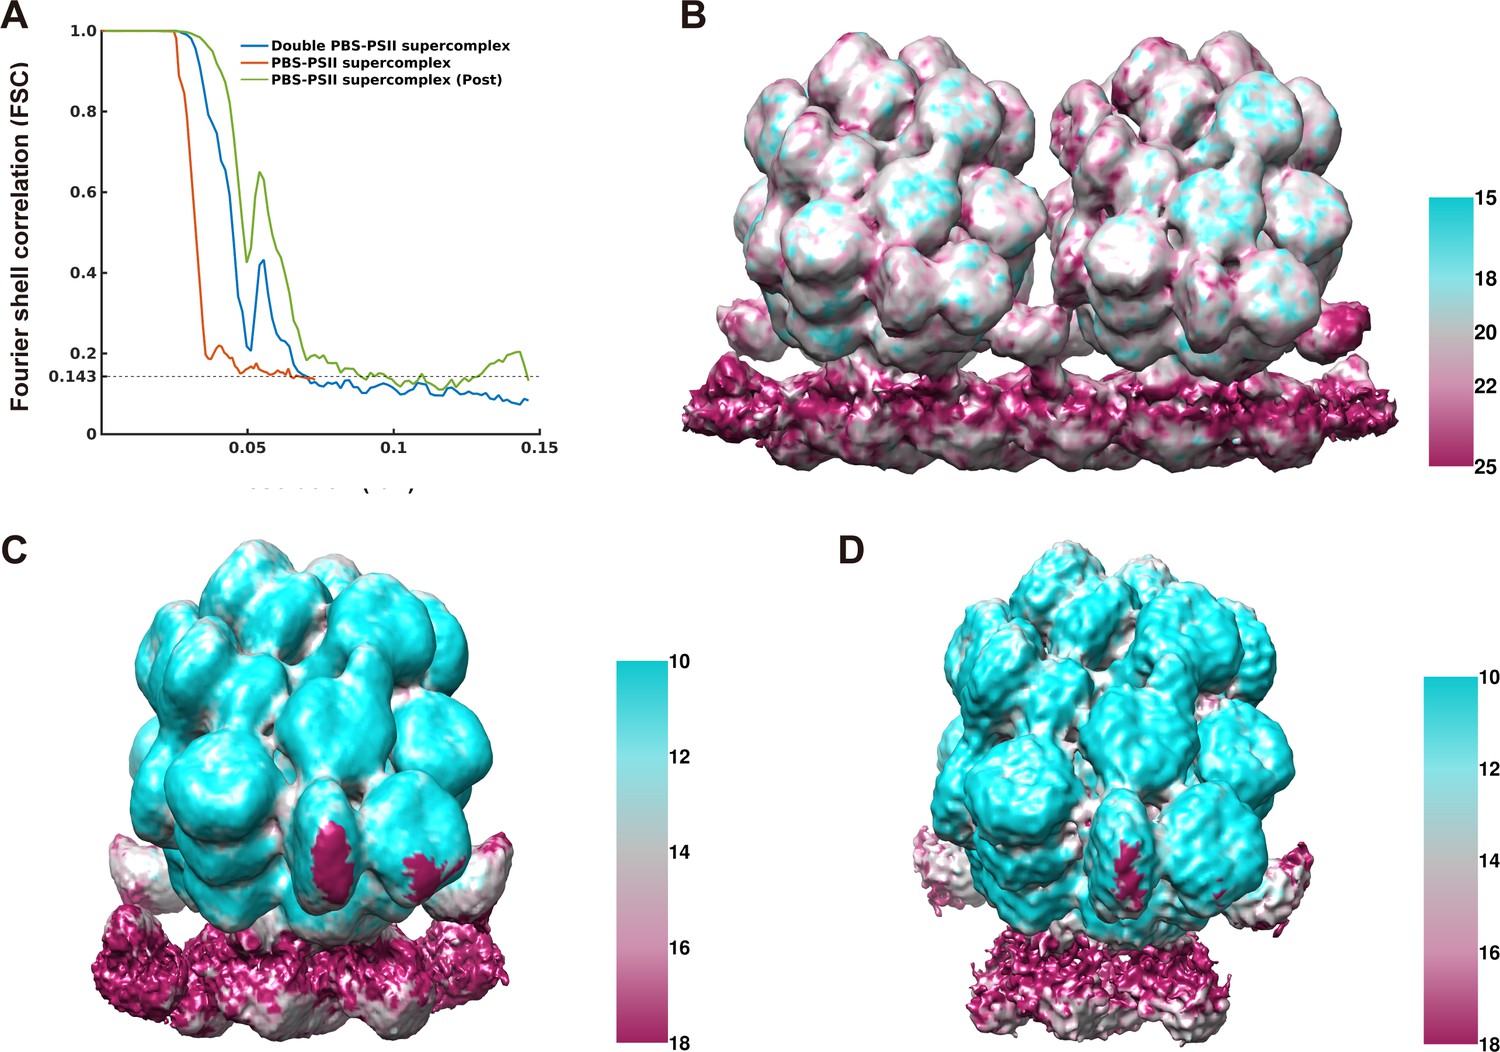
Resolution estimation and the ResMap analysis of the density maps for the double PBS–PSII supercomplex and the PBS–PSII supercomplex.
(A) The ‘gold-standard’ Fourier shell correlation (FSC) curves calculated between two halves of datasets for the double PBS–PSII supercomplex (15.6 Å), the PBS–PSII supercomplex (14.3 Å), and the PBS–PSII supercomplex after post-processing (13.2 Å). Resolution was estimated at FSC = 0.143 (Indicated with the dashed). (B) Local resolution map of the double PBS–PSII supercomplex map estimated by ResMap using the color scheme shown in the right panel. (C) Local resolution map of the PBS–PSII supercomplex map. (D) Local resolution map of the PBS–PSII supercomplex after post-processing.
Figure 2—figure supplement 2
Sub-tomogram structural analysis of the PBS–PSII supercomplex.
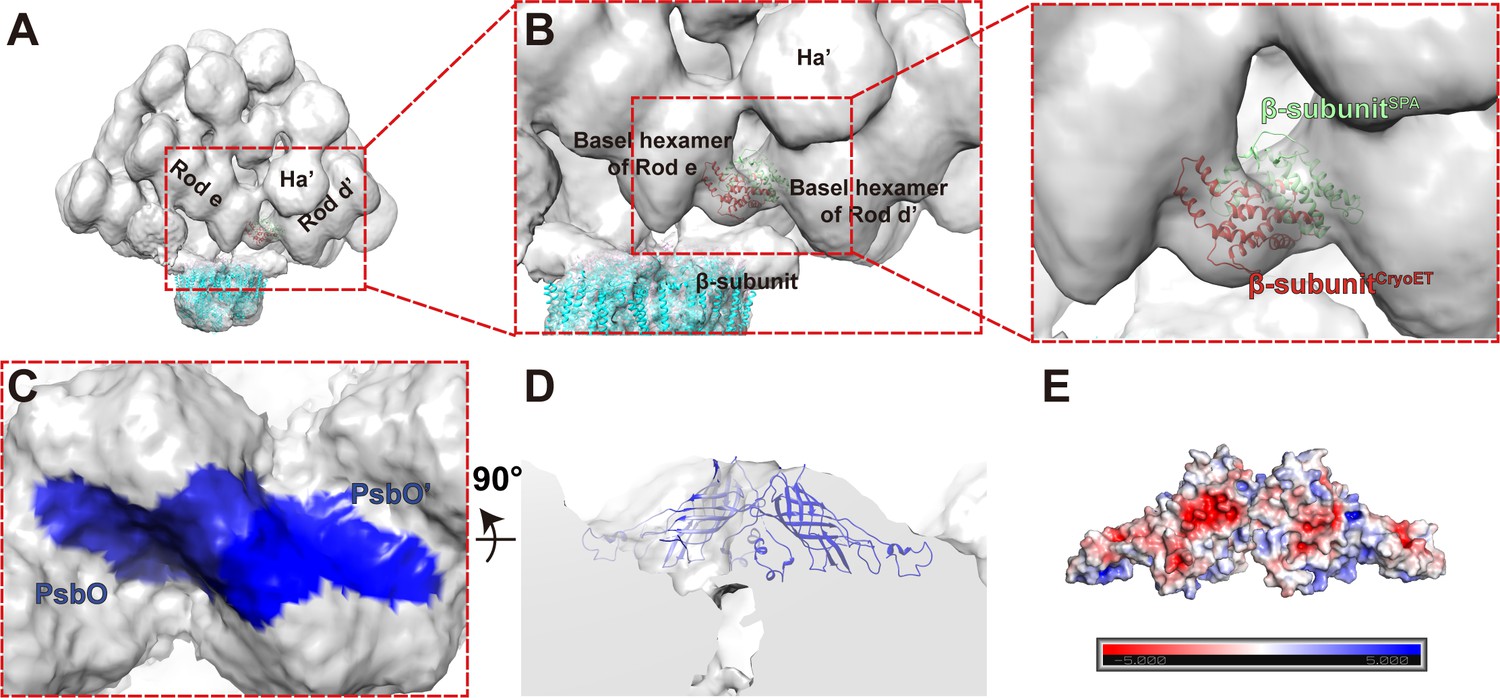
(A, B) Conformational change of β-subunit interspersed between Rod e and Rod d'. β-subunitSPA in green is the model built with the map of single particle analysis, and β-subunitCryoET in red is the fitting model of the sub-tomogram averaging map. The surface threshold of the sub-tomogram map is 0.065. (C) The magnified bottom view of PSII dimers A and B in the PBS–PSII supercomplex (Surface threshold, 0.059) shows that the two adjacent PsbO subunits (colored in blue) bind with each other. (D) The fitting result of PsbO and PsbO’ shown in the perpendicular view of (C). (E) The electrostatic analysis of the two connecting PsbO subunits. Electrostatic surface potential was calculated with PyMol/APBS and contoured at ±5 kT/e.
Figure 2—figure supplement 3
Sub-tomogram map analysis of the double PBS–PSII supercomplex, the PBS–PSII supercomplex, and the PBS–PSII supercomplex with post-processing.
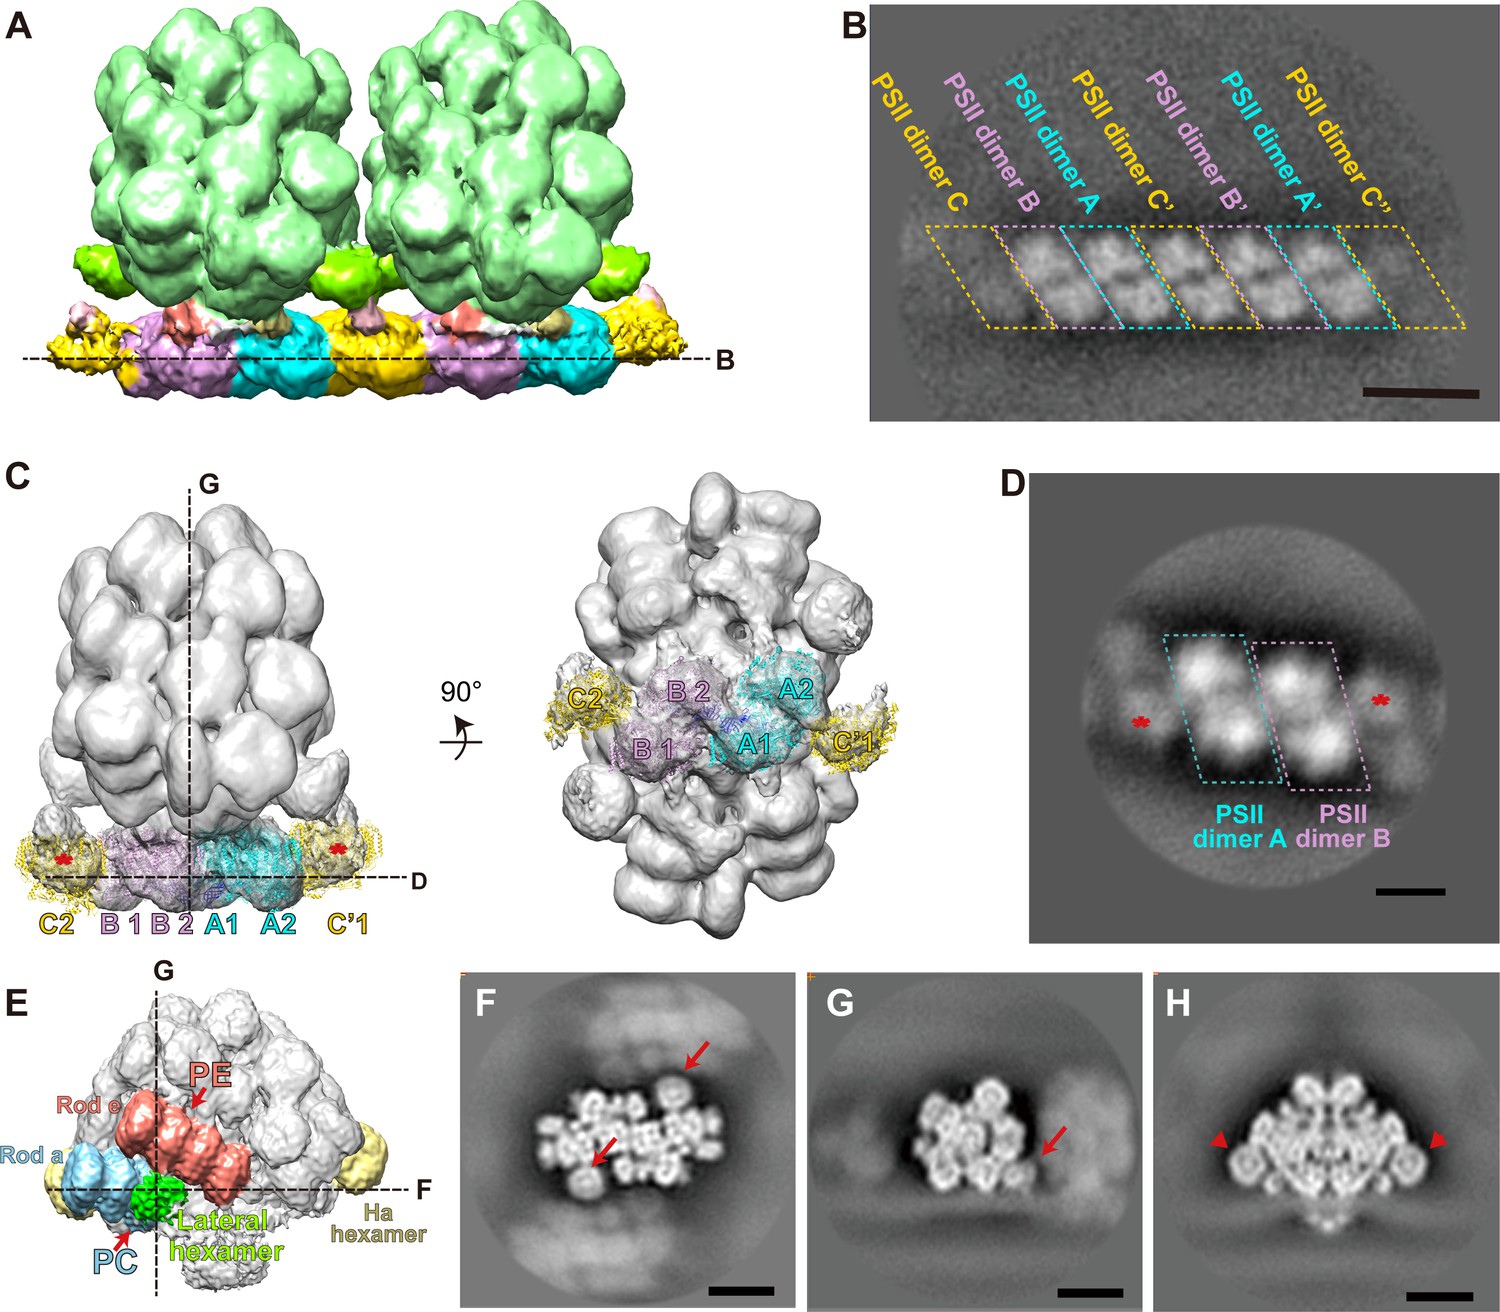
(A) Overall structure of the double PBS–PSII supercomplex (surface threshold, 0.09). (B) Slice view shows the row of PSII dimers indicated in (A). (C) The overall structure of the PBS–PSII supercomplex (surface threshold, 0.065). The asterisks represent PSII dimer C densities. (D) Slice view shows the luminal protrusions of PSII dimer row indicated in (C), which indicates that PSII dimer C of the PBS–PSII supercomplex connects with PSII dimers A and B in the same way that of the double PBS–PSII supercomplex. (E) Overall structure of the PBS–PSII supercomplex (surface threshold, 0.21) shows the lateral hexamers connect with the bottom PC hexamer of Rod a and the second PE hexamer of Rod e. (F) Top slice view of the PBS–PSII supercomplex shows the lateral hexamers (indicated with arrows) are round discs with stronger densities in the center. (G) Side slice view of (F). (H) The other perpendicular slice view of (F) shows the Ha hexamers indicated with arrowheads have a ring-like structure consisting of (αβ)3 trimers and a central cavity filled with the N-terminal Pfam00427 domain of linker proteins, which resemble the lateral hexamers in (F). Scale bars, 20 nm.
Figure 2—figure supplement 4
PSII sequence analysis of Porphyridium purpureum and Cyanidium caldarium.
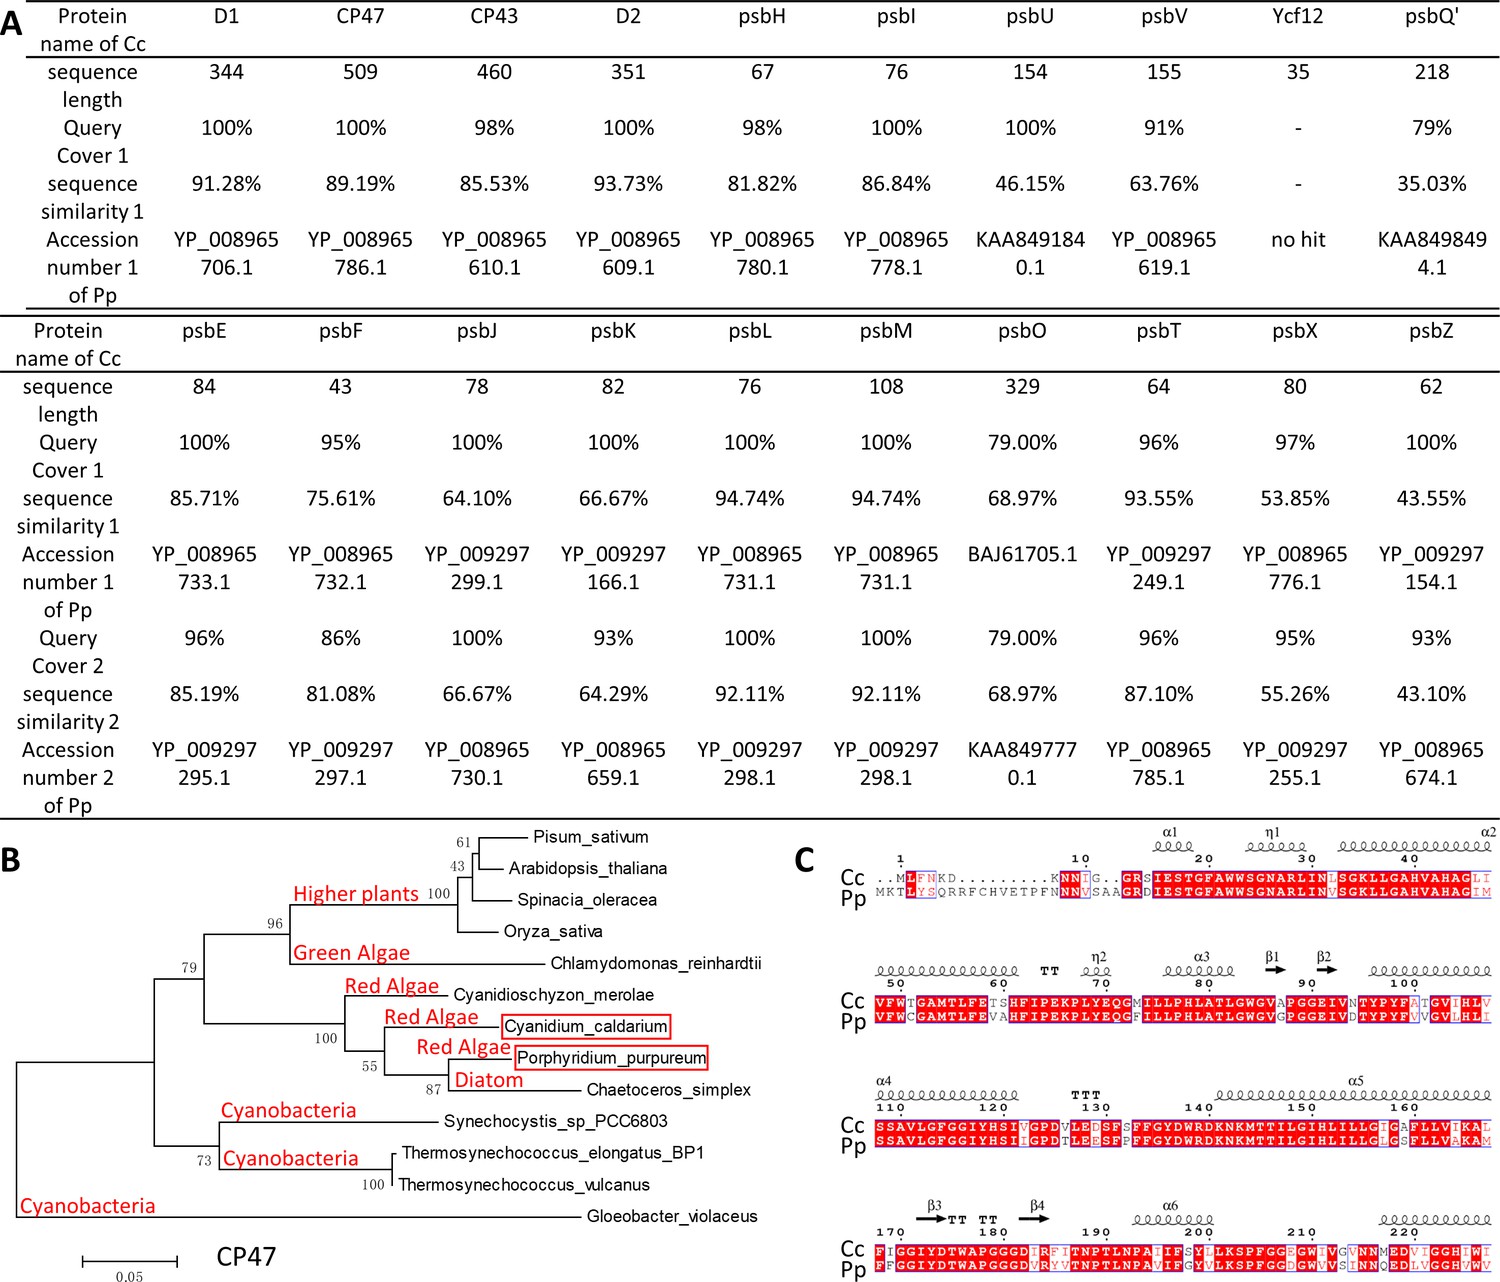
(A) Sequence homogeneity alignment of each subunit of PSII between P. purpureum (Pp) and C. caldarium (Cc) indicates that most of the subunits are highly conserved. (B) Maximum likelihood (ML) phylogenetic analysis of cyanobacteria, red algae, diatom, green algae, and higher plants based on CP47 (PsbB) protein of PSII. The PSII structures of all the analyzed organisms have been resolved (PDB ID: 6KAD, 5XNM, 5MDX, 1VYK, 6AE9, 4YUU, 5OJ3, 5ZZN, 6JLL, etc.). CP47 of Gloeobacter violaceus is introduced as the outgroup. The software is Mega v5.05 and amino acid substitution model is Jones–Taylor–Thornton model. Bootstrap 1000 is used to compute the consensus tree, and computed distance 0.05 is labeled on the bottom left corner. Red algae Pp and Cc, marked with red rectangle, are more closely related than other phyla, such as cyanobacteria, diatom, green algae, and higher plants. (C) Sequence alignment of the N-terminal CP43 subunit of PSIIs of Pp and Cc.
Figure 2—figure supplement 5
Geometry of PBS and PSIIs.
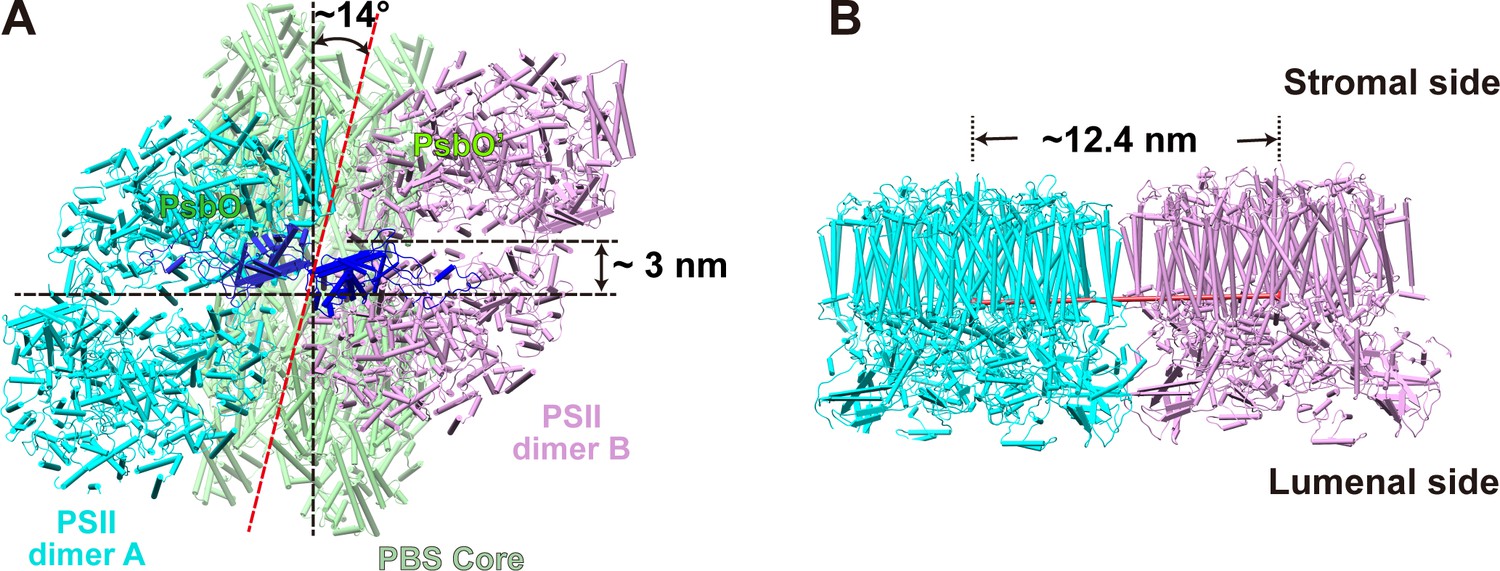
(A) The bottom view of the PBS–PSII supercomplex fitting model shows that the face plane of the PSII dimers A and B rotates approximately 14° along the PBS core plane. The centers of the two PSII dimers shift approximately 3 nm along the plane of PBS core. (B) The side view of the PSII dimers A and B fitting model shows the center-to-center distance between the PSII dimers A and B is approximately 12.4 nm.
Figure 3 with 1 supplement
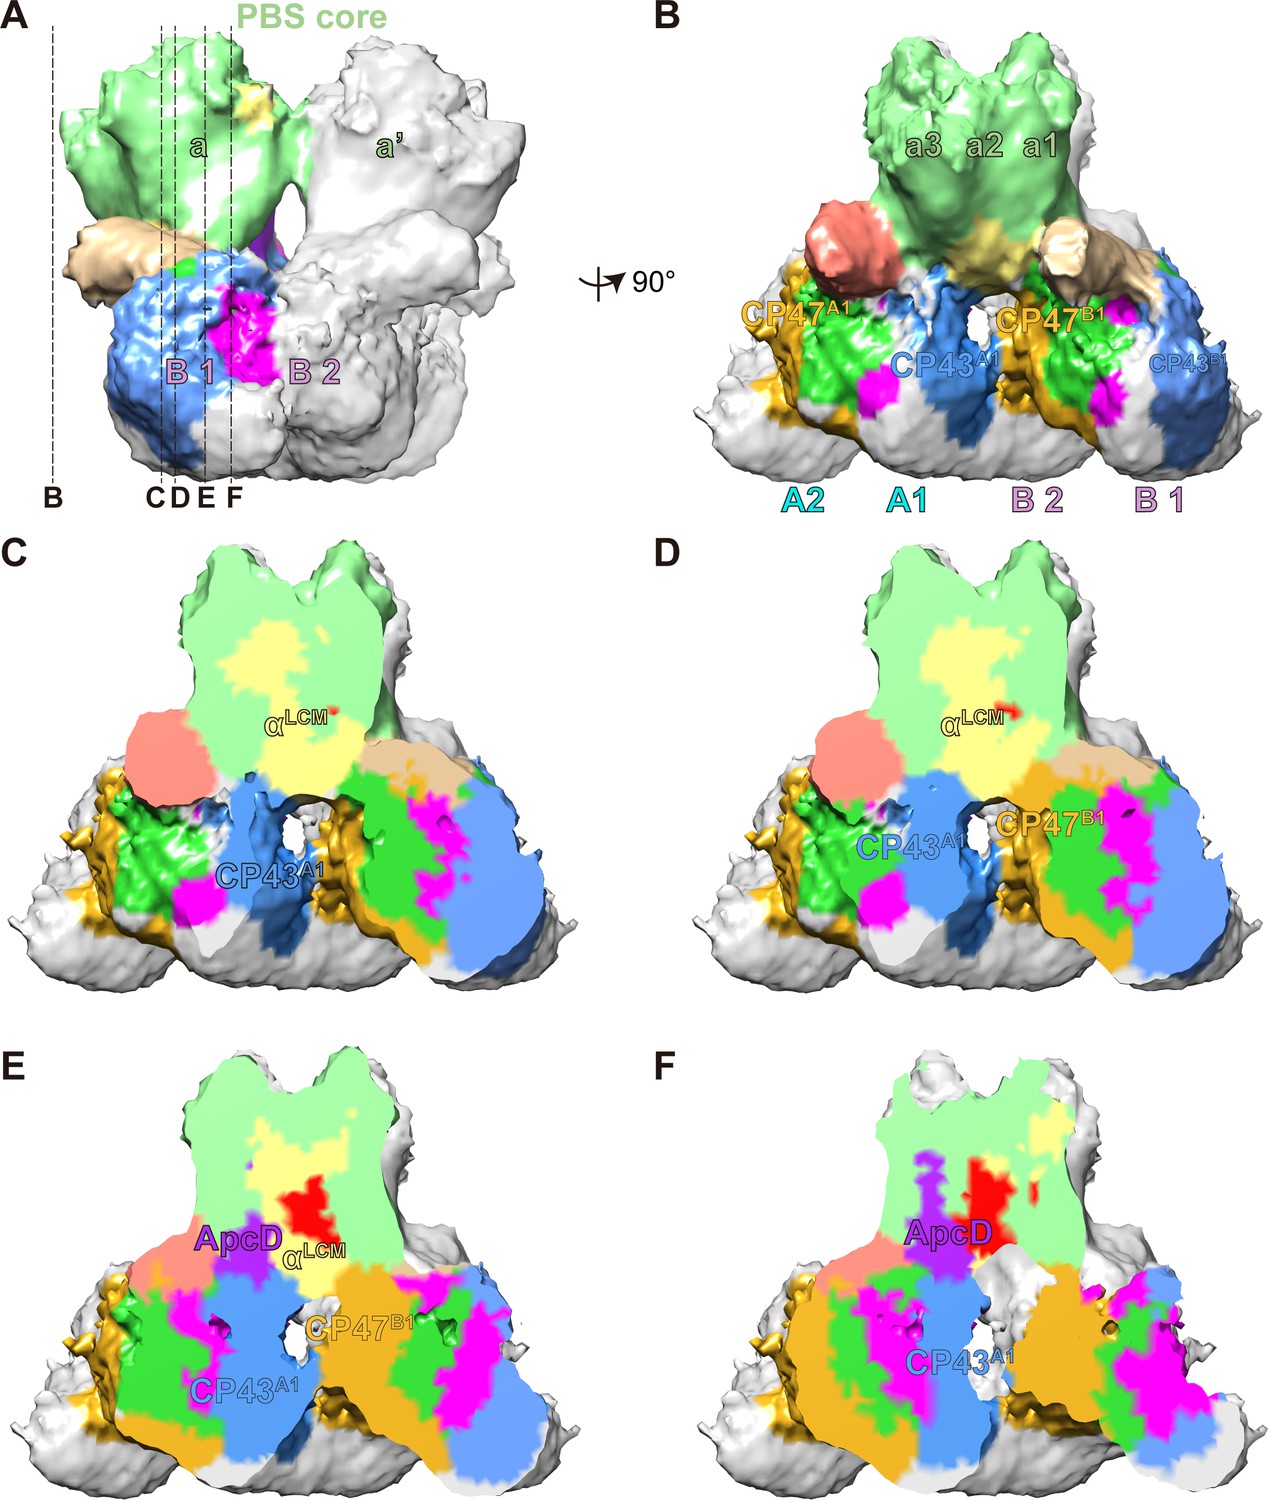
The connections between PBS and PSIIs.
(A, B) A segmentation map of two basal cylinders of the PBS core (labeled as a and a', respectively) and PSII dimers A and B (each monomer is labeled as A1, A2, B1, and B2, respectively). Each basal cylinder consists of three APC trimers, a1, a2, and a3. This map was segmented from the PBS–PSII supercomplex at a surface threshold level of 0.065. (C–F) Surface clip views of the segmented PBS–PSII supercomplex show the details of the interaction between the αLCM, ApcD, and CP43, CP47. The clip planes were indicated in (A). The surface threshold was 0.065. CP43A1, CP43 of PSII dimer A1; CP47B1, CP47 of PSII dimer B1.
Figure 3—figure supplement 1
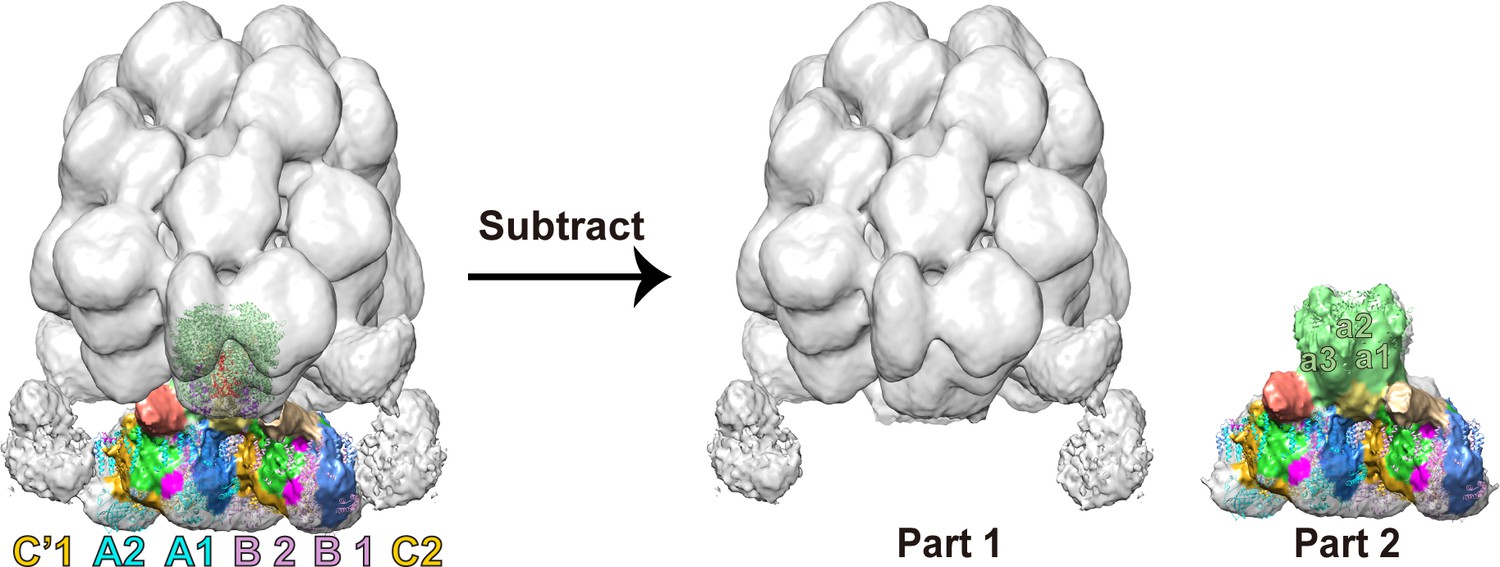
Map extraction model of the PBS–PSII supercomplex.
To analyze the connections between PBS and PSII, we extracted the part two densities from the PBS–PSII supercomplex, include PBS core cylinders a, a', PSII dimers A and B. The extraction was acquired by subtracting Part 1 from the PBS–PSII supercomplex.
Figure 4 with 2 supplements
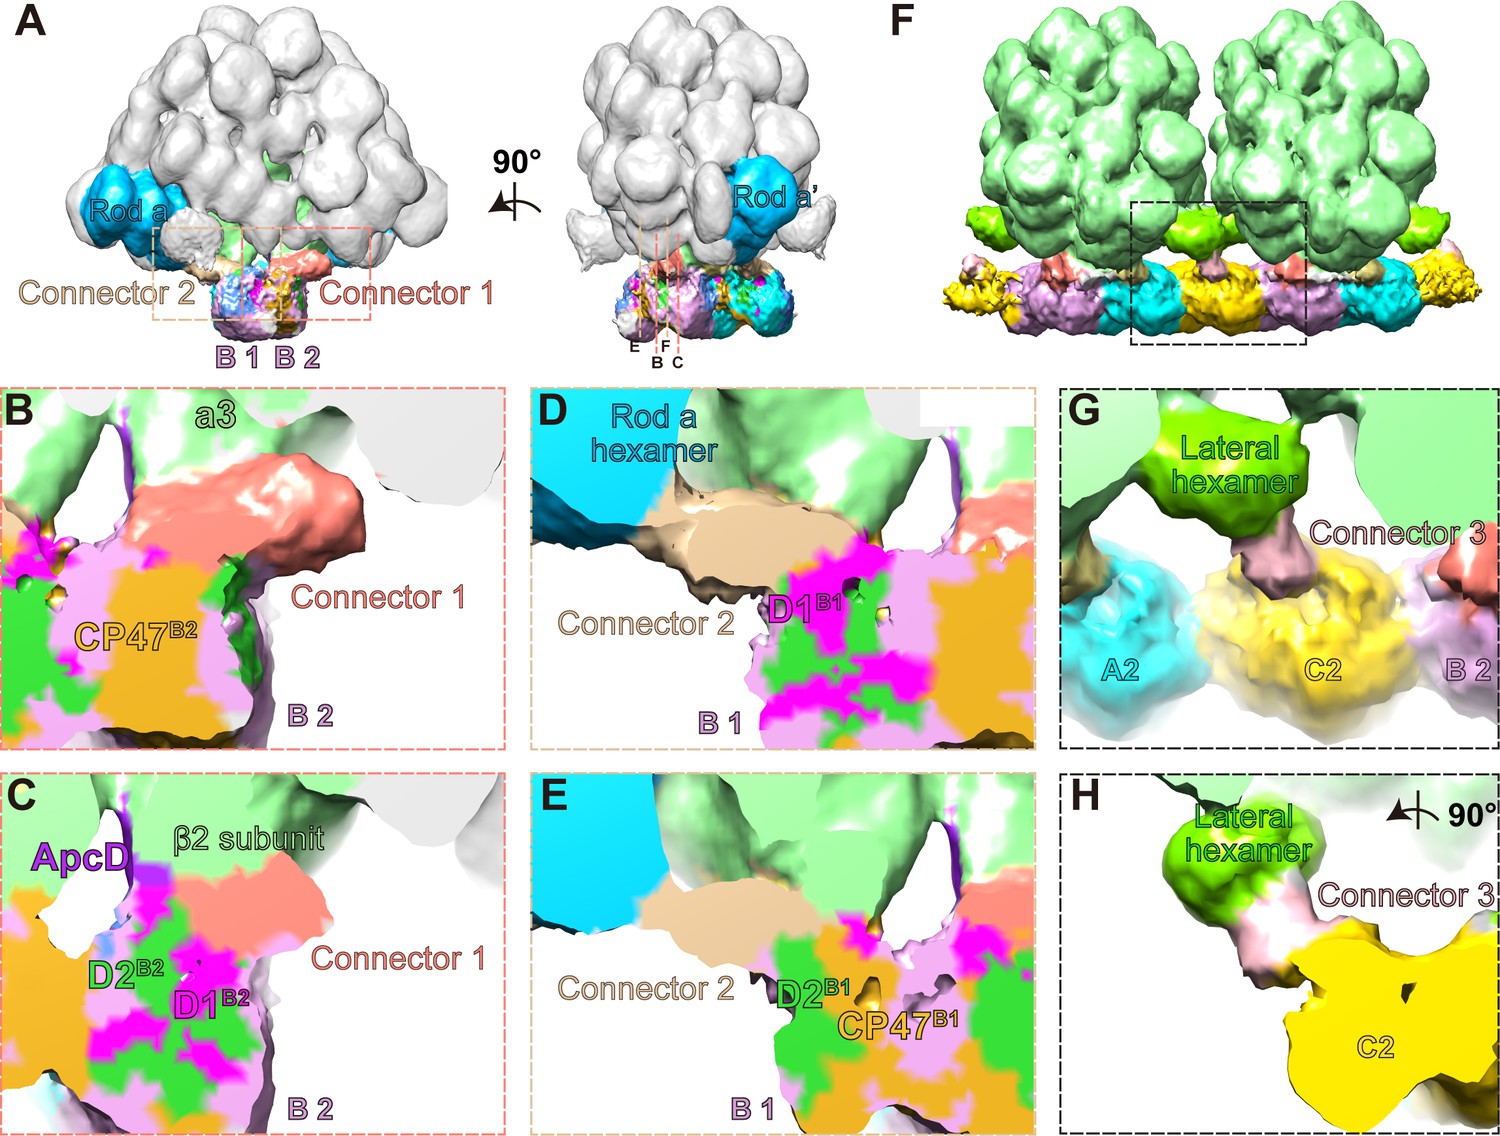
Three connector proteins in the PBS–PSII supercomplex.
(A) Overall structure of the PBS–PSII supercomplex (surface threshold of 0.065), highlighting the PBS core, Rod a of PBS, connector 1, and connector 2 between PBS and PSII. (B, C) The magnified clip views of connector 1 show that connector 1 interacts with the β2 subunit of the a3 trimer layer and the CP47, D1, and D2 subunits of PSII monomer B2 (labeled with CP47B2, D1B2, and D2B2, respectively). (D, E) The magnified clip views of connector 2 show that connector 2 mediates the connections between the bottom hexamer of Rod a and D1, D2, and CP47 of PSII monomer B1 (labeled with D1B1, D2B1, and CP47B1, respectively). (F) The overall structure of double PBS–PSII supercomplex (surface threshold = 0.09) highlights the linkage of connector 3 between PBS’s lateral hexamer and PSII’s bridging dimer C shown in Figure 2A. (G, H) The density of connector 3 and its putative connections with PBS’s lateral hexamer and PSII from two perpendicular views. According to the slice view of the PBS–PSII supercomplex, some densities of connector 3 are inserted into the central cavity of the lateral hexamer (Figure 4—figure supplement 2E); this cavity density is not colored here.
Figure 4—figure supplement 1
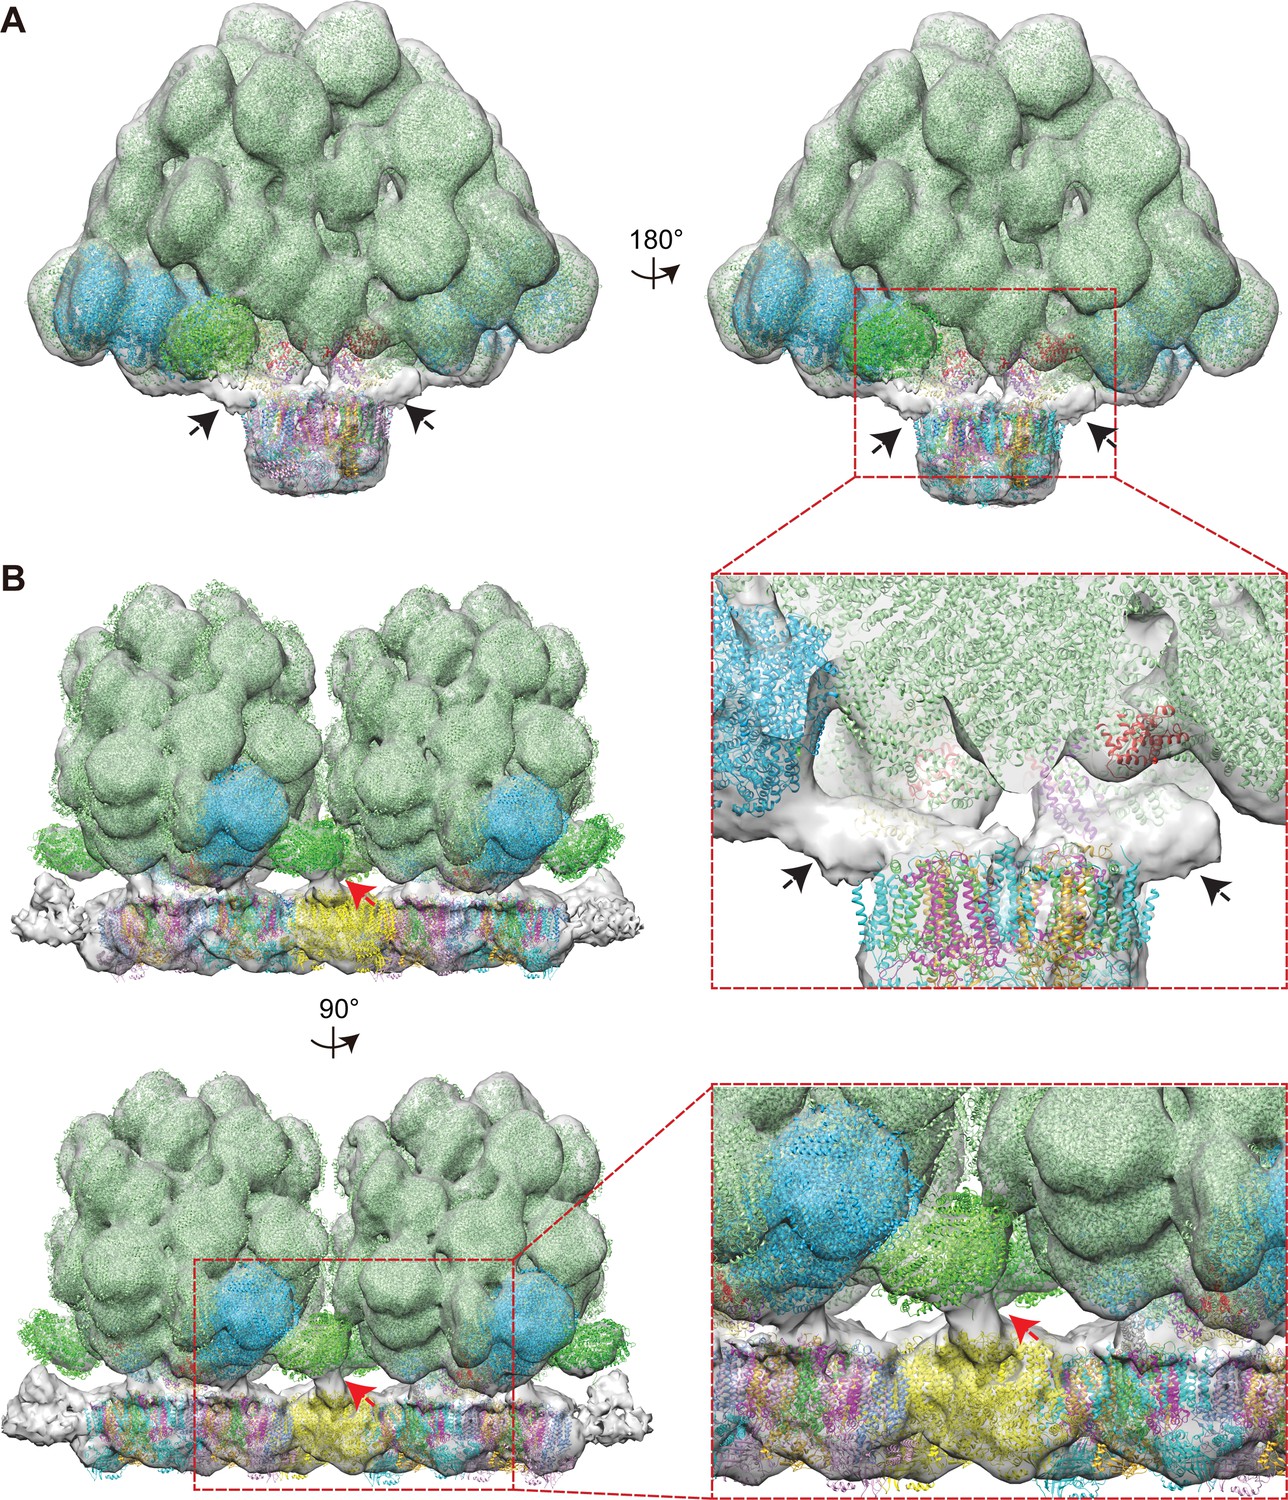
Extra density analysis of the PBS–PSII supercomplex and the double PBS–PSII supercomplex.
(A) To analyze the density map, we carefully docked the cryo-EM model of PBS, X-ray model of PSII dimer, and two lateral hexamers into the PBS–PSII supercomplex map. Two extra solid densities cannot be assigned (Indicated with black arrows). Both the two densities are associated with the PBS core and with PSII. The surface threshold of the sub-tomogram map is 0.065 (B) In the double PBS–PSII supercomplex, another extra density cannot be assigned (Indicated with a red arrow). The density is associated with the lateral hexamer and PSII. The surface threshold of the sub-tomogram map is 0.09.
Figure 4—figure supplement 2
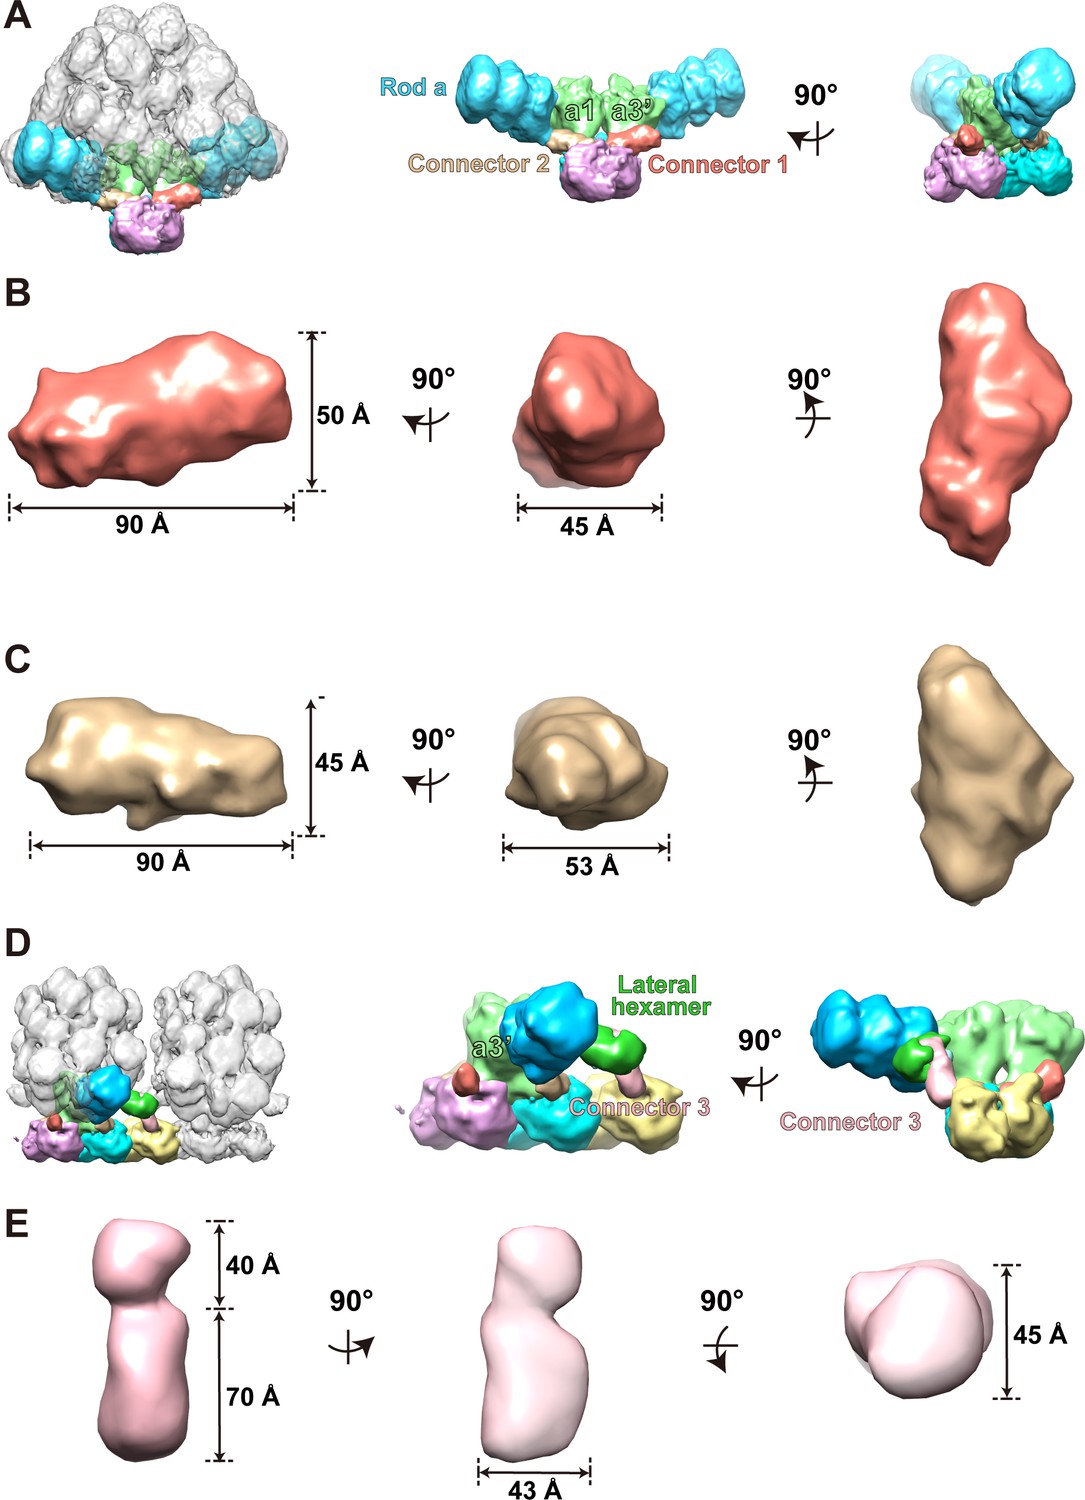
Structures of connectors 1, 2, and 3.
To measure the geometry of the three connectors’ density map, we segmented the densities of connectors 1 and 2 from the PBS–PSII supercomplex with post-processing and that of connector 3 from the double PBS–PSII supercomplex. The PBS–PSII supercomplex (surface threshold of 0.181) was filtered with Gaussian at a width of 3.8. The outcomes are then indicated with three mutually perpendicular views. (A) Segmented map of the PBS–PSII supercomplex. (B) Geometry of connector 1. (C) Geometry of connector 2. (D) Segmented density map of connector 3 from the double PBS–PSII supercomplex (surface threshold = 0.124). (E) Geometric character of connector 3. The small part of connector 3 inserts into the lateral hexamer, and the big part extends outside and connects with PSII.
Figure 5

Schematic model of the PBS–PSII supercomplex.
(A) The front view of the schematic model of the PBS–PSII supercomplex. For PBS, only core and Rod a are represented for clarity. In the PBS core, a and a' represent the two basal cylinders. Each cylinder consists of three APC trimers. b represents the top cylinder containing two APC trimers. (B) The side view of (A). Each PBS interacts with six PSII monomers: the two basal cylinders a and a' of the PBS core directly connect with PSII monomers A1, A2, B1, and B2. The connections are consolidated by connector 1 and connector 2; the lateral hexamers indirectly interact with the PSII monomers C1 and C'2 in the two peripheral PSII bridging dimers C and C' through connector 3. Two PsbO subunits from the adjacent PSII dimers bind with each other and may promote stabilization of the PBS–PSII supercomplex. The PBS–PSII supercomplexes regularly stack face-to-face into the interconnected arrays, forming the organized network on the thylakoid membrane. (C, D) The detailed connections between PBS and PSII. αLCM interacts with CP43 and CP47 of PSII monomer, which may provide a way to funnel light energy to the reaction center. ApcD connects with CP43, suggesting another energy transfer way. (D) Highlights the connections of αLCM - CP43A1, αLCM–CP47B1, and ApcD–CP43A1. CP43A1, CP43 of PSII dimer A1; CP47B1, CP47 of PSII dimer B1.
Figure 6
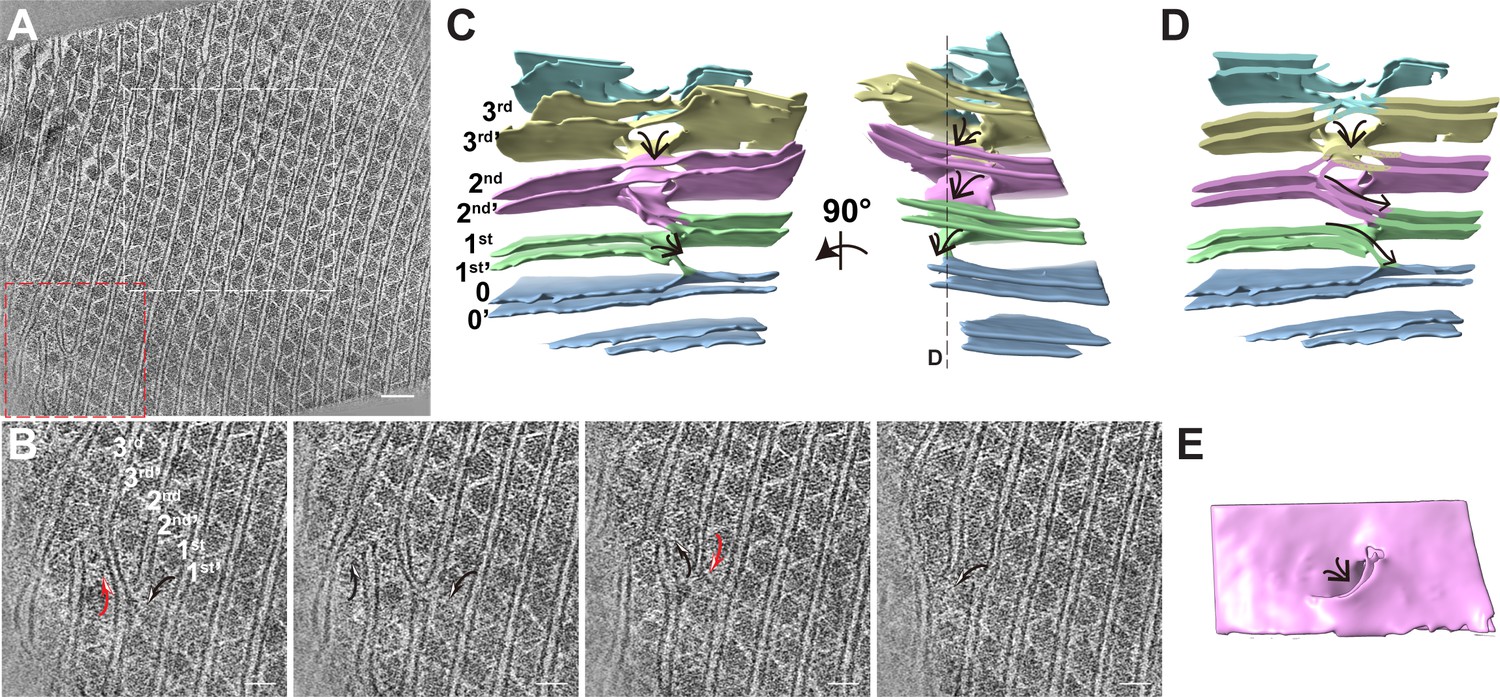
The thylakoid membrane builds perforations and stairs by branching and fusing with the neighboring membrane.
(A) Typical tomogram slice. The white box indicates the tomogram region shown in Figure 1A; red box represents the membrane branching and fusing area. Scale bar, 100 nm. (B) Sequential slices back and forth through the representative tomogram in the red box area of (A), showing the membrane branches off one membrane and fuse with the neighboring membrane. The black arrow shows the fusion membrane; Red arrow shows the branching event. Scale bars, 50 nm. (C) 3D segmentation model of the red box area of (A) in the absence of the PBS–PSII supercomplexes to show the 3D morphology of the thylakoid. The two-line arrow indicates the membrane stairs. The numbers label different layers of membrane. (D) The clip view of the 3D segmentation model. The clip position is showed in the right panel of (C). The arrows show the membrane stairs. (E) The membrane top view shows the perforation on the top of the membrane stair. Figure accompanied by Video 5.
Videos
Video 1
Sequential slices back and forth through the representative tomogram in cross-section view.
Related to Figure 1. Scale bar, 100 nm.
Video 2
Sequential slices back and forth through the representative tomogram slice in cross-section view.
Related to Figure 1—figure supplement 1B. The color boxes indicate the two types of the tight perforations. Scale bar, 100 nm.
Video 3
Sequential slices back and forth through the representative tomogram slice in cross-section view.
Related to Figure 1—figure supplement 1C. Scale bar, 100 nm.
Video 4
Clip views of the segmentation map of two basal cylinders of the PBS.
Related to Figure 3.
Video 5
Sequential slices back and forth through the representative tomogram slice to show thylakoid membrane branching and fusing areas.
Related to Figure 6A–E. Scale bar, 20 nm.
Tables
Key resources table
| Reagent type (species) or resource | Designation | Source or reference | Identifiers | Additional information |
|---|---|---|---|---|
| Strain, strain background (Porphyridium purpureum) | Porphyridium purpureum UTEX 2757 | https://utex.org/products/utex-lb-2757 | UTEX Culture Collection of Algae 2,757 | |
| Gene (Porphyridium purpureum) | uniprot | https://www.uniprot.org/uniprot/ | UP000324585 | Proteome |
| Software, algorithm | SerialEM | https://bio3d.colorado.edu/SerialEM/ | Version 3.1.8 | Data collection |
| Software, algorithm | Chimera | https://www.cgl.ucsf.edu/chimera/ | Version 10.15 | Visualization |
| Software, algorithm | Relion | https://www3.mrc-lmb.cam.ac.uk/relion/ | Version 2.1 | Subtomogram averaging |
| Software, algorithm | IMOD | https://bio3d.colorado.edu/imod/index.html | Version 4.9 | Tomogram reconstruction |
| Software, algorithm | TOMO3D | https://sites.google.com/site/3dem/imageprocessing/tomo3d | Version 2.0 | Tomogram reconstruction |
| Software, algorithm | I3 | https://www.electrontomography.org/ | Version 0.9.3 | Subtomogram averaging |
Additional files
-
Supplementary file 1
Cross-correlation coefficient (CCC) of crystal structures or single particle analysis model and sub-tomogram averaging map.
- https://cdn.elifesciences.org/articles/69635/elife-69635-supp1-v1.docx
-
Transparent reporting form
- https://cdn.elifesciences.org/articles/69635/elife-69635-transrepform1-v1.docx
Download links
A two-part list of links to download the article, or parts of the article, in various formats.
Downloads (link to download the article as PDF)
Open citations (links to open the citations from this article in various online reference manager services)
Cite this article (links to download the citations from this article in formats compatible with various reference manager tools)
In situ cryo-ET structure of phycobilisome–photosystem II supercomplex from red alga
eLife 10:e69635.
https://doi.org/10.7554/eLife.69635


