Improving statistical power in severe malaria genetic association studies by augmenting phenotypic precision
- Mahidol Oxford Tropical Medicine Research Unit, Faculty of Tropical Medicine, Mahidol University, Thailand
- Centre for Tropical Medicine and Global Health, Nuffield Department of Medicine, University of Oxford, United Kingdom
- KEMRI-Wellcome Trust Research Programme, Centre for Geographic Medicine Research-Coast, Kenya
- The Wellcome Sanger Institute, United Kingdom
- Wellcome Trust Centre for Human Genetics, University of Oxford, United Kingdom
- Medical Research Council Clinical Trials Unit, University College London, United Kingdom
- Institute of Global Health Innovation, Imperial College, London, United Kingdom
- Nuffield Department of Medicine, University of Oxford, United Kingdom
- Department of Statistics, University of Oxford, United Kingdom
Figures
Figure 1
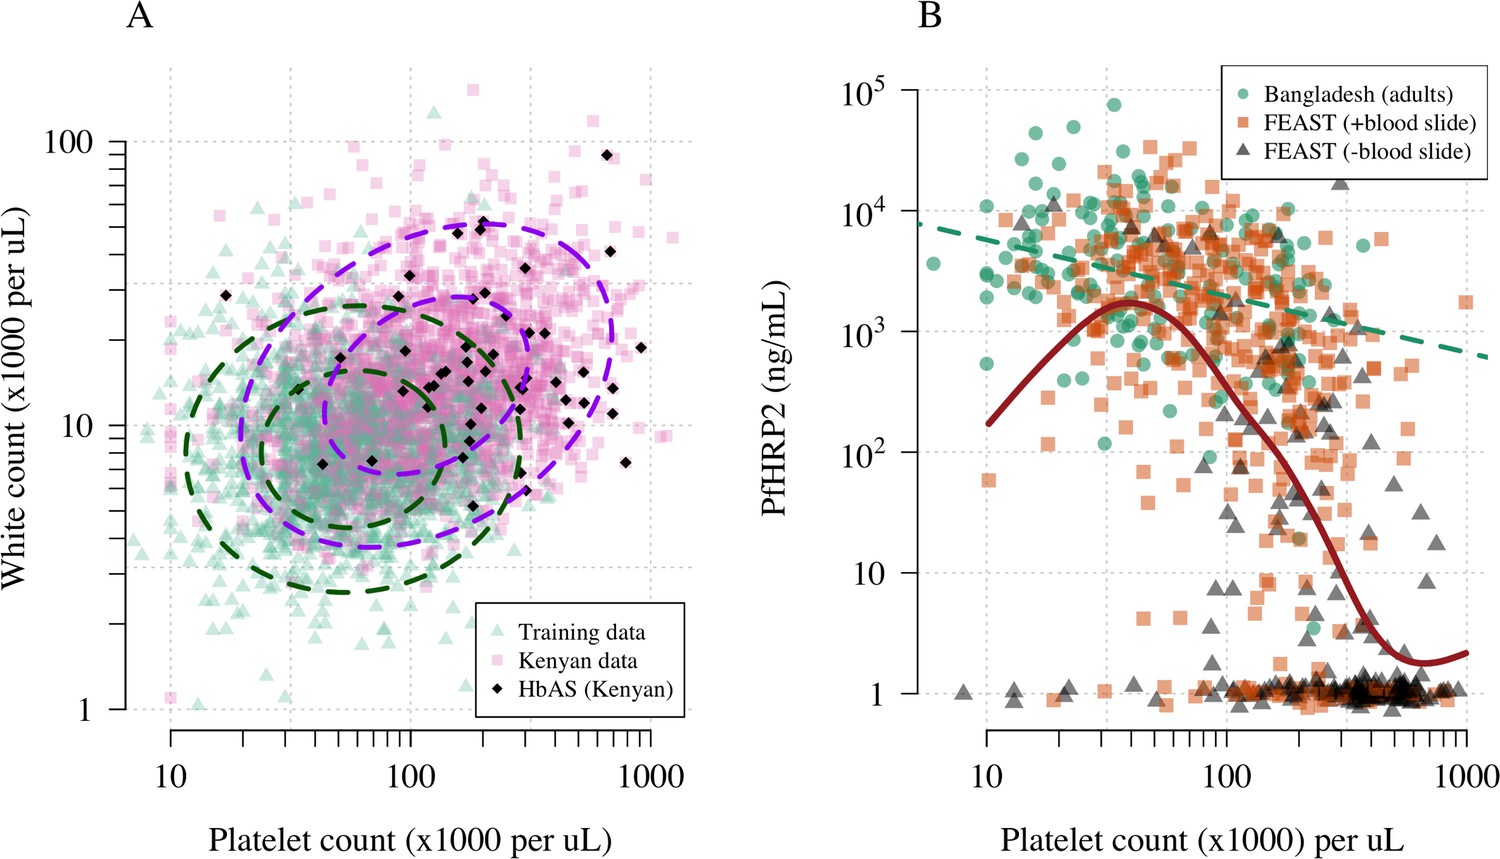
Platelet counts and white blood cell counts as diagnostic predictors of severe falciparum malaria.
Panel (A) shows the bivariate marginal distribution for the reference data (thought to be highly specific to severe malaria, green triangles, n = 1704, summarised in Table 1) and for the Kenyan case data (pink squares, n = 2220; black diamonds: HbAS). The dashed ellipses show the 50% and 95% bivariate normal probability contours approximating each dataset (dark green: reference data; purple: Kenyan data). Panel (B) shows the relationship between platelet counts and plasma PfHRP2 in adults with severe malaria from Bangladesh (green circles, n = 172, the dashed green line shows a linear fit) and in children enrolled in the FEAST trial (n = 567, not specific to severe malaria, Maitland et al., 2011). Undetectable plasma PfHRP2 concentrations were set to 1 ng/mL ± random jitter. Orange squares: malaria-positive blood slide; black triangles: malaria-negative blood slide. The brown line shows a spline fit to the FEAST data (smooth.spline function in R with default parameters) including the data points where PfHRP2 was below the lower limit of detection.
Figure 2
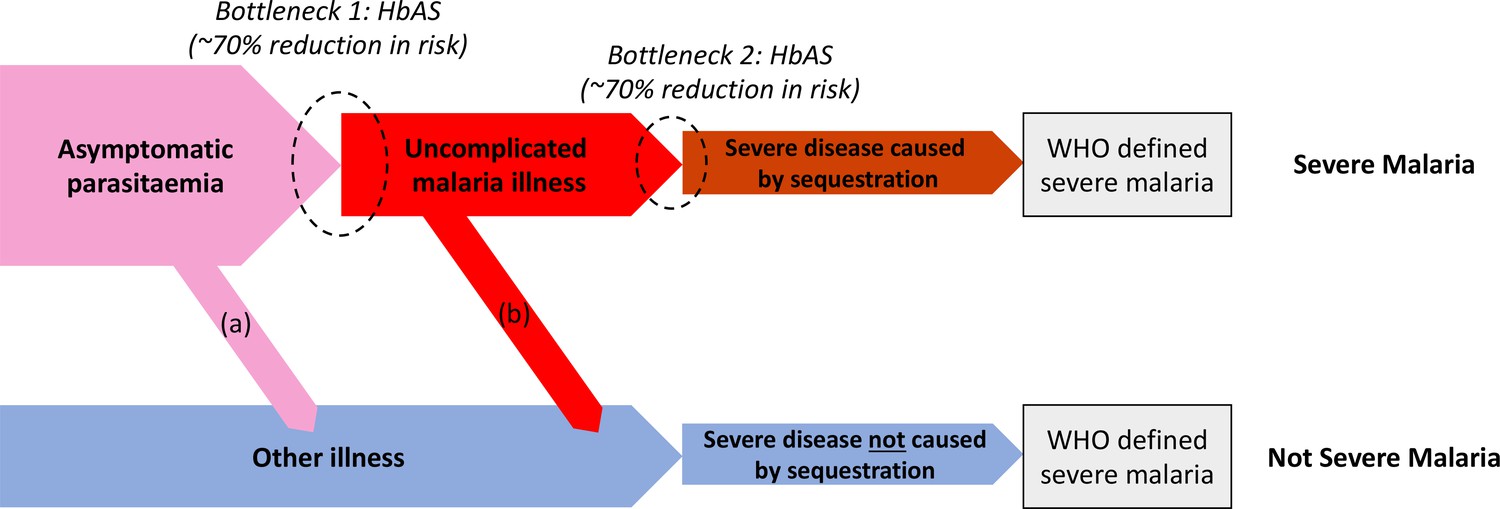
Theoretical causal pathways that lead to the clinical diagnosis of severe malaria under the current WHO definition (World Health Organisation, 2014).
Pathways (a) and (b) represent the two ways patients can be mis-classified as severe malaria. For both pathways (a) and (b), we expect a higher prevalence of HbAS relative to the population with true severe malaria as a consequence of the protective bottlenecks. In this causal model, we assume that HbAS does not protect against asymptomatic parasitaemia, although this assumption is not strictly necessary. Adapted with permission from Small et al., 2017.
Figure 3
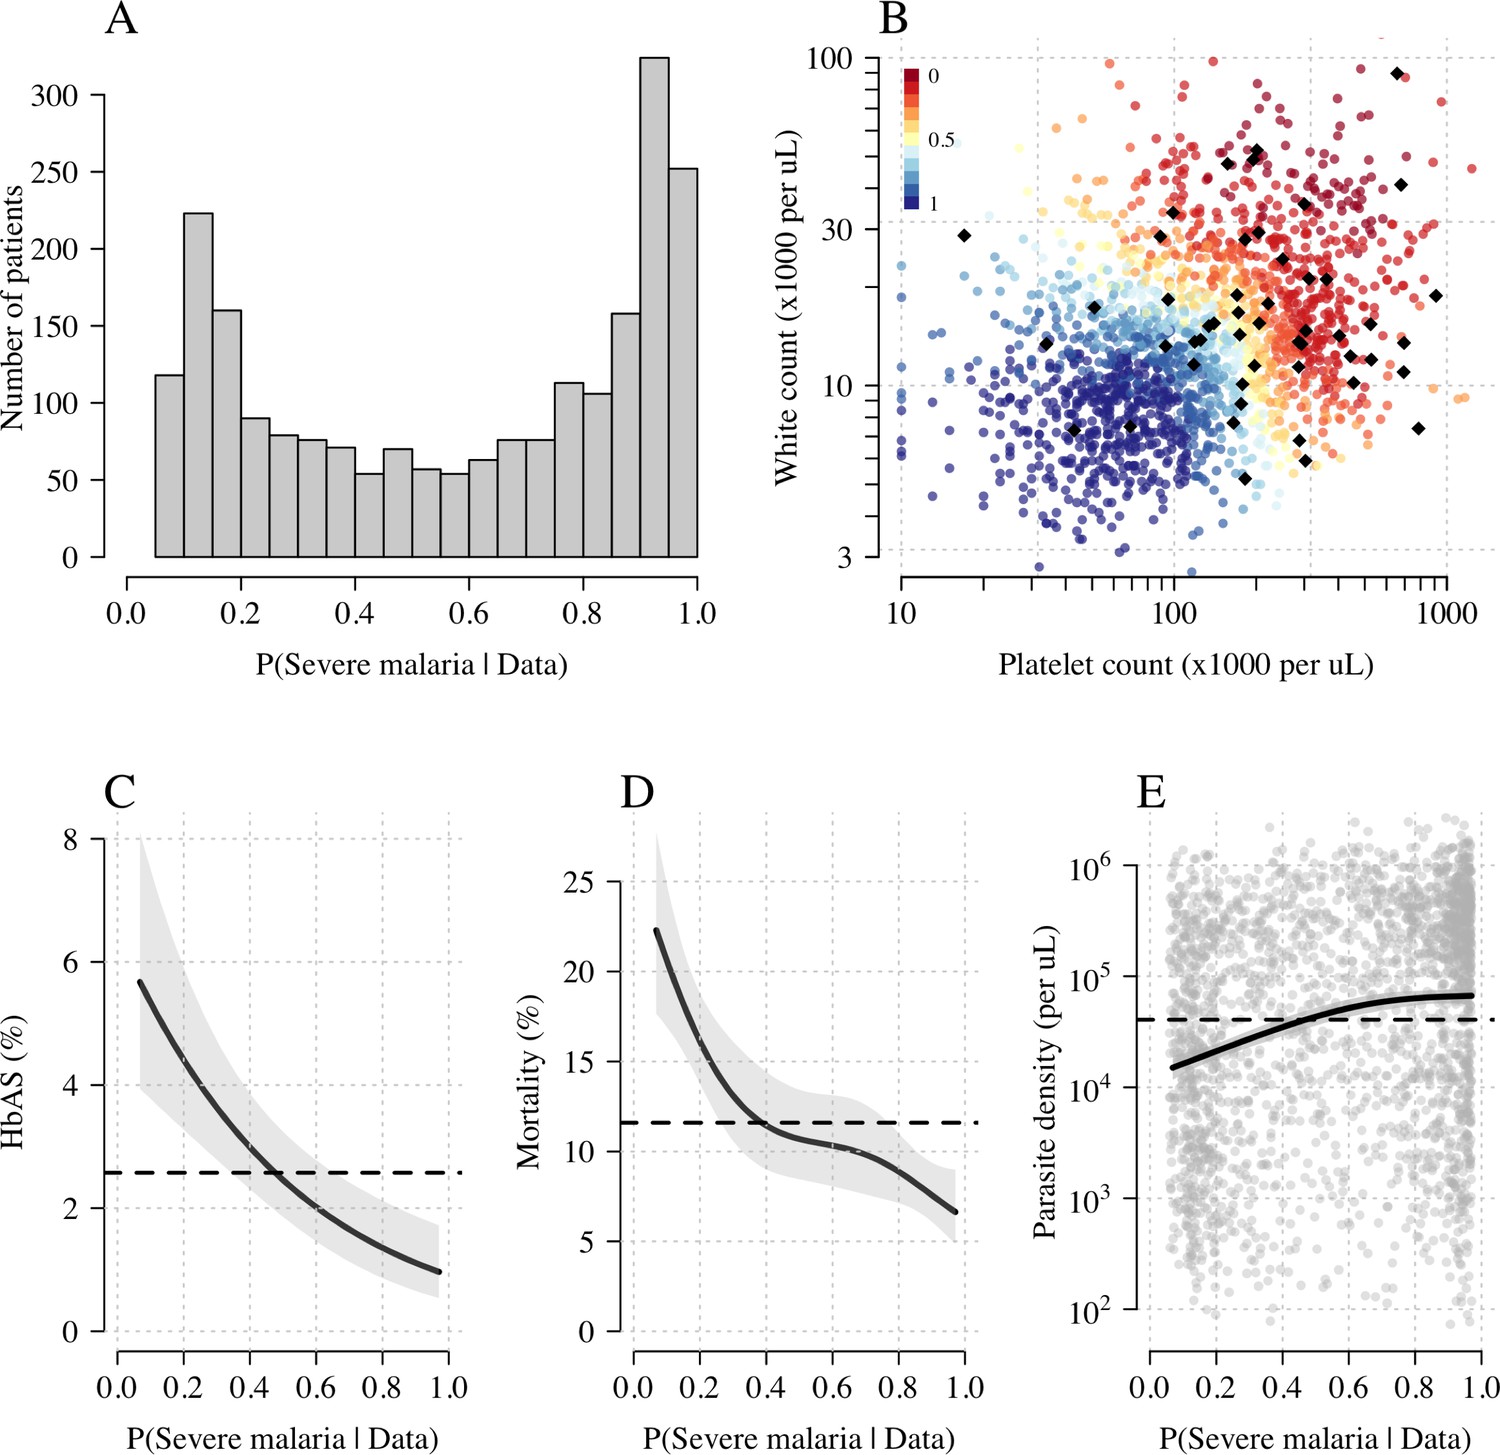
Model estimates of P(Severe malaria | Data) in 2220 Kenyan children clinically diagnosed with severe malaria.
Panel (A) shows the distribution of posterior probabilities of severe malaria being the correct diagnosis. Panel (B) shows these same probabilities plotted as a function of the platelet and white counts on which they are based (dark red: probability close to 0; dark blue: probability close to 1). The black diamonds show the HbAS individuals. Panels (C–E) show the relationship between the estimated probabilities of severe malaria and HbAS, in-hospital mortality and admission parasite density, respectively. The black lines (shaded areas) show the mean estimated values (95% confidence intervals) from a generalised additive logistic regression model with a smooth spline term for the likelihood (R package mgcv). The horizontal lines in panels (C–E) show the mean values in the data.
Figure 4
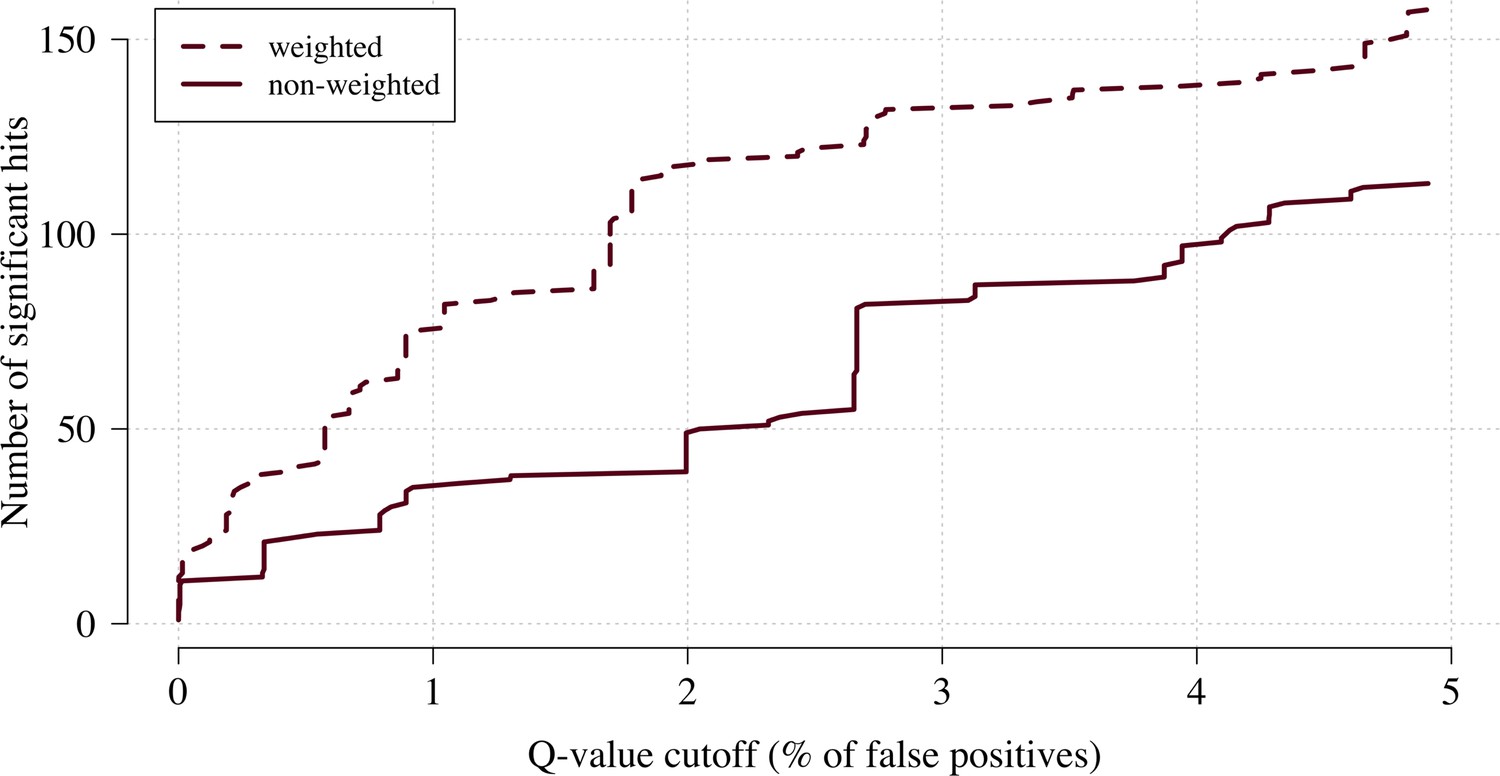
The number of significant hits as a function of the FDR for the genome-wide association study across 9.6 million biallelic variants.
This analysis is based on a subset of the Kenyan children with whole-genome data available and passing quality checks n = 1297 and n = 1614 controls. Dashed line: weighted model; thick line: non-weighted model.
Figure 5
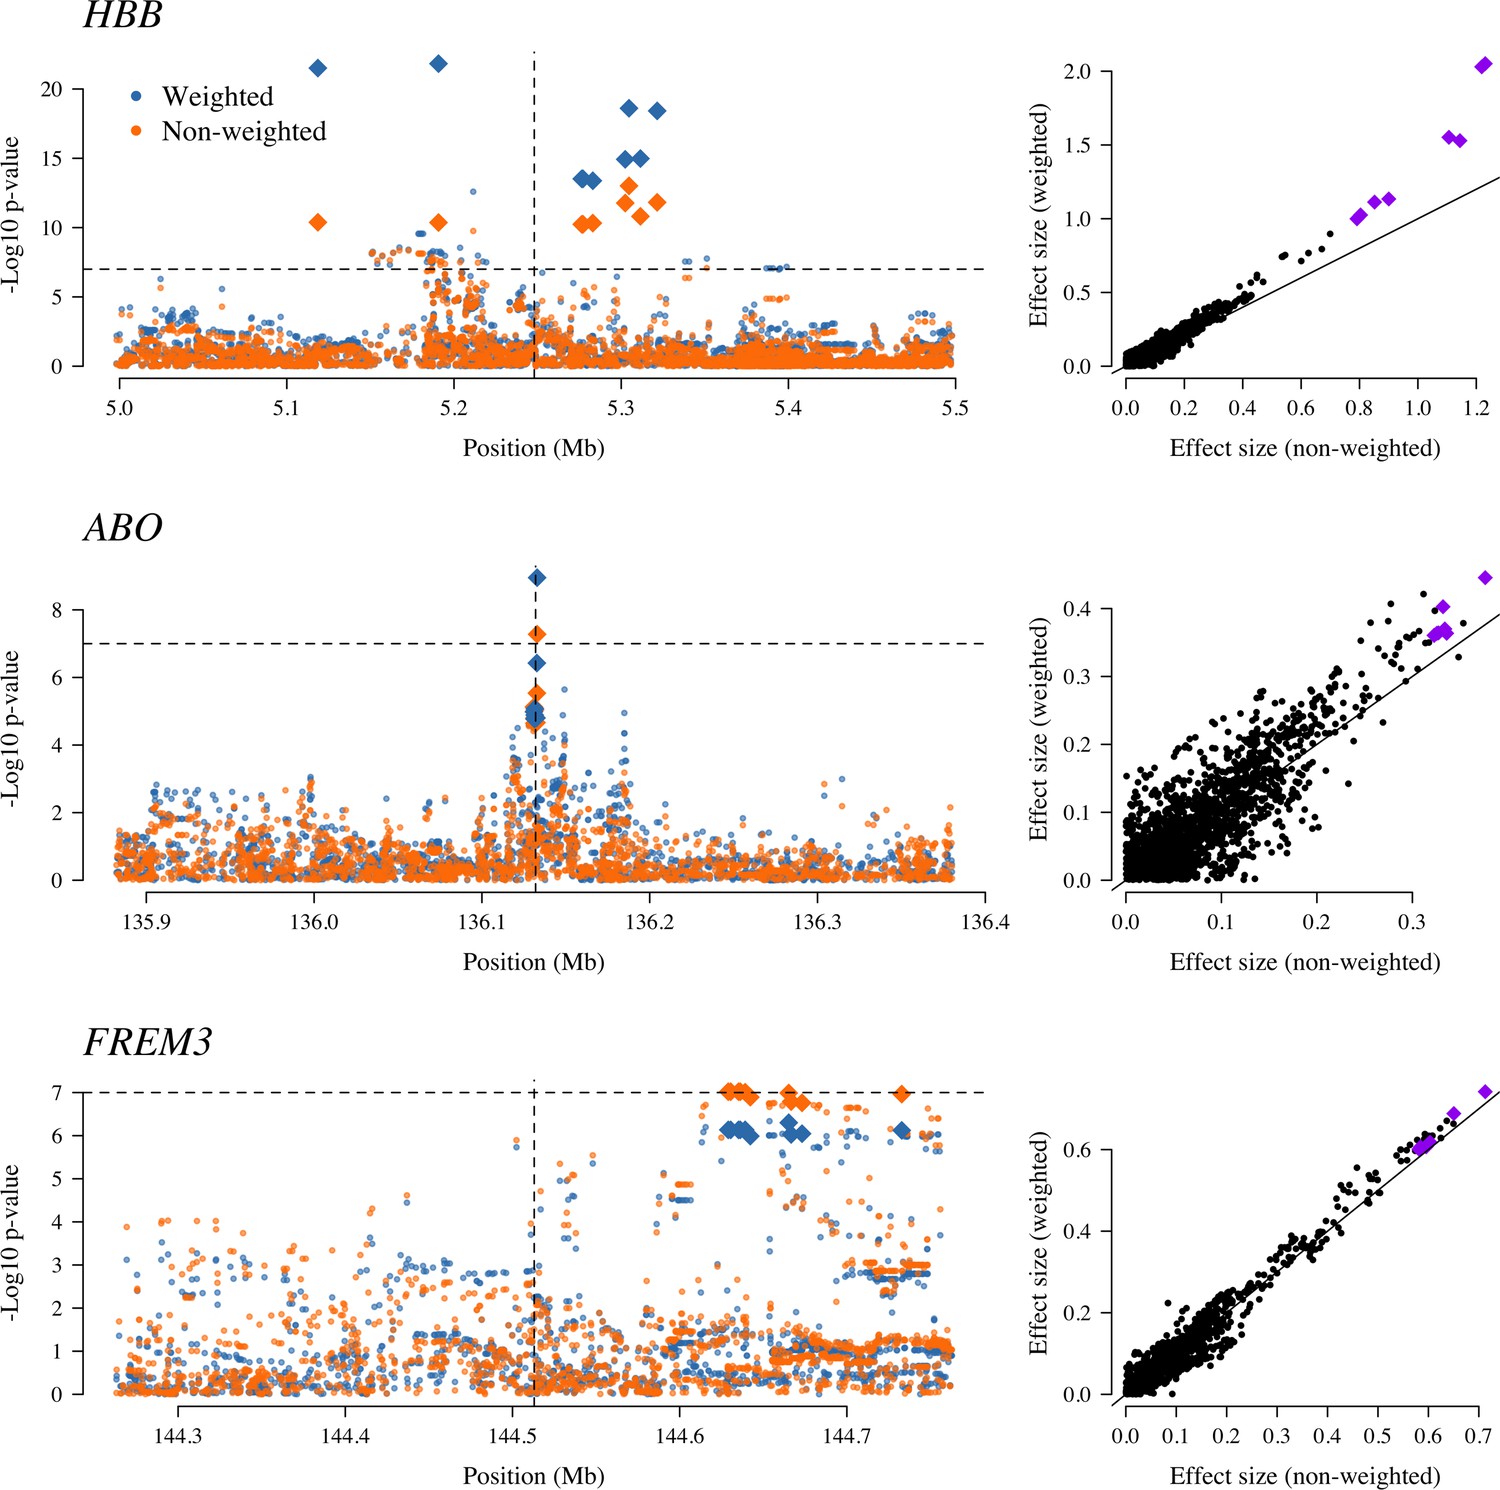
The three regions in the human genome with the greatest evidence for protection against severe malaria in East Africa (HBB, ABO and FREM3; Band et al., 2019).
The Manhattan plots (left panels) compare p-values from the weighted model (blue) and the non-weighted model (orange). Each Manhattan plot is centred around the known causal position shown by the vertical dashed line (0.5 Mb region). The horizontal dashed line shows (threshold often used for defining genome-wide significance). The 10 positions with the greatest –log10 p-values under the non-weighted model are shown as large diamonds. The scatter plots on the right compare absolute effect size estimates under both models with the same top 10 hits shown by the larger purple diamonds. Increases of 30, 9 and 5% are seen for the 10 top hits for HBB, ABO and FREM3, respectively.
Figure 6
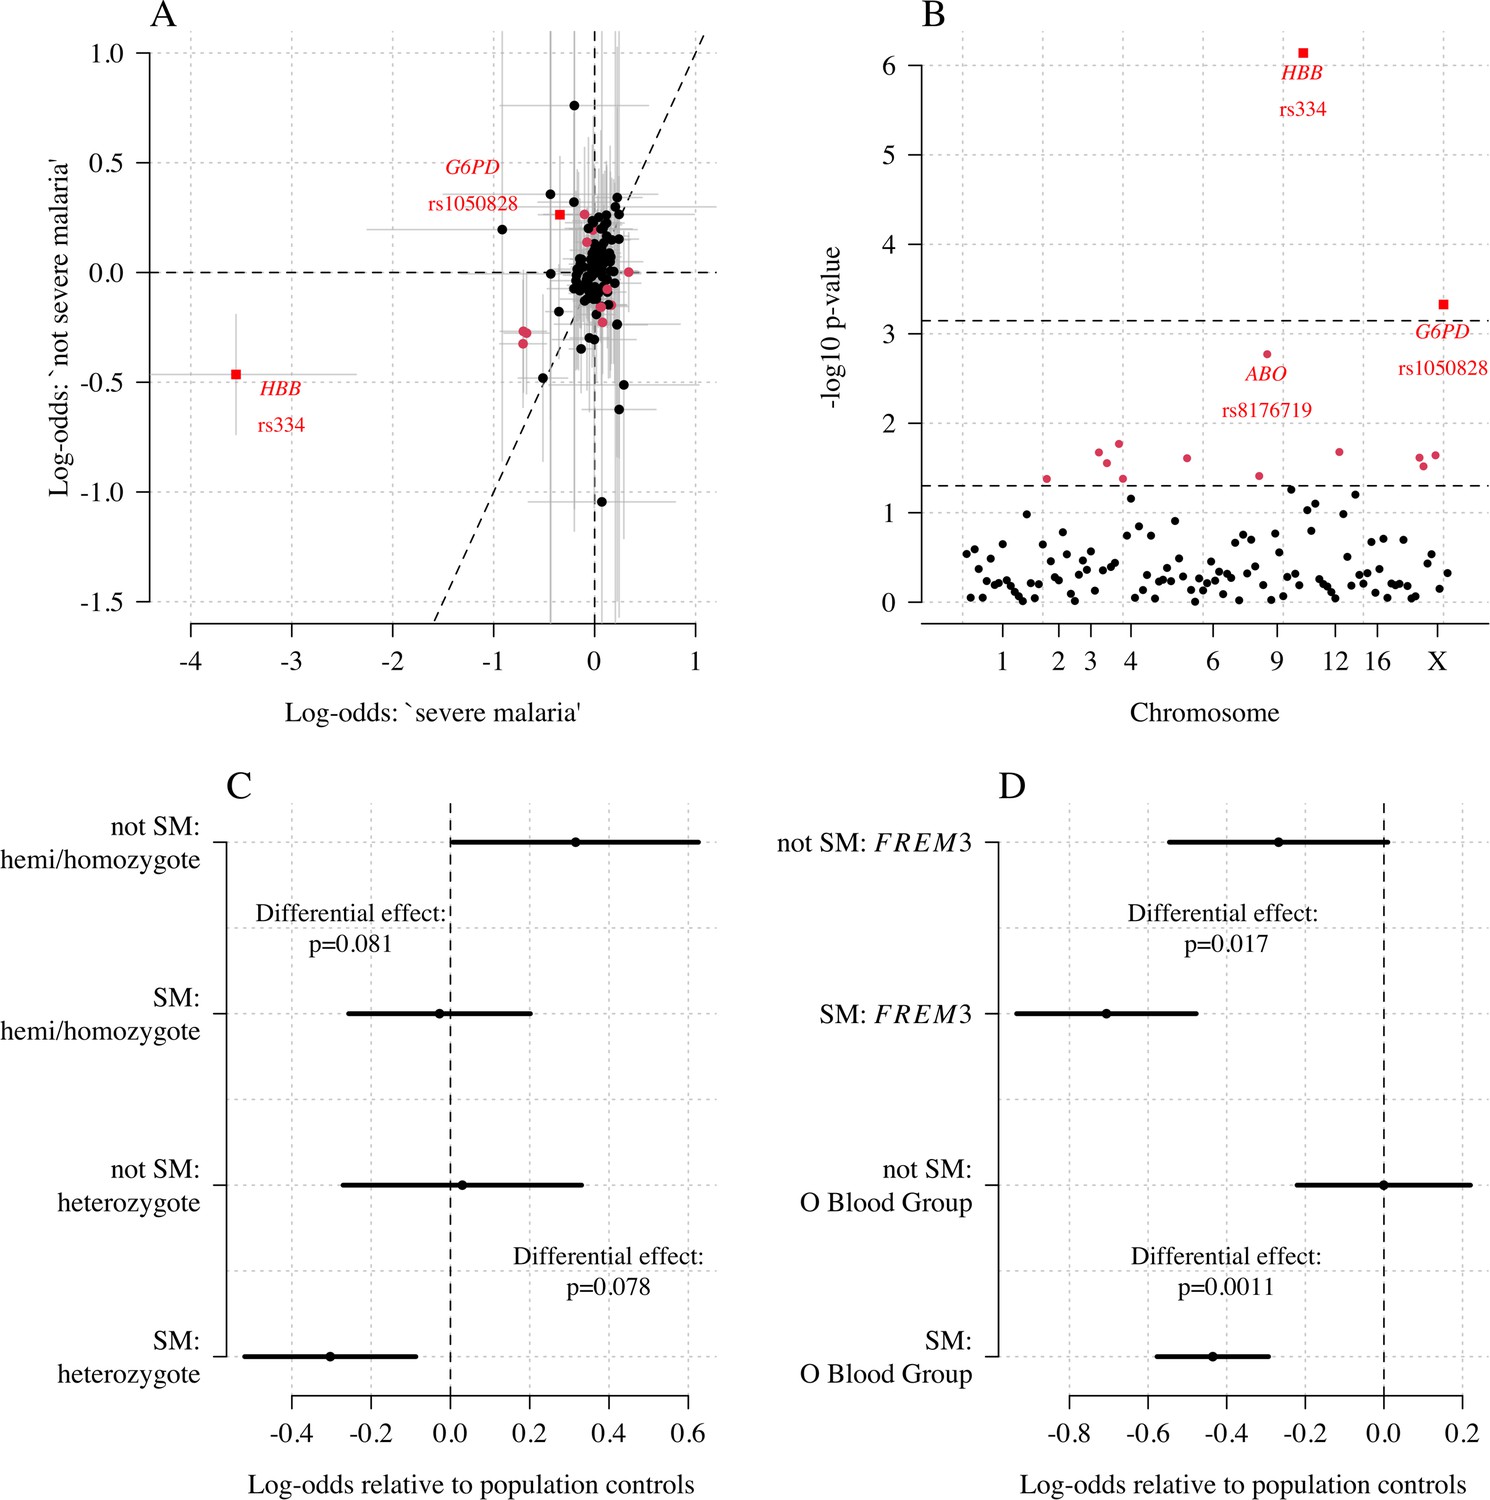
Exploring differential effects in 120 directly typed polymorphisms across 70 candidate malaria-protecting genes.
(A) Case-control effect sizes estimated for the ‘severe malaria’ sub-population versus the ‘not severe malaria’ sub-population (n = 3940 controls and n = 2220 cases, with approximately 1279 in the ‘severe malaria’ sub-population and 941 in the ‘not severe malaria’ sub-population). The vertical and horizontal grey lines show the 95% credible intervals. (B) The log10 p-values testing the hypothesis that the effects are the same for the two sub-populations relative to controls. The top dashed line shows the Bonferroni corrected significance threshold (assuming 70 independent tests). The bottom dashed line shows the nominal significance threshold. In both panels, red circles denote (nominal significance level), and red squares denote . (C) Analysis of the rs1050828 SNP (encoding G6PD + 202T) under a non-additive model (hemi/homozygotes and heterozygotes are distinct categories). This shows that heterozygotes are clearly under-represented in the ‘severe malaria’ sub-population and hemi/homozygotes are clearly over-represented in the ‘not severe malaria’ sub-population. (D) Evidence of differential effects for the O blood group (rs8176719, recessive model) and FREM3 (additive model).
Appendix 1—figure 1

Comparison of the marginal distributions of white blood cell counts between Asian adults and children with severe malaria and African children with severe malaria.
FEAST: 121 severely ill Ugandan children with PfHRP2 >1000 ng/mL (Maitland et al., 2011). Vietnamese adults: 930 adults from two large randomised trials in severe malaria (Phu et al., 2010; Hien et al., 1996). Bangladesh/Thailand: 653 adults and children from observational studies of severe malaria (Leopold et al., 2019).
Appendix 1—figure 2
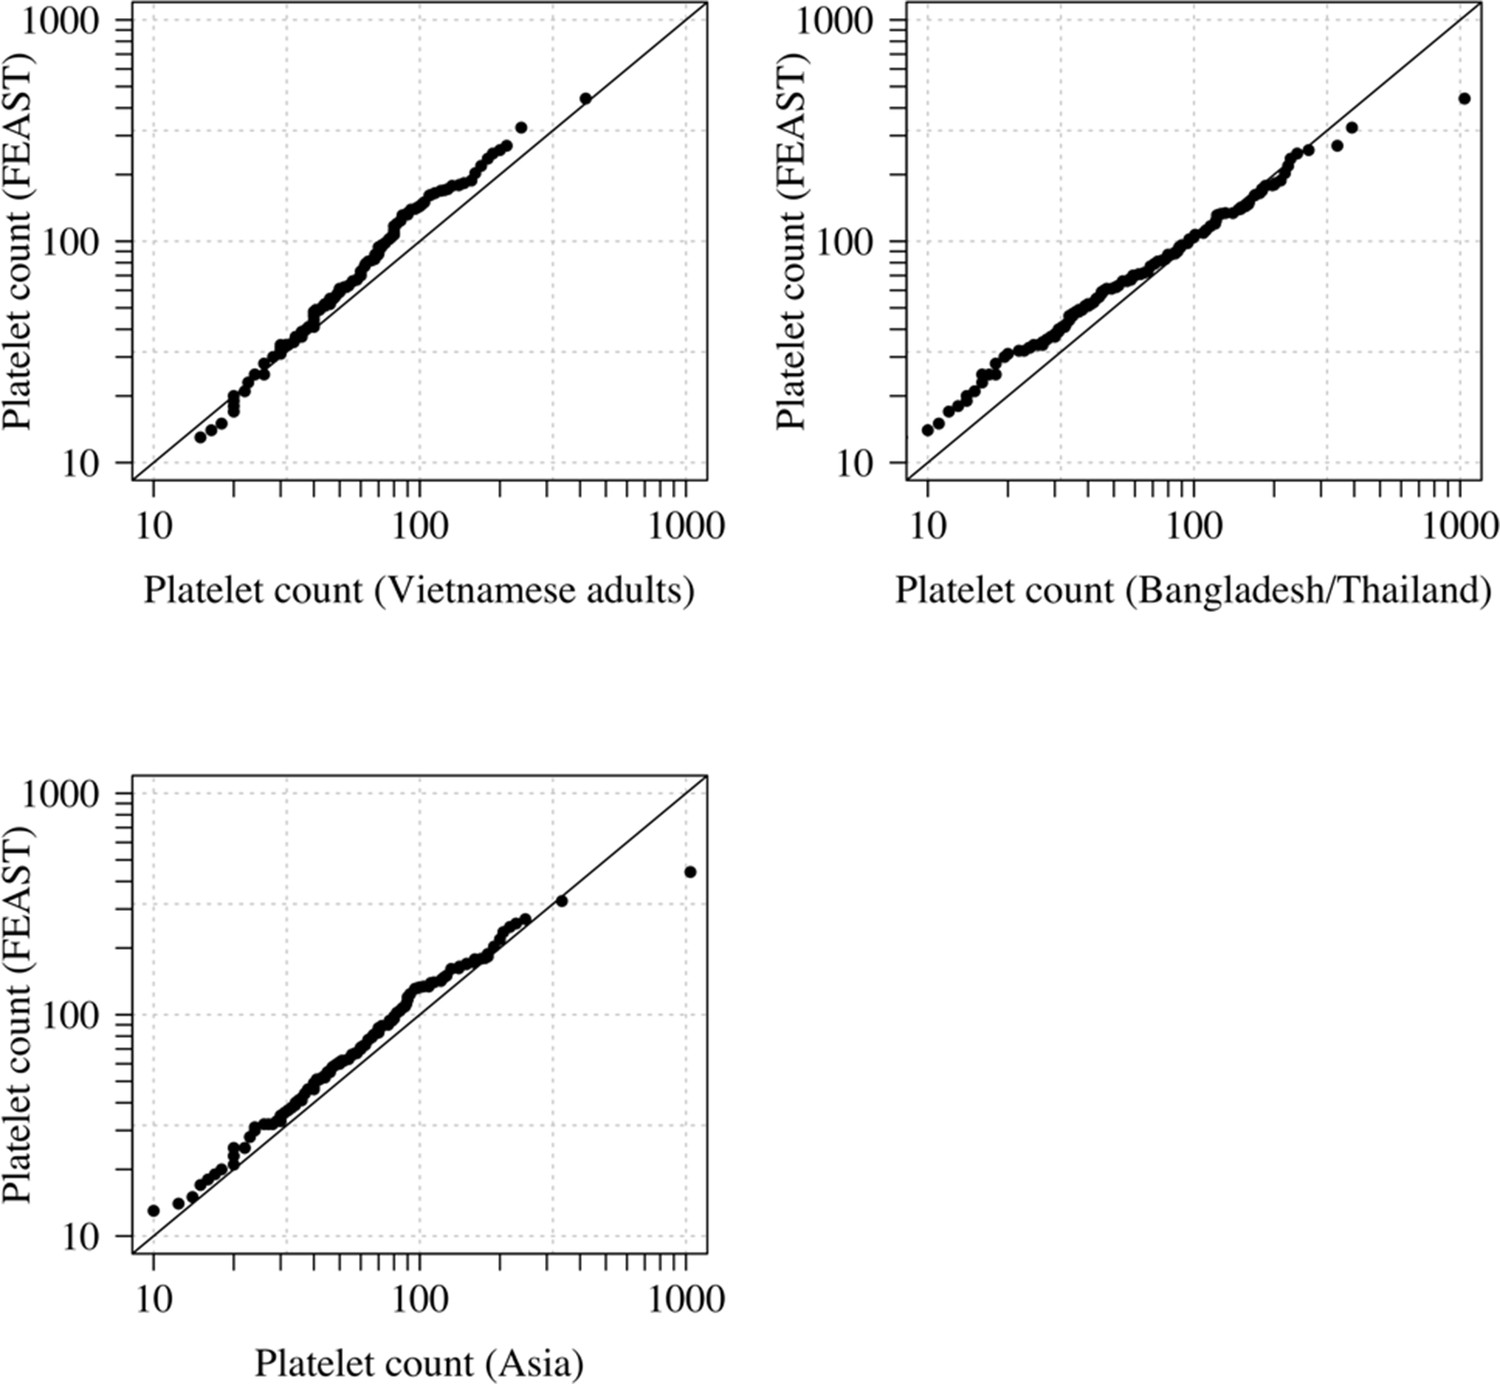
Comparison of the marginal distributions of platelet counts between Asian adults and children with severe malaria and African children with severe malaria.
FEAST: 121 severely ill Ugandan children with PfHRP2 >1000 ng/mL (Maitland et al., 2011). Vietnamese adults: 930 adults from two large randomised trials in severe malaria (Phu et al., 2010; Hien et al., 1996). Bangladesh/Thailand: 653 adults and children from observational studies of severe malaria (Leopold et al., 2019). The bottom-left qqplot compares the white counts from the children in the FEAST study with the combined dataset from Vietnam and Bangladesh/Thailand.
Appendix 2—figure 1

The relationship between platelet counts and plasma PfHRP2 in severely ill African children.
The black line (shaded area) shows the estimated probability (95% confidence interval) that the plasma PfHRP2 >1000 ng/mL as a function of log10 platelet count. This fit is derived from a generalised additive logistic regression model ( for the spline term), fit using the R package mgcv. The generalised additive model was fit to data from 566 African children enrolled in the FEAST trial (Maitland et al., 2011) (all the children who had both platelet counts and PfHRP2 data available). Plasma PfHRP2 >1000 ng/mL is highly discriminatory for severe malaria (Hendriksen et al., 2012).
Appendix 3—figure 1
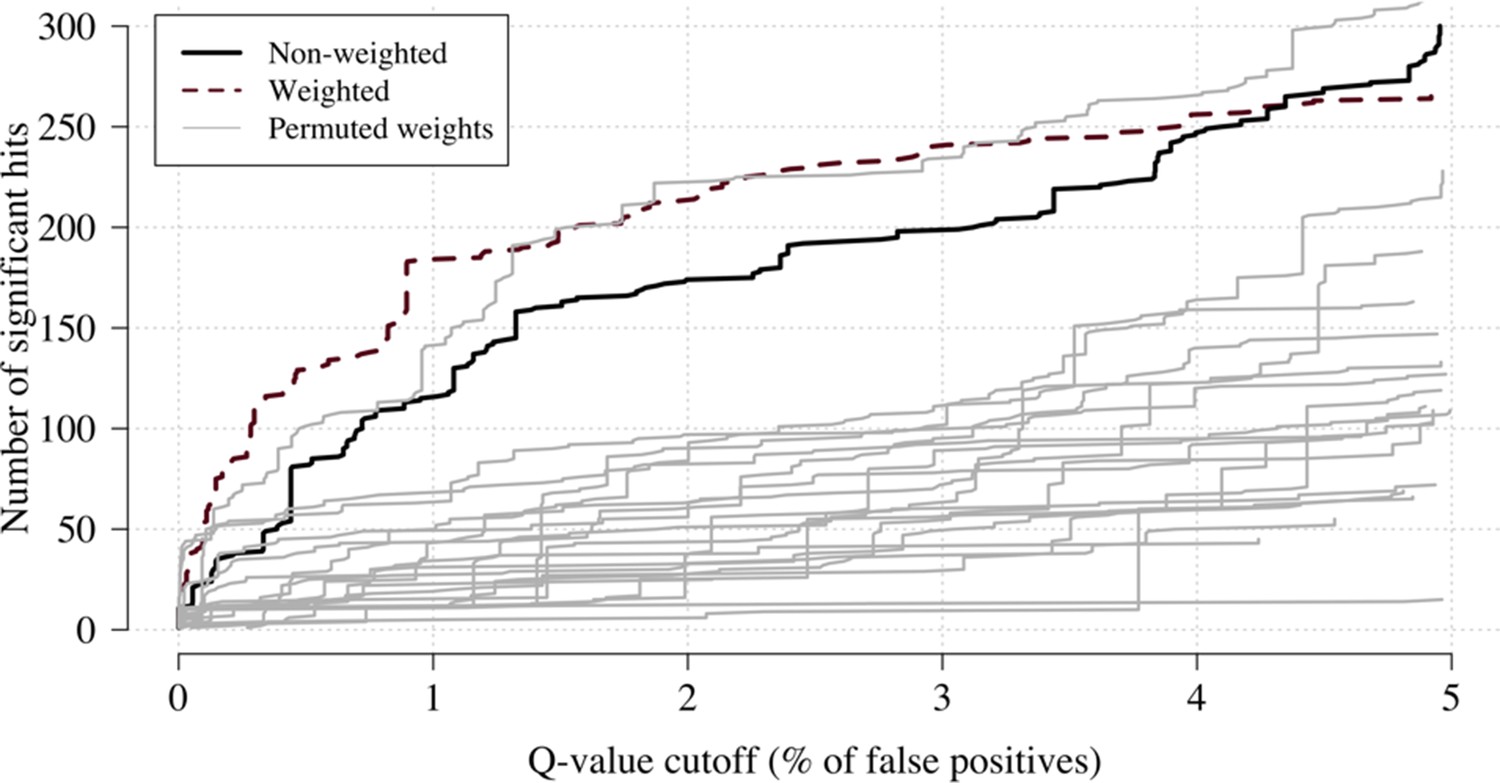
Effect of permuting the weights in the re-weighted (data-tilting) GWAS.
Here we show the results of 20 random permutations of the weights, applied to the Kenyan case-control GWAS using only chromosomes 4, 9 and 11 (where the top hits are – we limit it to these three chromosomes for computational reasons). The random permutations (grey) decrease the number of significant hits compared to the non-weighted (thick black) and the non-permuted re-weighted model (dashed purple).
Appendix 4—figure 1
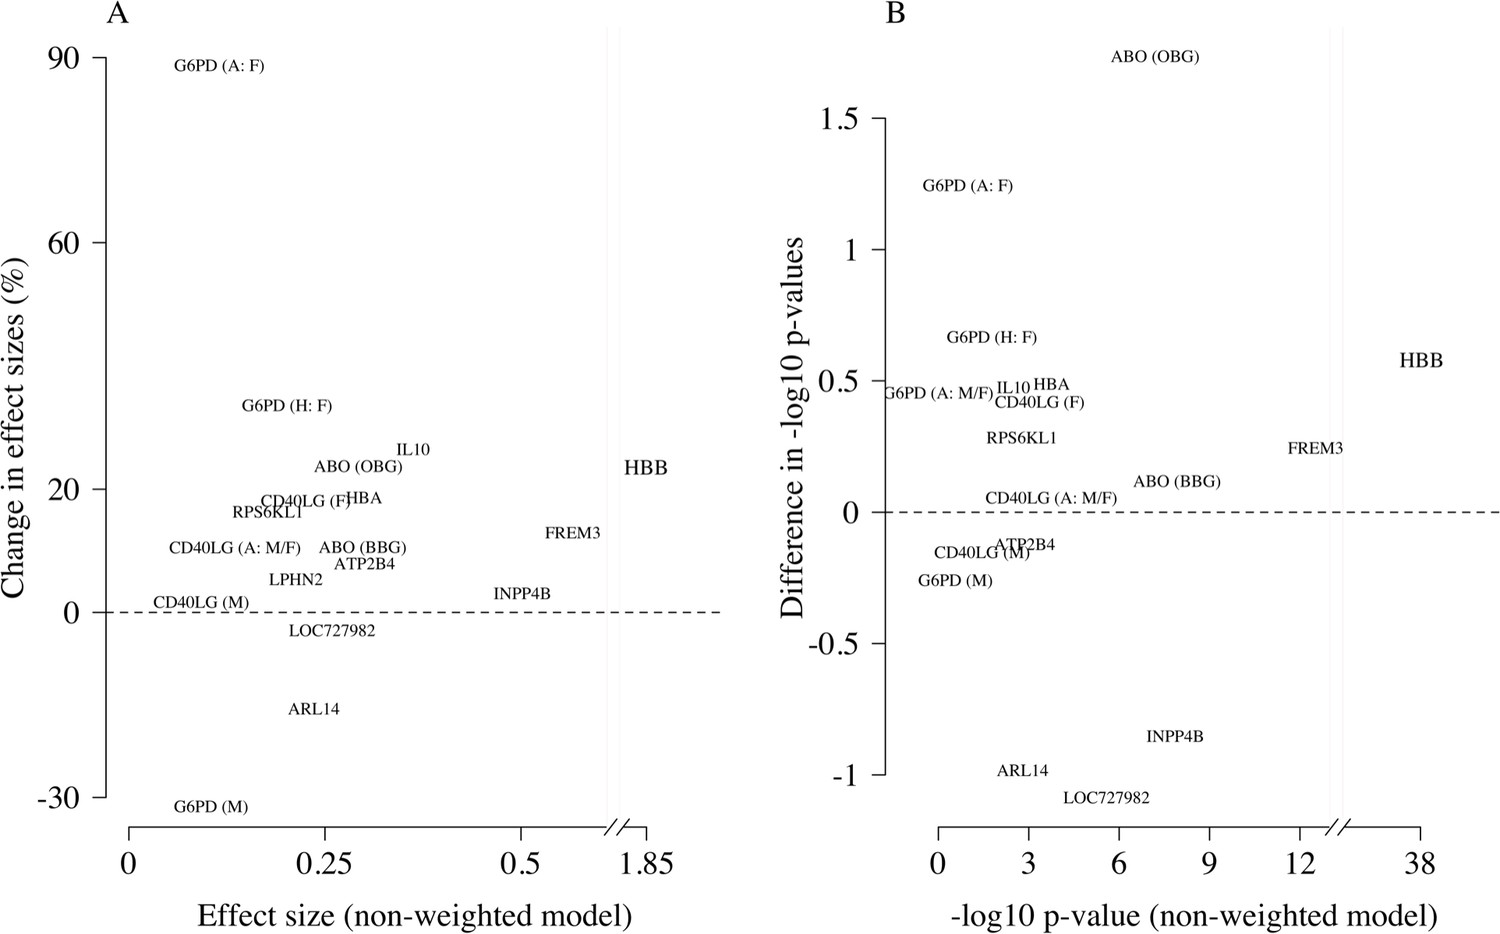
Comparison of the non-weighted and weighted models of association for directly typed polymorphisms previously reported as associated with severe malaria (MalariaGEN Consortium et al., 2018).
(A) Estimated effect sizes under the non-weighted model versus the difference in effect sizes between the weighted and non-weighted models (absolute effects on the log-odds scale). Differences > 0 imply that the absolute effect size is estimated to be larger under the weighted model. (B) –log10 p-values under the non-weighted model versus the differences in –log10 p-values under the weighted and non-weighted models, again differences > 0 represent larger –log10 p-values for the weighted model. Each point is represented by the gene name. In each case, we use the model that best fit the data in the original analysis (MalariaGEN Consortium et al., 2018). For the X-linked polymorphisms (G6PD, CD40LG), multiple models were reported and so the association model is also shown. H: heterozygote; A: additive; M: males only; F: females only; M/F: all.
Appendix 5—figure 1
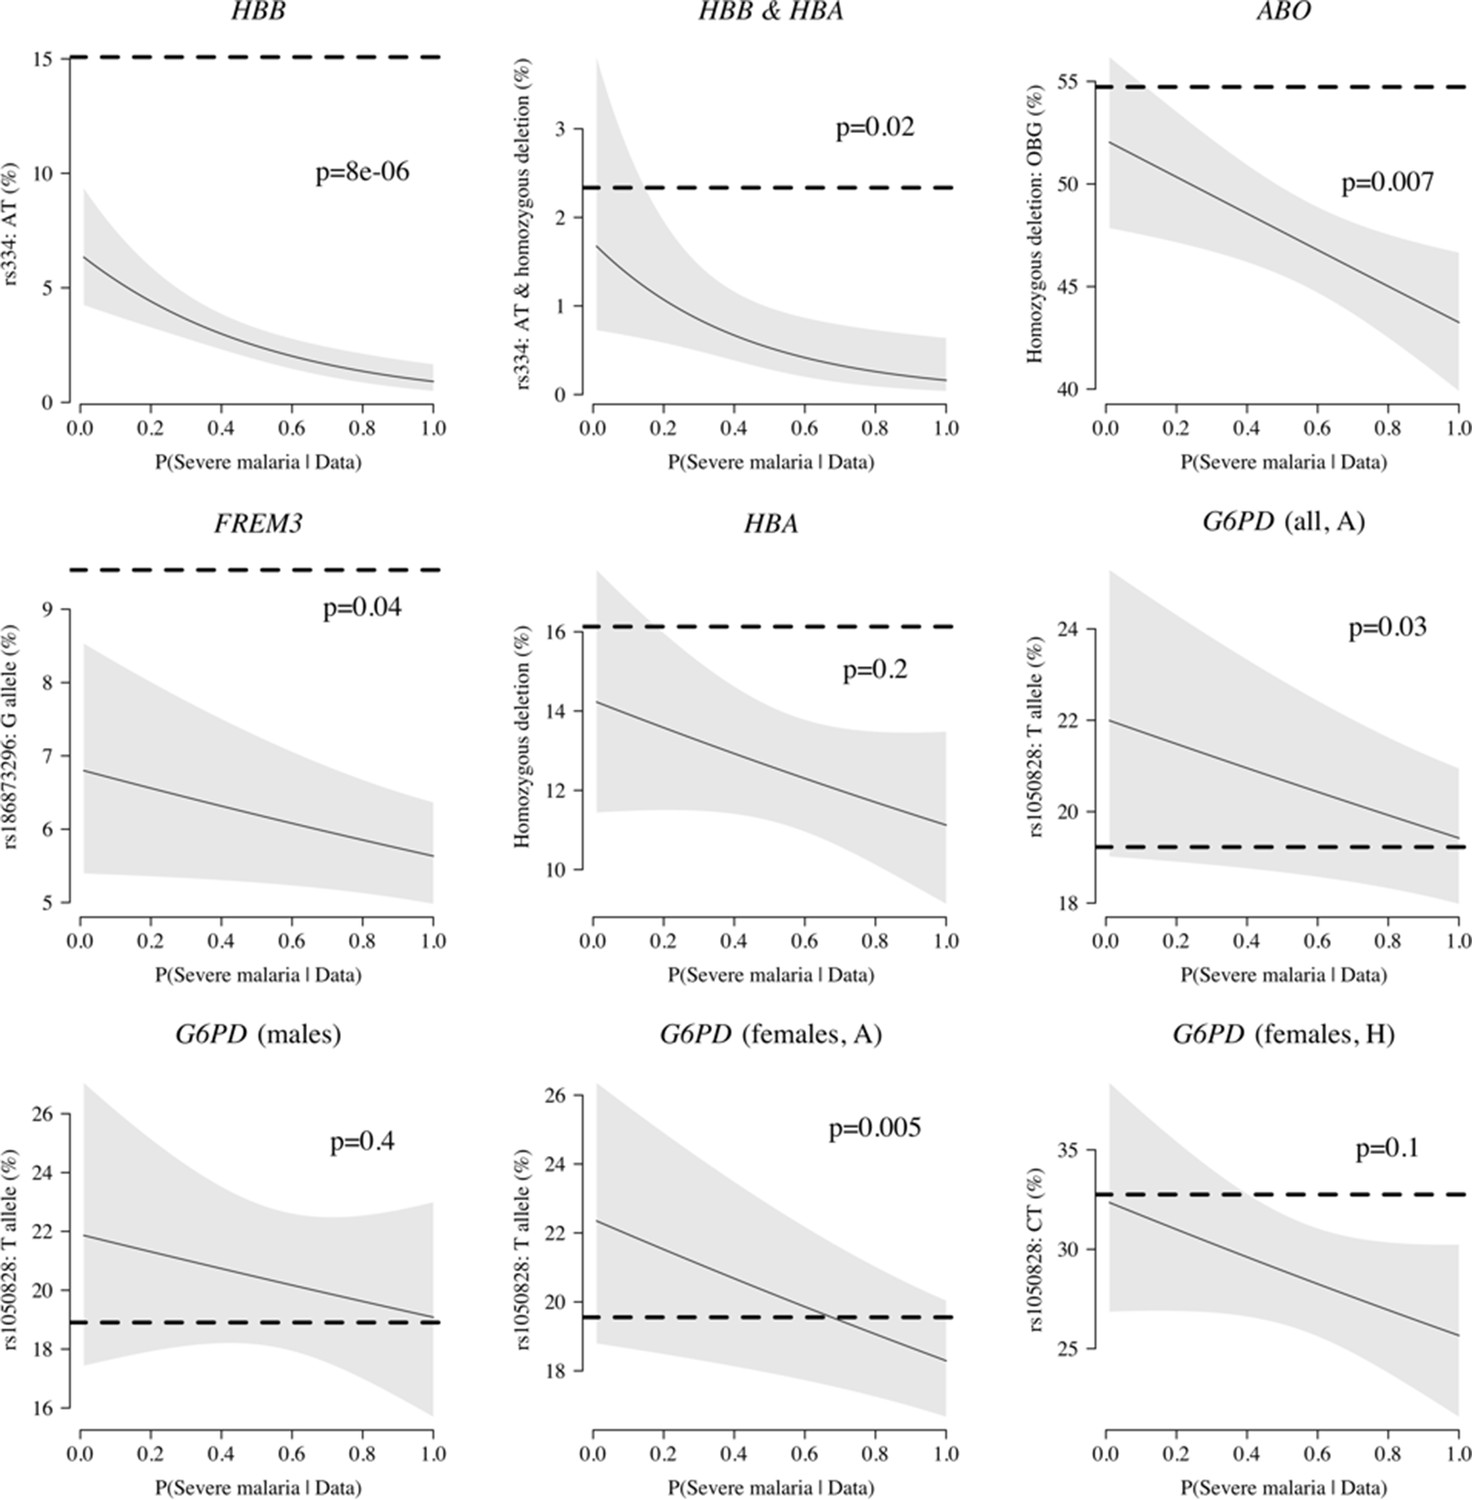
Case-only analysis of five key polymorphisms effecting red cells, reported in Ndila et al., 2020 under additive, recessive or heterozygote models.
The horizontal dashed lines show the estimated frequency in the controls (for additive models, this is the frequency of the derived allele; for the heterozygote or recessive models, this is the frequency of the genotype thought to confer protection). The line (shaded area) shows logistic regression fits with P(Severe malaria | Data) as the predictor (95% confidence interval of the fit). The p-value corresponds to the test that the predictor P(Severe malaria | Data) is not associated with the genotype in the cases only. OBG: O blood group.
Appendix 6—figure 1
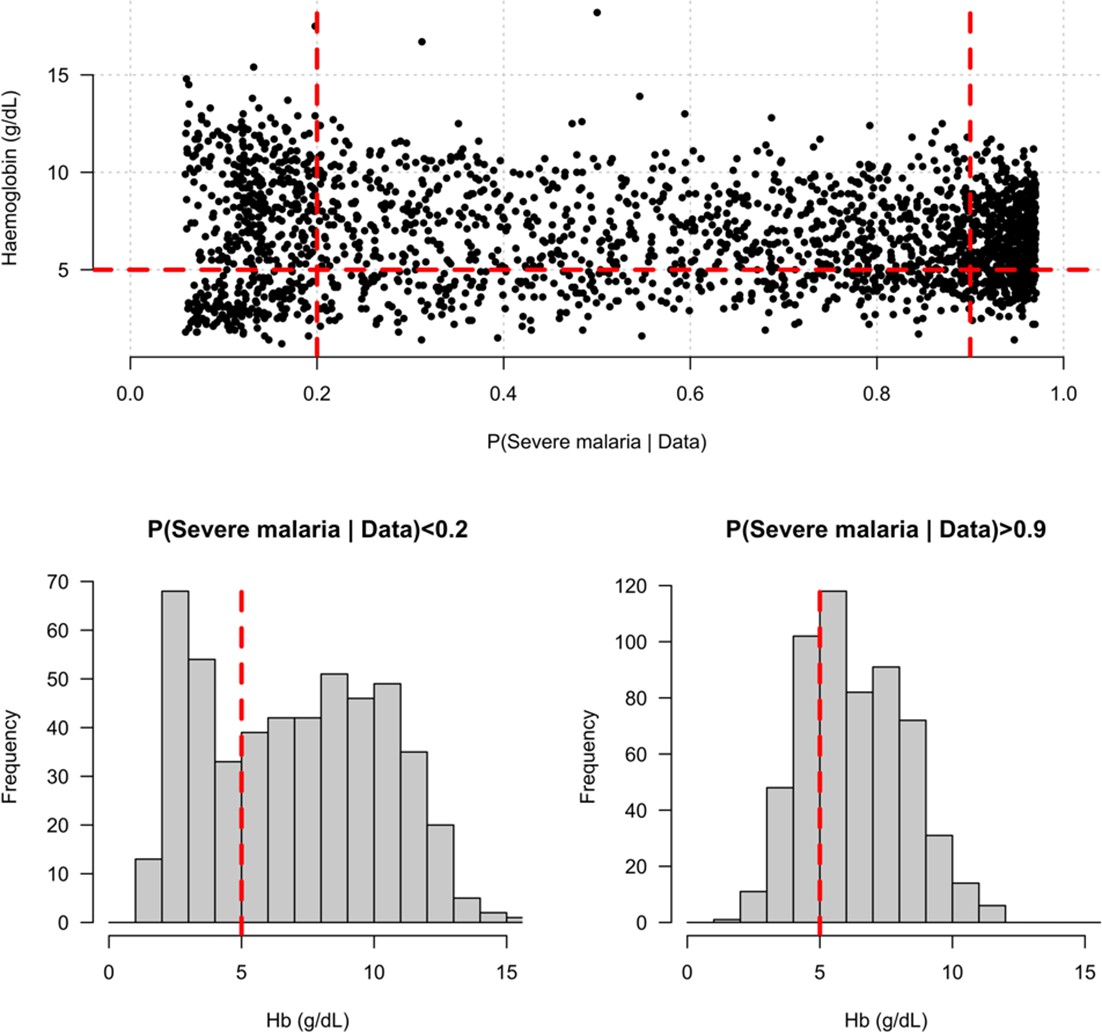
Distribution of admission haemoglobin concentrations as a function of P(Severe malaria | Data).
Severe anaemia is generally defined as a haemoglobin less than 5 g/dL in African children diagnosed with severe malaria, shown by the horizontal dashed red line in the top panel and the vertical dashed red lines in the bottom panels. The vertical dashed red lines in the top panel show the top and bottom quintiles of the probability distribution (0.9 and 0.2, respectively). Patients in the bottom quintile of the probability distribution had a markedly bimodal distribution in haemoglobin concentrations with a substantial proportion meeting the severe anaemia criterion and a substantial proportion with relatively high haemoglobin concentrations (>10 g/dL), suggesting two patients subgroups. Patients in the top quintile had a unimodal distribution of haemoglobin.
Appendix 7—figure 1

Pattern of missing clinical data in the 930 Vietnamese adults.
These data pool the AQ Vietnam severe malaria study (Hien et al., 1996) and the AAV severe malaria study (Phu et al., 2010) (red: missing; yellow: recorded).
Appendix 7—figure 2
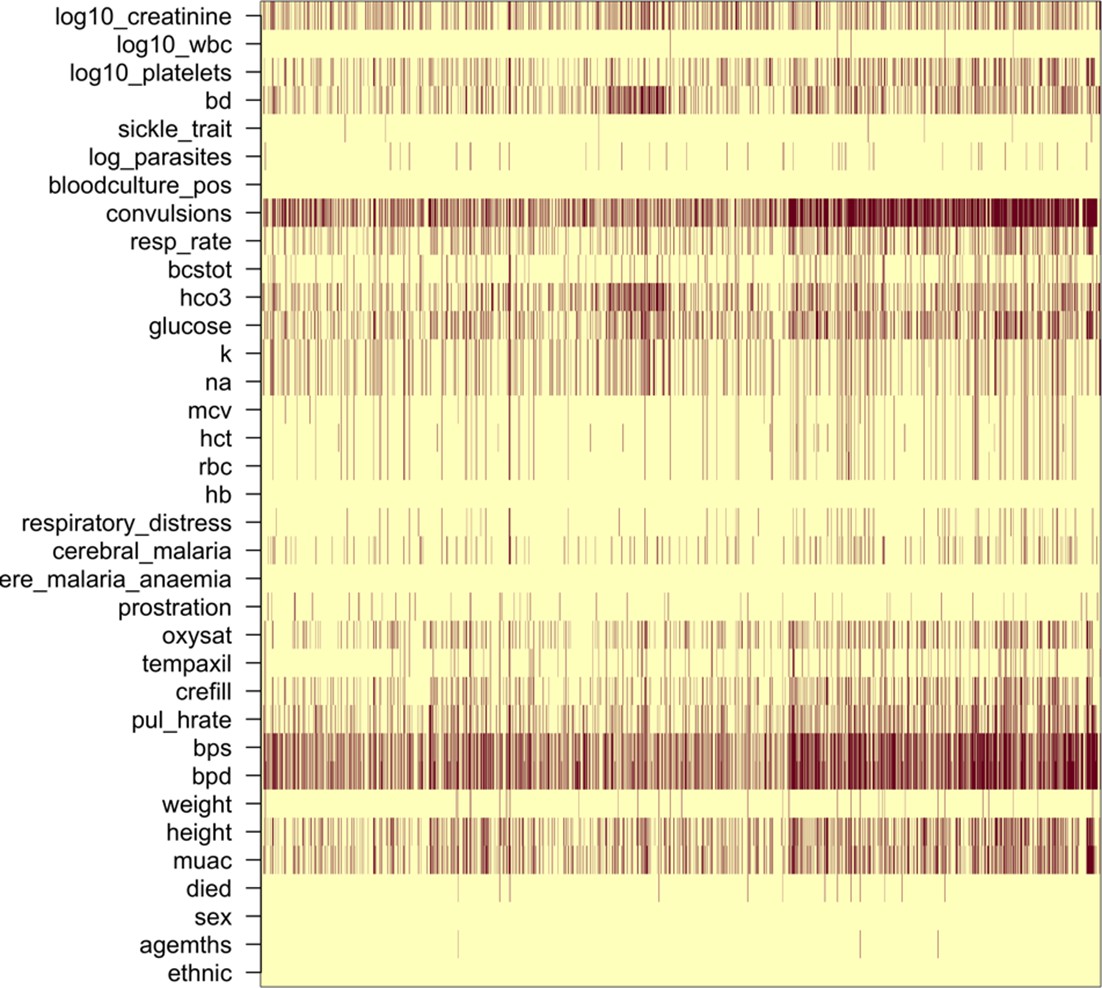
Missing clinical data in the 2220 Kenyan children diagnosed with severe malaria (red: missing; yellow: recorded).
Appendix 8—figure 1
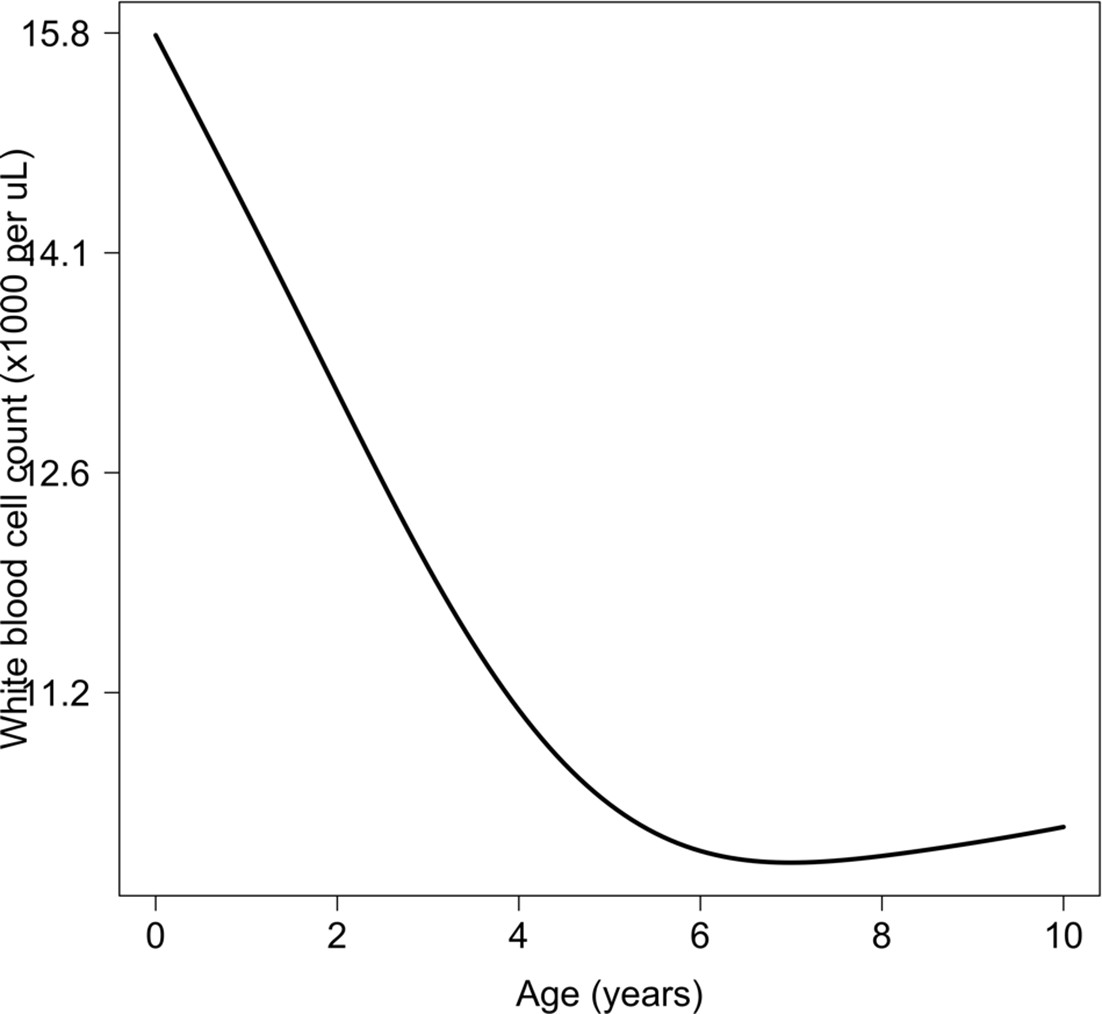
Relationship between age and mean white count (modelled on the log10 scale).
This is estimated from 858 children in the FEAST trial who had white counts available using an additive linear model ( for the smooth spline term). We used this model to adjust observed log10 white counts in all children less than 5 years of age in the reference and Kenyan datasets.
Appendix 9—figure 1
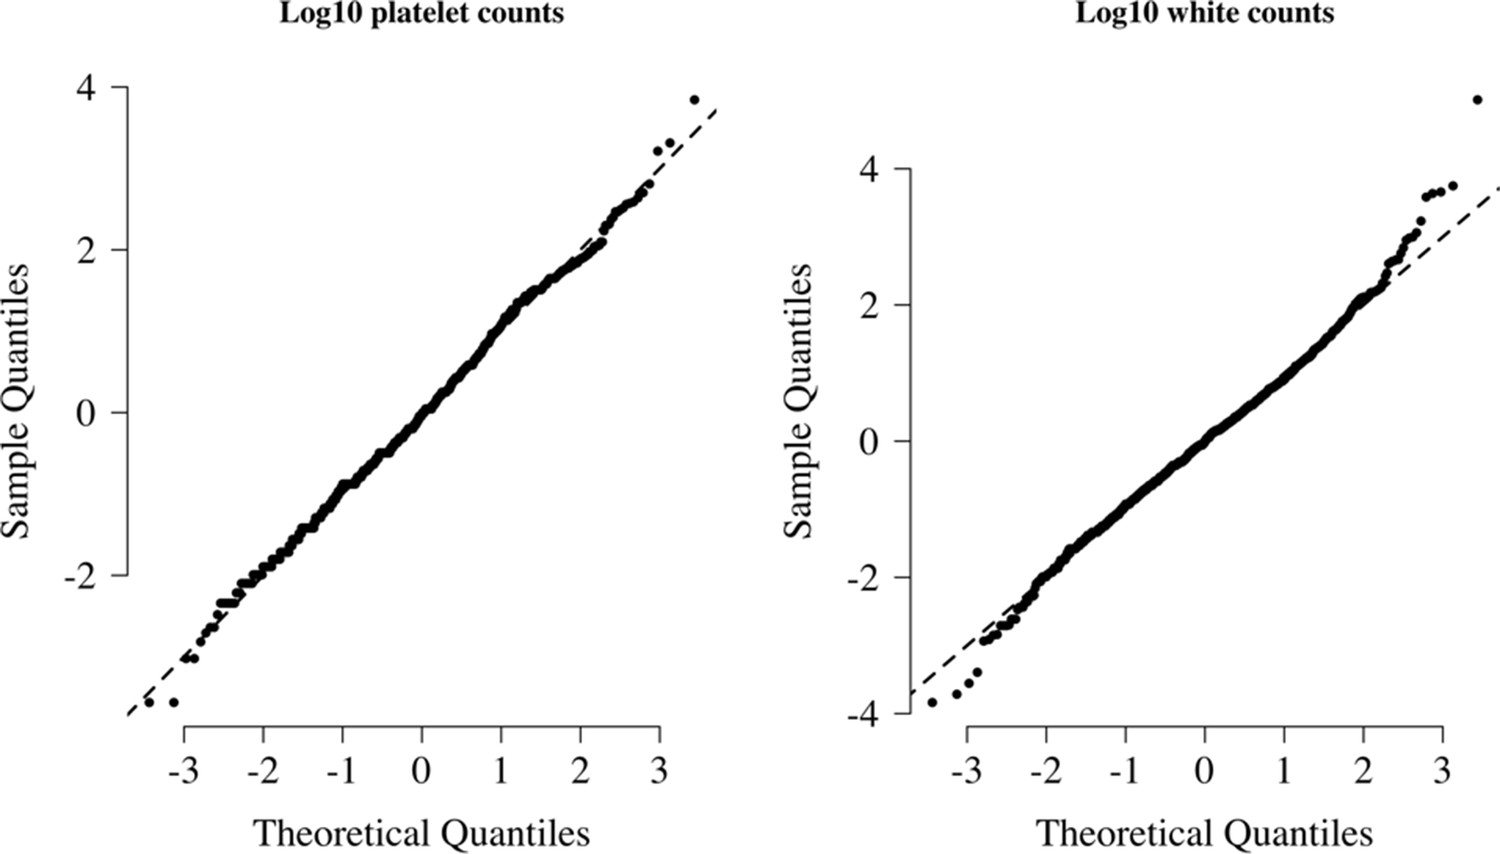
Normal-quantile plots for platelet counts and white blood cell counts in the reference data.
Both were standardised to have mean 0 and standard deviation of 1 on the log10 scale. The diagonal lines show the identity line.
Appendix 10—figure 1
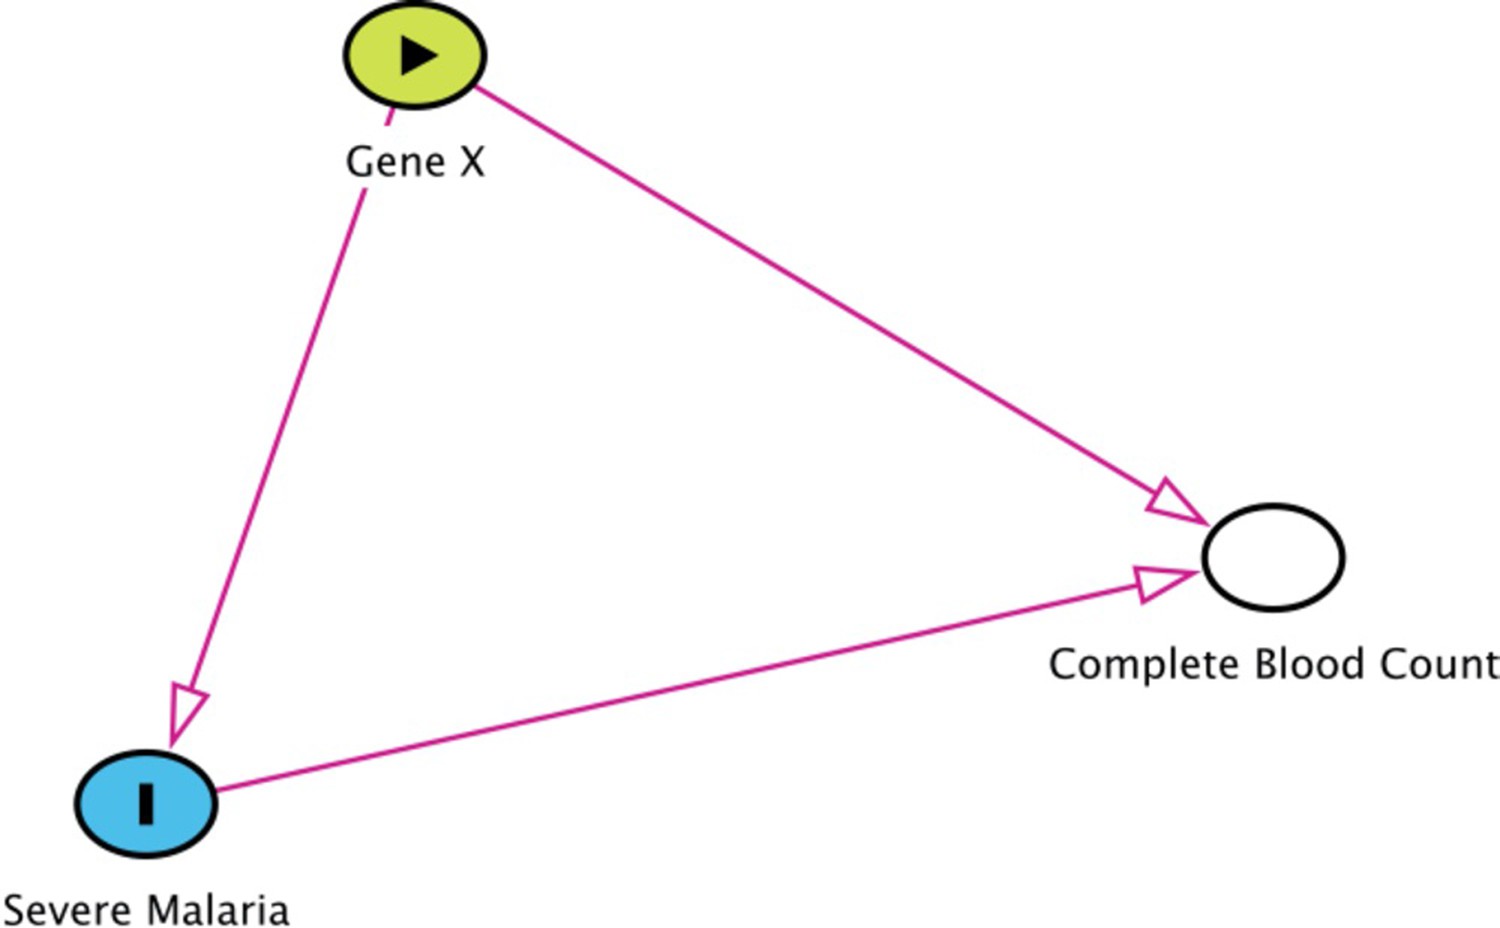
Collider bias in the diagnostic model of severe malaria based on complete blood count data.
HBB in its homozygous S form (HbSS, <1% prevalence in this Kenyan population) is a rare example of how this can occur. Children with HbSS have white counts above 2–3 times higher than the normal population and slightly lower platelet counts (Sadarangani et al., 2009). Under the probabilistic model, all 11 children with HbSS were classified as having a low probability of severe malaria, based on their high white counts (mean 40,000 per μL). These probabilities cannot be taken at face value, and it remains an unanswered question whether children with HbSS are more or less susceptible than their wild-type counterparts (Williams and Obaro, 2011).
Appendix 10—figure 2

The relationship between HbSS and the estimated probabilities of severe malaria under the diagnostic model.
There were 11 children with HbSS and they all had low probabilities of severe malaria, but this is biased as these children have chronic inflammation with white counts 2–3 higher than the general population (Sadarangani et al., 2009) (see above Appendix 10—figure 1 for the causal diagram showing collider bias).
Appendix 11—figure 1
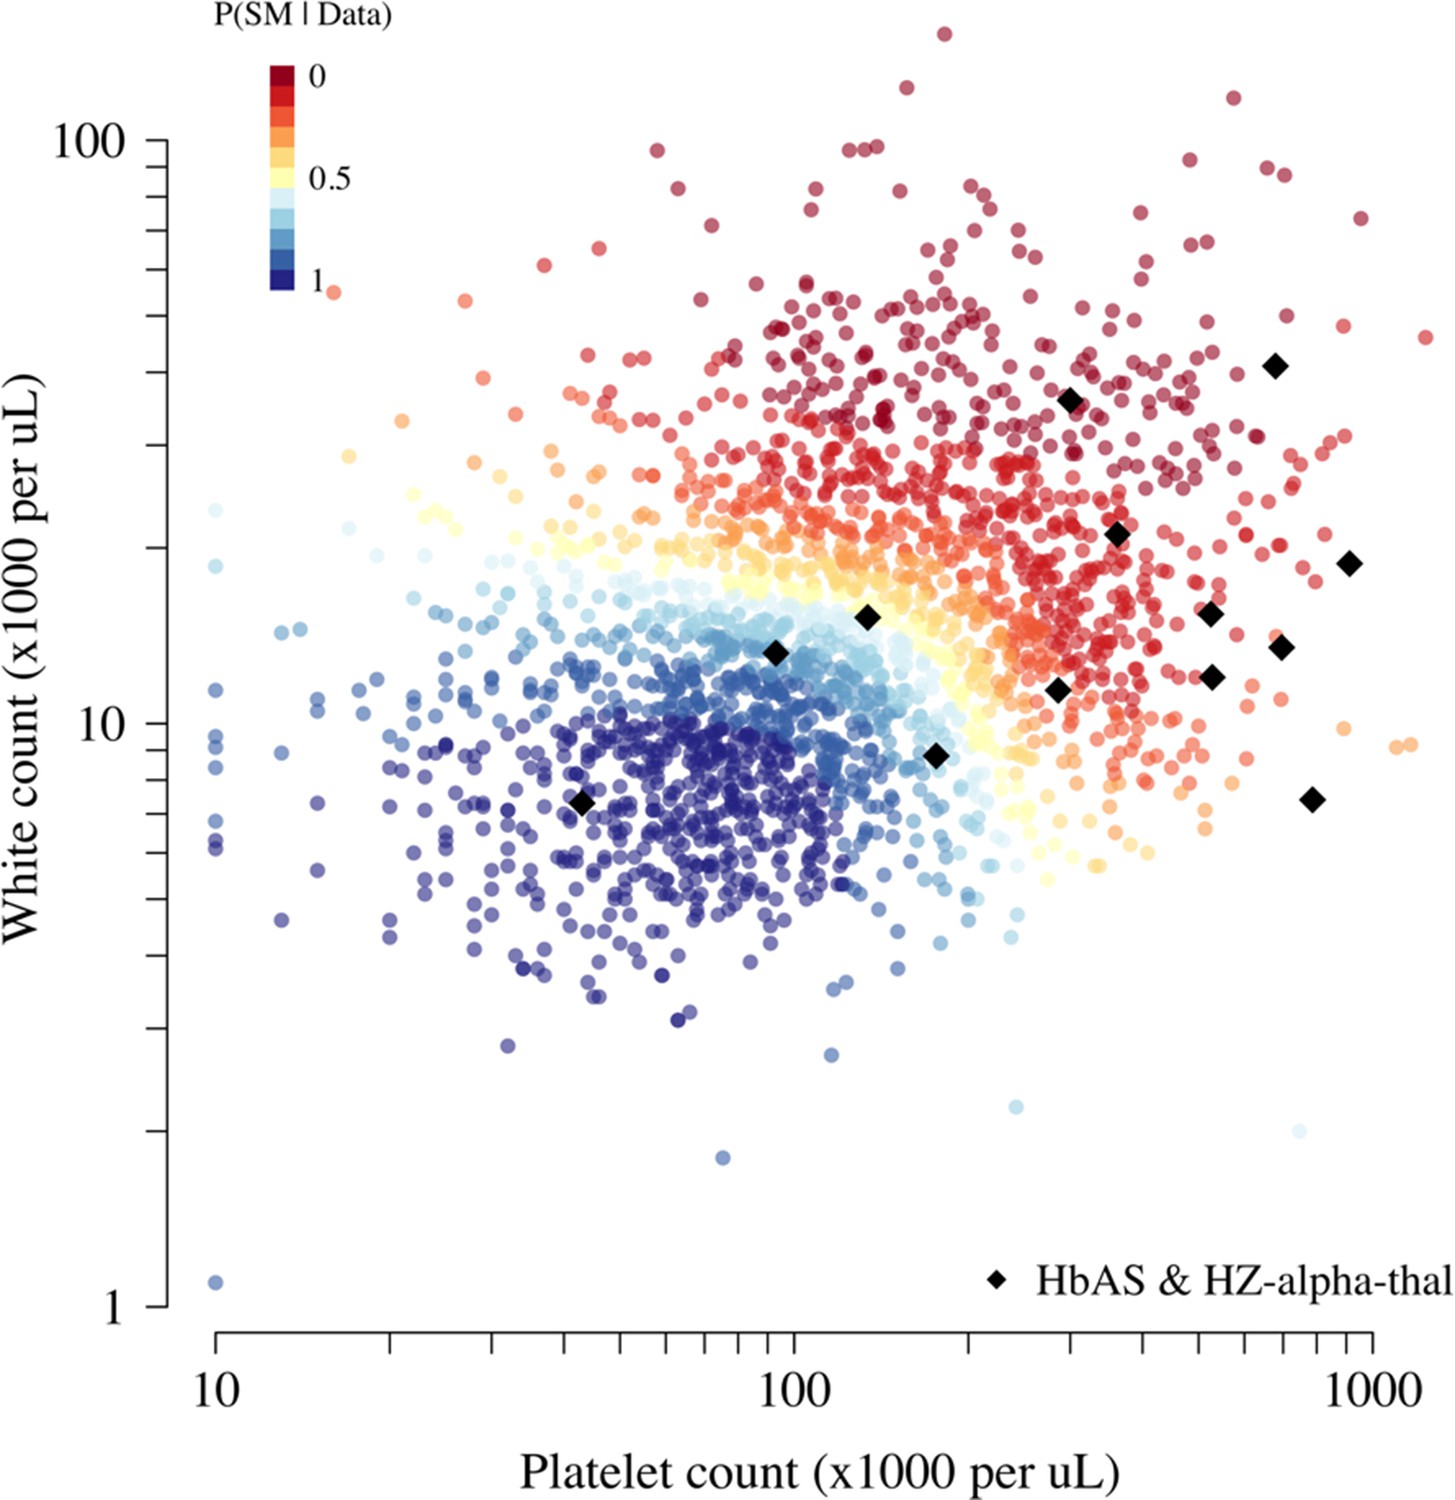
Scatter plots of platelet counts versus white blood cell counts for the Kenyan cohort, showing the 13 individuals with the double mutation HbAS and homozygous -thalassaemia as large black diamonds (HZ-alpha-thal).
The red-yellow-blue colour scheme is proportional to the P(Severe malaria | Data) as given by the legend in the top-left corner.
Appendix 12—figure 1
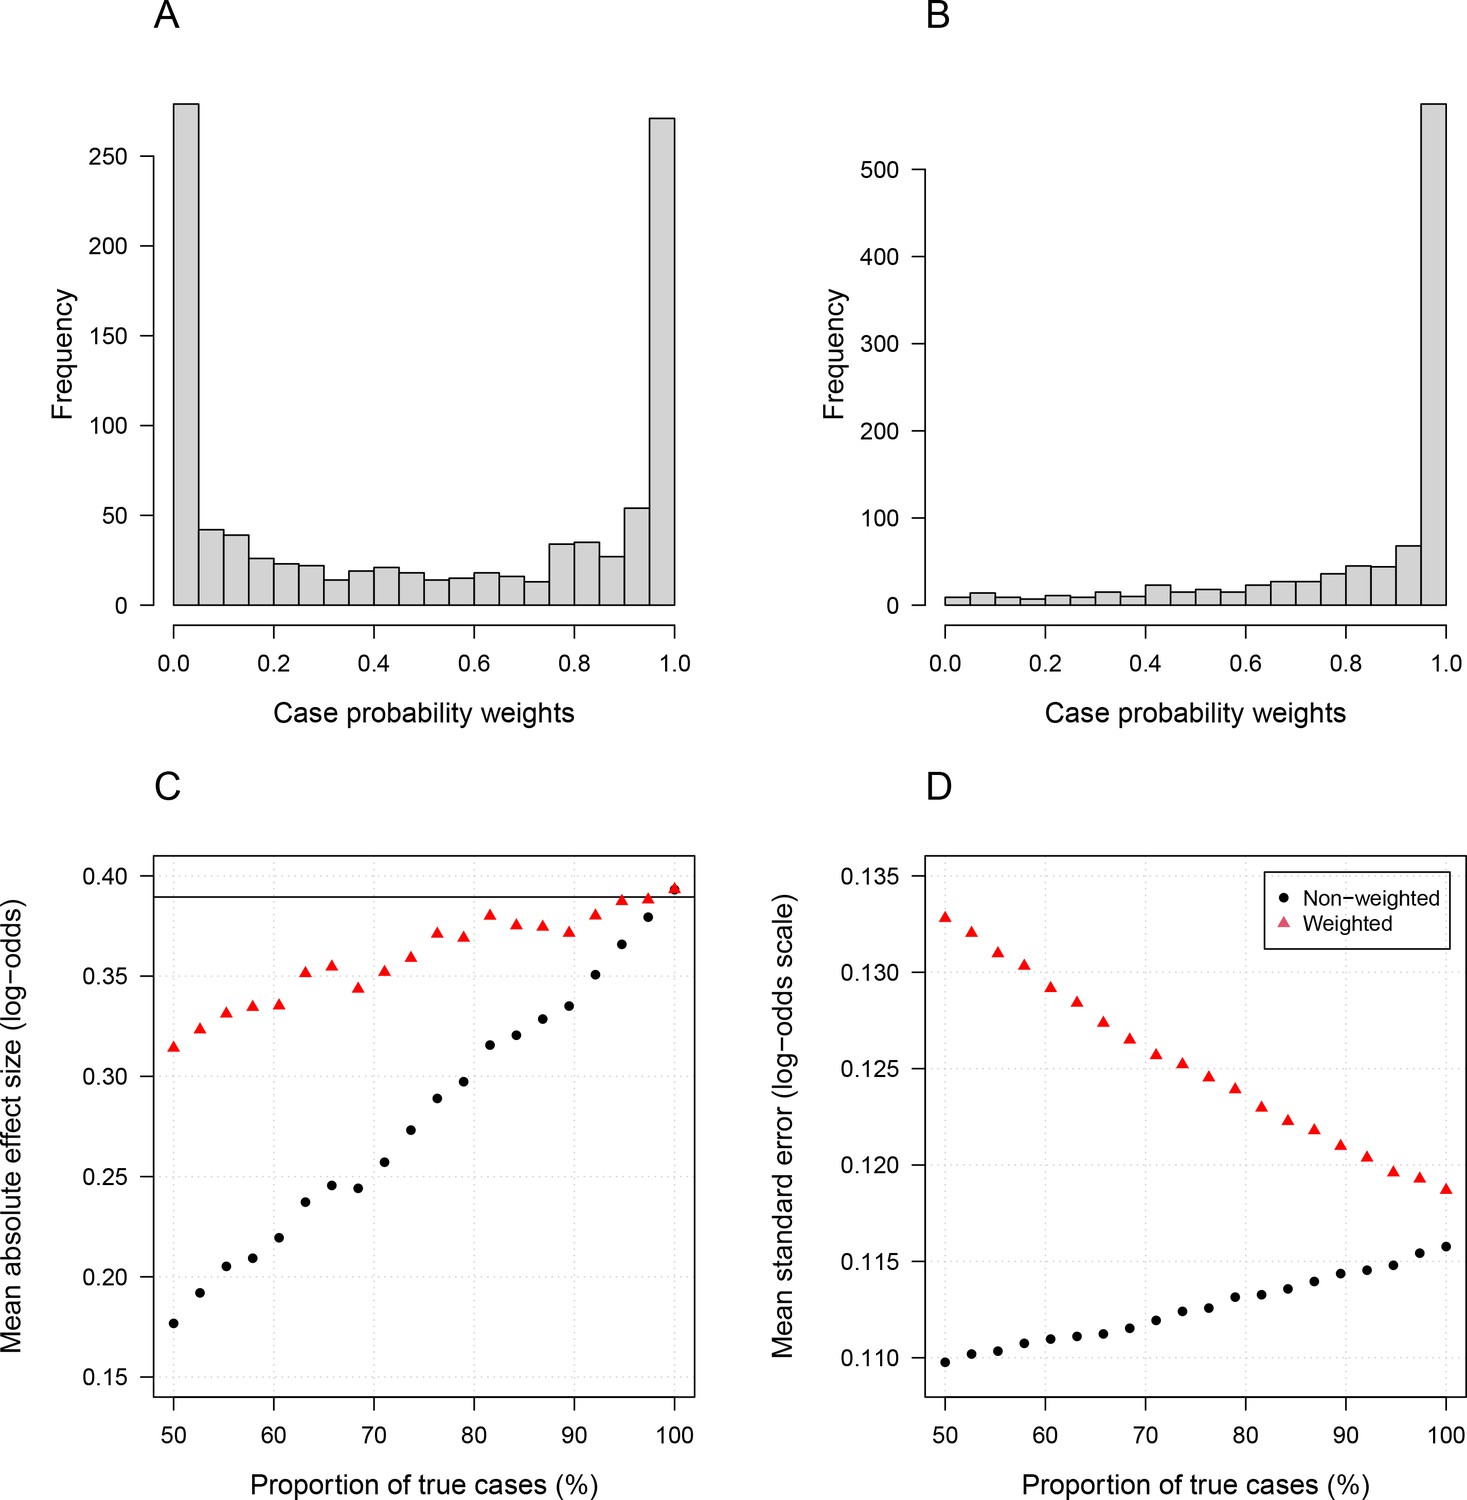
Simulation study demonstrating how likelihood re-weighting can improve estimation accuracy in case-control studies.
Panels (A) and (B) show histograms of the case probability weights used in the simulations for the scenarios when 50% of cases are true cases and when 100% of cases are true cases, respectively. Panel (C) shows the estimated effect sizes as a function of the proportion of mis-classified cases. Panel (D) shows the standard errors of effect estimates as a proportion of mis-classified cases.
Appendix 12—figure 2
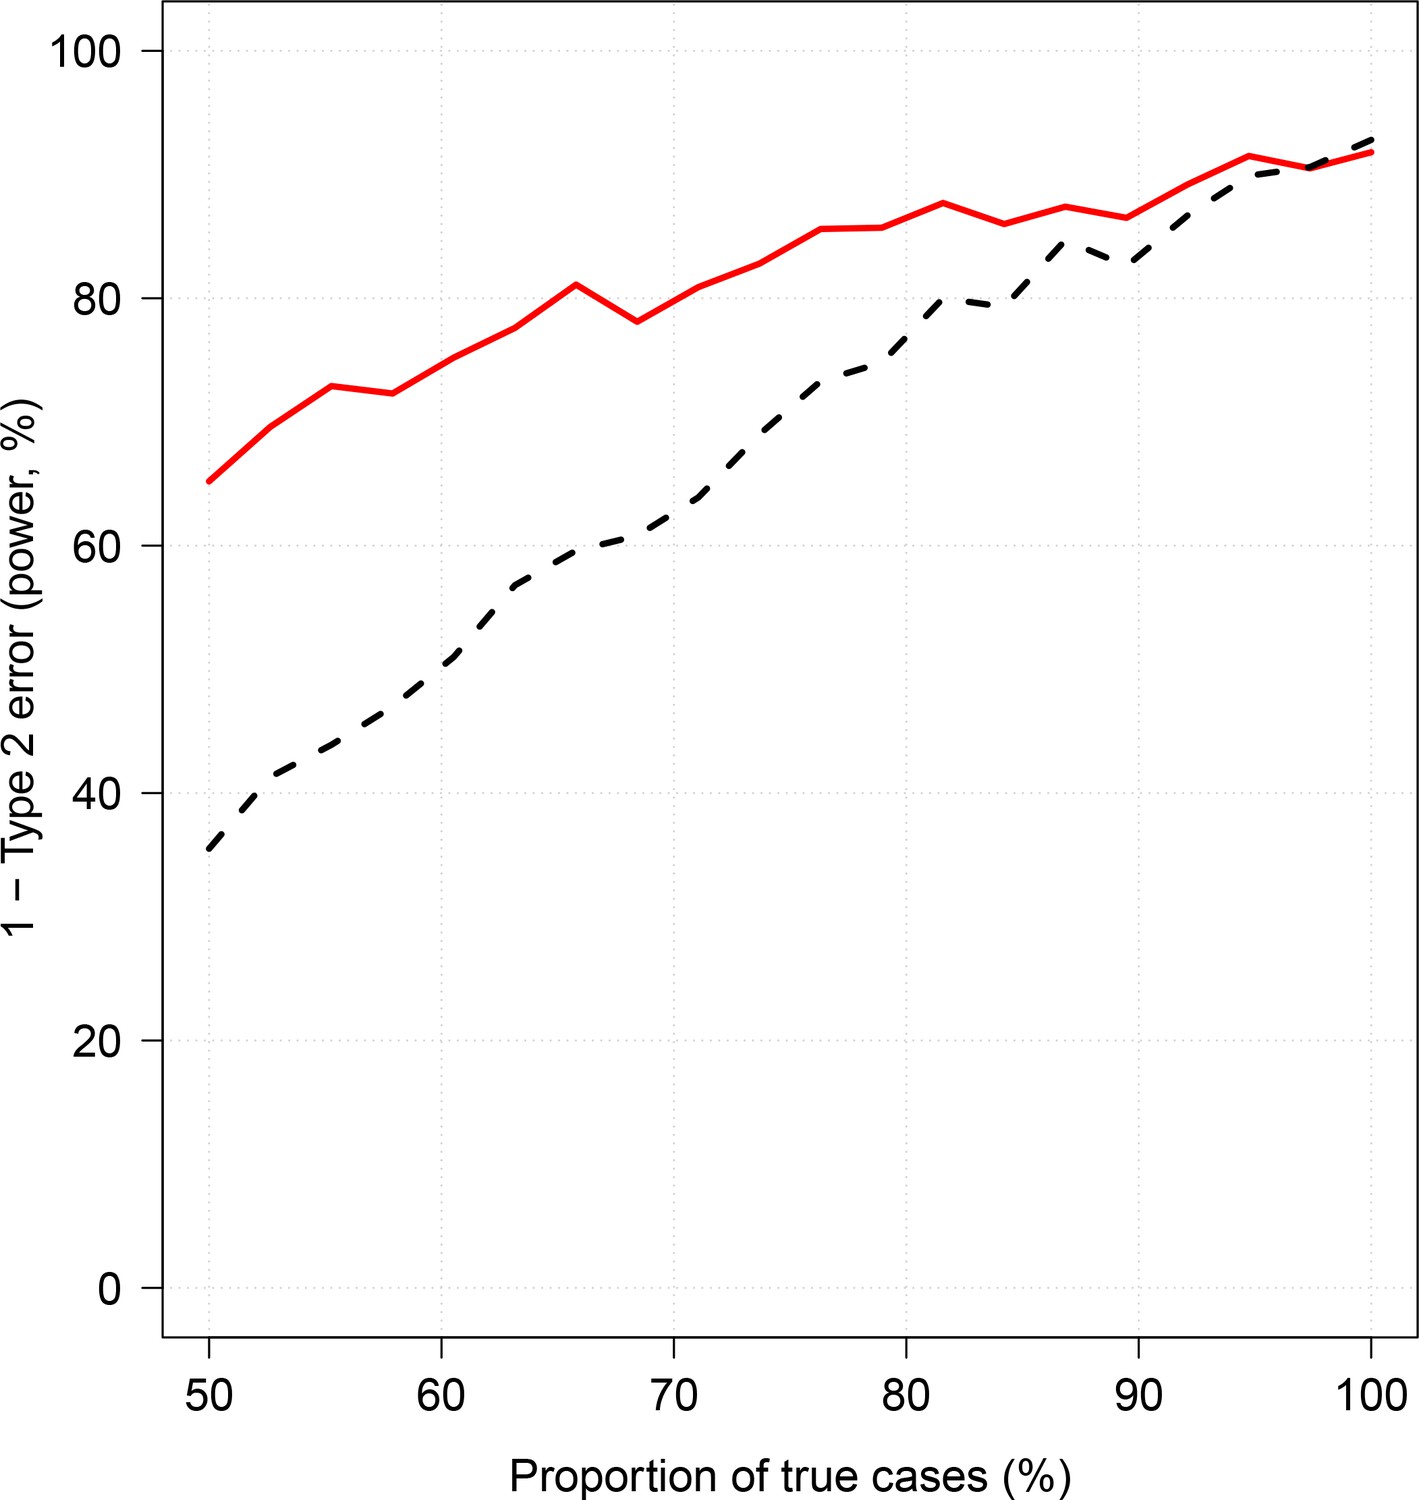
Effect of case re-weighting on power (1-type 2 error).
The thick red line shows the estimated power for the re-weighted approach; the dashed black line shows the estimated power for the non-weighted approach.
Appendix 13—figure 1
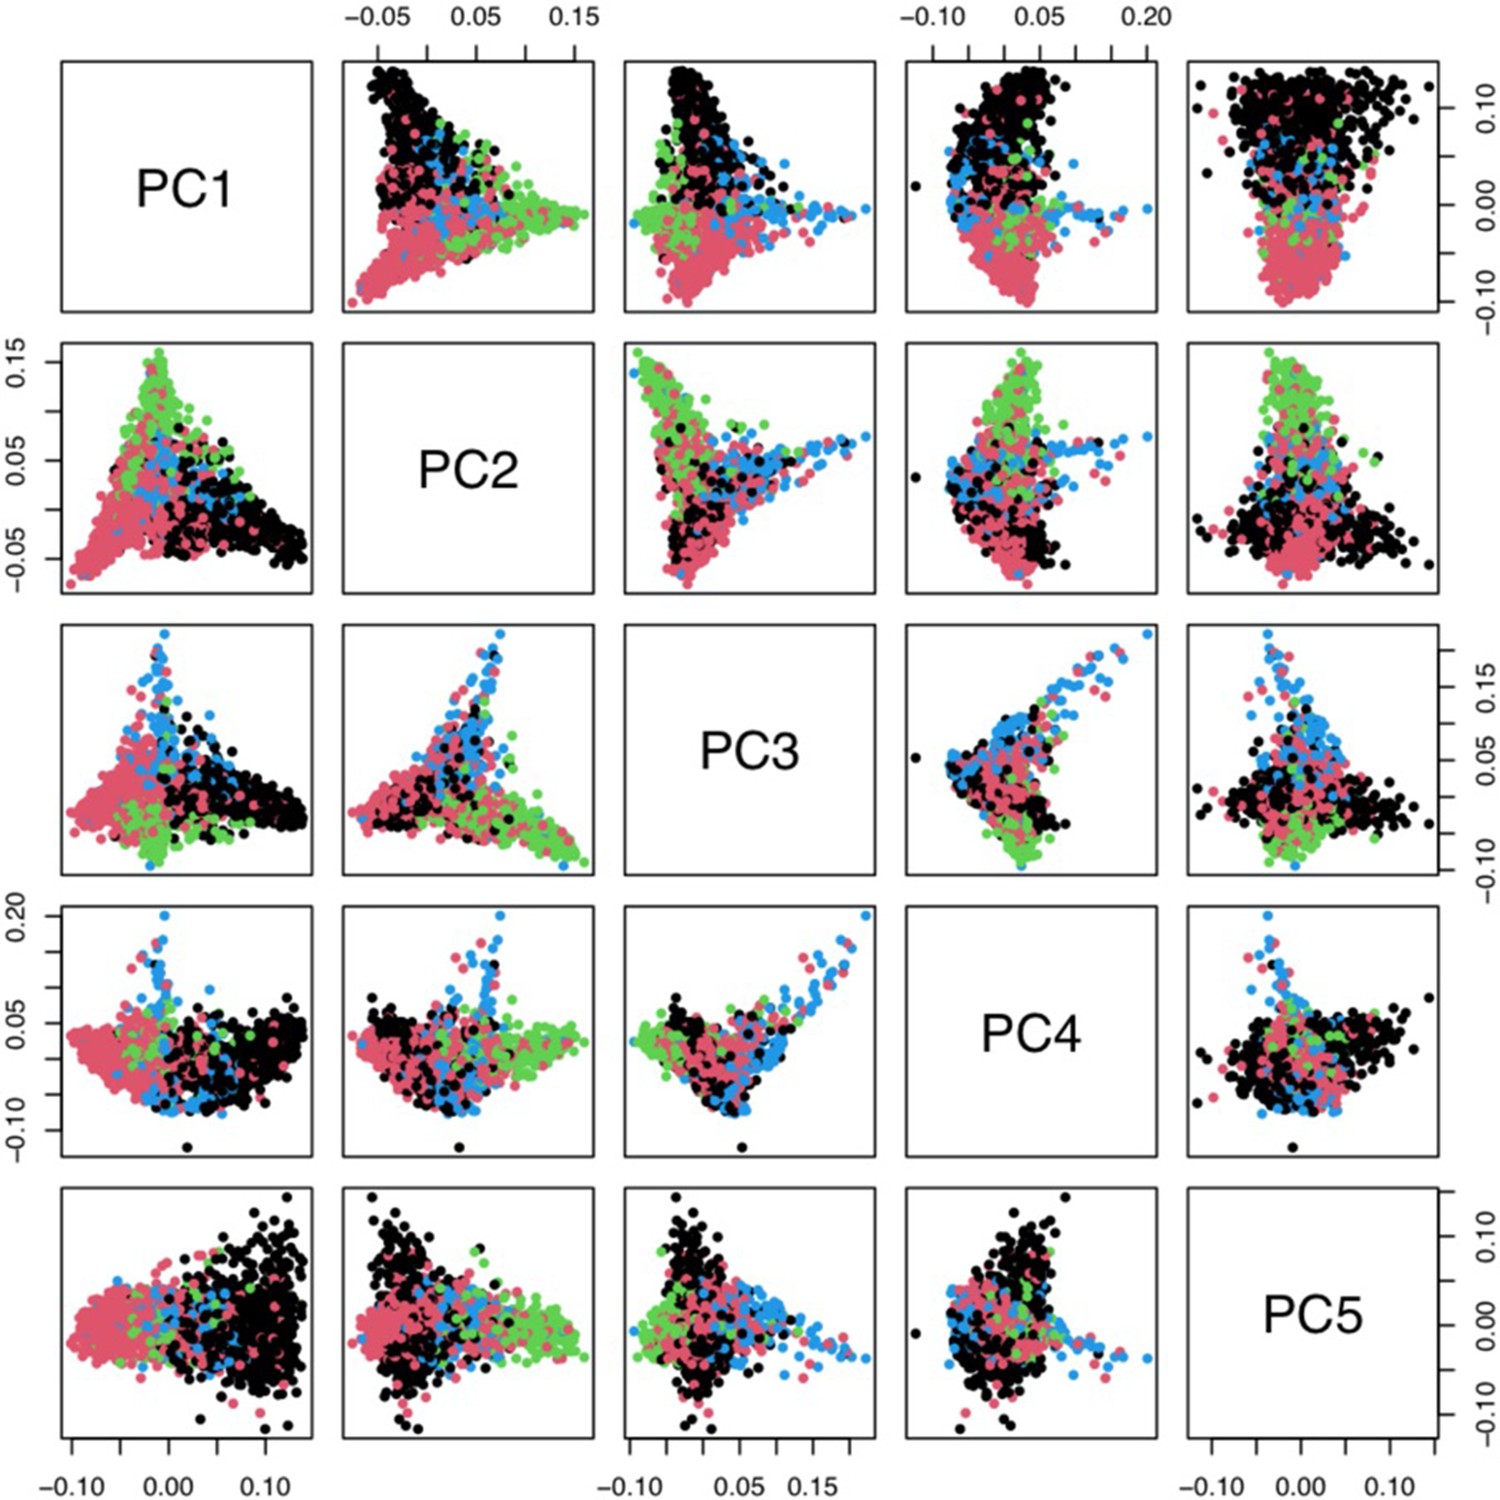
Principal components analysis of 1666 Kenyan cases and 1606 population controls.
The colours show the main self-reported ethnicities (black: Chonyi; red: Giriama; green: Kauma; blue: other). The first five principal components were used to stratify for population structure in the GWAS analyses.
Tables
Table 1
Summary of severe disease datasets used in our analyses.
For age and parasite density, we show the median values as the distributions are highly skewed. *For the FEAST trial, the severe malaria reference dataset only included platelet and white count data from the 121 patients who had PfHRP2 >1000 ng/mL and >1000 parasites per μL. IQR: interquartile range.
| Bangladesh-Thailand | Vietnam | FEAST (Uganda) | Kenya | |
|---|---|---|---|---|
| Description | Observational studies of severe malaria | Randomised controlled trials in severe malaria | Randomised controlled trial in severe febrile illness | Observational severe malaria cohort |
| Purpose | Reference data | Reference data | Reference data* and Figure 1B | Testing data |
| Published references | Leopold et al., 2019 | Hien et al., 1996; Phu et al., 2010 | Maitland et al., 2011 | MalariaGEN Consortium et al., 2018 |
| 653 | 930 | 567 | 2220 | |
| Age (years, range) | 28 (2–80) | 30 (15–79) | 2.1 (0–12) | 2.3 (0–13) |
| Parasite density (per μL, IQR) | 48,984 (8289–187,395) | 83,084 (13,047–316,512) | 400 (0–53,200) | 72,000 (6208–315,250) |
| Mortality (%) | 18.2 | 12.9 | 11.3 | 11.6 |
Additional files
Download links
A two-part list of links to download the article, or parts of the article, in various formats.
Downloads (link to download the article as PDF)
Open citations (links to open the citations from this article in various online reference manager services)
Cite this article (links to download the citations from this article in formats compatible with various reference manager tools)
Improving statistical power in severe malaria genetic association studies by augmenting phenotypic precision
eLife 10:e69698.
https://doi.org/10.7554/eLife.69698


