Lipid kinases VPS34 and PIKfyve coordinate a phosphoinositide cascade to regulate retriever-mediated recycling on endosomes
- Life Sciences Institute and Department of Cellular and Developmental Biology, University of Michigan, United States
- INSERM U1048 I2MC, France and Université Paul Sabatier, France
- Department of Internal Medicine, and Department of Molecular Biology, University of Texas Southwestern Medical Center, United States
- Division of Oncology Research and Schulze Center for Novel Therapeutics, Mayo Clinic, United States
- Neuroscience Graduate Program, Molecular and Behavioral Neuroscience Institute, Molecular and Integrative Physiology, University of Michigan, United States
Figures
Figure 1 with 3 supplements

PIKfyve positively regulates cell migration in part via regulation of cell surface levels of β1-integrin.
(A–B) Inhibition of PIKfyve delays cell migration. (A) Wound healing was assessed in HeLa cells following a 27 hr incubation in the presence of either DMSO, 1 µM apilimod, or 0.8 µM YM201636. (B) Percentage of wound closure was quantified. Bar: 100 µm. (C–D) Increasing PIKfyve activity promotes cell migration. (C) Wound healing assays were performed in Flp-in HEK293T cells stably expressing doxycycline-inducible wild-type PIKfyve or hyperactive PIKfyve-KYA in the presence of 100 ng/ml doxycycline for 12 hr. (D) Percentage of wound area closure was quantified. Bar: 100 µm. (E–G) Inhibition of PIKfyve decreases the surface levels of β1-integrin. (E) HeLa cells treated with DMSO or 1 µM apilimod for 1 hr were incubated with antibodies to label surface β1-integrin for 1 hr at 4°C and fixed at 4°C. (F) Intensity of β1-integrin per cell was quantified and normalized to the average intensity of the DMSO treatment for that particular experiment. Bar: 20 µm. (G) HeLa cells treated with DMSO or 1 µM apilimod for 1 hr were incubated with antibodies to label surface β1-integrin for 1 hr at 4°C followed by incubation with 488 Alexa-Fluor-conjugated secondary antibodies for 30 min at 4°C. Cells were fixed and 10,000 cells were analyzed per experiment by flow cytometry. The mean intensity of surface β1-integrin was measured and values normalized to DMSO treatment. (H–I) Increasing PIKfyve activity elevates the surface levels of β1-integrin. (H) HeLa cells either untransfected or transiently transfected with 6xHA-PIKfyve or 6xHA-PIKfyve-KYA incubated for 1 hr at 4°C with antibodies to label surface β1-integrin. Cells were fixed, permeabilized, immunostained with an anti-HA antibody and corresponding Alexa-Fluor-conjugated secondary antibodies. (I) Intensity of β1-integrin per cell was quantified and the values were normalized to the average intensity of untransfected cells for each experiment. Bar: 20 µm. Data presented as mean ± SE. Statistical significance from three independent experiments were determined using unpaired two-tailed Student’s t-test (F) or paired two-tailed Student’s t-test (G) or one-way ANOVA and Dunnett’s (B) or Tukey’s (D,I) post hoc tests. Yellow lines indicate the migration front. *p < 0.05, **p < 0.01, ***p < 0.005, ****p < 0.001, and ns, not significant.
-
Figure 1—source data 1
Contains numerical source data for Figure 1.
- https://cdn.elifesciences.org/articles/69709/elife-69709-fig1-data1-v2.zip
Figure 1—figure supplement 1
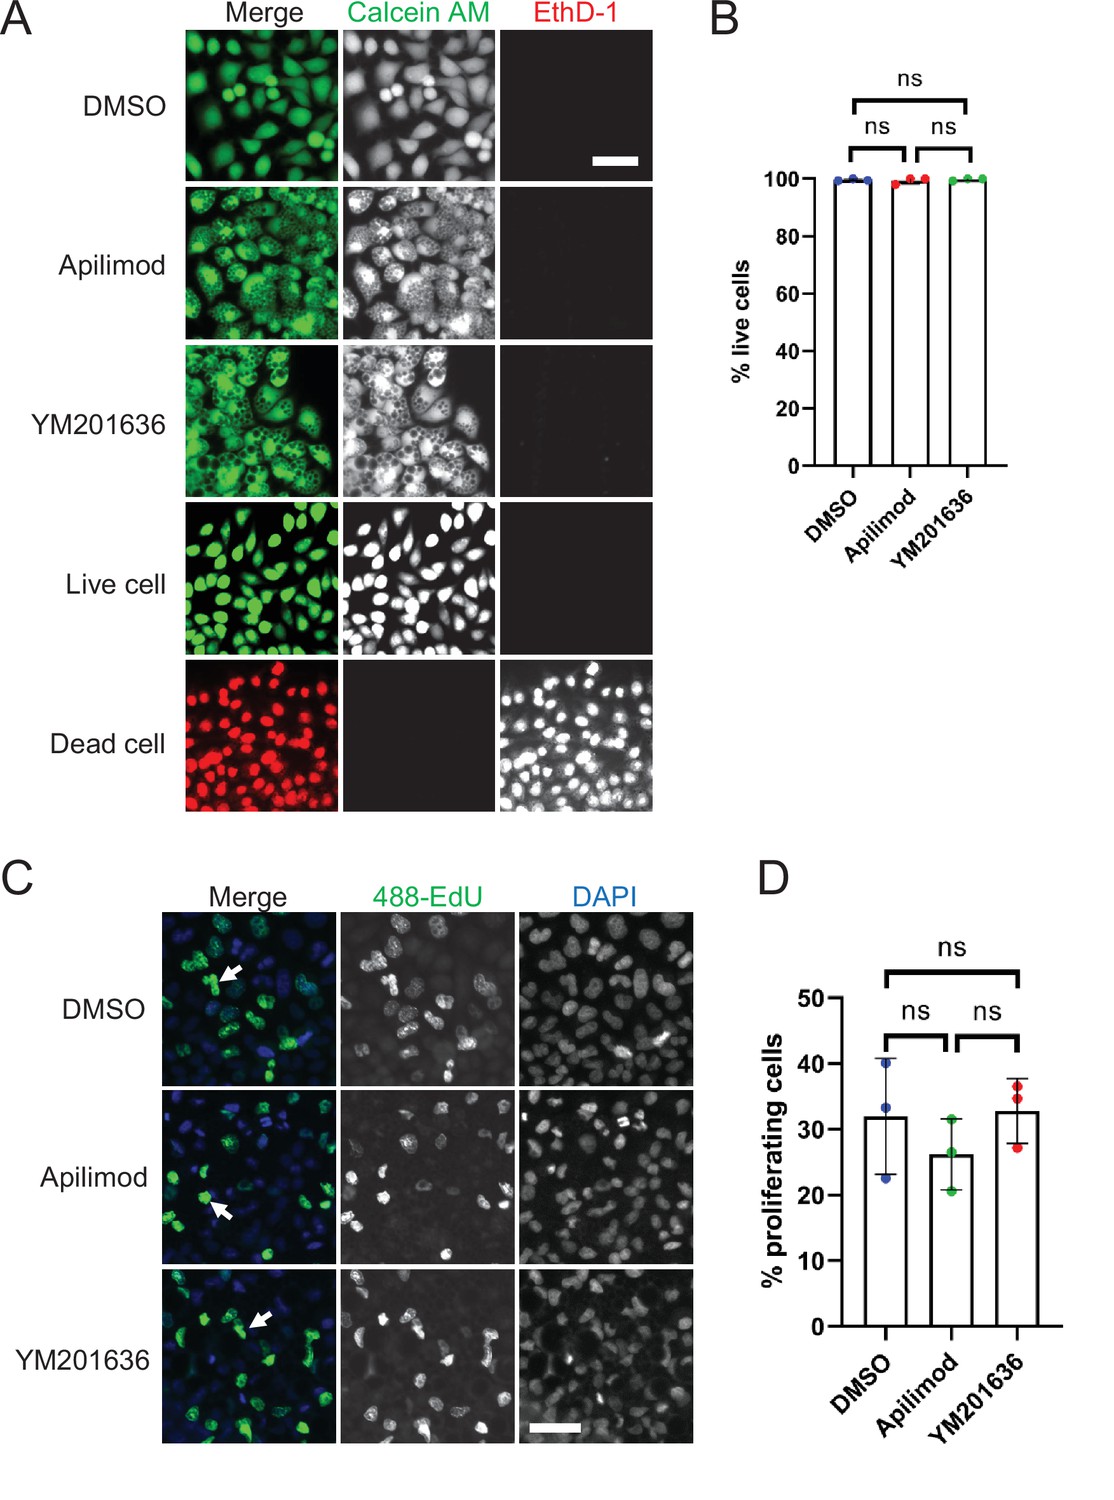
Inhibition of PIKfyve does not affect cell viability or proliferation.
(A–B) Cell viability was assessed for HeLa cells that were either treated with DMSO, 1 µM apilimod, or 0.8 µM YM201636 for 27 hr. Untreated cells and cells treated with methanol for 20 min were used as live and dead cell controls, respectively. Percentage of live cells was quantified. (C) Cell proliferation was measured in HeLa cells treated with DMSO, 1 µM apilimod, or 0.8 µM YM201636 for 27 hr. (D) The percentage of proliferating cells in (C) was quantified. Data presented as the mean ± SE. Statistical significance from three independent experiments was analyzed using one-way ANOVA and Tukey’s post hoc tests (B, D). ns, not significant. Bar: 100 µm.
-
Figure 1—figure supplement 1—source data 1
Contains numerical source data for Figure 1—figure supplement 1.
- https://cdn.elifesciences.org/articles/69709/elife-69709-fig1-figsupp1-data1-v2.zip
Figure 1—figure supplement 2
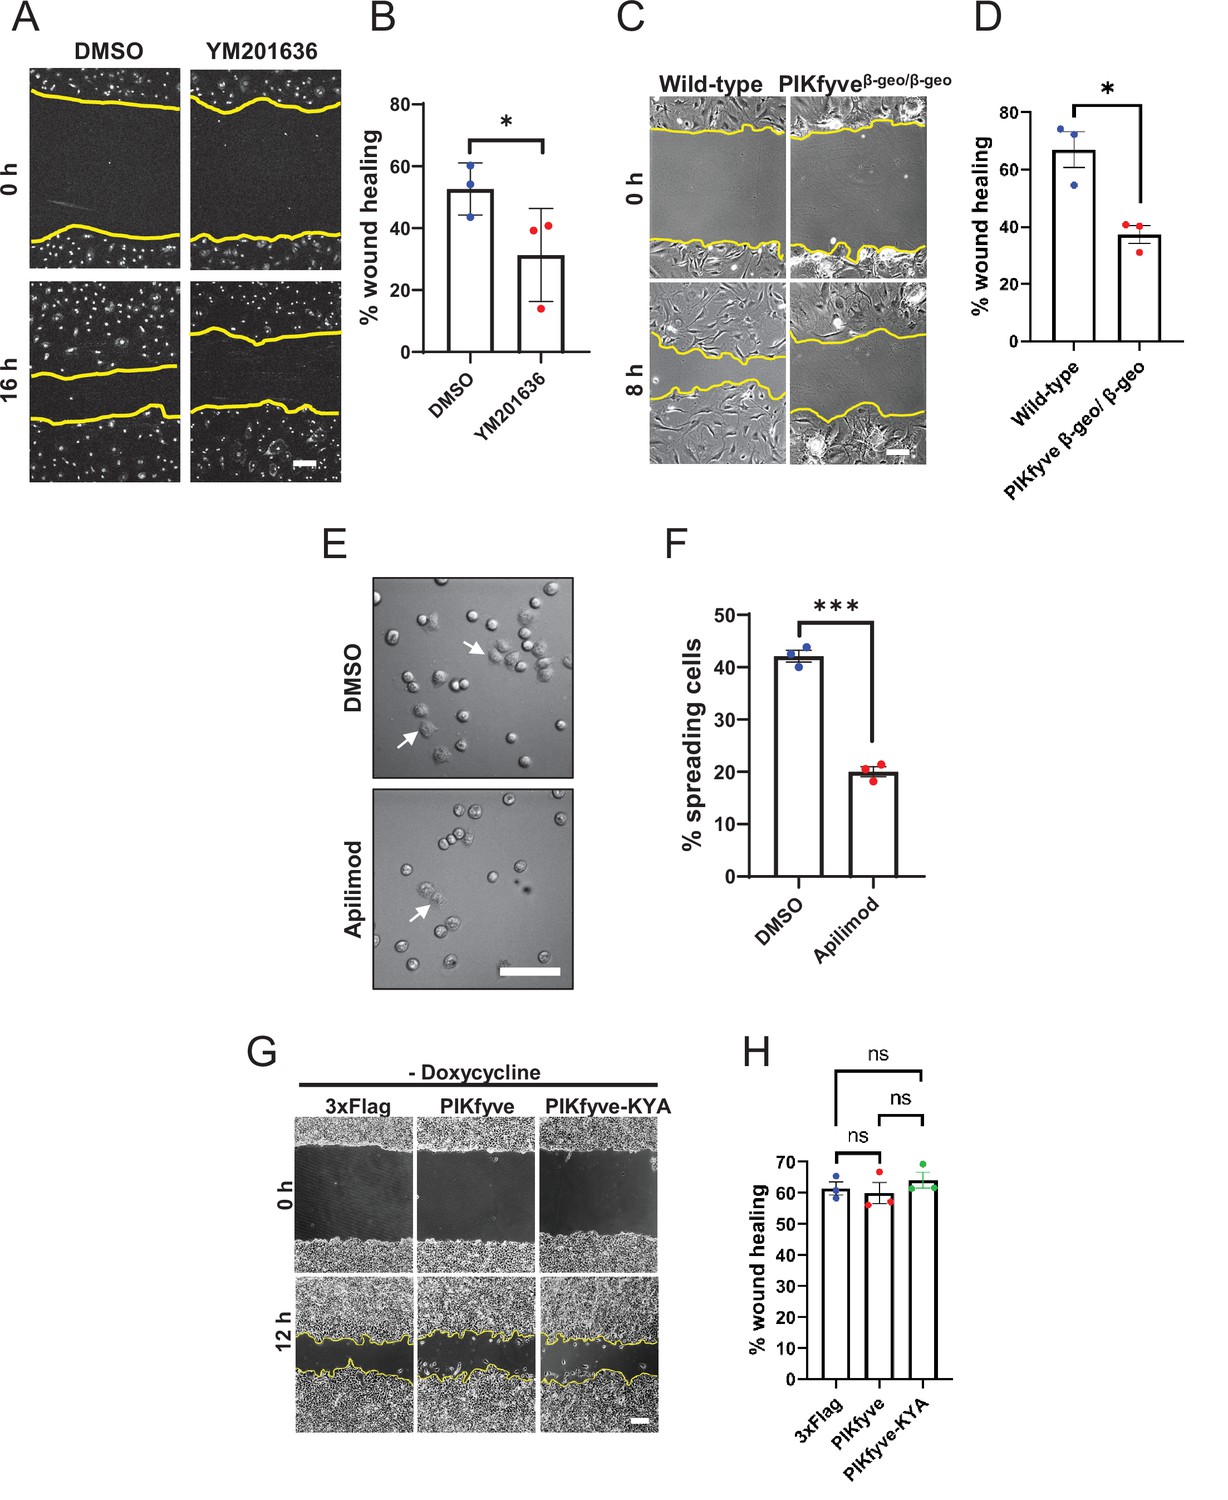
PIKfyve is required for cell migration and cell adhesion.
(A–D) PIKfyve is required for cell migration. (A) Wound healing assays were performed on primary neonatal cardiac fibroblasts in the presence of DMSO or 0.8 µM YM201636 for 16 hr. (B) Percentage of wound closure was quantified. (C) Wound healing assays were performed for 8 hr on primary mouse embryonic fibroblast (MEF) cells derived from wild-type and hypomorphic PIKfyveβ-geo/β-geo mice. (D) Percentage of wound area closure was quantified. (E–F) PIKfyve is required for cell spreading. (E) HeLa cells were trypsinized, seeded in media containing either DMSO or 1 µM apilimod and incubated for 1 hr. Arrows indicate examples of cells that exhibited spreading. (F) Percentage of cells that spread onto the surface were quantified. (G–H) Cell migration is not elevated when there is no induction of the hyperactive mutant of PIKfyve. Wound healing assays were performed on HEK293T cells stably expressing doxycycline-inducible wild-type PIKfyve or hyper-active PIKfyve-KYA in the absence of doxycycline for 12 hr. Percentage of wound area closure was quantified. Yellow lines indicate the migration front. Data presented as mean ± SE. Statistical significance from three independent experiments was determined using paired two-tailed Student’s t-Test (B, D, F) or one-way ANOVA and Tukey’s post hoc tests (H). ***p < 0.005, *p < 0.05, and ns, not significant. Bar: 100 µm. Error bar, SE.
-
Figure 1—figure supplement 2—source data 1
Contains numerical source data for Figure 1—figure supplement 2.
- https://cdn.elifesciences.org/articles/69709/elife-69709-fig1-figsupp2-data1-v2.zip
Figure 1—figure supplement 3
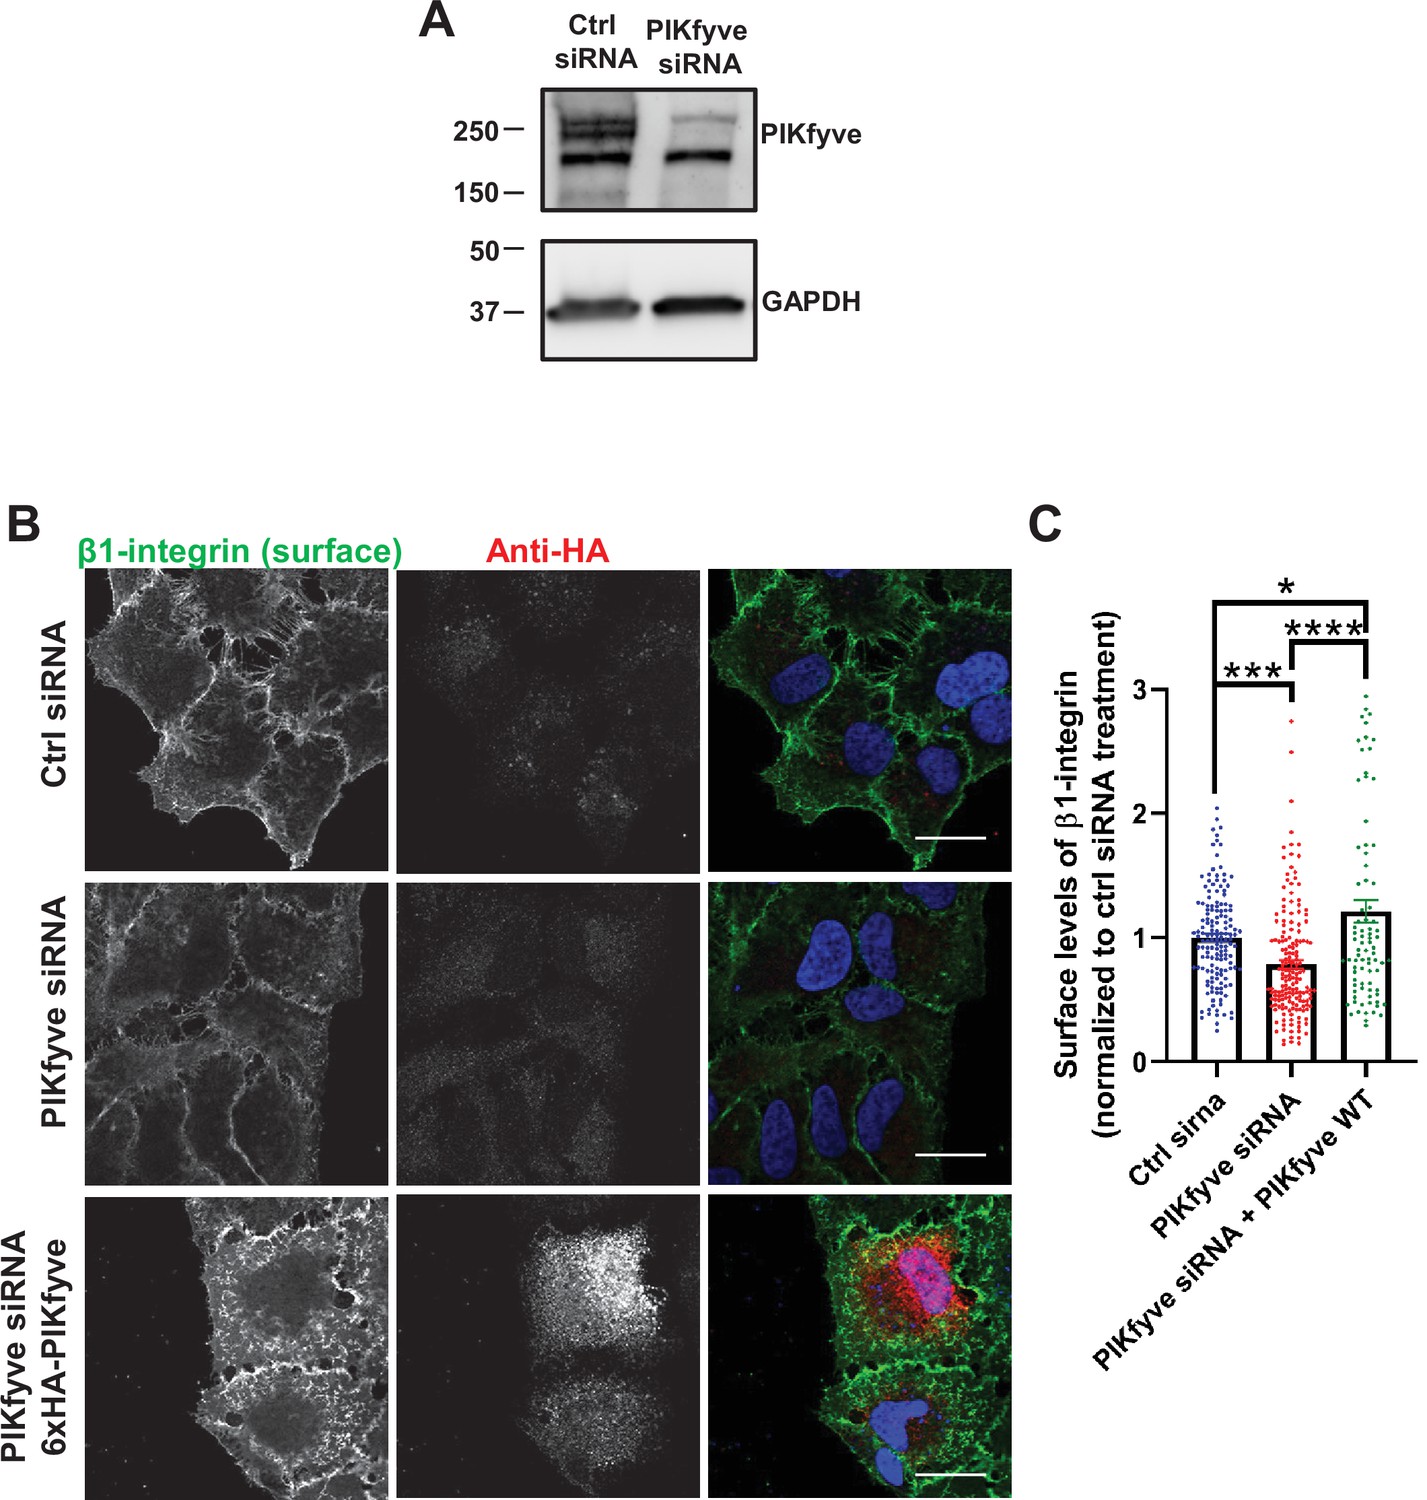
Depletion of PIKfyve results in a decrease of the surface levels of β1-integrins.
(A) HeLa cells were transfected with PIKfyve siRNA; PIKfyve siRNA that targets the 5’UTR region of PIKfyve was used. As a control, cells were transfected without oligos. After 3 days, cells were lysed and immunoblotted with antibodies to PIKfyve and GAPDH. (B) Expression of siRNA-resistant PIKfyve rescues the surface levels of β1-integrins. HeLa cells transfected with PIKfyve siRNA or no siRNA for 3 days were either untransfected or transfected with 6xHA-PIKfyve for the last 18 hr of transfection. Cells were then incubated with antibodies to β1-integrins for 1 hr at 4°C. Cells were fixed for 30 min at 4°C and analyzed by immunofluorescence. Bar: 20 µm. (C) The intensity of β1-integrin was quantified per cell and the values were normalized to the DMSO treatment. Data presented as mean ± SE. Statistical significance from three independent experiments were quantified with one-way ANOVA followed by Tukey’s post hoc. *p < 0.05, ***p < 0.005, and ****p < 0.001.
-
Figure 1—figure supplement 3—source data 1
Contains numerical and uncropped western blot source data for Figure 3—figure supplement 1.
- https://cdn.elifesciences.org/articles/69709/elife-69709-fig1-figsupp3-data1-v2.zip
Figure 2
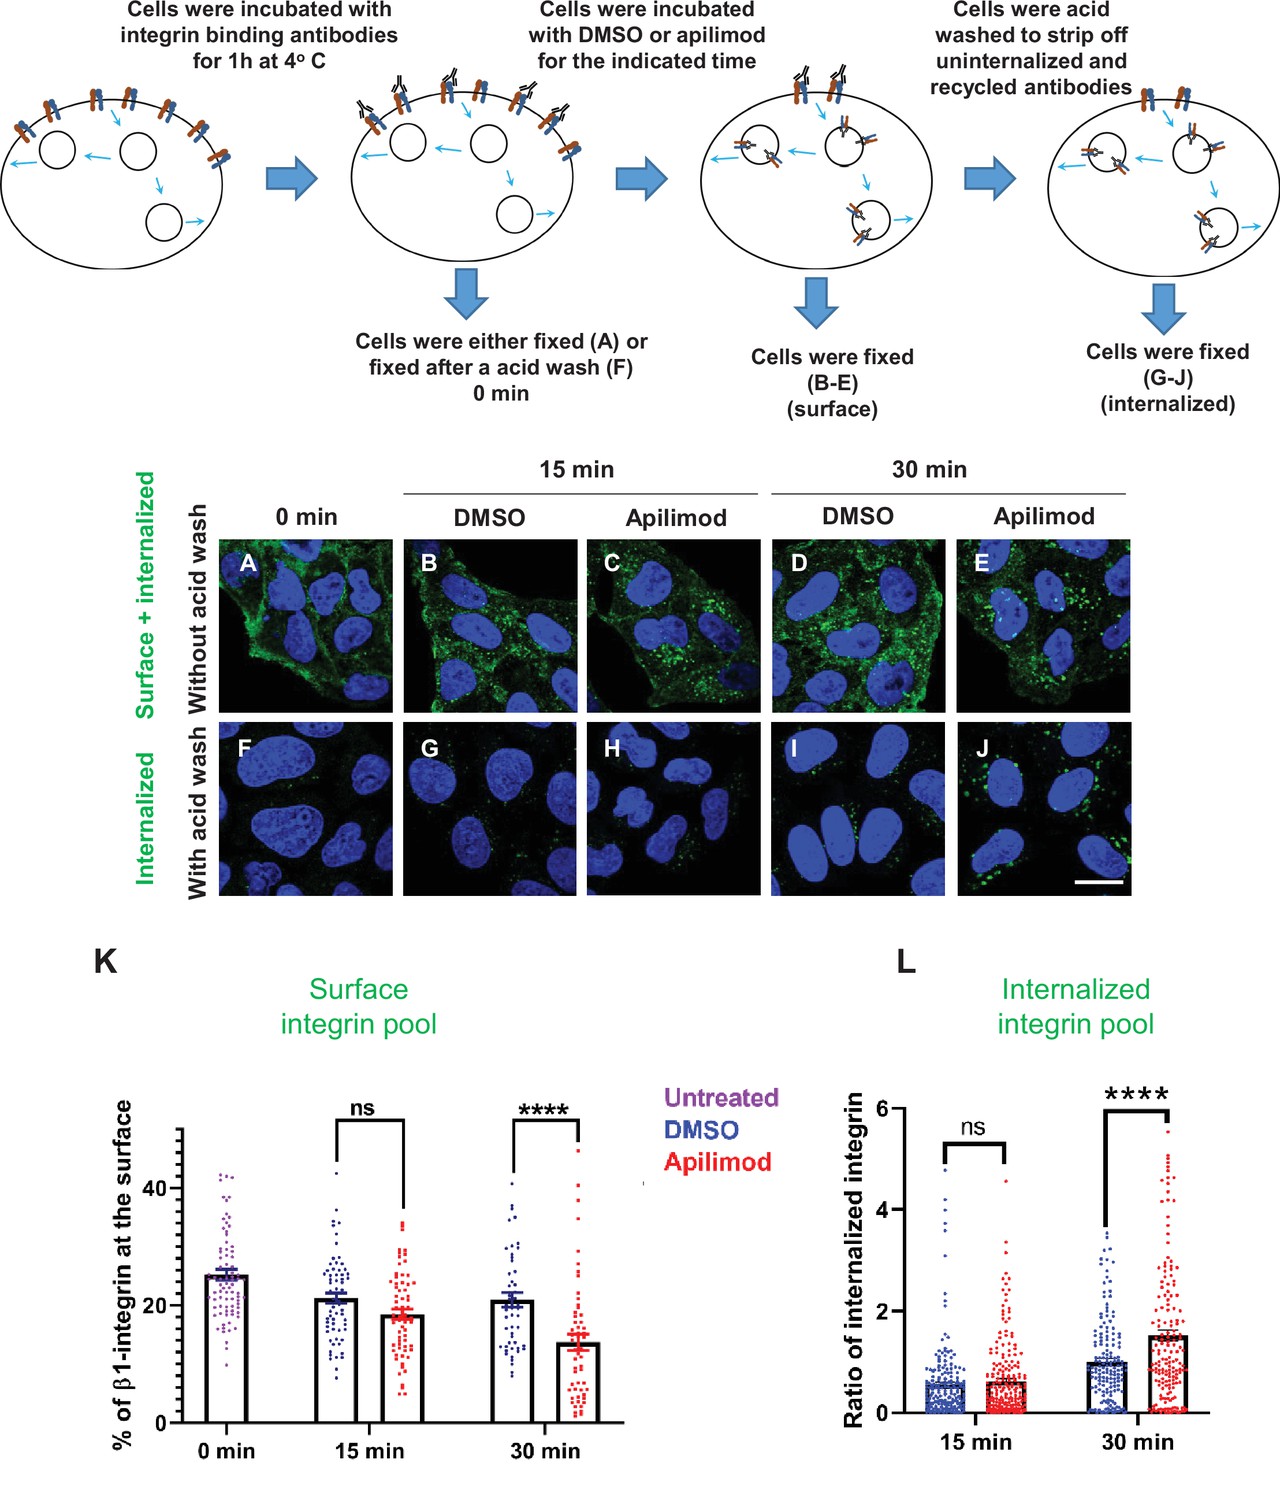
Inhibition of PIKfyve causes a rapid loss of β1-integrin from the cell surface and a concomitant accumulation of β1-integrin in internal compartments.
(A–J) HeLa cells were incubated with antibodies to label surface β1-integrin for 1 hr at 4°C. Cells were either fixed (A), fixed after an acid wash (F), or incubated with media containing DMSO or 1 µM apilimod at 37°C for the indicated times. Following incubation, cells were fixed (B–E) or fixed after an acid wash (G–J). Fixed cells were permeabilized and immunostained with Alexa-Fluor-488-conjugated anti-mouse secondary antibodies. Flow diagram (top) outlines the experiment. (K) The surface levels of β1-integrin were inferred from the intensity of β1-integrin within 0.8 µm from the cell border. Surface β1-integrin (for images A–E) is reported as the percentage of the total labeled β1-integrin. (L) Internalized β1-integrin was quantified from cells treated as described in (G–J). β1-Integrin intensity was normalized to the average intensity of cells treated with DMSO for 30 min for each experiment. Data presented mean ± SE. Statistical significance from three independent experiments was analyzed using two-way ANOVA and Sidak’s multiple comparisons tests. (K–L). ****p < 0.001 and ns, not significant. Bar: 10 µm.
-
Figure 2—source data 1
Contains numerical source data for Figure 2.
- https://cdn.elifesciences.org/articles/69709/elife-69709-fig2-data1-v2.zip
Figure 3 with 1 supplement
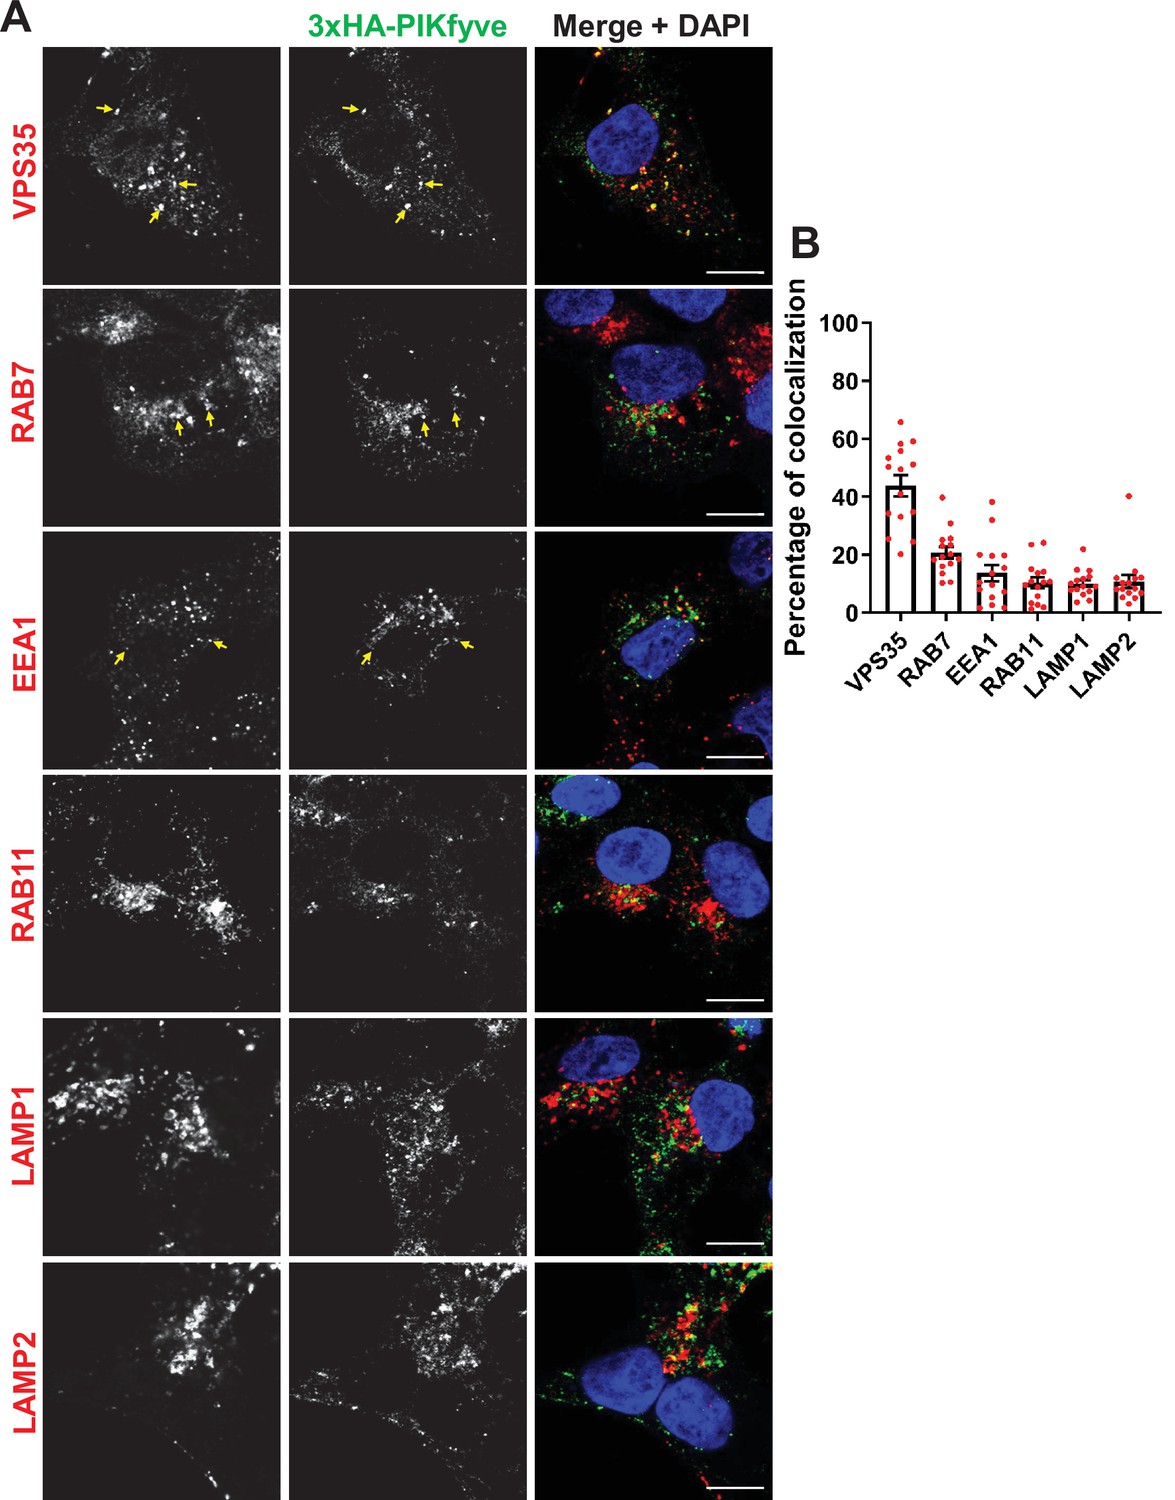
PIKfyve resides on early and late endosomes and exhibits the highest colocalization with VPS35 containing endosomes.
(A) HEK293 cells expressing 3xHA-endogenously tagged PIKfyve were fixed, permeabilized, and immunostained with antibodies against the HA tag and with antibodies against proteins associated with the retromer (VPS35), early endosomes (EEA1), late endosomes (RAB7), recycling endosomes (RAB11), or lysosomes (LAMP1 and LAMP2). Arrows indicate examples of puncta showing colocalization. Bar: 10 µm. (B) The percentage of PIKfyve that colocalizes with the indicated proteins was determined using Mander’s colocalization coefficient from three independent experiments.
-
Figure 3—source data 1
Contains numerical source data for Figure 3.
- https://cdn.elifesciences.org/articles/69709/elife-69709-fig3-data1-v2.zip
Figure 3—figure supplement 1
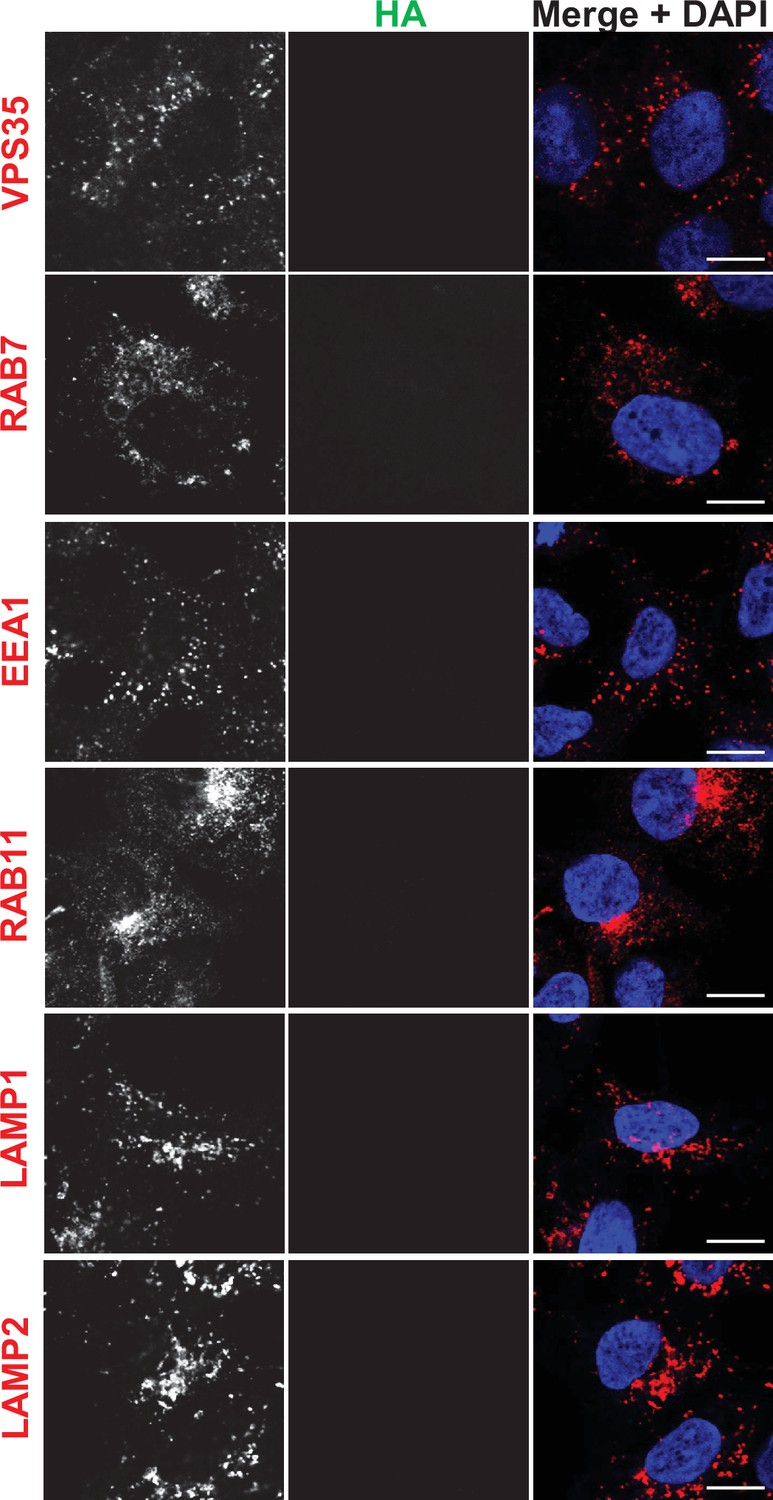
Immunofluorescence localization of endosomal proteins in unedited HEK293 cells (control for Figure 3).
HEK293 cells were fixed, permeabilized, and incubated with antibodies against HA and against markers for either the retromer (VPS35), early endosomes (EEA1), late endosomes (RAB7), recycling endosomes (RAB11), and lysosomes (LAMP1 and LAMP2). Bar: 10 µm.
Figure 4
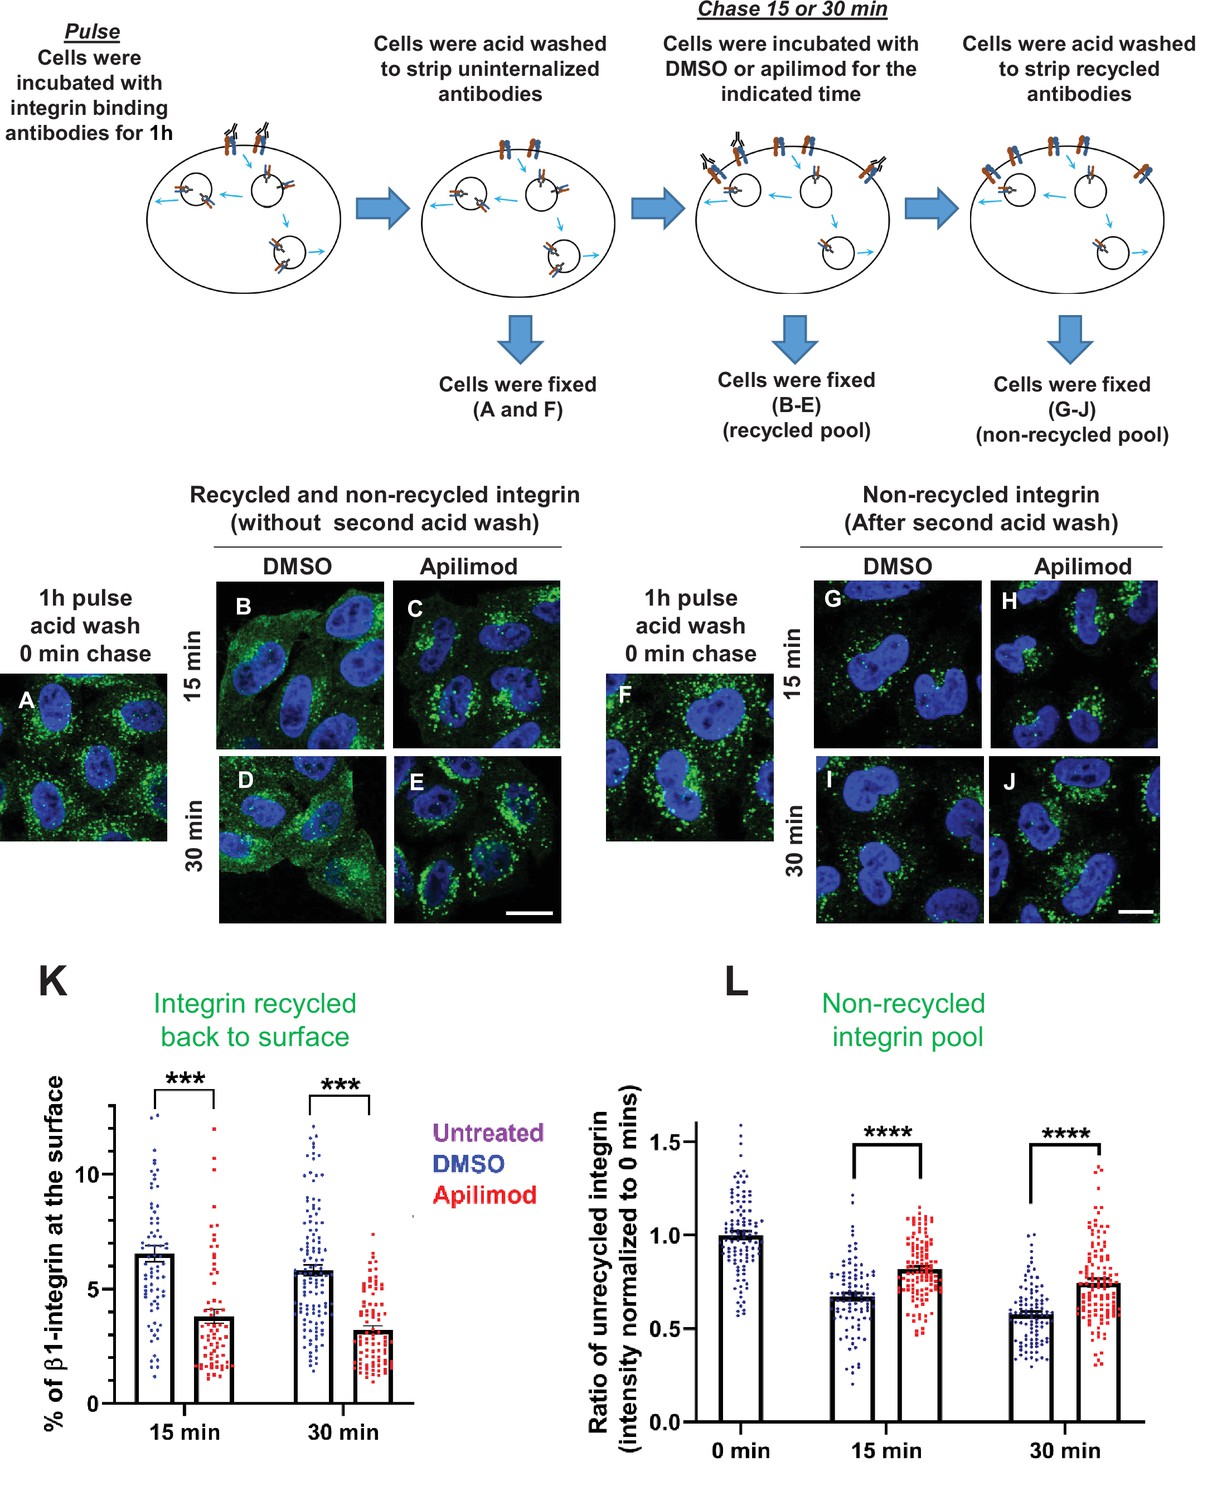
Inhibition of PIKfyve results in a defect in β1-integrin recycling.
(A–J) HeLa cells were incubated with β1-integrin antibody for 1 hr at 37°C to allow the antibody-labeled integrin to internalize. Cells were then acid washed to remove surface β1-integrin-bound antibodies, and were either fixed (A and F) or incubated with DMSO or 1 µM apilimod containing media at 37°C for the indicated times. Cells were either fixed (B–E) or fixed after a second acid wash to remove antibodies that returned to the surface (G–J). Fixed cells were permeabilized and immunostained with Alexa-Fluor-488-conjugated anti-mouse secondary antibodies. Flow diagram (top) outlines the experiment. (K) Surface levels of β1-integrin were inferred from the intensity of β1-integrin within 0.8 µm from the cell border. The levels of β1-integrin that recycled back to the surface (for images B–E) were quantified as percentage of the total labeled integrin. (L) Intensity of non-recycled β1-integrin was quantified from cells treated as indicated in (G–J). All values were normalized to the average of the 0 min time point (F). Data presented as mean ± SE. Statistical significance from three independent experiments were analyzed using two-way ANOVA and Sidak’s multiple comparisons tests. (K–L). ***p < 0.005 and ****p < 0.001. Bar: 10 µm.
-
Figure 4—source data 1
Contains numerical source data for Figure 4.
- https://cdn.elifesciences.org/articles/69709/elife-69709-fig4-data1-v2.zip
Figure 5 with 1 supplement
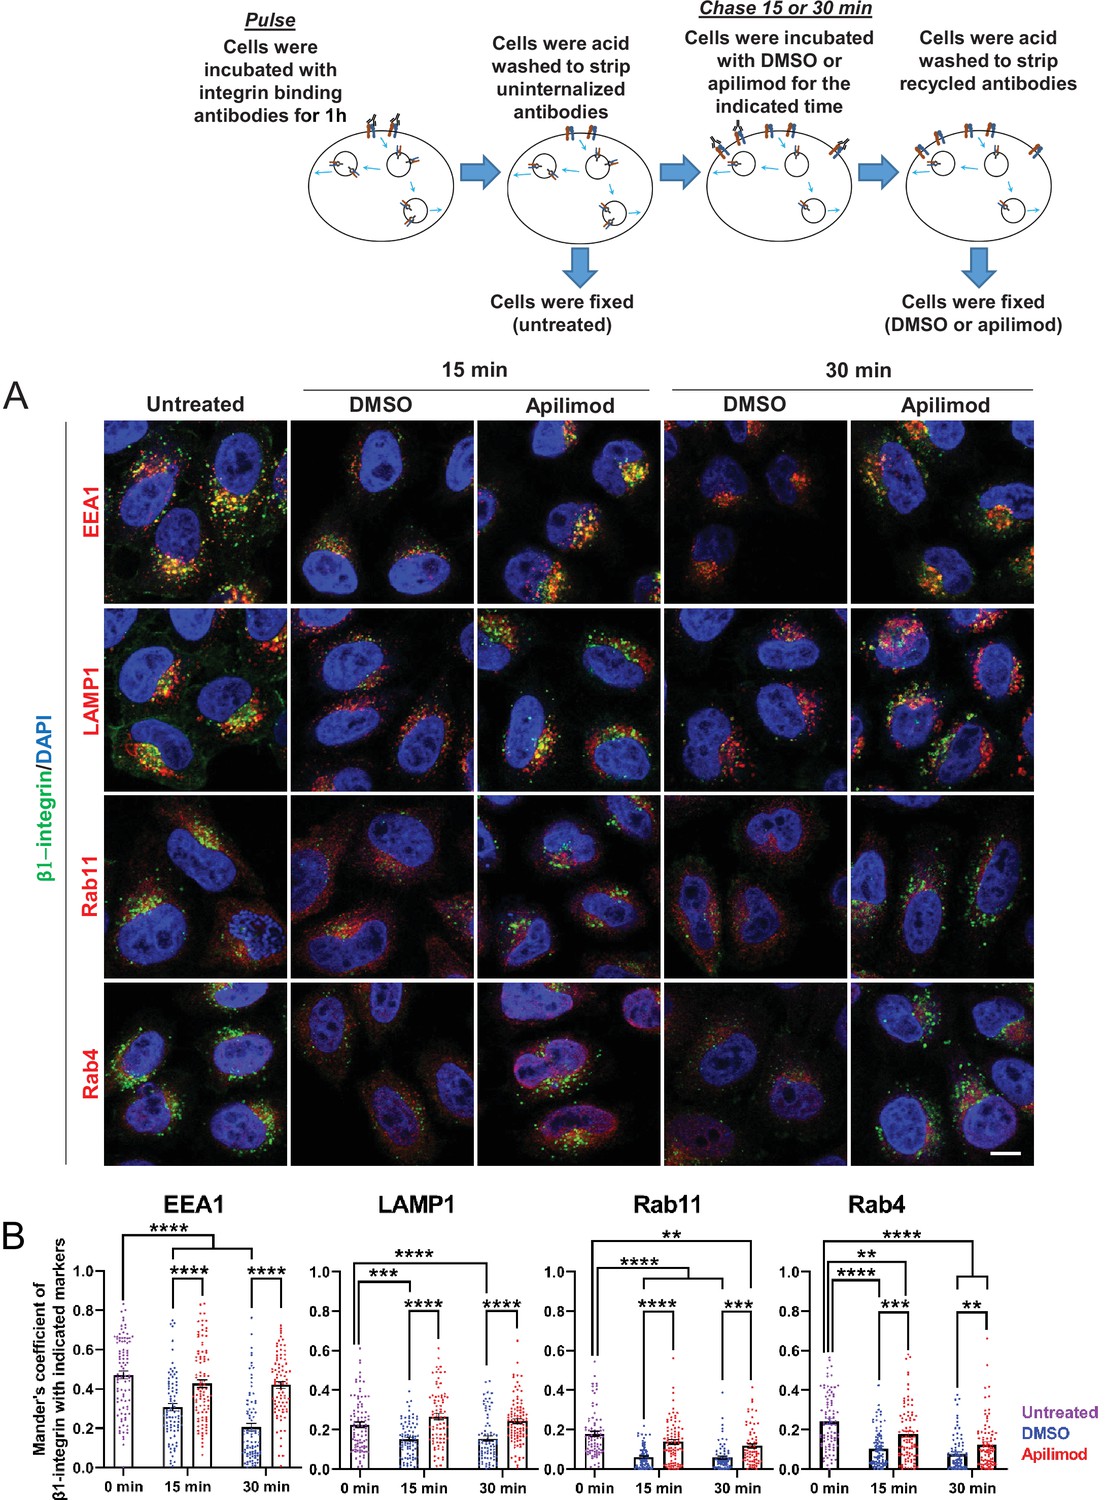
Inhibition of PIKfyve results in a defect in β1-integrin recycling from late endosomes, early endosomes, and recycling endosomes.
(A) HeLa cells were incubated with β1-integrin antibody for 1 hr at 37°C to allow antibody-labeled surface integrin to internalize and then acid washed to remove surface antibodies. Cells were either fixed (0 min, untreated) or treated with either DMSO or apilimod for the indicated time points. Cells were then acid washed, fixed, and the localization of internalized β1-integrin was analyzed with well-established marker proteins: EEA1, LAMP1, RAB11, and RAB4. (B) Colocalization of the internalized β1-integrin pool with endocytic markers was determined using Mander’s colocalization coefficient analysis. Data presented as mean ± SE. Statistical significance from three independent experiments was analyzed using two-way ANOVA and Sidak’s multiple comparisons tests. **p < 0.01, ***p < 0.005, and ****p < 0.001. Bar: 10 µm.
-
Figure 5—source data 1
Contains numerical source data for Figure 5.
- https://cdn.elifesciences.org/articles/69709/elife-69709-fig5-data1-v2.zip
Figure 5—figure supplement 1
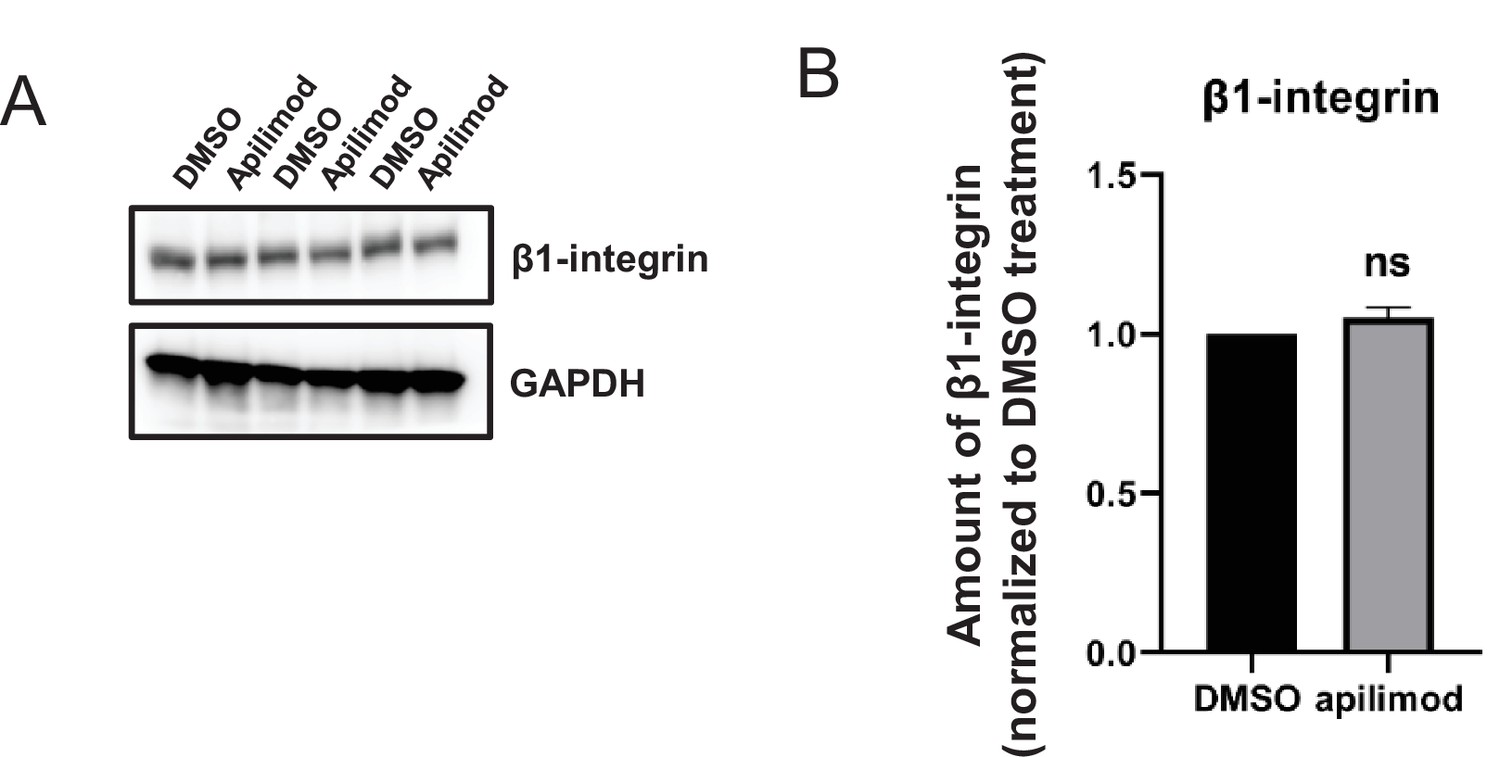
β1-Integrin levels remain stable during PIKfyve inhibition.
(A–B) HeLa cells were treated with DMSO or 1 µM apilimod for 30 min. (A) Lysates from three independent experiments were immunoblotted with antibodies against β1-integrin and GAPDH. (B) Levels of β1-integrin were quantified and values were normalized to DMSO control. Data presented as mean ± SE. Statistical significance was analyzed using paired two-tailed Student’s t-test. ns, not significant.
-
Figure 5—figure supplement 1—source data 1
Contains numerical and uncropped western blot source data for Figure 5—figure supplement 1.
- https://cdn.elifesciences.org/articles/69709/elife-69709-fig5-figsupp1-data1-v2.zip
Figure 6 with 3 supplements
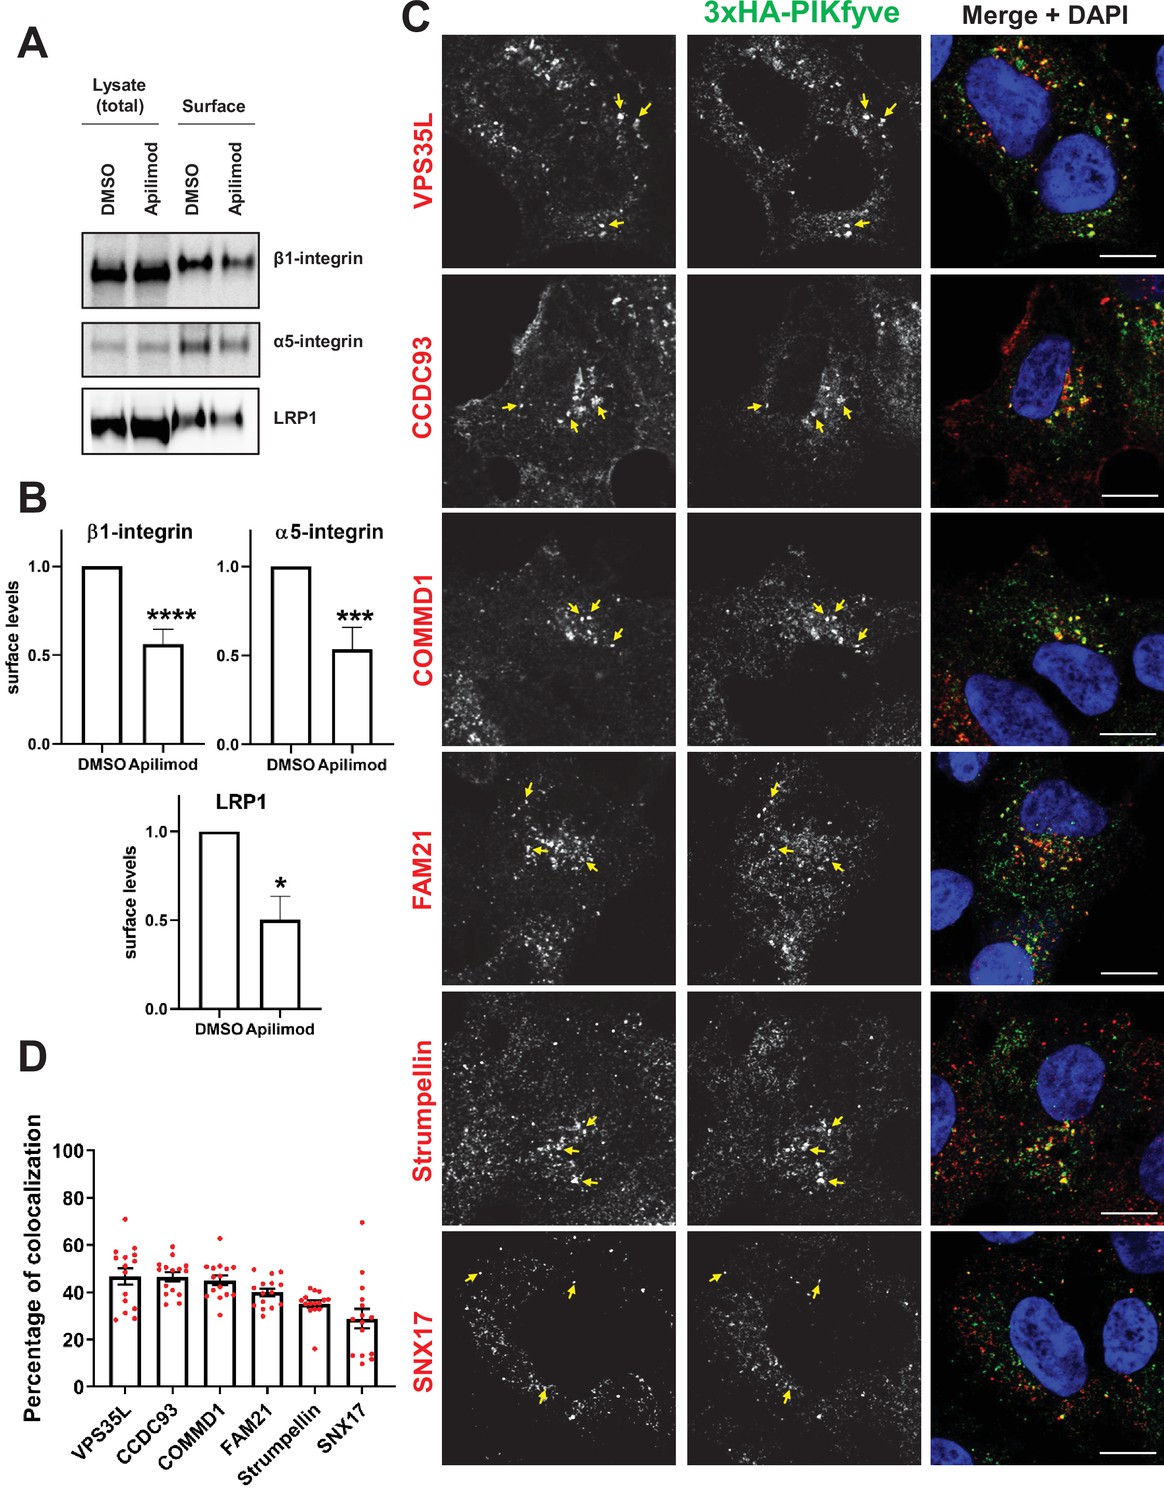
PIKfyve regulates the recycling of SNX17-Retriever-CCC-WASH cargoes and colocalizes with SNX17 and subunits of the Retriever, CCC, and WASH complexes.
(A) HeLa cells were treated with DMSO or 1 µM apilimod for 1 hr and then the levels of SNX17 cargoes, β1-integrin, and α5-integrin were determined using a surface biotinylation assay. Surface biotinylation assay was similarly performed on HUH7 cells and low-density lipoprotein receptor-related protein 1 (LRP1) levels were measured. (B) Quantification of western blots from three independent surface biotinylation experiments. (C) HEK293 cells expressing 3xHA-endogenously tagged PIKfyve were fixed, permeabilized, and incubated with antibodies against the HA tag and antibodies against either SNX17, the Retriever complex subunit (VPS35L), CCC complex subunits (CCDC93 and COMMD1), or WASH complex subunits (FAM21 and Strumpellin). Bar: 10 µm. Arrows indicate examples of puncta showing colocalization. (D) The percentage of PIKfyve colocalizing with the indicated proteins was determined using Mander’s colocalization coefficient analysis from three independent experiments. Data presented as mean ± SE. *p < 0.05, ***p < 0.005, and ****p < 0.001.
-
Figure 6—source data 1
Contains numerical and uncropped western blot source data for Figure 6.
- https://cdn.elifesciences.org/articles/69709/elife-69709-fig6-data1-v2.zip
Figure 6—figure supplement 1
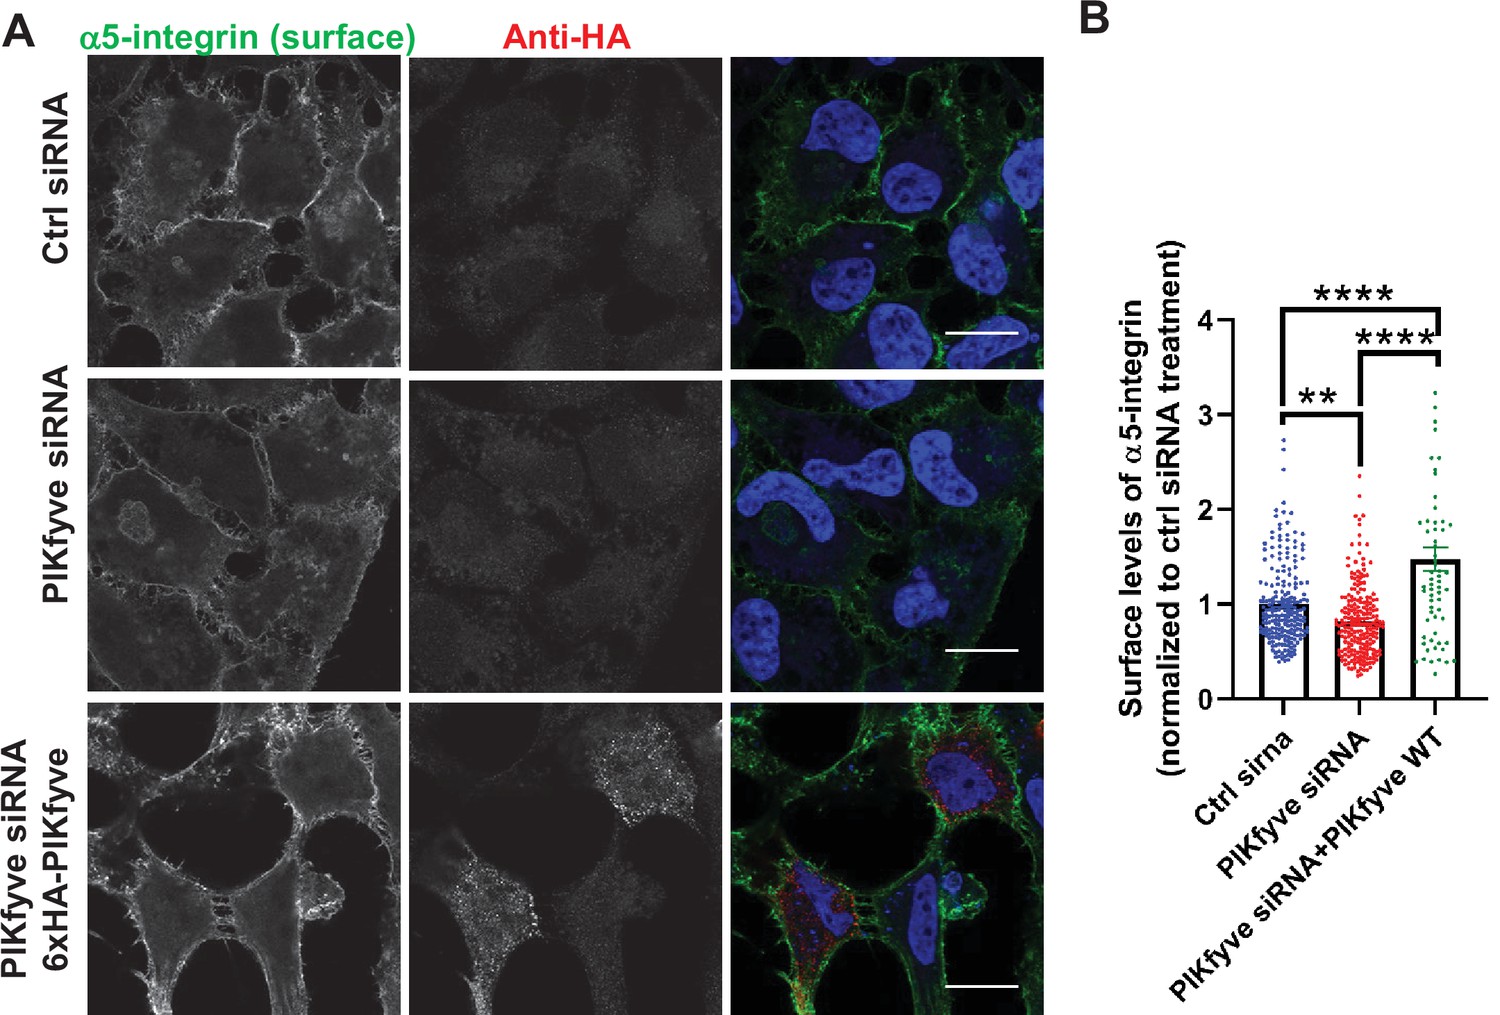
Depletion of PIKfyve results in a decrease of the surface levels of α5-integrins.
(A) Expression of siRNA-resistant PIKfyve rescues the surface levels of α5-integrins. HeLa cells transfected with PIKfyve siRNA or no siRNA for 3 days were either untransfected or transfected with 6xHA-PIKfyve for the last 18 hr of transfection. Cells were then incubated with antibodies to α5-integrins for 1 hr at 4°C. Cells were fixed for 30 min at 4°C and analyzed by immunofluorescence. Bar: 20 µm. (B) The intensity of α5-integrin was quantified per cell and the values were normalized to the DMSO treatment. Data presented as mean ± SE. Statistical significance from three independent experiments was quantified with one-way ANOVA followed by Tukey’s post hoc. **p < 0.01 and ****p < 0.001.
-
Figure 6—figure supplement 1—source data 1
Contains numerical source data for Figure 6—figure supplement 1.
- https://cdn.elifesciences.org/articles/69709/elife-69709-fig6-figsupp1-data1-v2.zip
Figure 6—figure supplement 2
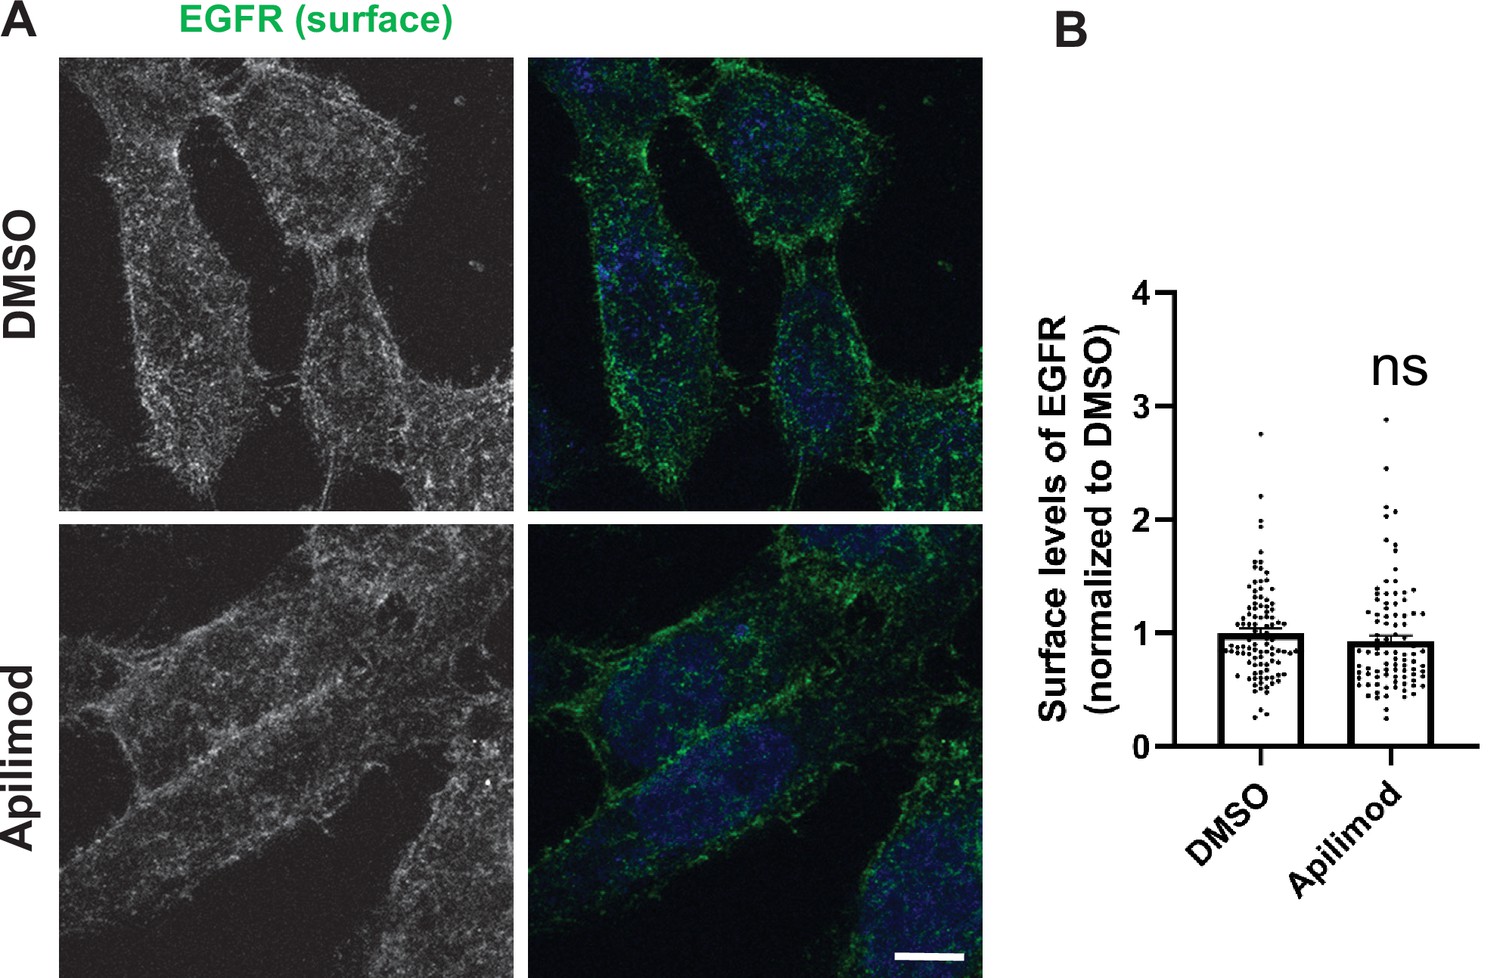
Inhibition of PIKfyve does not alter the surface levels of EGFR.
(A) HeLa cells were treated with DMSO or 1 µM apilimod for 1 hr, followed by incubation with antibodies to label the surface EGFR for 1 hr at 4°C. Cells were fixed at 4°C for 30 min and analyzed by immunofluorescence. Bar: 10 µm. (B) Intensity of surface EGFR per cell was quantified and the values were normalized to the average intensity of the DMSO treatment. Data presented as mean ± SE. Statistical significance from three independent experiments were determined by unpaired two-tailed Student’s t-test. ns, not significant.
-
Figure 6—figure supplement 2—source data 1
Contains numerical source data for Figure 1—figure supplement 2.
- https://cdn.elifesciences.org/articles/69709/elife-69709-fig6-figsupp2-data1-v2.zip
Figure 6—figure supplement 3
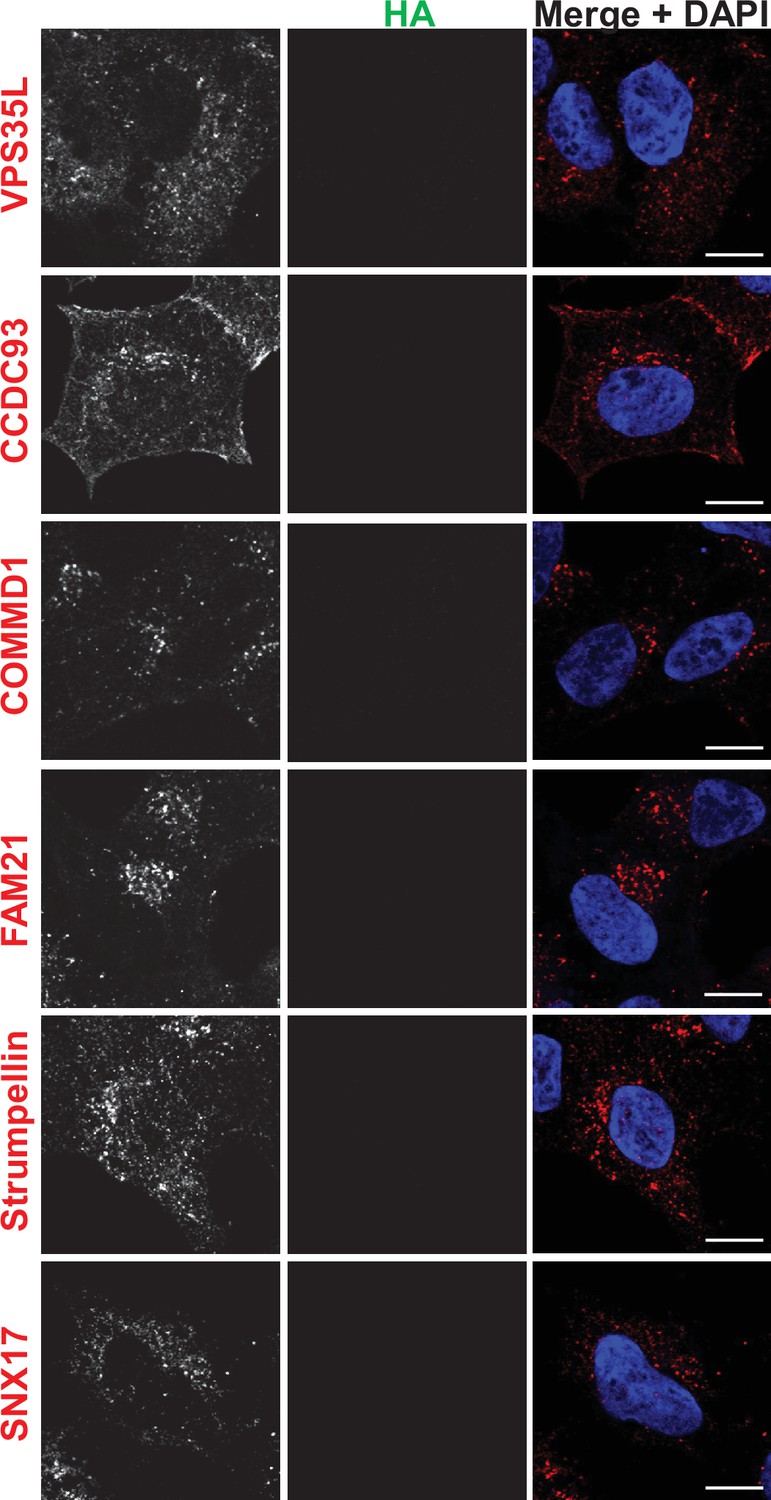
Immunofluorescence localization of endosomal proteins in unedited HEK293 cells (control for Figure 6).
HEK293 cells were fixed, permeabilized, and incubated with antibodies against HA and against markers for either the retromer (VPS35), SNX17, the Retriever subunit, VPS35L, the CCC complex subunits, COMMD1 and CCDC93, or the WASH complex subunits, Strumpellin and FAM21. Bar: 10 µm.
Figure 7 with 8 supplements
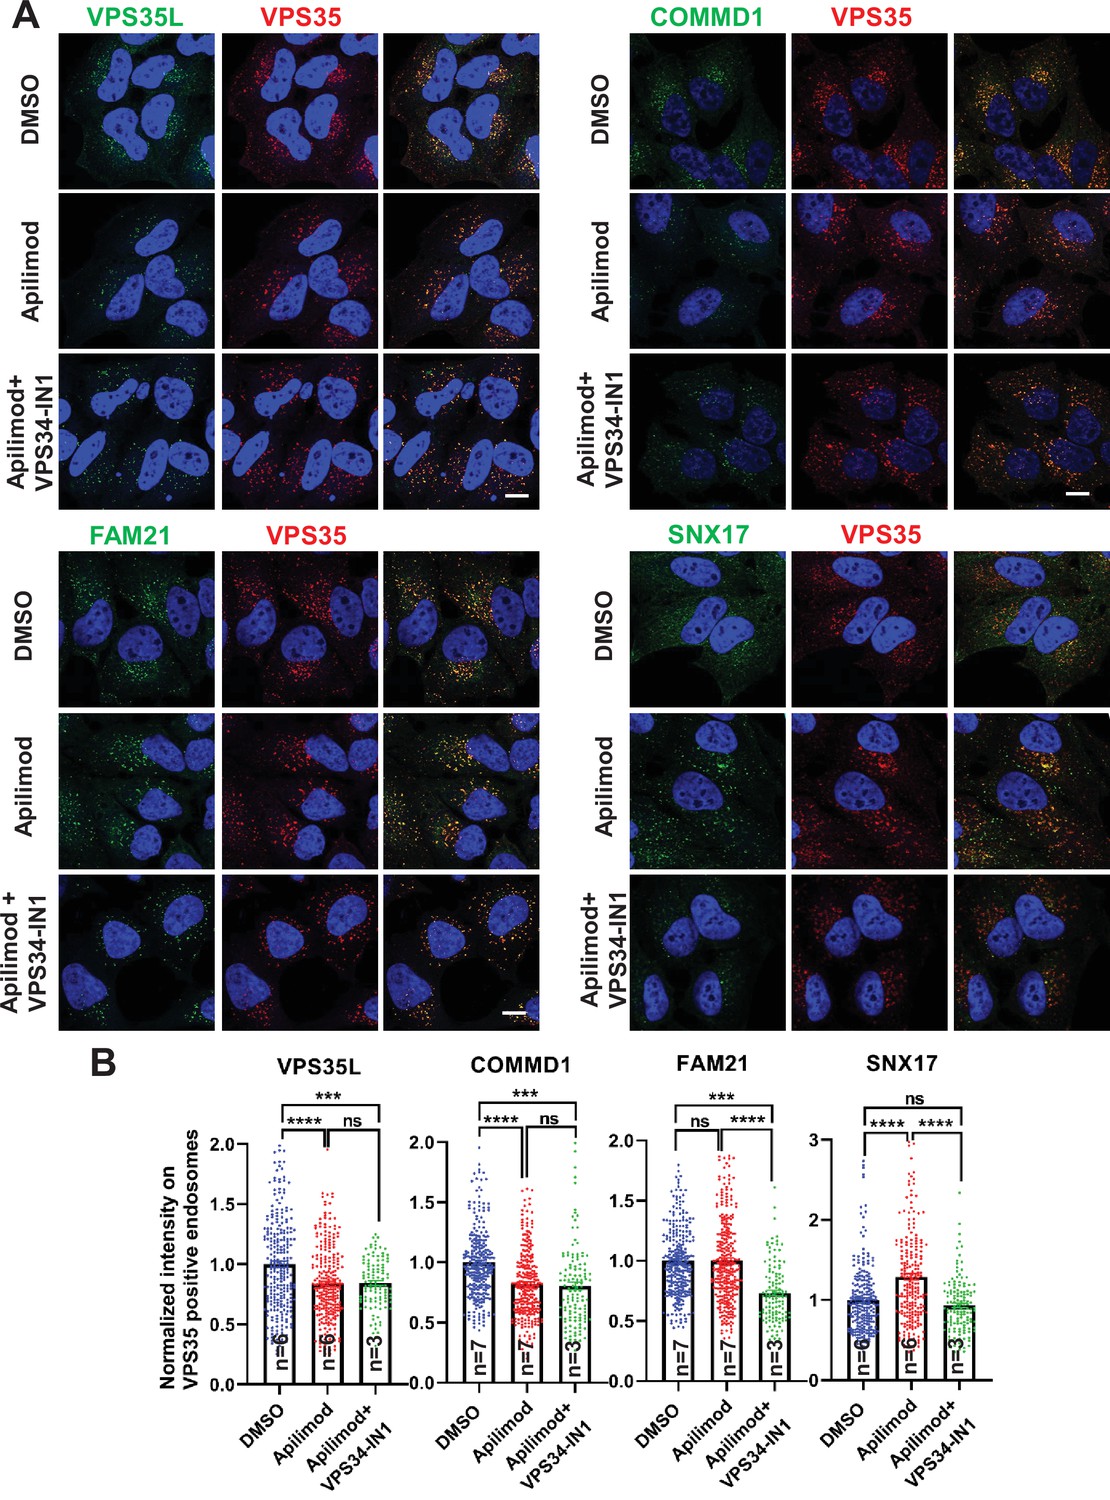
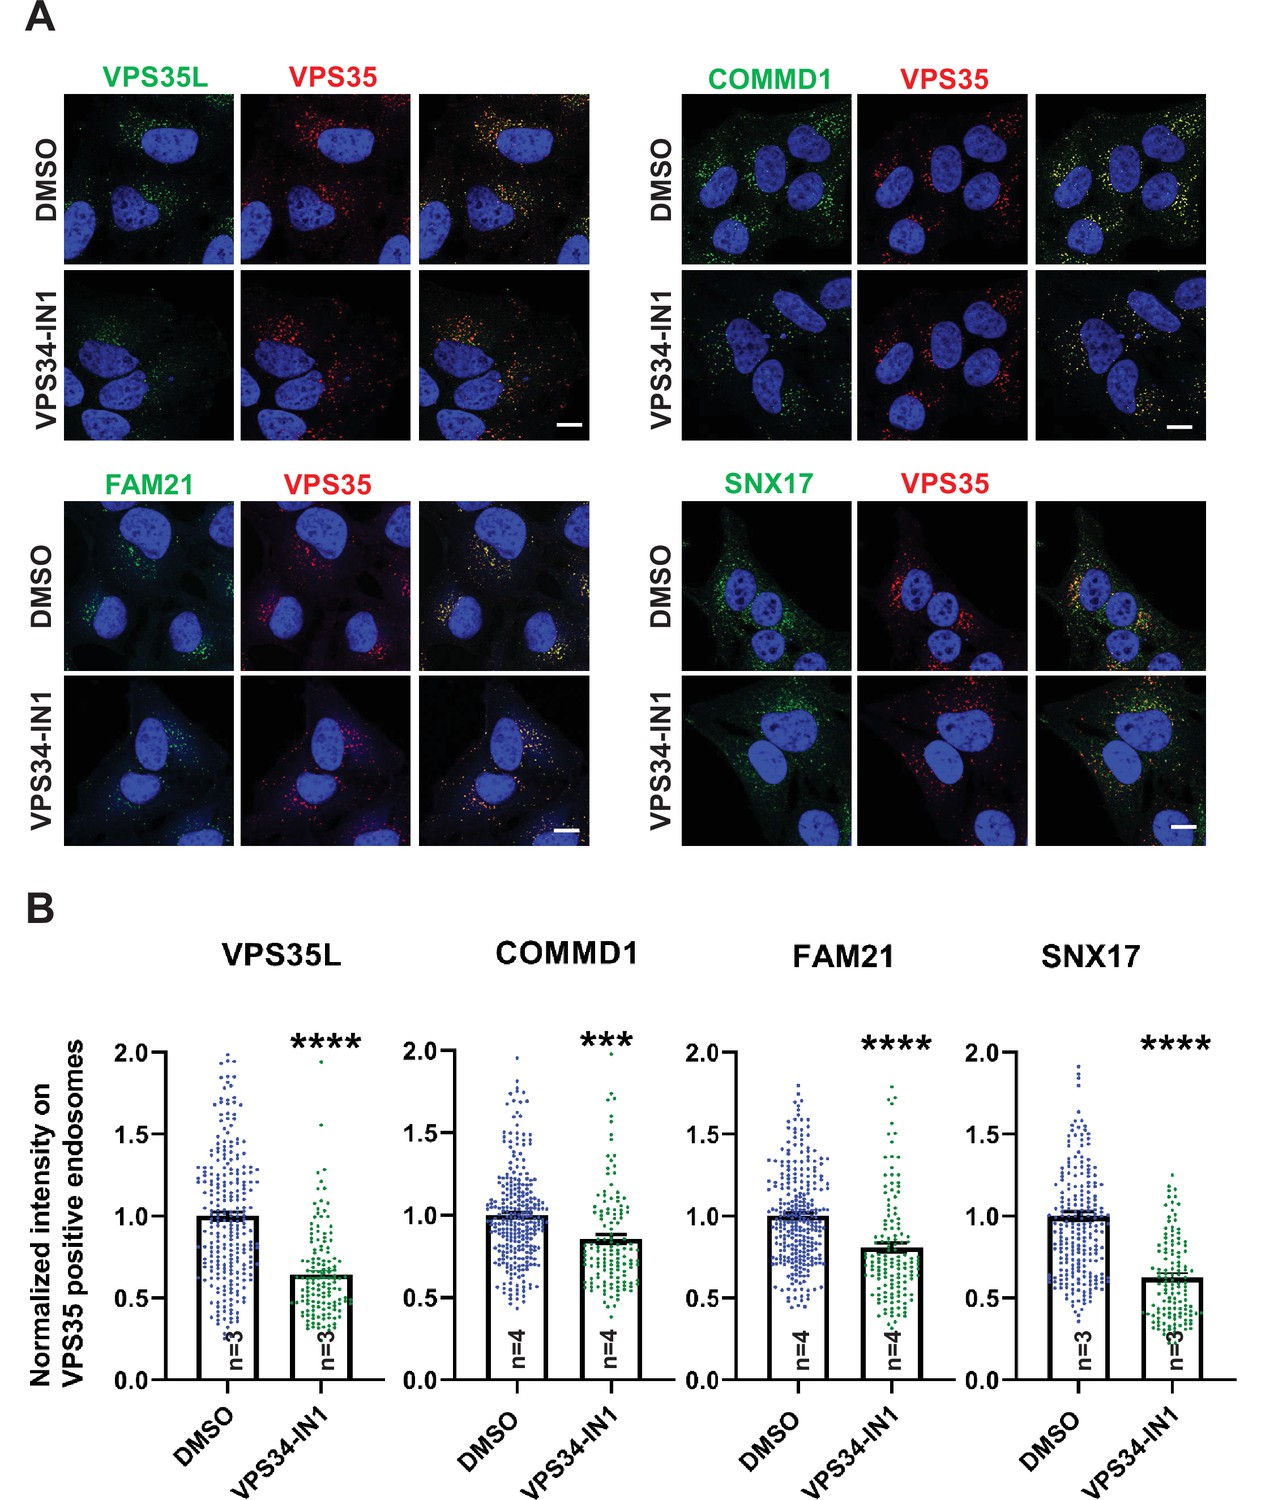
CCC and Retriever complexes require PI3,5P2 and/or phosphatidylinositol 5-phosphate (PI5P) to bind to endosomes.
(A) HeLa cells treated with either DMSO or 1 µM apilimod or co-treated with 1 µM apilimod and 0.01 µM VPS34-IN1 for 30 min were fixed, permeabilized and co-stained with antibodies against VPS35 (A–D) and antibodies against either VPS35L, COMMD1, FAM21, or SNX17. (B) A mask of VPS35-positive endosomes was generated, and the intensity of VPS35L, COMMD1, FAM21, and SNX17 within this location was quantified. Values were normalized to the corresponding average intensity of the DMSO treatment cohort. Data presented as mean ± SE. Statistical significance from three or more independent experiments as indicated within bar graph were analyzed using one-way ANOVA and Tukey’s post hoc tests. ***p < 0.005 and ****p < 0.001, and ns, not significant. Bar: 10 µm.
-
Figure 7—source data 1
Contains numerical source data for Figure 7.
- https://cdn.elifesciences.org/articles/69709/elife-69709-fig7-data1-v2.zip
Figure 7—figure supplement 1
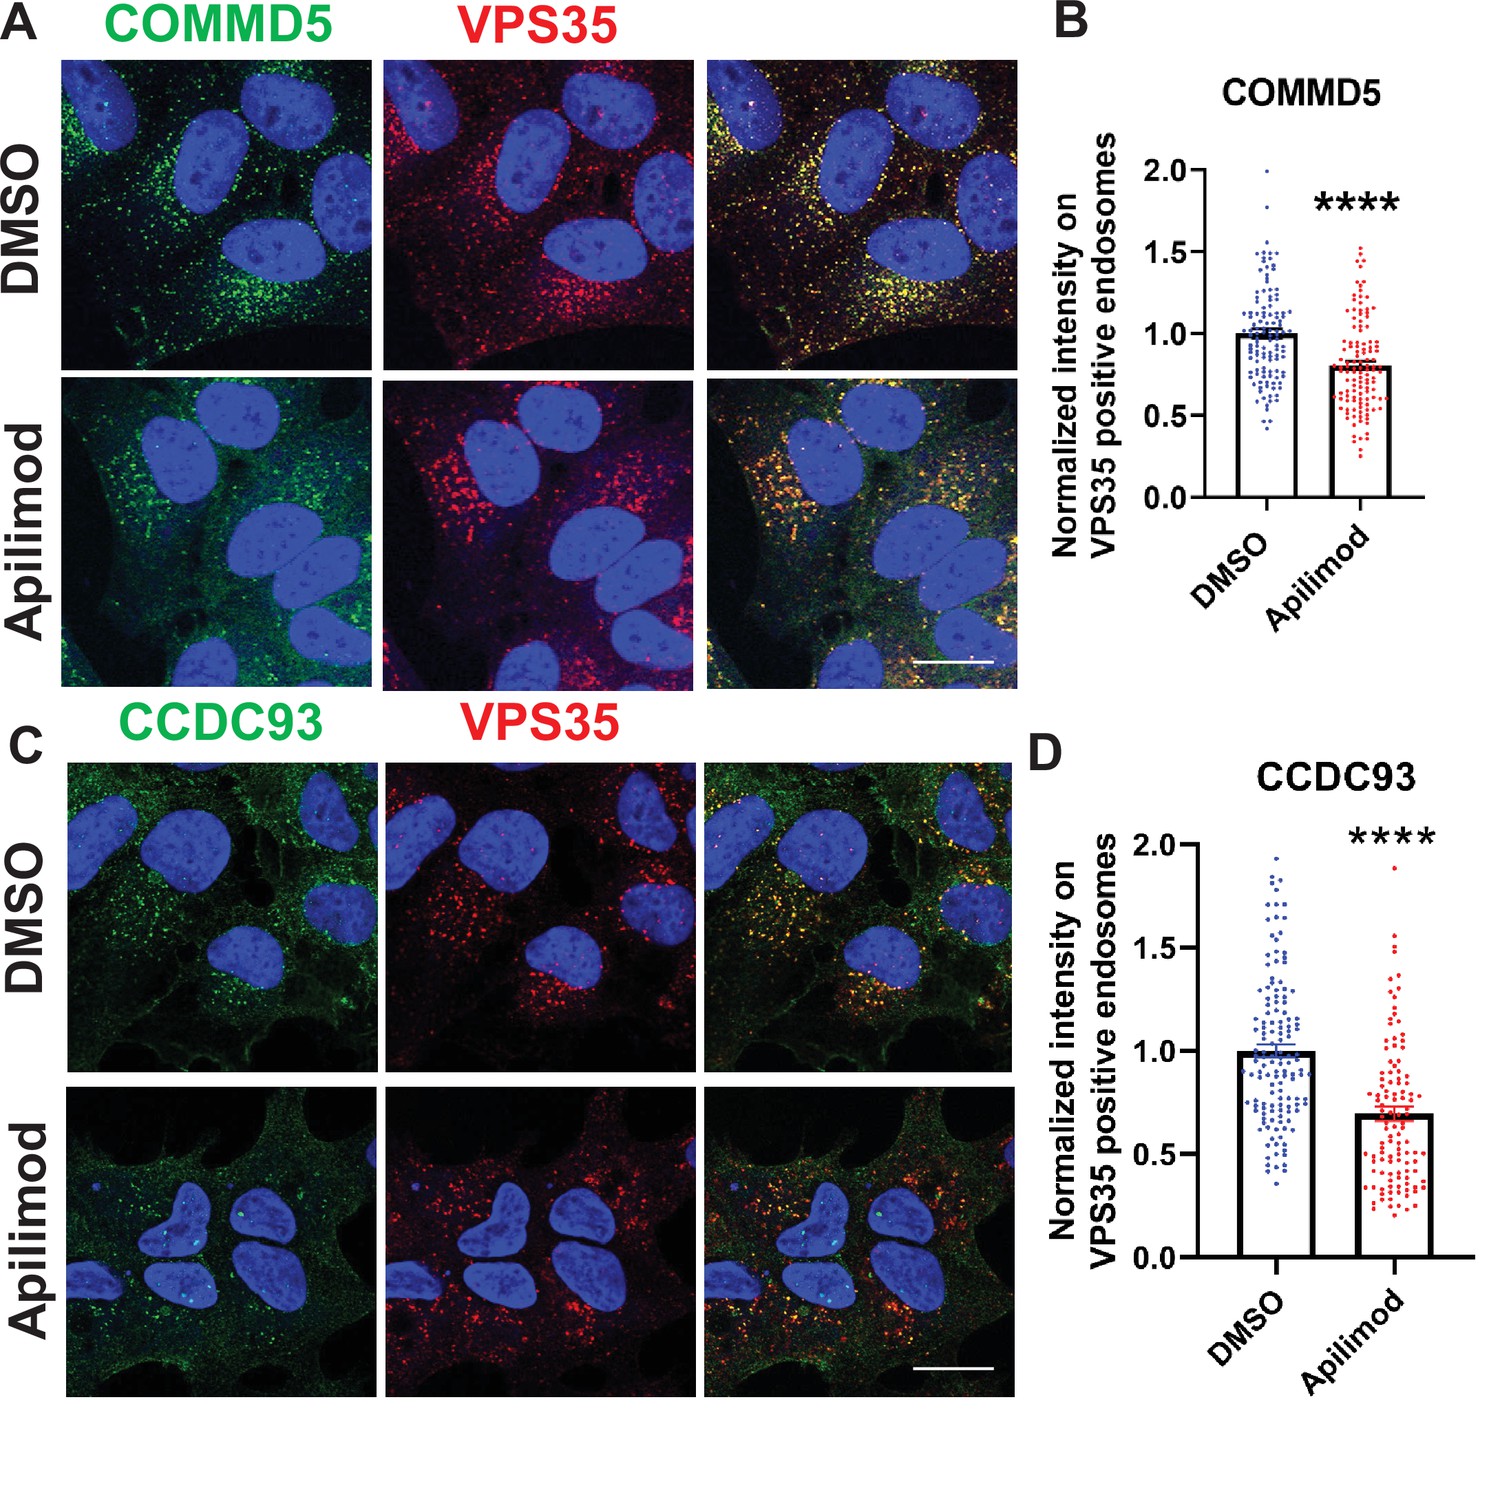
Acute inhibition of PIKfyve results in a loss of the CCC complex subunits, COMMD5 and CCDC93 from endosomes.
(A–B) HeLa cells treated with DMSO or 1 µM apilimod for 30 min were fixed, permeabilized, and co-stained with antibodies against VPS35 and COMMD5. A mask of VPS35-positive endosomes was generated, and the intensity of COMMD5 within this location was quantified. Values were normalized to the corresponding average intensity of the DMSO treatment cohort (B). (C–D) HEK293 cells treated with DMSO or 1 µM apilimod for 30 min were fixed, permeabilized and co-stained with antibodies against VPS35 and CCDC93. A mask of VPS35-positive endosomes was generated, and the intensity of CCDC93 within this location was quantified. Values were normalized to the corresponding average intensity of the DMSO treatment cohort (D). Data presented as mean ± SE. Statistical significance from three independent experiments were analyzed using unpaired two-tailed Student’s t-test. ***p < 0.005 and ****p < 0.001, and ns not significant. Bar: 20 µm.
-
Figure 7—figure supplement 1—source data 1
Contains numerical source data for Figure 7—figure supplement 1.
- https://cdn.elifesciences.org/articles/69709/elife-69709-fig7-figsupp1-data1-v2.zip
Figure 7—figure supplement 2
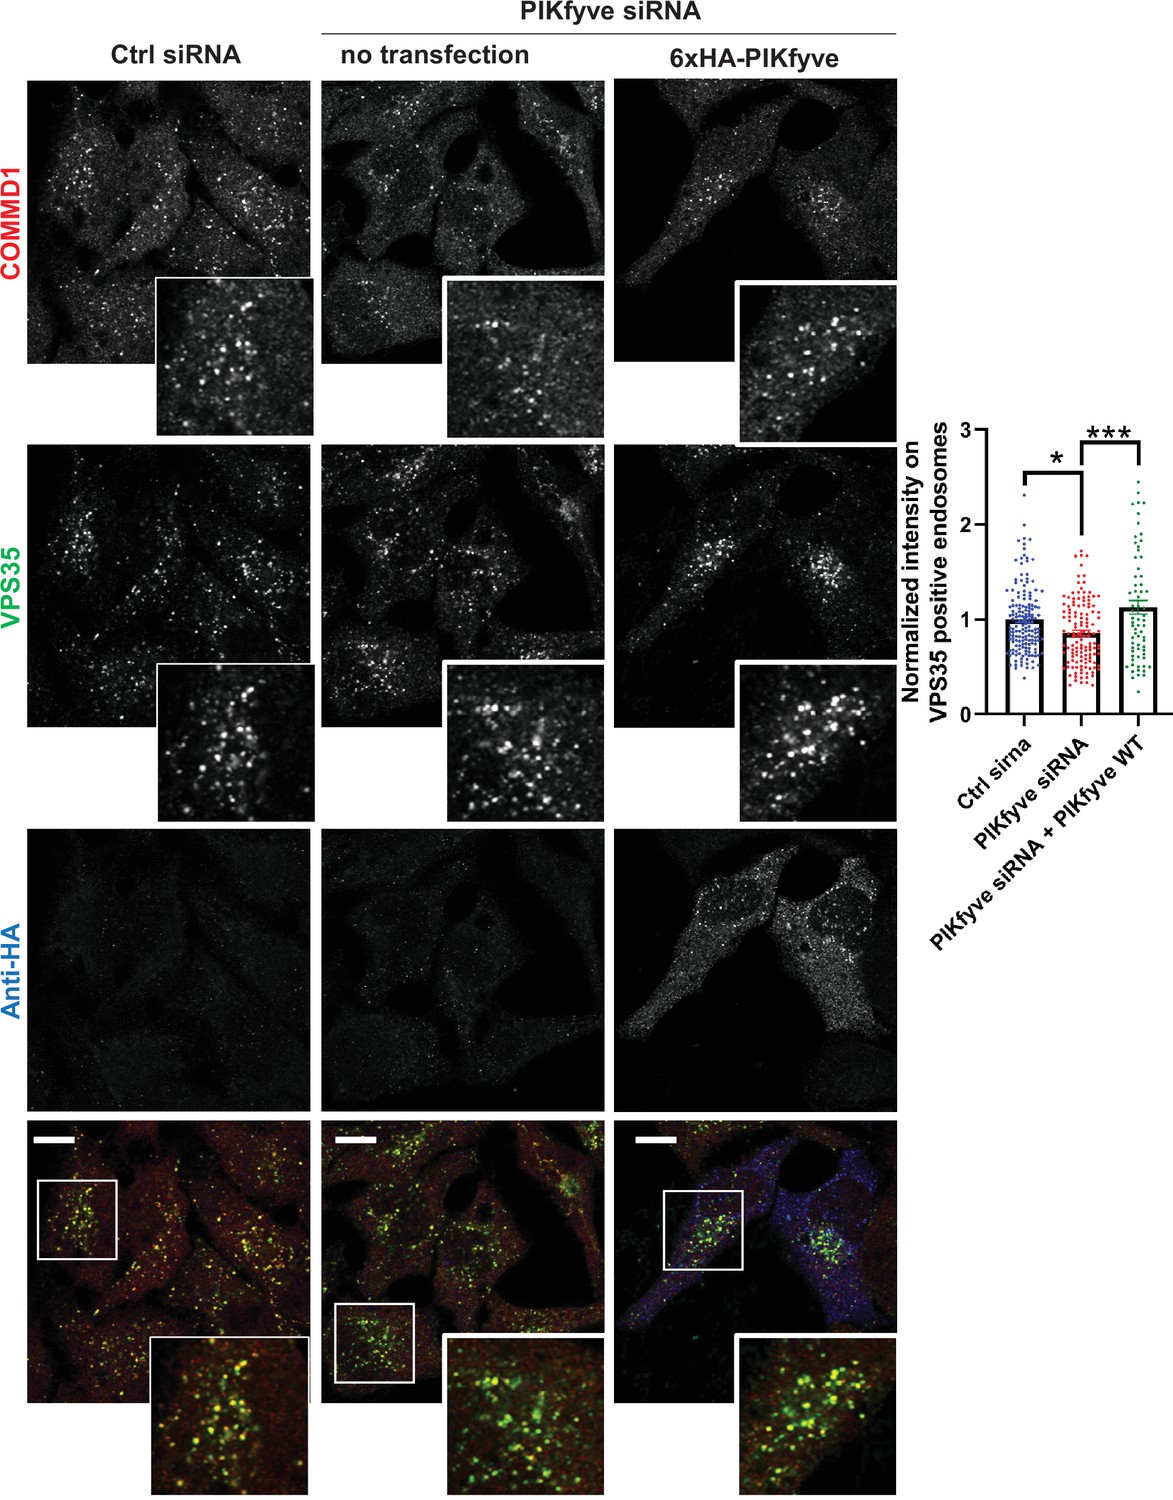
Depletion of PIKfyve causes a loss of the endosomal localization of COMMD1 which is rescued by PIKfyve expression.
HeLa cells transfected with PIKfyve siRNA or no siRNA for 3 days were either untransfected or transfected with 6xHA-PIKfyve for the last 18 hr of transfection. Cells were fixed, immunostained with antibodies to COMMD1, VPS35, and HA-tag (6xHA-PIKfyve). The intensity of COMMD1 in VPS35 puncta per cell was quantified and the values were normalized to the no siRNA control. Data presented as mean ± SE. Statistical significance from three independent experiments were quantified with one-way ANOVA followed by Tukey’s post hoc. *p < 0.05, ***p < 0.005. Bar: 10 µm.
-
Figure 7—figure supplement 2—source data 1
Contains numerical source data for Figure 7—figure supplement 2.
- https://cdn.elifesciences.org/articles/69709/elife-69709-fig7-figsupp2-data1-v2.zip
Figure 7—figure supplement 3
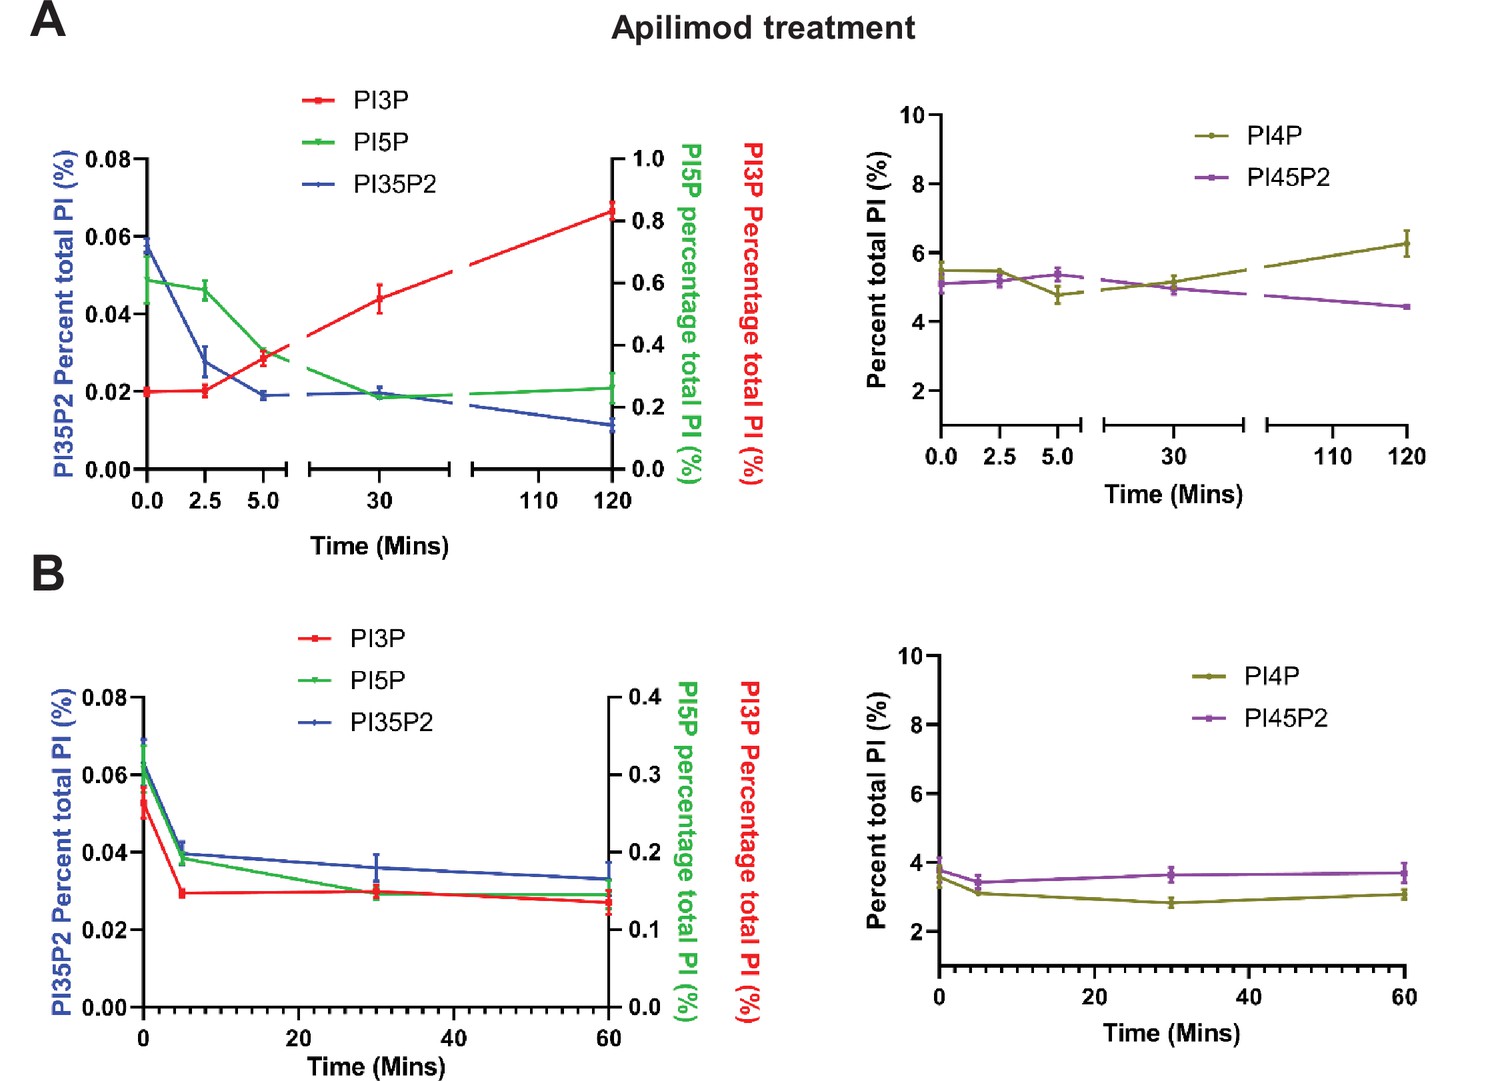
Apilimod and VPS34-IN1 are potent inhibitors of PIKfyve and VPS34, respectively.
(A) Mouse embryonic fibroblast (MEF) cells were incubated with myo-[2 H3] inositol labeled media for 48 hr and cells were either untreated or treated with 1 µM apilimod for the last 2.5, 5, 30, or 120 min of the labeling. Note that phosphatidylinositol 3-phosphate (PI3P) is elevated approximately 4-fold at 120 min of treatment. Levels of individual phosphoinositide lipids were quantified (data adapted from McCartney et al., 2014b). (B) MEF cells were incubated with myo-[2 H3] inositol labeled media for 48 hr and cells were either untreated or treated with 1 µM VPS34-IN1 for the last 5, 30, or 60 min of the labeling. Levels of individual phosphoinositide lipids were quantified. Data presented as mean ± SE from three independent experiments.
-
Figure 7—figure supplement 3—source data 1
Contains numerical source data for Figure 7—figure supplement 3.
- https://cdn.elifesciences.org/articles/69709/elife-69709-fig7-figsupp3-data1-v2.zip
Figure 7—figure supplement 4
Inhibition of the PI3-kinase, VPS34 results in a loss of SNX17, CCC, Retriever, and WASH complexes from endosomes.
(A) HeLa cells treated with DMSO or 1 µM VPS34-IN1 for 30 min were fixed, permeabilized, and co-stained with antibodies against VPS35 (A–D) and antibodies against either COMMD1, VPS35L, FAM21, and SNX17. (B) The intensity of COMMD1, VPS35L, FAM21, and SNX17 on VPS35-positive endosomes was quantified and values were normalized to the corresponding average intensity of the DMSO treatment cohort. Data presented as mean ± SE. Statistical significance from three or four independent experiments was analyzed using unpaired two-tailed Student’s t-test. ***p < 0.005 and ****p < 0.001, and ns not significant. Bar: 10 µm.
-
Figure 7—figure supplement 4—source data 1
Contains numerical source data for Figure 7—figure supplement 4.
- https://cdn.elifesciences.org/articles/69709/elife-69709-fig7-figsupp4-data1-v2.zip
Figure 7—figure supplement 5
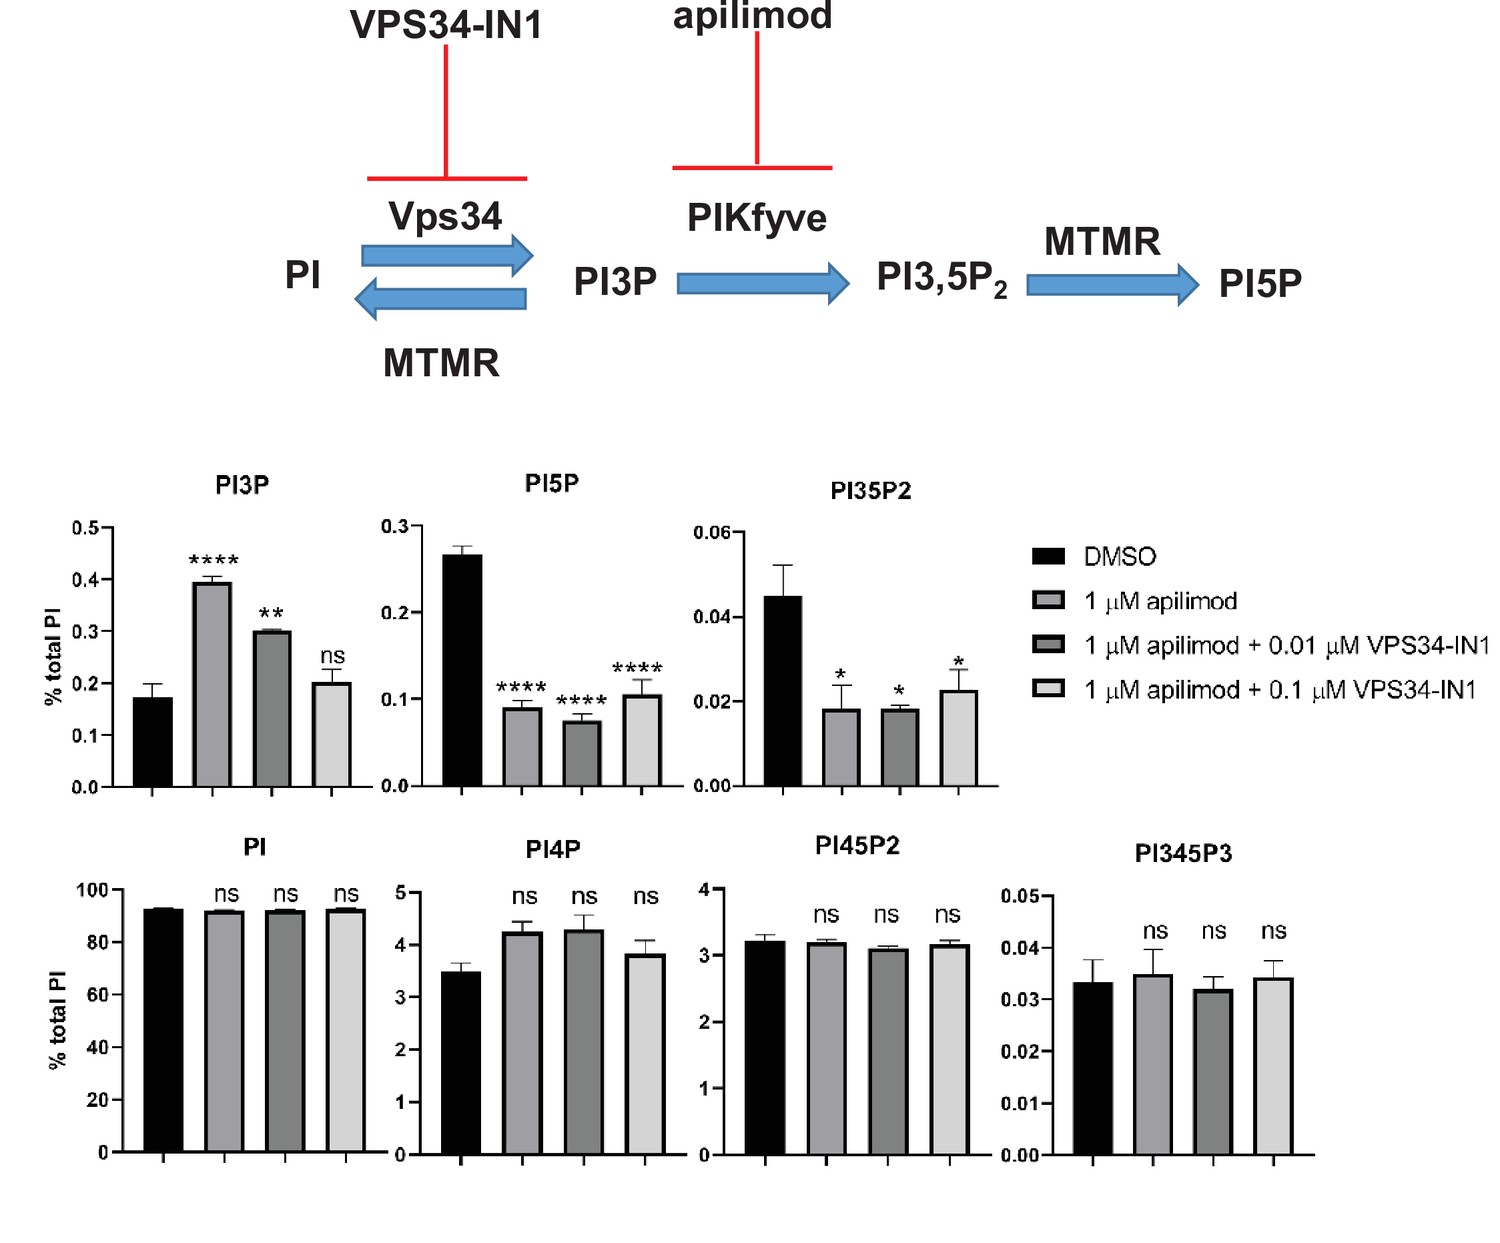
Partial inhibition of VPS34 with 0.1 mM VPS34-IN1 combined with treatment with apilimod prevents the elevation of total cellular pools of phosphatidylinositol 3-phosphate (PI3P).
Mouse embryonic fibroblast (MEF) cells were incubated with myo-[2 H3] inositol labeled media for 48 hr. Cells were either treated with DMSO, 1 µM apilimod or co-treated with 1 µM apilimod and 0.1 µM or 0.01 µM VPS34-IN1 for the last 30 min of the labeling. Levels of individual phosphoinositide lipids were quantified. Data presented as mean ± SE. Statistical significance from three independent experiments were analyzed using one-way ANOVA and Tukey’s post hoc tests. *p < 0.05, **p < 0.01, ***p < 0.005, and ****p < 0.001, and ns not significant.
-
Figure 7—figure supplement 5—source data 1
Contains numerical source data for Figure 7—figure supplement 5.
- https://cdn.elifesciences.org/articles/69709/elife-69709-fig7-figsupp5-data1-v2.zip
Figure 7—figure supplement 6
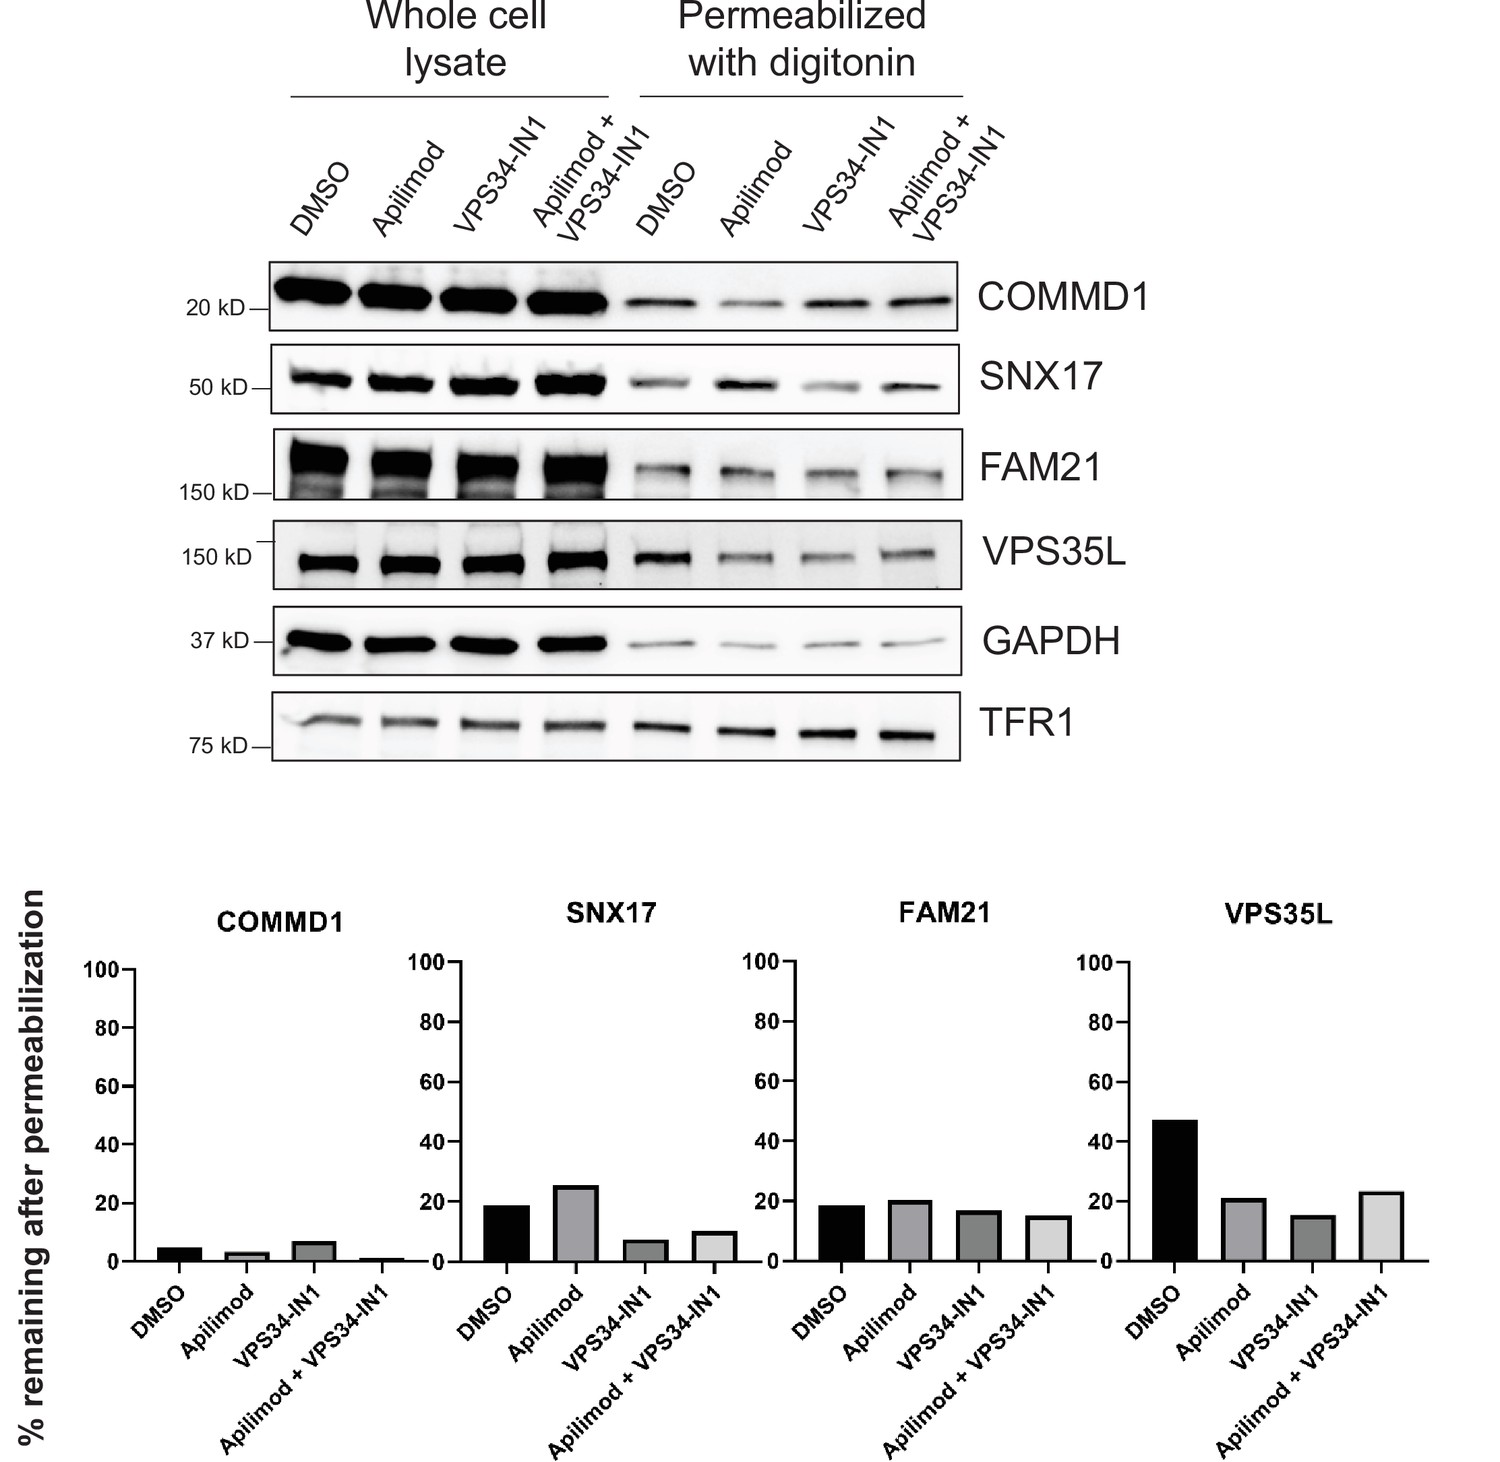
Mild cell permeabilization resulted in the release of SNX17-related proteins.
Mild cell permeabilization was tested as an approach to determine changes in membrane association of the indicated SNX17 pathway-related proteins following treatment with apilimod or VPS34-INH. However, that only a small fraction (5–20%) of most of the proteins tested remained following vehicle control treatment, indicates that this approach is not useful. Other biochemical approaches or milder conditions need to be developed. The release of the SNX17-related proteins suggests that they are predominantly cytosolic or weakly associate with membranes. HeLa cells treated with either DMSO, 1 µM apilimod, 1 µM VPS34-IN1, or co-treated with 1 µM apilimod and 0.1 µM VPS34-IN1 for 2 hr were permeabilized with 100 µg/ml digitonin for 2 min at room temperature. Then, cells were washed twice with PBS and directly lysed with sample buffer and analyzed by western blot. GAPDH and transferrin receptor (TFR1) were used as controls for cytosolic and membrane proteins, respectively. Intensity of the indicated protein was quantified relative to transferrin receptor and the percentage of protein remaining after permeabilization was quantified relative to the corresponding unpermeabilized cells for each treatment.
-
Figure 7—figure supplement 6—source data 1
Contains numerical source data and uncropped western blot source data for Figure 7—figure supplement 6.
- https://cdn.elifesciences.org/articles/69709/elife-69709-fig7-figsupp6-data1-v2.zip
Figure 7—figure supplement 7
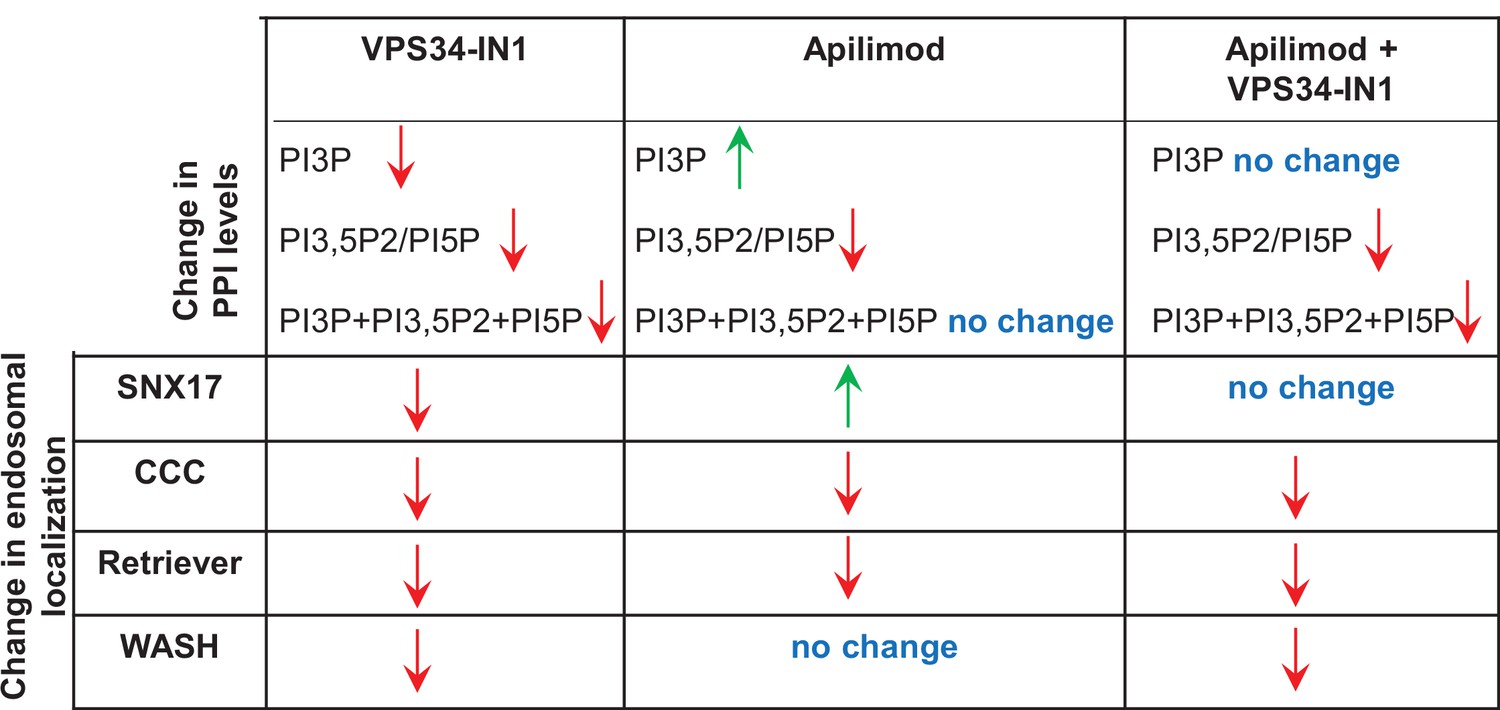
Summary of the effect of inhibitor treatment on phosphoinositide lipid levels and the endosomal localization of SNX17, WASH, CCC, and Retriever subunits.
Green and red arrows indicate an increase or decrease in the endosomal localization of the protein, respectively.
Figure 7—figure supplement 8
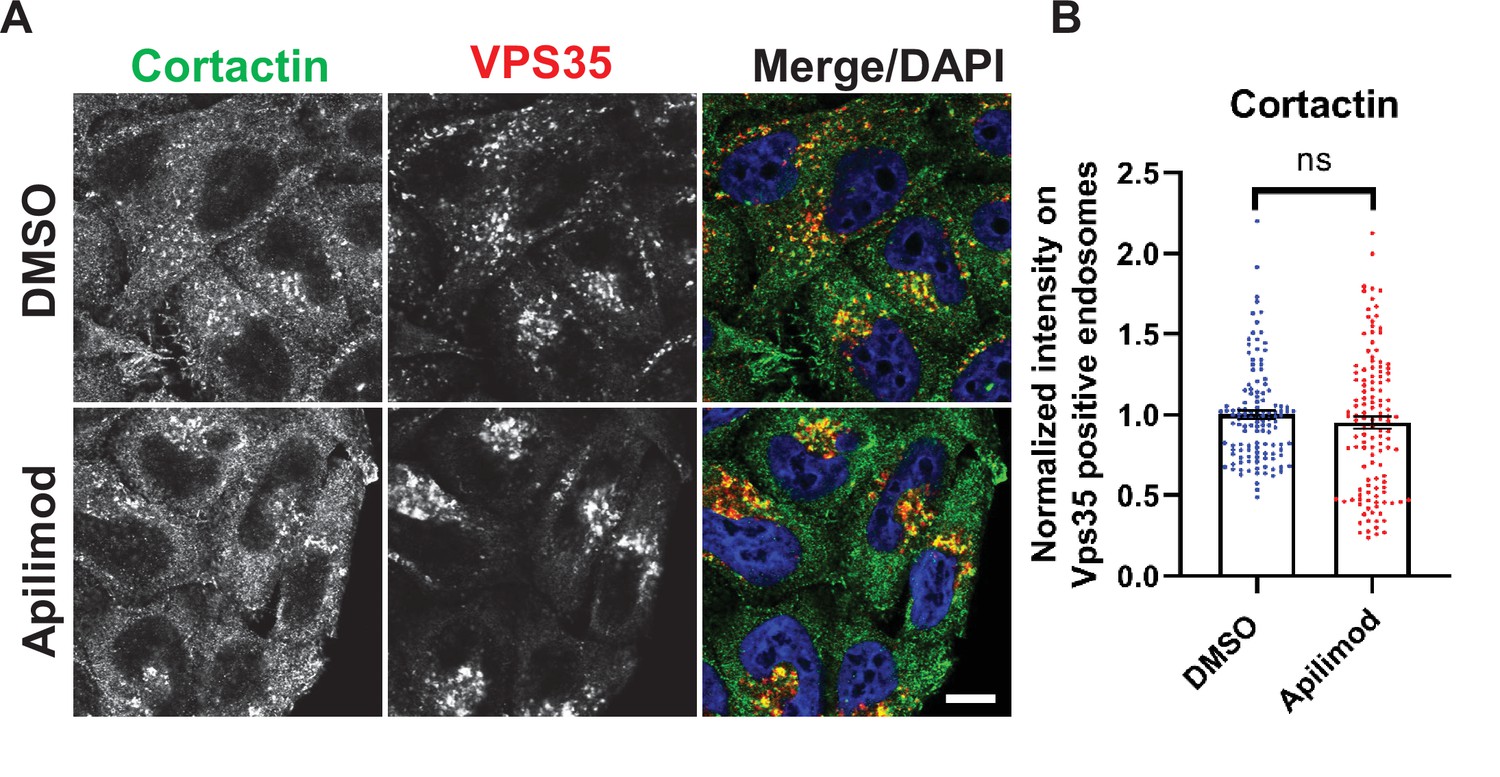
Acute inhibition of PIKfyve does not alter cortactin colocalization on Vps35 endosomes.
(A) HeLa cells grown on coverslips were treated with either DMSO or 1 µM apilimod for 30 min. Cells were fixed, permeabilized, and incubated with antibodies against cortactin and VPS35. Scale bar: 10 µm. (B) The intensity of cortactin on VPS35-positive endosomes was quantified and values were normalized to the average of DMSO-treated cells. Data presented as mean ± SE. Statistical significance of data from three independent experiments was analyzed using an unpaired two-tailed Student’s t-test. ns, not significant.
-
Figure 7—figure supplement 8—source data 1
Contains numerical source data for Figure 7—figure supplement 8.
- https://cdn.elifesciences.org/articles/69709/elife-69709-fig7-figsupp8-data1-v2.zip
Figure 8 with 1 supplement
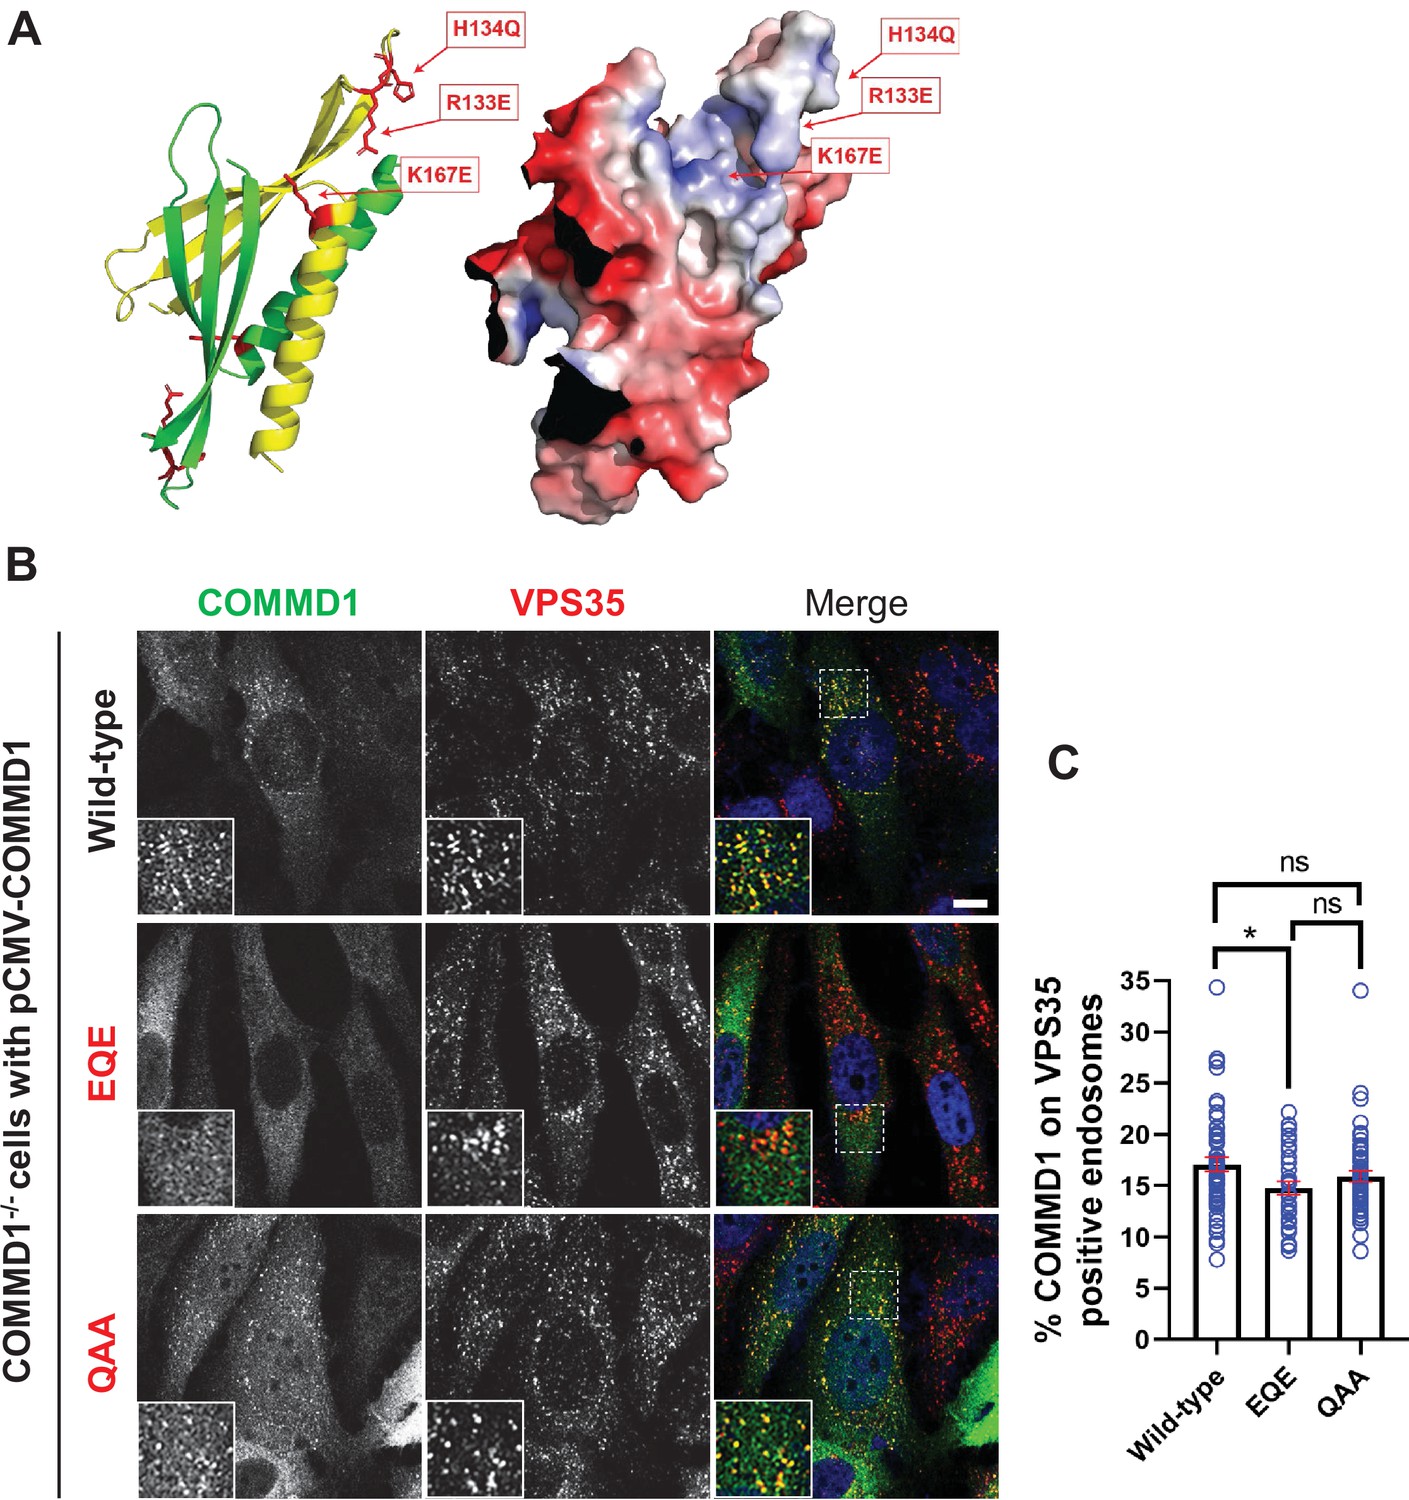
Mutation of the putative phosphoinositide binding site impairs COMMD1 localization to VPS35-positive endosomes.
(A) Ribbon and space filling models of the COMMD domain of COMMD1 modeled on COMMD9 (PDB: 6BP6) (Healy et al., 2018). Positively charged residues within the predicted phosphorylated phosphatidylinositol (PPI) binding site are indicated. (B–C) COMMD1-/- HeLa cells were transiently transfected with either wild-type COMMD1 or COMMD1 mutants (EQE and QAA), then fixed, permeabilized, and co-stained with antibodies against COMMD1 and VPS35. EQE: R133E/H134Q/K167E, and QAA: R133Q/H134A/ K167A. The percent of the total COMMD1 residing on VPS35-positive endosomes was quantified. Data presented as mean ± SE. Statistical significance from three independent experiments were analyzed using one-way ANOVA and Tukey’s post hoc test. *p < 0.05, and ns, not significant. Bar: 10 µm.
-
Figure 8—source data 1
Contains numerical source data for Figure 8.
- https://cdn.elifesciences.org/articles/69709/elife-69709-fig8-data1-v2.zip
Figure 8—figure supplement 1
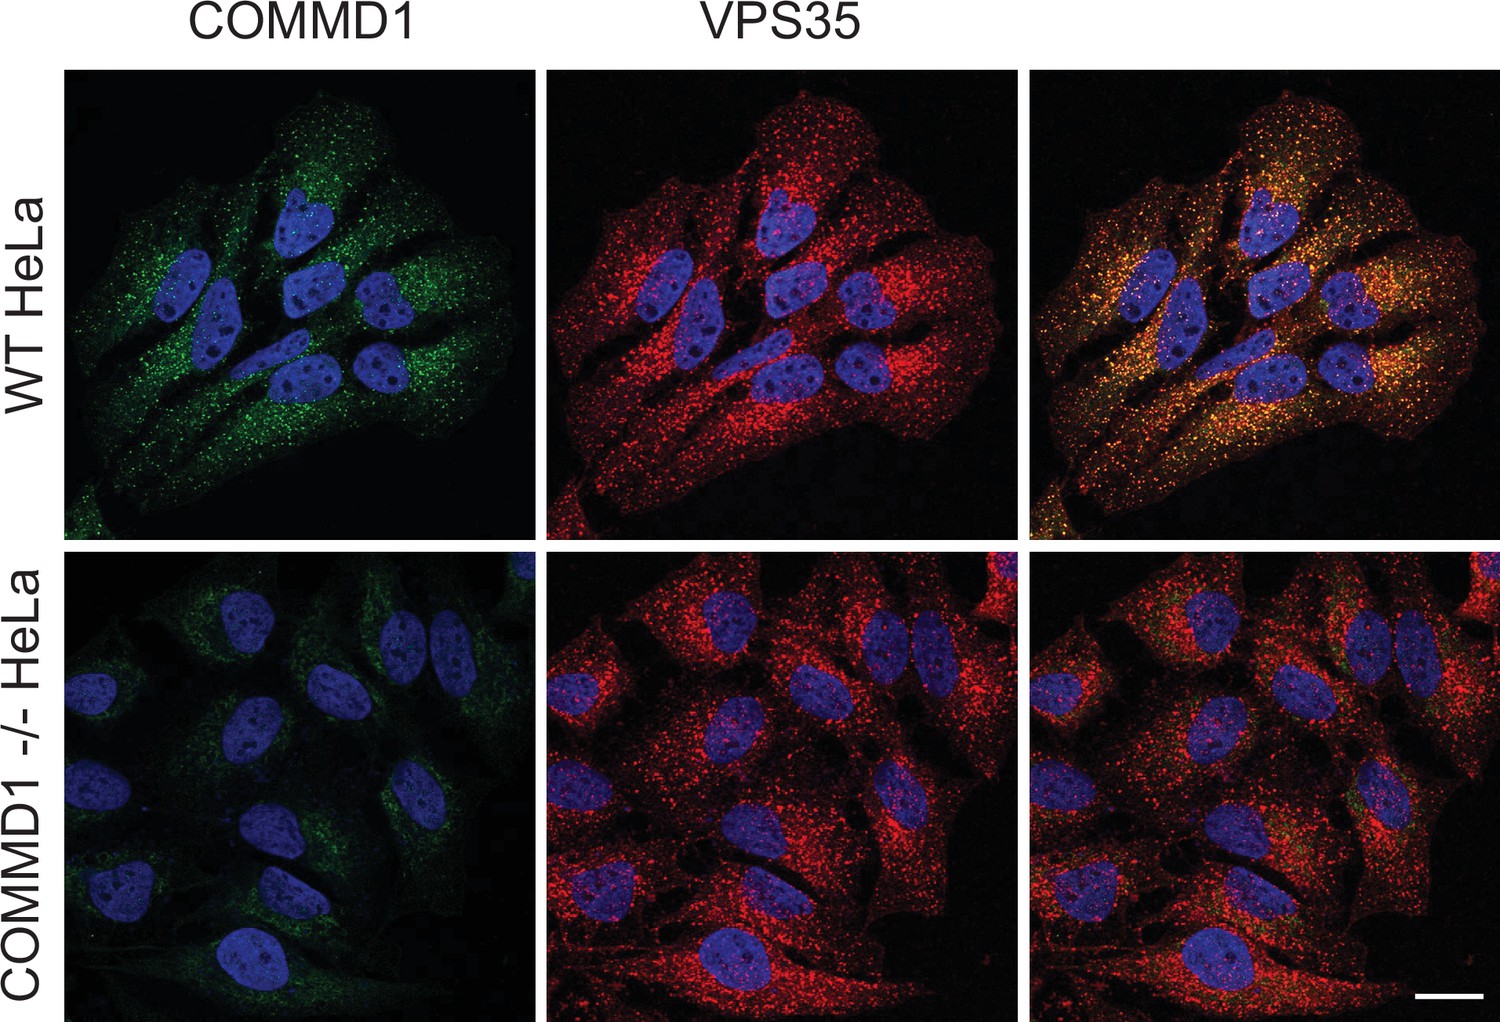
Validation of COMMD1-/- HeLa cells.
Wild-type and COMMD1-/- HeLa cells were fixed, permeabilized, and immunostained with antibodies against COMMD1 and VPS35. Bar: 20 µm.
Figure 9 with 1 supplement
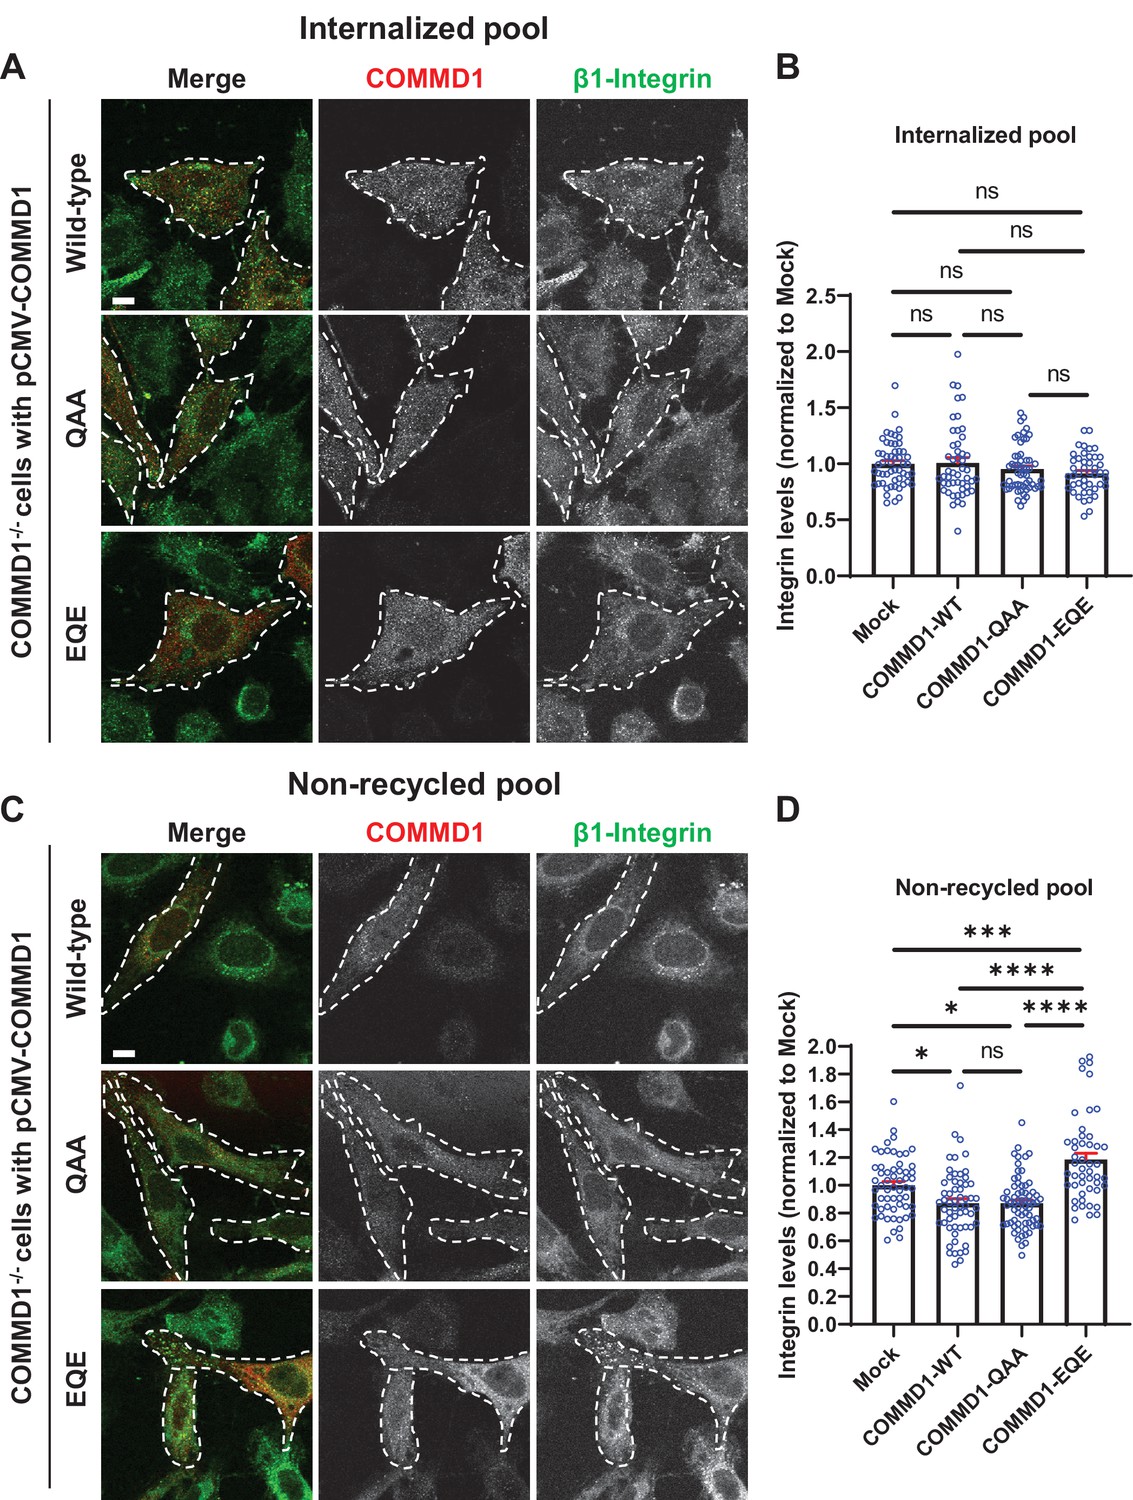
Mutation of the putative phosphoinositide binding site on COMMD1 delays recycling of β1-integrin.
(A,C) COMMD1-/- HeLa cells were infected for 24 hr with lentivirus expressing either wild-type COMMD1, or the COMMD1-QAA (R133Q/H134A/K167A) or COMMD1-EQE (R133E/H134Q/K167E) mutants. Cells were then incubated with anti-β1-integrin antibodies for 1 hr in serum containing media, then acid washed and either fixed (A and B) or incubated again with serum containing media for 1 hr then acid washed and fixed (C and D). Bar: 10 µm. (B,D) Intensity of integrin was quantified from three independent experiments and values were normalized to the corresponding average intensity of the mock treatment cohort. Data presented as mean ± SE. Statistical significance was analyzed using one-way ANOVA and Tukey’s post hoc test. *p < 0.05, ***p < 0.005, ****p < 0.001, and ns, not significant. Transfected cells highlighted with white dotted lines.
-
Figure 9—source data 1
Contains numerical source data for Figure 9.
- https://cdn.elifesciences.org/articles/69709/elife-69709-fig9-data1-v2.zip
Figure 9—figure supplement 1
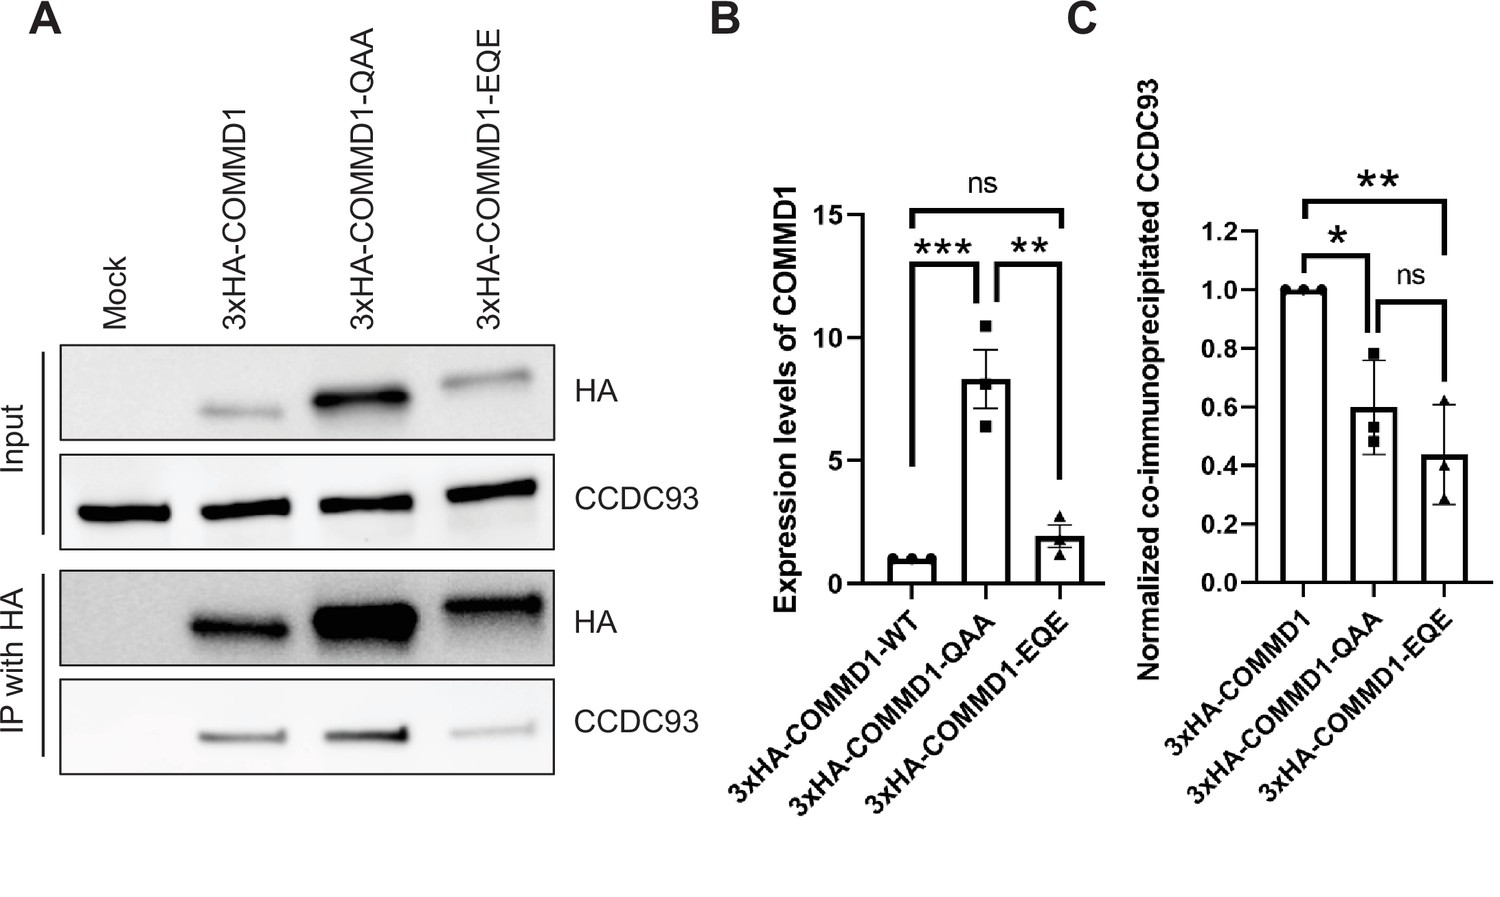
Mutation of the putative phosphoinositide binding site on COMMD1 partially impairs the interaction with CCDC93.
(A) HeLa cells were infected with lentivirus expressing 3xHA-COMMD1, or 3xHA-COMMD1-QAA (R133Q/ H134A/K167A) or 3xHA-COMMD1-EQE (R133E/H134Q/K167E) mutants for 48 hr. Cells were lysed and immunoprecipitated with anti-HA antibodies and precipitates were immunoblotted for CCDC93 and HA-tagged COMMD1 mutants. (B) The expression levels of COMMD1 (input) was quantified from three independent experiments. The values were normalized to the wild-type COMMD1 expression levels. (C) The binding affinity for COMMD1 mutants with CCDC93 was quantified from three independent experiments. The intensity of co-immunoprecipitated CCDC93 was normalized to the pull-down pool of COMMD1. Data presented as mean ± SE. Statistical significance was analyzed using one-way ANOVA and Tukey’s post hoc test. *p < 0.05, **p < 0.01, ***p < 0.005, and ns not significant.
-
Figure 9—figure supplement 1—source data 1
Contains numerical and uncropped western blot source data for Figure 9—figure supplement 1.
- https://cdn.elifesciences.org/articles/69709/elife-69709-fig9-figsupp1-data1-v2.zip
Figure 10

Model: VPS34 and PIKfyve regulate recycling of integrins from endosomes to the plasma membrane via promoting the ordered assembly of SNX17, WASH, Retriever, and CCC complexes.
The phosphatidylinositol 3-phosphate (PI3P) on cargo-containing endosomes is generated by VPS34 (Figure 7, Figure 7—figure supplement 1). PI3P facilitates the recruitment of SNX17 (Chandra et al., 2019; Jia et al., 2014), and SNX17 binds its cargo (Böttcher et al., 2012; Steinberg et al., 2012). The generation of PI3P likely recruits PIKfyve, via its FYVE domain (Stenmark et al., 2002), which initiates the production of PI3,5P2 and phosphatidylinositol 5-phosphate (PI5P). The generation of PI3P, PI3,5P2, and/or PI5P plays a role in the binding of the WASH complex: WASH also requires the retromer to be recruited to endosomes (Harbour et al., 2010; Harbour et al., 2012; Helfer et al., 2013; Jia et al., 2012; Zavodszky et al., 2014). The generation of PI3,5P2 and/or PI5P by PIKfyve then plays a role in recruitment of the CCC complex (Figure 7). The CCC complex also binds the WASH complex via direct interaction of CCDC93 with the WASH subunit, FAM21 (Phillips-Krawczak et al., 2015). The Retriever complex may also associate with endosomes by directly binding to PI3,5P2 or PI5P, and/or may require PIKfyve activity to recruit the CCC complex. The Retriever complex interacts with and requires the CCC complex to bind to endosomes (McNally et al., 2017; Phillips-Krawczak et al., 2015; Singla et al., 2019). In addition, the Retriever subunit VPS26C interacts directly with SNX17 (Farfán et al., 2013; McNally et al., 2017). Importantly, while SNX17 and WASH are necessary, they are not sufficient for the recruitment of either Retriever or CCC (Figure 7, apilimod treatment). Recruitment of the Retriever and CCC complexes requires PIKfyve. Furthermore, the CCC subunit CCDC22 in turn recruits MTMR2, which is required for late steps in this recycling pathway (Singla et al., 2019). Importantly, recruitment of MTMR2 lowers PI3P and PI3,5P2 (Singla et al., 2019). Together, these studies suggest that PI3P and PI3,5P2 coordinate the SNX17-Retriever-CCC-WASH pathway. PI3P is required for initiation, PI3,5P2 and/or PI5P act in the middle steps, and MTMR2, which removes PI3P and PI3,5P2, acts late in the pathway. Once the SNX17-Retriever-CCC-WASH complex assembles with cargo, the WASH complex mediates actin nucleation (Derivery et al., 2009; Gomez and Billadeau, 2009) and SNX17 recruits EHD1 (Dhawan et al., 2020) to enable fission of cargo containing membranes for efficient recycling.
Author response image 1
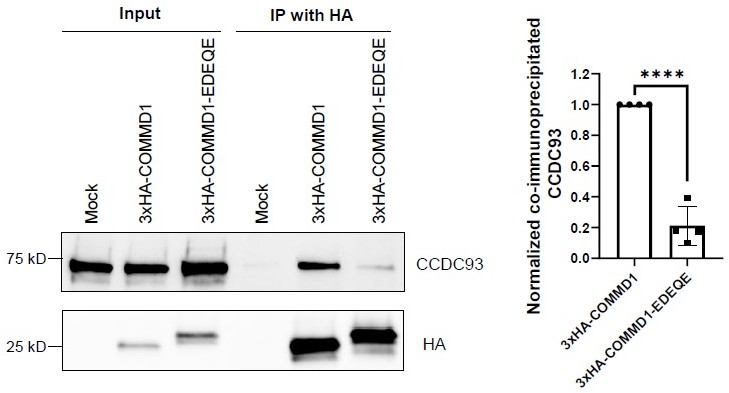
Mutation of the putative phosphoinositide binding site on COMMD1 impairs the interaction with CCDC93.
HeLa cells were infected with lenti-virus expressing 3xHA-COMMD1 or 3xHA-COMMD1-EDEQE (R120E/ K129D/R133E/H134Q/K167E) mutant for 48 hours. 3xHA-COMMD1 were immunoprecipitated with HA antibodies and the precipitates were immunoblotted for CCDC93. The binding affinity for COMMD1 mutants with CCDC93 was quantified from three independent experiments. The intensity of co-immunoprecipitated CCDC93 was normalized to relevant pull-downed COMMD1. Statistical significance was analyzed using unpaired two-tailed Student’s T-test. **** P<0.0001.#.
Tables
Key resources table
| Reagent type (species) or resource | Designation | Source or reference | Identifiers | Additional information |
|---|---|---|---|---|
| antibody | Anti-HA (mouse monoclonal) | Cell signaling | 2,367 (6E2) RRID:AB_10691311 | IF (1:100) |
| antibody | Anti-HA (Rabbit monoclonal) | Cell signaling | 3,724 (C29F4) RRID:AB_1549585 | IF and WB (1:2000) |
| antibody | CCDC93 (Rabbit polyclonal) | Proteintech | 20861-1-1AP RRID:AB_10696446 | IF (1:200) and WB (1:1000) |
| antibody | COMMD1 (mouse monoclonal) | R&D systems | MAB7526 RRID:AB_2895087 | IF (1:100) |
| antibody | COMMD1 (Rabbit polyclonal) | Proteintech | 11938–1-AP RRID:AB_2083542 | IF (1:100) |
| antibody | COMMD5 (Rabbit polyclonal) | Proteintech | 10393–1-AP RRID:AB_2083555 | IF (1:100) |
| antibody | Cortactin (mouse monoclonal) | Millipore | 05–180 (4 F11) RRID:AB_309647 | IF (1:100) |
| antibody | EEA1 (mouse monoclonal) | BD biosciences | 610456 RRID:AB_397829 | IF (1:25) |
| antibody | EEA1 (Rabbit monoclonal) | Cell signaling | 3,288 (C45B10) RRID:AB_2096811 | IF (1:100) |
| antibody | FAM21 (Rabbit polyclonal) | Daniel D. Billadeau | N/A | IF (1:1000) |
| antibody | Lamp1 (mouse monoclonal) | Developmental Hybridoma | H4A3 RRID:AB_2296838 | IF (1:50) |
| antibody | Lamp1 (Rabbit polyclonal) | Abcam | ab24170 RRID:AB_775978 | IF (1:1000) |
| antibody | Lamp2a (mouse monoclonal) | BD biosciences | 555,803 (H4B4) RRID:AB_396137 | IF (1:100) |
| antibody | LRP1 (Rabbit polyclonal) | Cell signaling | 64099 RRID:AB_2799654 | WB (1:1000) |
| antibody | PIKfyve (Rabbit polyclonal) | Proteintech | 13361–1-AP RRID:AB_10638310 | WB (1:1000) |
| antibody | RAB11 (Rabbit monoclonal) | Abcam | ab128913 RRID:AB_11140633 | IF (1:200) |
| antibody | RAB4 (Rabbit polyclonal) | Abcam | ab13252 RRID:AB_2269374 | IF (1:200) |
| antibody | RAB5 (Rabbit polyclonal) | Abcam | ab18211 RRID:AB_470264 | IF (1:200) |
| antibody | RAB7 (Rabbit monoclonal) | Abcam | ab137029 RRID:AB_2629474 | IF (1:100) |
| antibody | SNX17 (Rabbit polyclonal) | Protein Atlas | HPA043867 RRID:AB_10961129 | IF (1:100) |
| antibody | Strumpellin (Rabbit polyclonal) | Bethyl Laboratories | A304-809A RRID:AB_2621004 | IF (1:100) |
| antibody | Transferrin receptor (Rabbit polyclonal) | Proteintech | 10084–2-AP RRID:AB_2240403 | WB (1:2000) |
| antibody | VPS35 (Goat polyclonal) | Abcam | ab10099 RRID:AB_296841 | IF (1:500) |
| antibody | VPS35L (Rabbit polyclonal) | Daniel D. Billadeau | N/A | IF (1:500) |
| antibody | α5-integrin (Rabbit polyclonal) | Cell signaling | 4705 RRID:AB_2233962 | WB(1:1000) |
| antibody | α5-integrin (mouse monoclonal) | BD Biosciences | 555615 RRID:AB_395982 | assay 5 µg/ml |
| antibody | β1-integrin (mouse monoclonal) | Millipore | MAB2000 (HB1.1) | assay 5 µg/ml |
| antibody | β1-integrin (mouse monoclonal) | Santa Cruz Biotechnology | sc-13590 (P5D2) RRID:AB_627008 | assay 5 µg/ml |
| antibody | β1-integrin (Rabbit polyclonal) | Cell signaling | 4706 RRID:AB_823544 | WB(1:1000) |
| chemical compound, drug | Apilimod | Axon Medchem | Axon1369 | 1 µM |
| chemical compound, drug | VPS34-IN1 | EMD | 532,628 | 0.1 µM, 1 µM |
| chemical compound, drug | DMEM | Thermo Fisher Scientific | 11,995 | |
| chemical compound, drug | FBS | Sigma | F4135 | |
| chemical compound, drug | penicillin/ streptomycin/ glutamate | Life Technologies | 10,378 | |
| chemical compound, drug | Blasticidin S HCl | Life Technologies | A11139 | |
| chemical compound, drug | Hygromycin B | Life Technologies | 10,687 | |
| chemical compound, drug | Doxycycline | Sigma | D9891 | |
| chemical compound, drug | Fibronectin | Sigma | F1141 | |
| chemical compound, drug | Laminin | Gibco | 23017015 | |
| commercial assay or kit | FuGENE 6 | Promega | E2691 | |
| commercial assay or kit | Lipofectamine 2000 | Thermo Fisher Scientific | 11668027 | |
| commercial assay or kit | Dharmafect 1 | Horizon Discovery Biosciences | T-2001 | |
| commercial assay or kit | Click-iT EdU Imaging Kits | Invitrogen | C10337 | |
| commercial assay or kit | LIVE/DEAD Viability/Cytotoxicity Kit | Invitrogen | L3224 | |
| commercial assay or kit | pGEM-T-Easy vector system | Promega | A1360 | |
| recombinant DNA reagent | Plasmid: pHA-CMV | Clontech | 631,604 | |
| recombinant DNA reagent | Plasmid: 6xHA-PIKfyve | Weisman Lab | See Materials and Methods. Available from LSW. | |
| recombinant DNA reagent | Plasmid: 6xHA-PIKfyve-KYA | Weisman Lab | See Materials and Methods. Available from LSW. | |
| recombinant DNA reagent | Plasmid: pSpCas9(BB)–2A-GFP | Addgene | 48,138 | |
| recombinant DNA reagent | pLenti-Lox-EV-3XHA-COMMD1 | Weisman Lab | See Materials and Methods. Available from LSW. | |
| recombinant DNA reagent | pLenti-Lox-EV-3XHA-COMMD1-QAA (R133Q/ H134A/ K167A) | Weisman Lab | See Materials and Methods Available from LSW. | |
| recombinant DNA reagent | pLenti-Lox-EV-3XHA-COMMD1-EQE (R133E/ H134Q/ K167E) | Weisman Lab | See Materials and Methods. Available from LSW. | |
| cell line (Homo-sapiens) | Human: HeLa | Richard Klausner Lab | STR validated RRID:CVCL_0030 | |
| cell line (Homo-sapiens) | Human: HeLa | Burstein Lab | STR validated RRID:CVCL_0030 | |
| cell line (Homo-sapiens) | Human: HeLa COMMD1-/- cells | Burstein Lab | N/A | |
| cell line (Homo-sapiens) | Human: HEK293 | ATCC | CRL-1573 | |
| cell line (Homo-sapiens) | Human: HUH7 | David Ginsburg Lab (University of Michigan-Ann Arbor) | N/A | |
| cell line (Mus-musculus) | Mouse: Primary MEF (Wild Type) | Weisman Lab Zolov et al., 2012 | ||
| cell line (Mus-musculus) | (PIKfyveβ-geo/β-geo) | Weisman Lab Zolov et al., 2012 | ||
| cell line (Mus-musculus) | Mouse: Primary neonatal cardiac fibroblasts | Alan Smrcka (University of Michigan-Ann Arbor) | N/A | |
| cell line (Homo-sapiens) | Human: Flp-In T-Rex 293 cells | Life Technologies | R780-07 | |
| cell line (Homo-sapiens) | Human: Flp-In T-Rex 293-3XFLAG | Weisman Lab McCartney et al., 2014b | ||
| cell line (Homo-sapiens) | Human: Flp-In T-Rex 293-3XFLAG-Citrine-PIKfyve | Weisman Lab McCartney et al., 2014b | ||
| cell line (Homo-sapiens) | Human: Flp-In T-Rex 293-3XFLAG-Citrine-PIKfyve-KYA | Weisman Lab McCartney et al., 2014b | ||
| cell line (Homo-sapiens) | Human: 3xHA-PIKfyve knock-in HEK293 | Weisman Lab | This manuscript. Available from LSW | |
| software, algorithm | Adobe Photoshop CS6 | Adobe Studios | N/A | |
| software, algorithm | Adobe Illustrator CS6 | Adobe Studios | N/A | |
| software, algorithm | Excel | Microsoft | N/A | |
| software, algorithm | Prism 8.1.2 | GraphPad | https://www.graphpad.com | |
| software, algorithm | ImageJ/Fiji | Schindelin et al., 2012 | https://imagej.net/Fiji | |
| software, algorithm | CellProfiler | Lamprecht et al., 2007; Schindelin et al., 2012 | https://cellprofiler.org | |
| software, algorithm | Image Lab 6.0.0 | Bio-Rad | https://www.bio-rad.com/ |
Additional files
Download links
A two-part list of links to download the article, or parts of the article, in various formats.
Downloads (link to download the article as PDF)
Open citations (links to open the citations from this article in various online reference manager services)
Cite this article (links to download the citations from this article in formats compatible with various reference manager tools)
Lipid kinases VPS34 and PIKfyve coordinate a phosphoinositide cascade to regulate retriever-mediated recycling on endosomes
eLife 11:e69709.
https://doi.org/10.7554/eLife.69709


