Rpl24Bst mutation suppresses colorectal cancer by promoting eEF2 phosphorylation via eEF2K
- CRUK Beatson Institute, Garscube Estate, United Kingdom
- Institute of Cancer Sciences, University of Glasgow, United Kingdom
- Department of Biological Sciences, University of Adelaide, Australia
- Lifelong Health, South Australian Health and Medical Research Institute, Australia
- UK Dementia Research Institute at the University of Cambridge and Department of Clinical Neurosciences, University of Cambridge, United Kingdom
- School of Biosciences, Division of Natural Sciences, University of Kent, United Kingdom
- MRC Toxicology Unit, University of Cambridge, United Kingdom
Figures
Figure 1 with 2 supplements
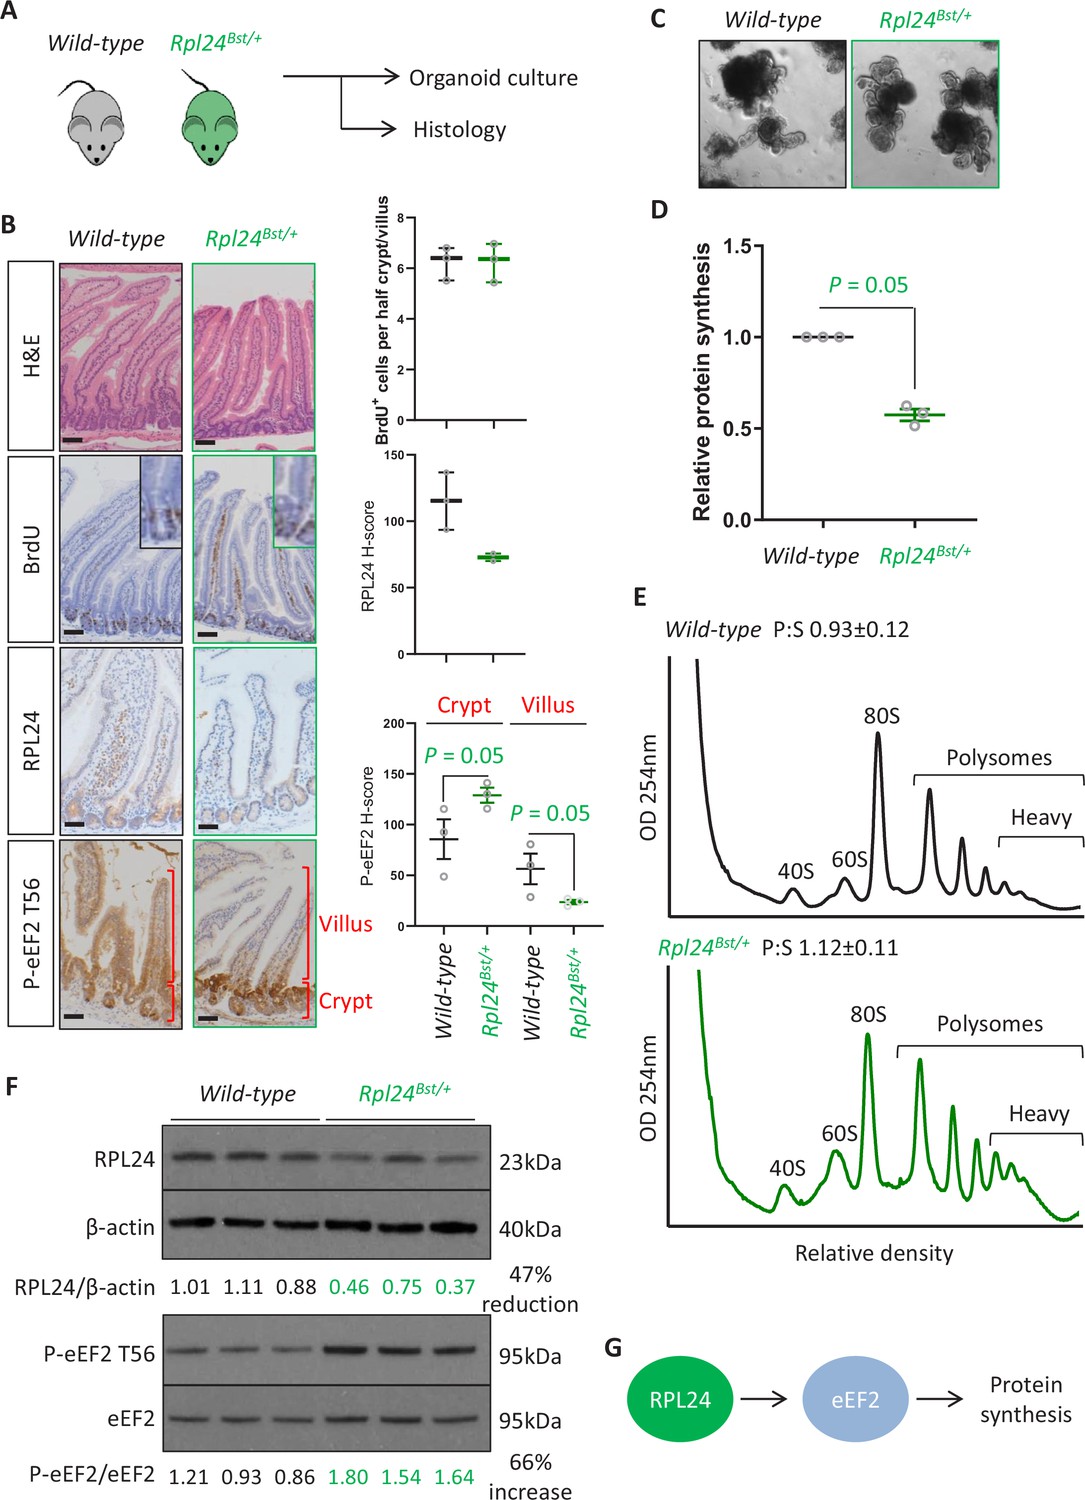
Rpl24Bst mutation slows translation elongation but does not affect homeostasis in the intestinal epithelium.
(A) Schematic representation of experimental procedure. Intestines from wild-type or Rpl24Bst/+ mice were analysed by histology or processed to make intestinal organoids. (B) Staining for H&E, BrdU, RPL24, and P-eEF2 T56 in sections from the small intestines of wild-type and Rpl24Bst/+ mice. Red brackets in P-eEF2 staining indicate crypts and villi, corresponding to quantification to the right. Bars represent 50 µm. Graphs on the right show scoring for BrdU-positive cells, and H-score calculated for RPL24 and P-eEF2 T-56, plotted ± standard error of the mean (SEM). Significance was determined by one-tailed Mann–Whitney U test. (C) Micrographs of small intestinal organoids generated from wild-type or Rpl24Bst/+ mice. (D) Protein synthesis rate quantified by 35S-methionine incorporation in wild-type or Rpl24Bst/+ organoids (n = 3), expressed relative to the wild-type protein synthesis rate (=1). Data are from three biologically independent organoid lines for each genotype represented ± SEM with significance determine by Mann–Whitney U test. (E) Representative polysome profiling from wild-type or Rpl24Bst/+ organoids. Average polysome:subpolysome ratios from three independent organoid lines per genotype are shown above each profile ± SEM. (F) Western blotting from protein lysates generated from three biologically independent organoid lines for each genotype. Values for RPL24 expression relative to β-actin and P-eEF2 T56 relative to eEF2 are shown under each lane. The average of the wild-type lanes in both cases has been set to 1. There is a 47% reduction in RPL24 and a 66% increase in P-eEF2 T56 in the Rpl24Bst/+ organoids. (G) Schematic of the potential role of RPL24 in regulating protein synthesis via eEF2. All scale bars are 50 μm.
-
Figure 1—source data 1
Top: data from Figure 4F.
Bottom: original western blotting images with areas for each antibody annotated and boxed in red.
- https://cdn.elifesciences.org/articles/69729/elife-69729-fig1-data1-v2.pdf
Figure 1—figure supplement 1
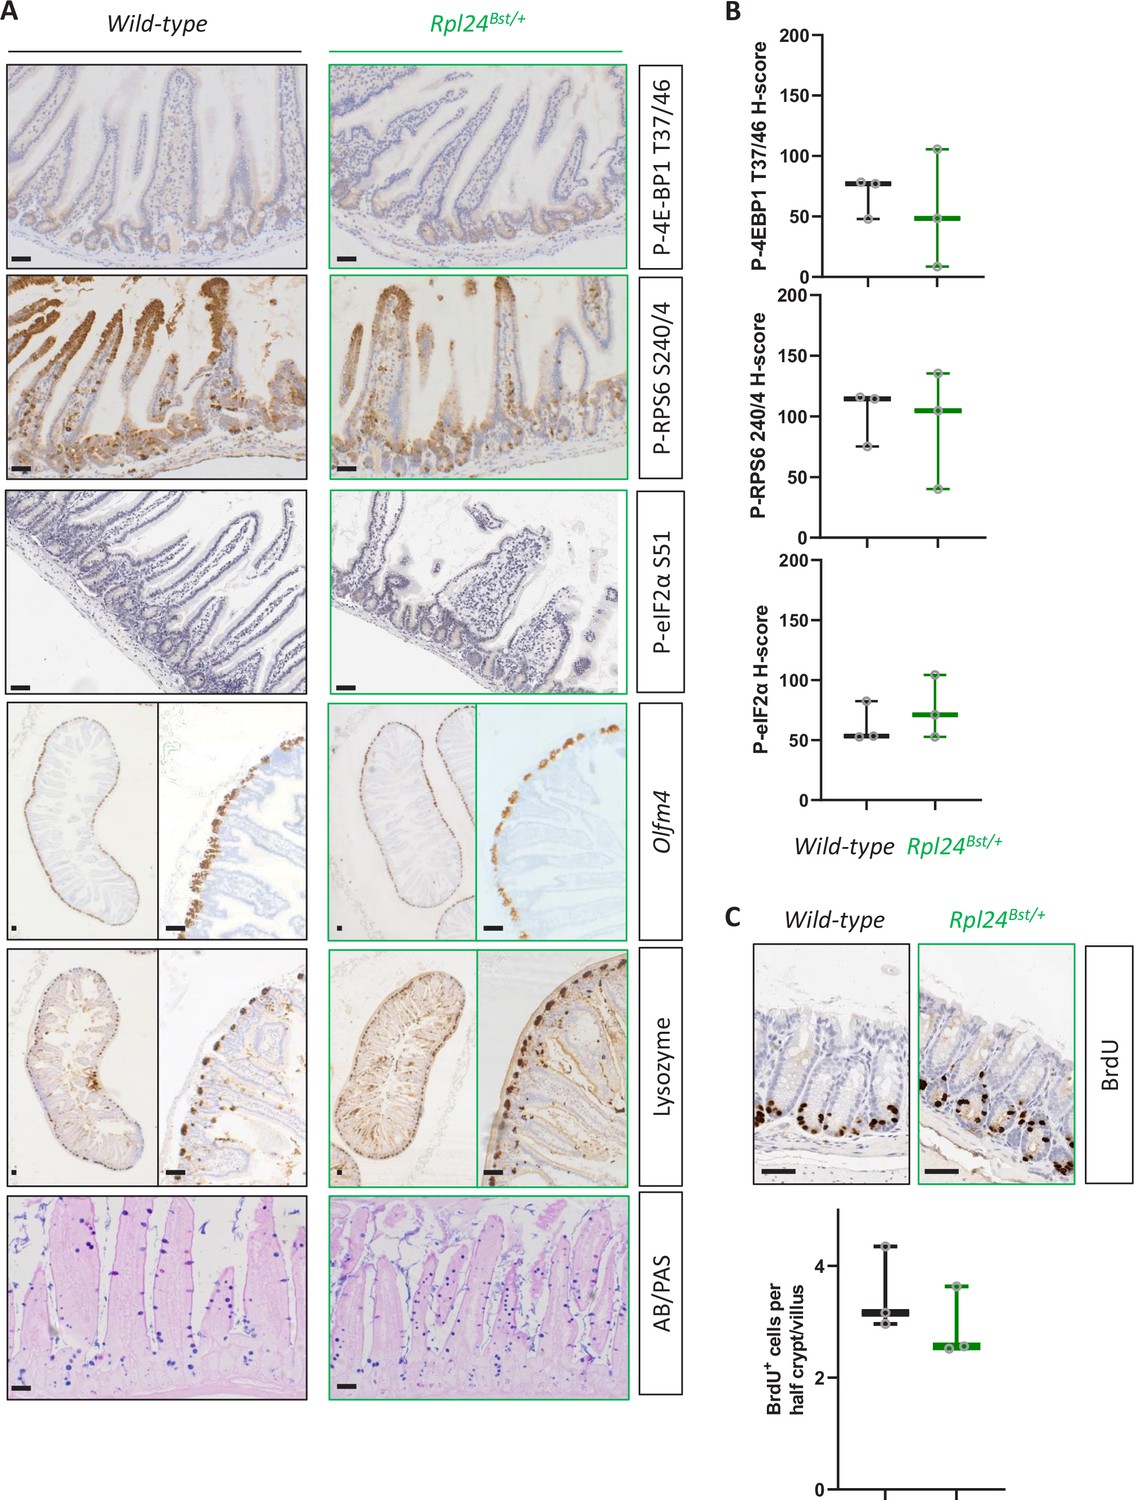
Rpl24Bst mutation does not affect intestinal homeostasis.
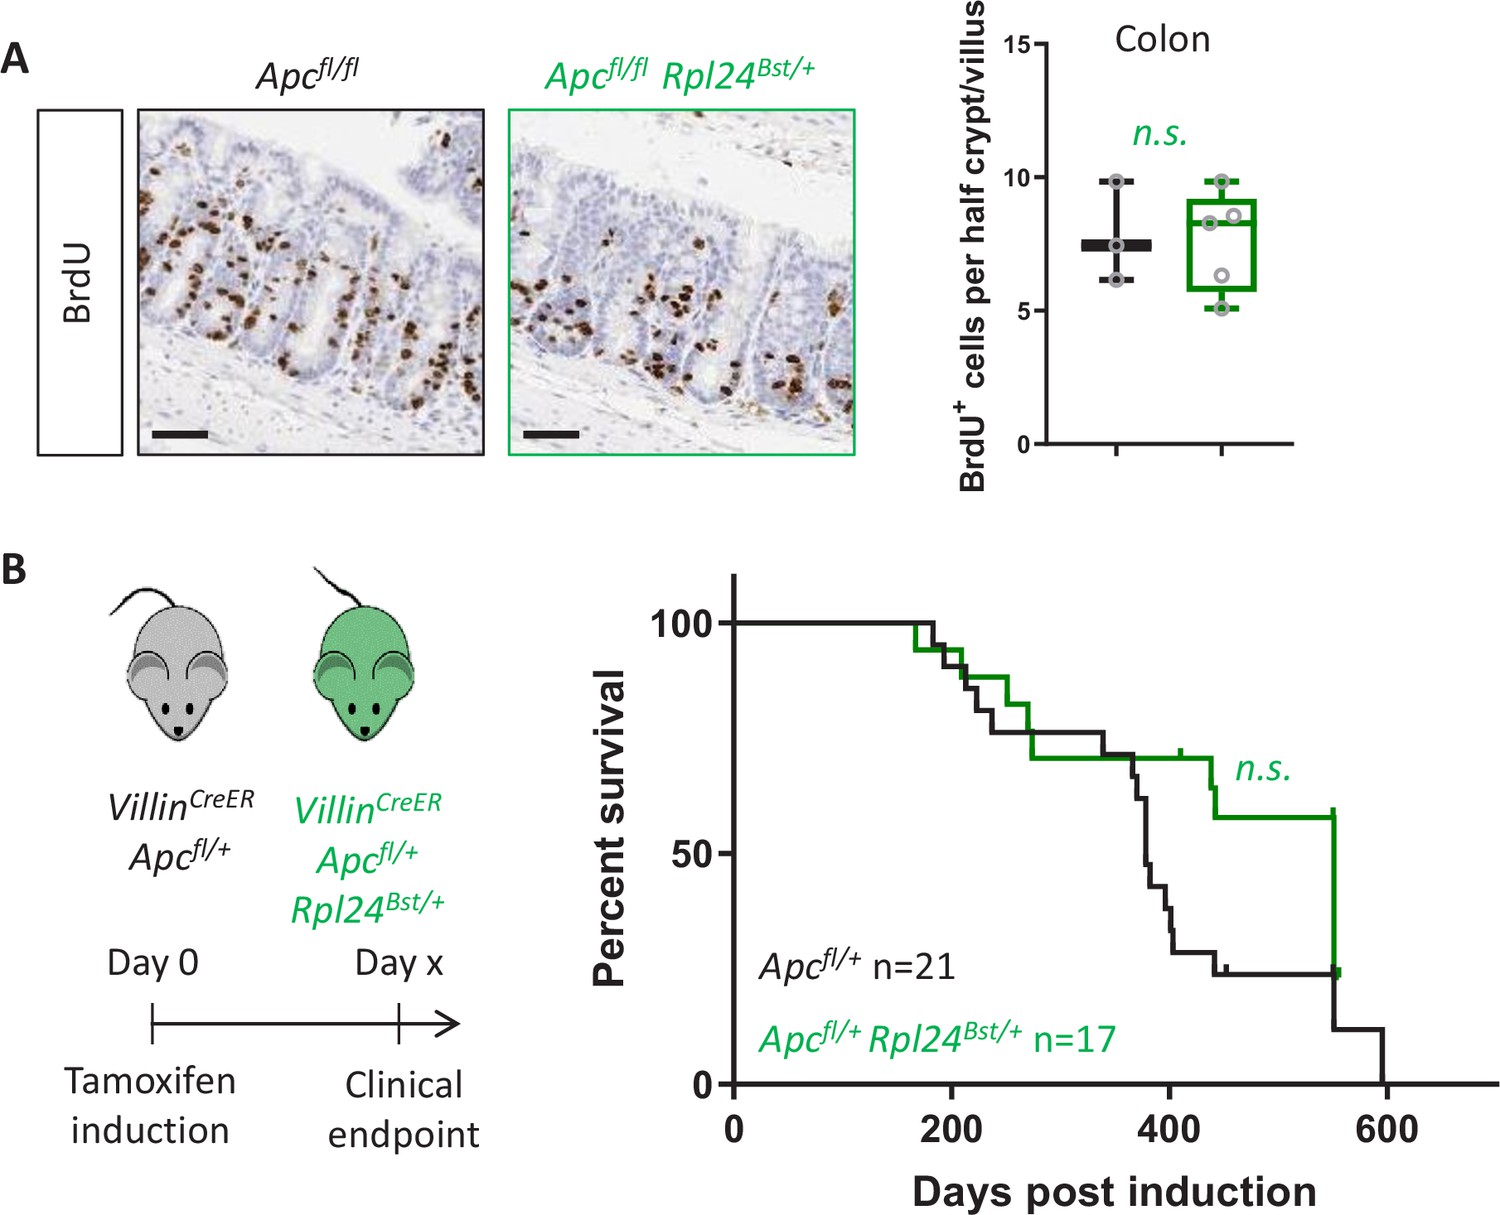
(A) Representative images of staining for intestinal lineages and translation associated phosphorylation sites – P-4E-BP1 T37/46, P-RPS6 S240/4, and P-eIF2α S51 of intestinal sections from wild-type and Rpl24Bst/+ mice. Olfm4 defines stem cells, lysozyme for Paneth cells, and AB/PAS (Alcian blue/periodic acid-Schiff) for goblet cells. Bars represent 50 µm. (B) H-Score quantification of P-RPS6 S240/4, P-4E-BP1 T37/46, and P-eIF2α S51 from the same experiment as in (A). (C) BrdU staining of the medial colon from wild-type and Rpl24Bst mice, top, with scoring of BrdU-positive cells per half crypt/villus axis below. Scores are from 3 mice per genotype, each plotted as the average of at least 20 axes. All scale bars are 50 μm.
Figure 1—figure supplement 2
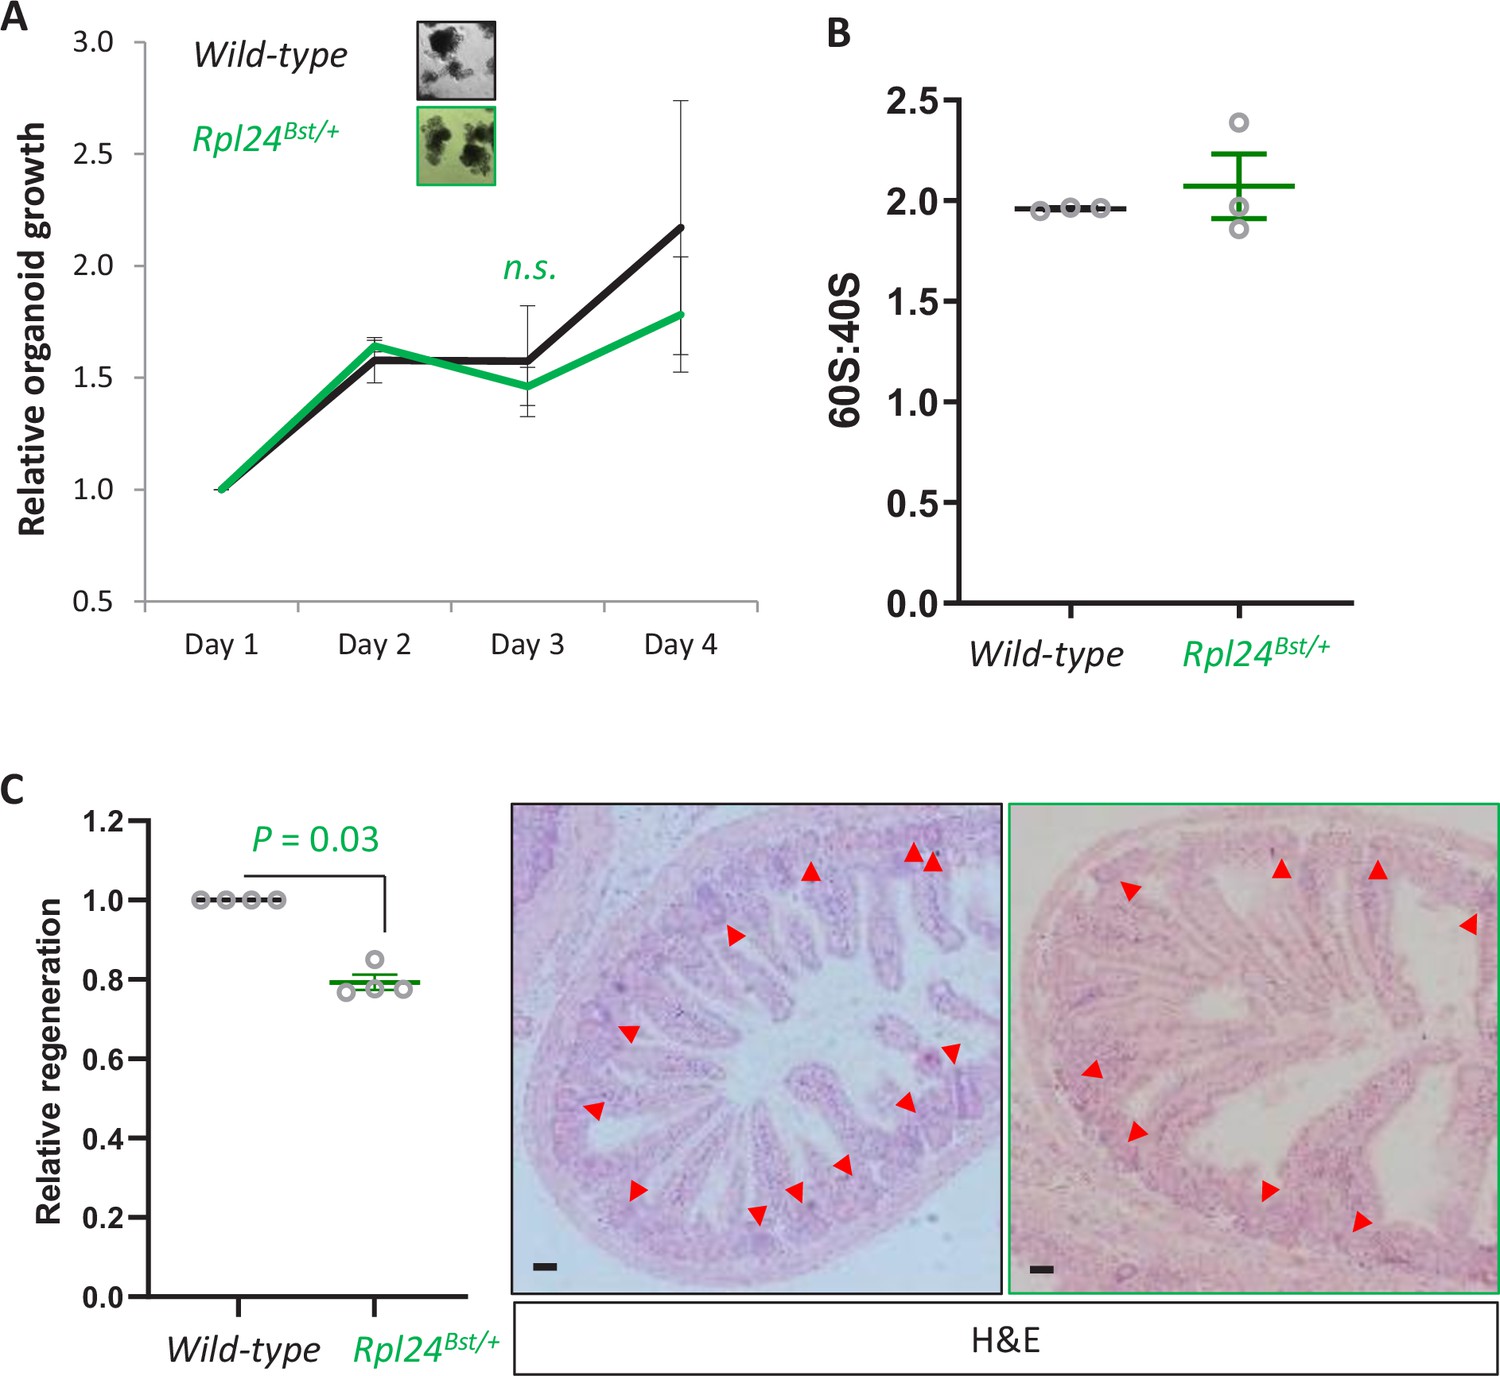
Rpl24Bst mutation does not alter proliferation in organoids or the 60S:40S ratio, but does suppress regeneration post irradiation.
(A) Organoids either wild-type of mutant for Rpl24Bst were grown over 4 days and the change in growth plotted relative to day 1. Triplicate independent lines were used for each genotype, with the average of these plotted on the graph ± standard error of the mean (standard error of the mean, SEM). Lack of significance was determined by Mann–Whitney U test. (B) Area under the curve for 40S and 60S ribosomal subunits was determined from the traces in Figure 1E. Data are from three independent biological replicates ± SEM. (C) Wild-type or Rpl24Bst mice were given 10 Gy of irradiation then sampled 72 hr later. The number of regenerative crypts was quantified from at least six cross sections and the average plotted relative to wild-type regeneration set as 1 (n = 4 per genotype). Micrograph insets show representative sections of intestine for wild-type (black box) and Rpl24Bst/+ (green box) mice. Red arrows indicate regenerating crypts. Bars represent 50 µm. Data are represented as the mean ± SEM with significance determined by Mann–Whitney U test. All scale bars are 50 μm.
Figure 2 with 2 supplements
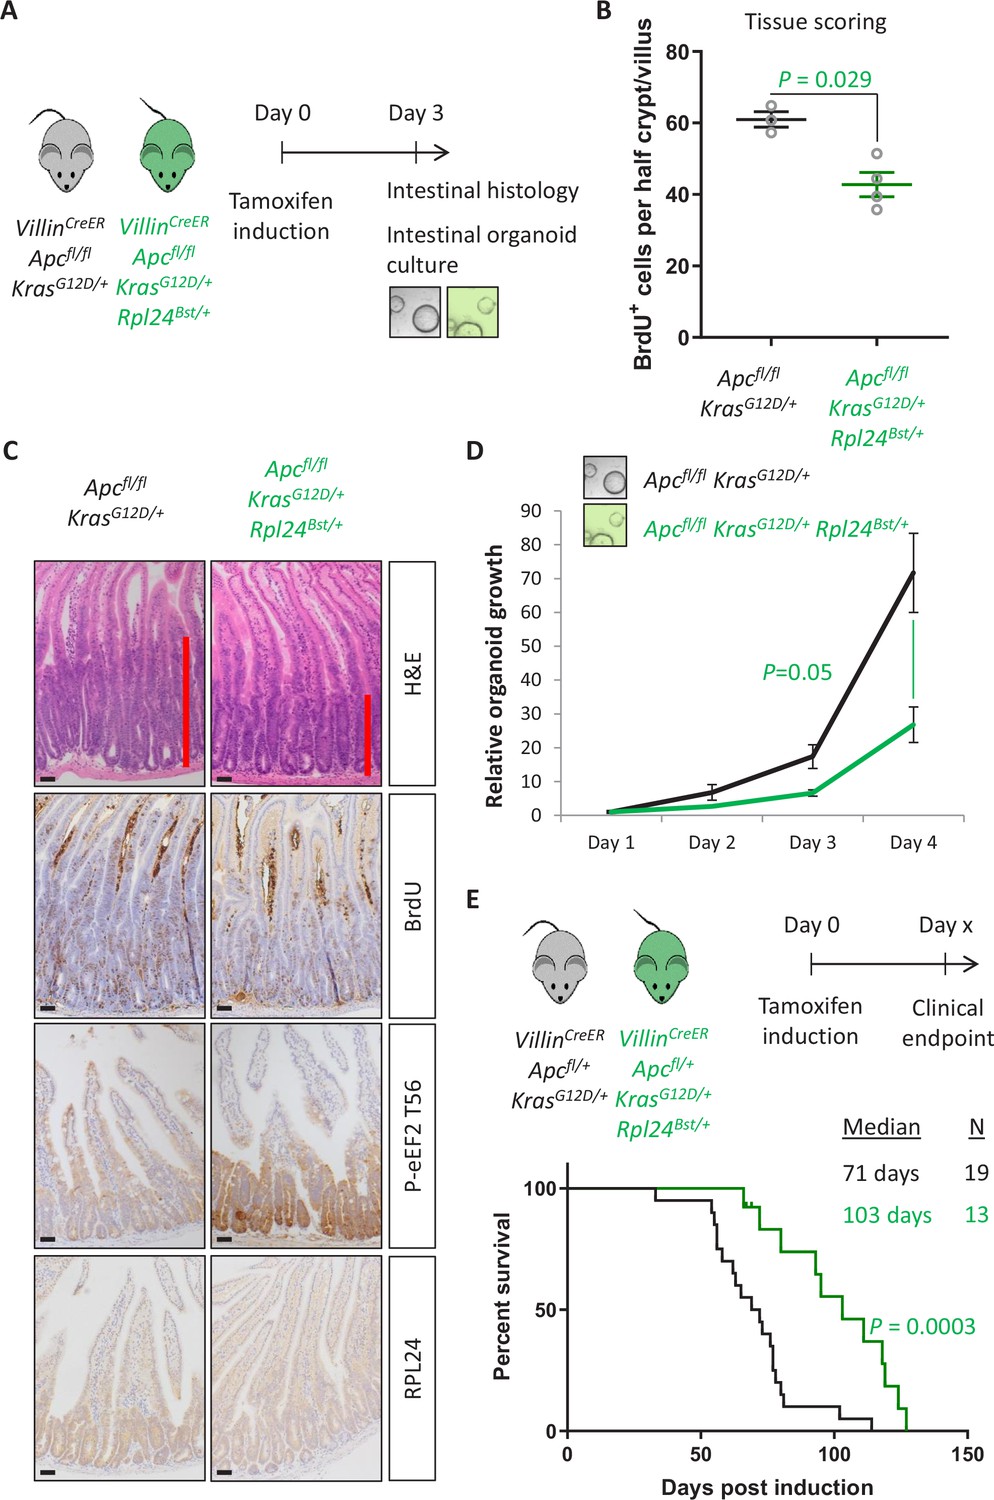
Rpl24Bst mutation suppresses proliferation and extends survival in an Apc-deficient Kras-mutant mouse model of colorectal cancer (CRC).
(A) Schematic representation of experimental protocols. VillinCreER Apcfl/fl KrasG12D/+ or VillinCreER Apcfl/fl KrasG12D/+ Rpl24Bst/+ mice were induced by intraperitoneal injection of tamoxifen at 80 mg/kg then intestinal tissue analysed 3 days later. Tissue was taken for histological analysis or processed into intestinal organoids. (B) Quantification of BrdU incorporation in small intestinal crypt/villus axes following deletion of Apc and activation of Kras, with (n = 4) or without (n = 3) Rpl24Bst mutation. Data are represented as the mean number of BrdU-positive cells per half crypt/villus from >20 axes per mouse ± standard error of the mean (SEM). Significance was determined by Mann–Whitney U test. (C) Representative images of intestines from the same experiment as in (B), stained for H&E, BrdU, P-eEF2 T56, and RPL24. The red bar on the H&E images indicates the extent of the proliferative zone. Bars represent 50 µm. (D) Apcfl/fl KrasG12D/+ organoids with or without Rpl24Bst mutation were grown for 4 days and growth relative to day 1 determined by Cell-Titer Blue assay. Data show the mean ± SEM of n = 3 independent organoid lines. Significance was determined by one-tailed Mann–Whitney U test. (E) Top: schematic of experimental protocol. VillinCreER Apcfl/+ KrasG12D/+ or VillinCreER Apcfl/+ KrasG12D/+ Rpl24Bst/+ mice induced with 80 mg/kg tamoxifen then monitored until clinical endpoint. Survival plot for these genotypes for the days post-induction that they reached endpoint. The median survival and n number for each cohort are shown and significance determined by Mantel–Cox test. Censored subjects were removed from the study due to non-intestinal phenotypes. All scale bars are 50 μm.
Figure 2—figure supplement 1
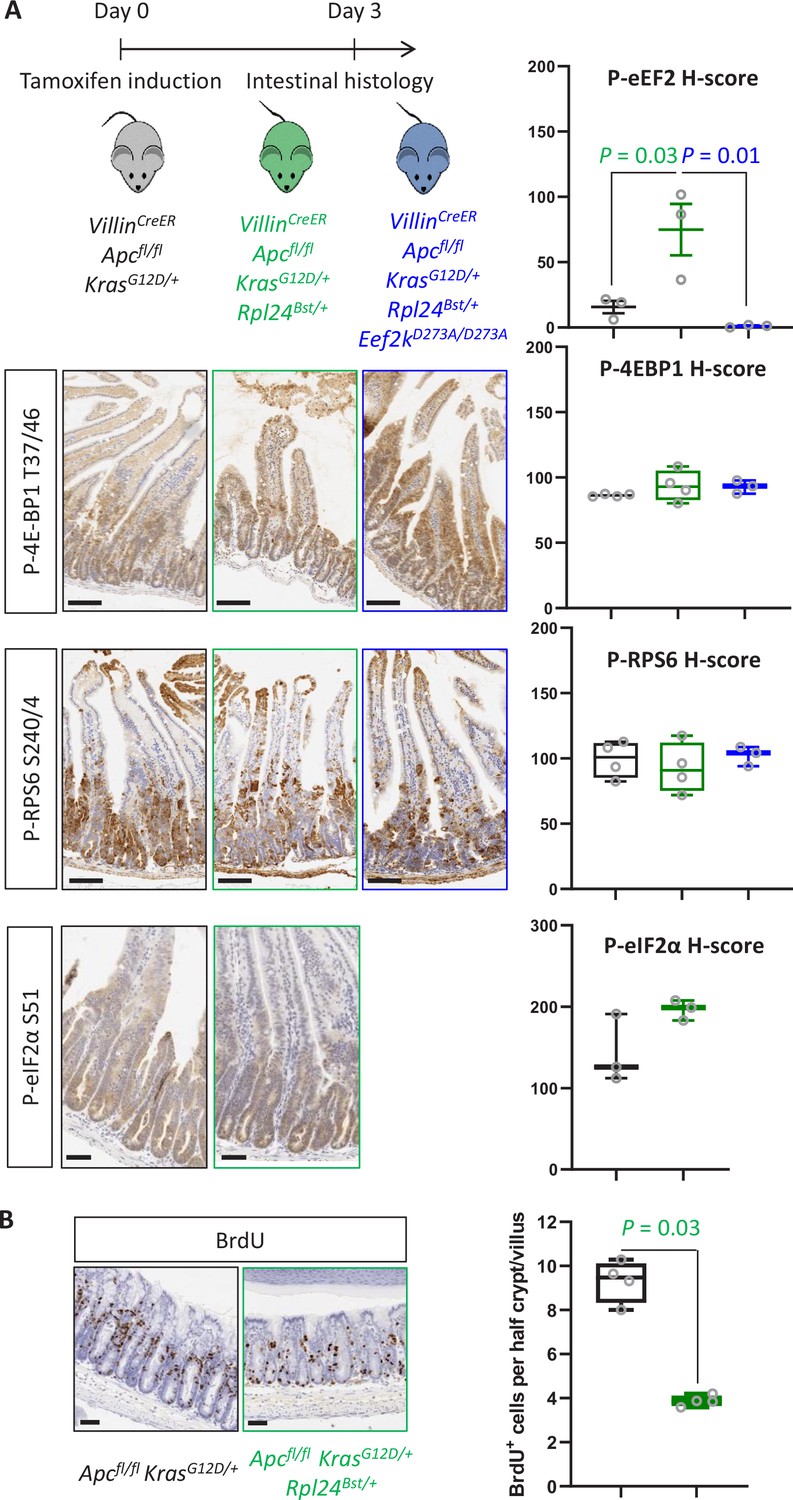
Rpl24Bst mutation leads to increased eEF2 phosphorylation.
(A) Top: Schematic representation of experimental approach. VillinCreER Apcfl/fl KrasG12D/+, VillinCreER Apcfl/fl KrasG12D/+ Rpl24Bst/+, or VillinCreER Apcfl/fl KrasG12D/+ Rpl24Bst/+ Eef2kD273A/D273A mice were induced by intraperitoneal injection of tamoxifen at 80 mg/kg then intestinal tissue analysed 3 days later. Bottom: Staining for P‐4E‐BP1 T37/46, P‐RPS6 S240/4, and P‐eIF2α S51 from the genotypes above. VillinCreER Apcfl/fl KrasG12D/+ Rpl24Bst/+ Eef2kD273A/D273A intestines were not stained for P‐eIF2α S51. Right: H‐score quantification for P‐eEF2 T56 (matched to images shown in Figures 2C and 5C), P‐4E‐BP1 T37/46, P‐RPS6 S240/4, and P‐eIF2α S51 . Small intestines from at least 3three animals from each genotype (Apcfl/+ KrasG12D/+, Apcfl/+ KrasG12D/+ Rpl24Bst/+, and Apcfl/fl KrasG12D/+ Rpl24Bst/+ Eef2kD273A/D273A) were stained and the intensity quantified from the proliferative crypt region. Data are plotted ± standard error of the mean (standard error of the mean, SEM). Significance was determined by one‐way analysis of variance (ANOVA) analysis with Tukey’s multiple comparison. (B) Left: Representative micrograph images of each genotype stained for BrdU in the medial colons of VillinCreER Apcfl/fl KrasG12D/+ and VillinCreER Apcfl/fl KrasG12D/+ Rpl24Bst/+ mice. Right: Scores for BrdU positivity from 4 mice per genotype, each plotted as the average of at least 20 half crypt/villi. Significance was determined by Mann– Whitney U test.
Figure 2—figure supplement 2
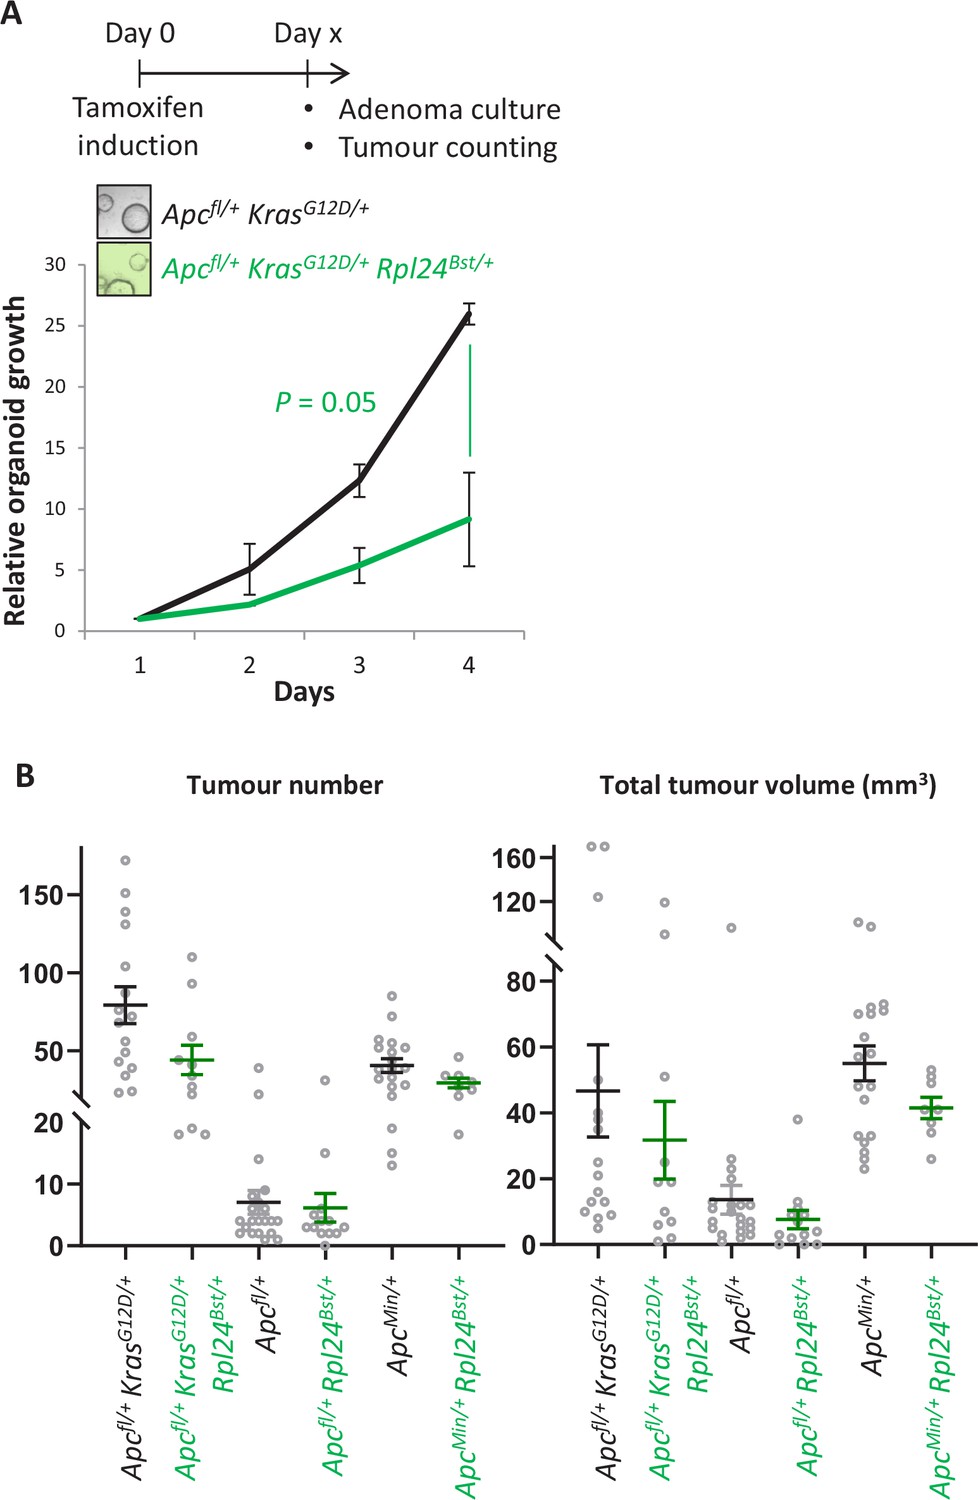
Rpl24Bst mutation suppresses proliferation in cells from colorectal cancer models.
(A) Top: schematic showing the generation of colonic adenoma cultures, where VillinCreER Apcfl/+ KrasG12D/+ and VillinCreER Apcfl/+ KrasG12D/+ Rpl24Bst/+ mice were induced and aged until colonic tumours were present. Individual adenomas were then excised and cells isolated. Bottom: Growth of these cultures over 4 days, plotted relative to day 1. Biologically independent triplicate organoid lines were used, with the averages plotted ± SEM. Significance was tested by Mann– Whitney U test. (B) Tumour number (left) and total tumour volume (right) for indicated tumour models. Each point represents and individual mouse. From left to right n = 16, 11, 21, 13, 19, and 8 mice.
Figure 3 with 2 supplements
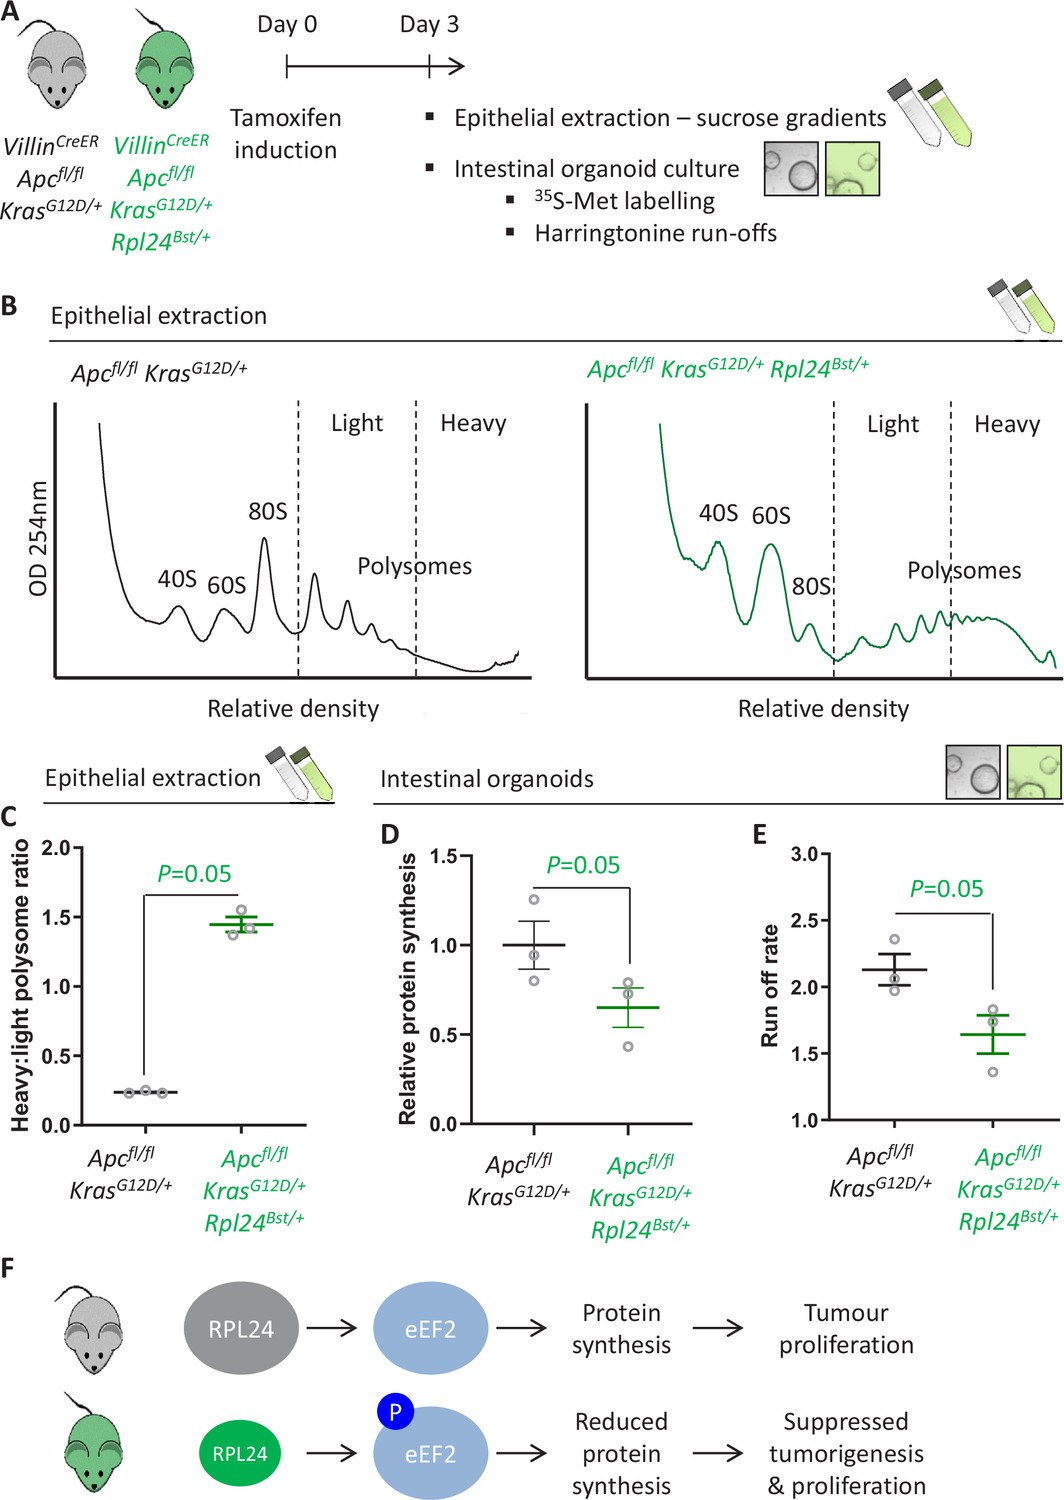
Rpl24Bst mutation slows translation elongation in Apc-deficient Kras-mutant mouse models of colorectal cancer (CRC).
(A) Schematic representation of experimental approach. VillinCreER Apcfl/fl KrasG12D/+ or VillinCreER Apcfl/fl KrasG12D/+ Rpl24Bst/+ mice were induced by intraperitoneal injection of tamoxifen at 80 mg/kg then intestinal tissue analysed 3 days later. Intestines were enriched for crypt epithelium for sucrose density analysis or processed into intestinal organoids. (B) Representative sucrose density polysome profiles generated from Apcfl/fl KrasG12D/+ intestinal extracts with or without the Rpl24Bst mutation. Subpolysomal components (40S, 60S, and 80S) and polysomes are labelled, with the polysomes also split pictorially into light and heavy. (C) Quantification of the heavy:light polysome ratio from the experiment in (B). Data show the mean of analysis from three mice ± standard error of the mean (standard error of the mean, SEM) with significance determined by one-tailed Mann–Whitney U test. (D) Relative protein synthesis rate quantified by 35S-methionine incorporation in Apcfl/fl KrasG12D/+ three biologically independent organoid lines either wild-type or mutant for Rpl24Bst. Data are represented ± SEM with significance determine by Mann–Whitney U test. (E) Ribosome run-off rate determined in Apcfl/fl KrasG12D/+ small intestinal organoid lines either wild-type or mutant for Rpl24Bst (n = 3 per genotype). Data are represented as the mean of three biological replicates ± SEM with significance determine by Mann–Whitney U test. Raw data are available in Figure 3—figure supplement 1A. (F) Schematics of the regulation of protein synthesis and tumour proliferation downstream of RPL24. Smaller RPL24 in bottom scheme represents reduced RPL24 expression. ‘P’ represents phosphorylation of eEF2.
Figure 3—figure supplement 1
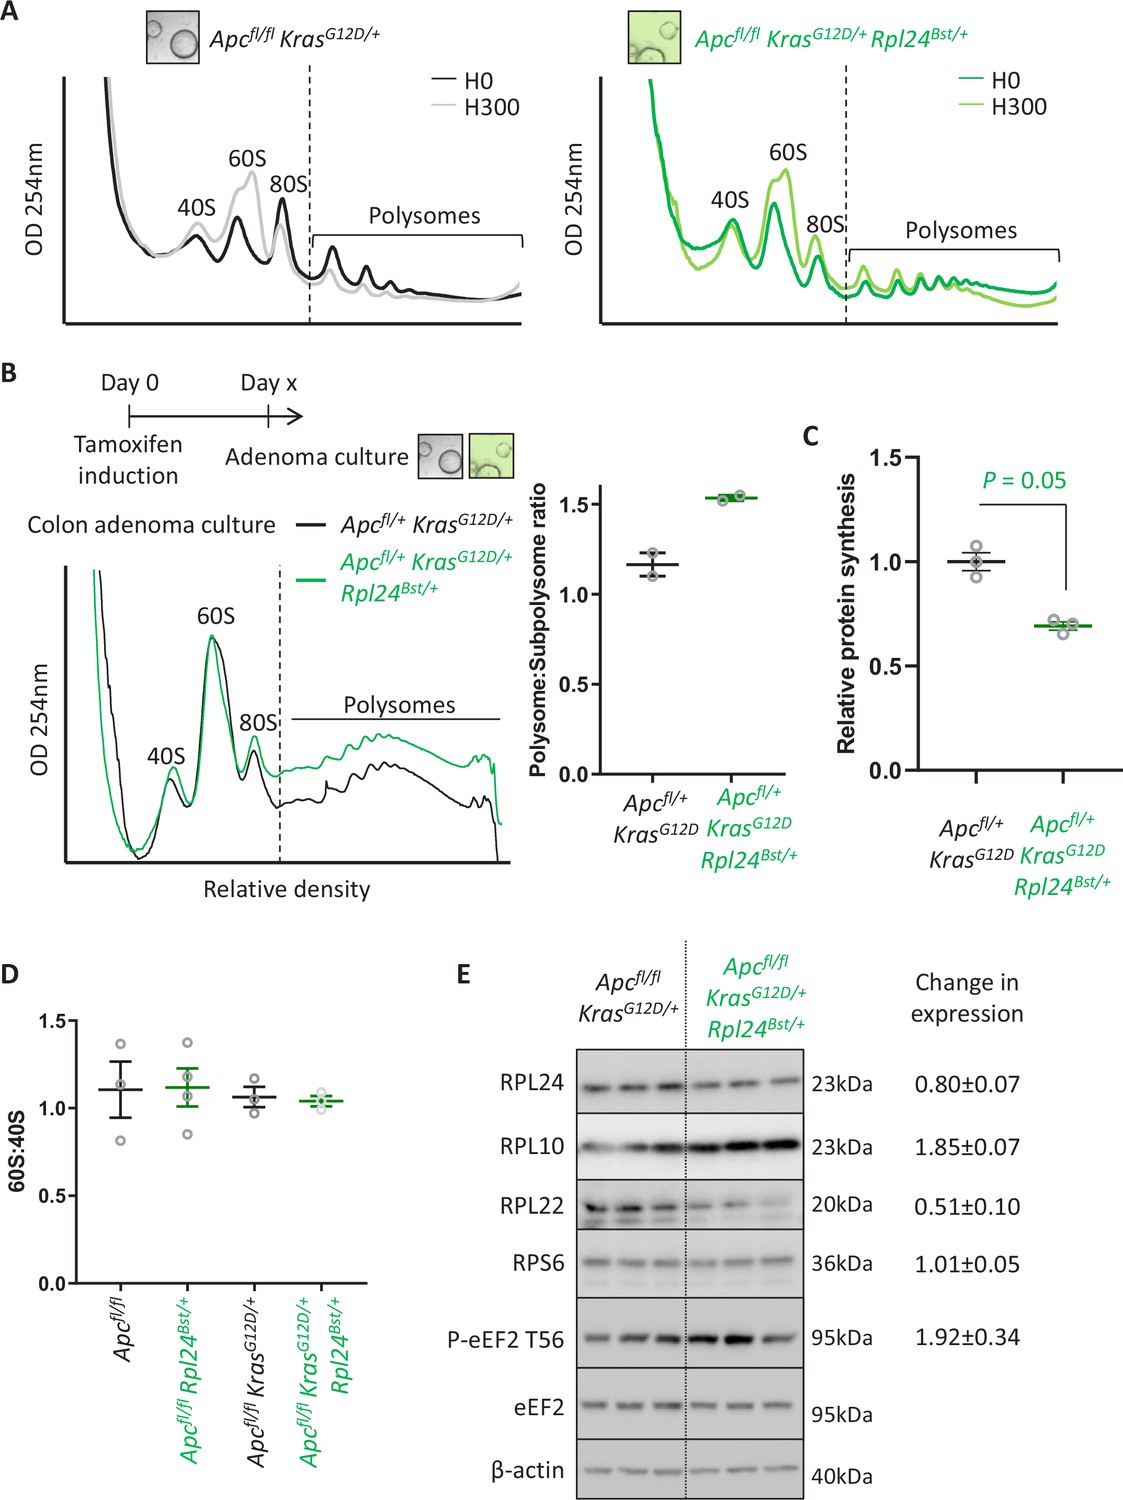
The effect of Rpl24Bst mutation on translation and ribosome composition.
(A) Representative polysome profiles from Apcfl/fl KrasG12D/+ or Apcfl/fl KrasG12D/+ Rpl24Bst/+ small intestinal organoid cultures, pre-treated with harringtonine for 5 min/300 s (H300) or untreated (H0). These traces were analysed for the run-off rates shown in Figure 3E. (B) Representative polysome profiles from Apcfl/+ KrasG12D/+ or Apcfl/+ KrasG12D/+ Rpl24Bst/+ colonic adenoma cultures (left) and quantification of the polysome to subpolysome ratio from these (right). Two biologically independent lines were analysed per genotype and plotted ± standard error of the mean (SEM). Scheme above denotes the generation of adenoma cultures from distinct colonic tumours in aged VillinCreER Apcfl/+ KrasG12D/+ and VillinCreER Apcfl/+ KrasG12D/+ Rpl24Bst/+ mice. (C) Relative protein synthesis rates quantified by 35S-methionine incorporation in the colonic adenoma cultures described in (B) with n = 3. The average protein synthesis rates were plotted relative to Apcfl/+ KrasG12D/+ controls (=1) for three organoid lines per genotype ± SEM. Significance was determined by Mann–Whitney U test. (D) 60S to 40S ratio from sucrose density gradients from lysates generated from the indicated genotypes. Data show the mean ± SEM. Representative traces are shown in Figure 3B and Figure 4—figure supplement 2B. (E) Western blotting from protein lysates generated from three biologically independent organoid lines for each genotype. Mean values for RPL24, RPL10, RPL22, and RPS6 expression relative to β-actin and P-eEF2 T56 relative to eEF2 are shown next to the relevant blot ± SEM. The average of the VillinCreER Apcfl/+ KrasG12D/+ lanes in all cases has been set to 1.
Figure 3—figure supplement 2
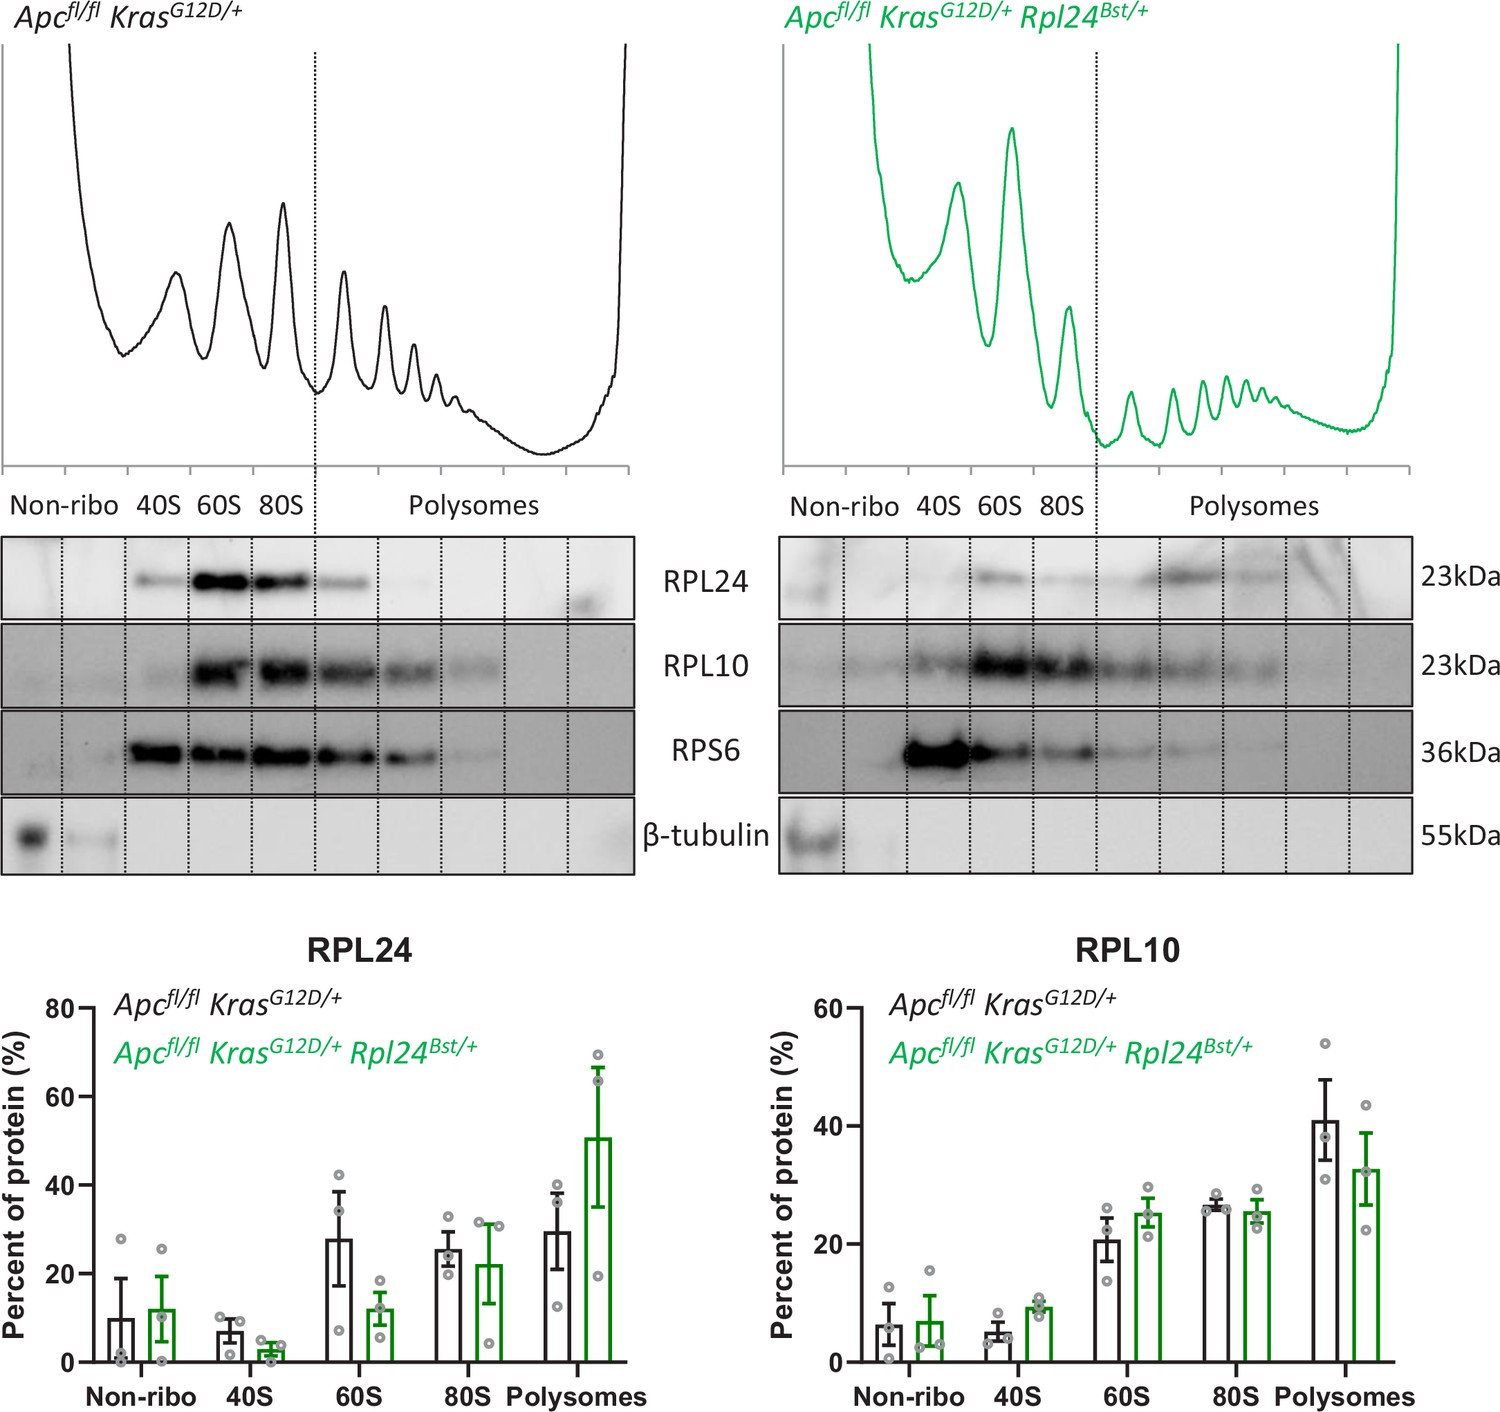
Assocation of ribosomal proteins with the ribosomes in Rpl24Bst mutant and wild-type organoids.
Top: protein purified from sucrose density gradients performed on VillinCreER Apcfl/+ KrasG12D/+ and VillinCreER Apcfl/+ KrasG12D/+ Rpl24Bst/+ organoids was resolved by sodium dodecyl sulphate–polyacrylamide gel electrophoresis (SDS–PAGE) and western blot performed for ribosomal proteins and β-tubulin, as a non-ribosomal control. Fractions within the gradient are annotated as non-ribosomal (non-ribo), 40S, 60S, 80S, and polysomes. Data are representative of three independent biological replicates. These gradients were also used in the analysis shown in Figure 3A, E, with these being the H0 replicates from that experiment. Bottom: quantification of RPL24 and RPL10 abundances, as a percentage of total cytoplasmic protein, across gradients from VillinCreER Apcfl/+ KrasG12D/+ and VillinCreER Apcfl/+ KrasG12D/+ Rpl24Bst/+ organoids. Circles show individual values from three replicates with bars plotting the mean of these ± standard error of the mean (standard error of the mean, SEM).
-
Figure 3—figure supplement 2—source data 1
Top: data from Figure 3—figure supplement 2.
Bottom: original western blotting images with areas for each antibody annotated and boxed in red.
- https://cdn.elifesciences.org/articles/69729/elife-69729-fig3-figsupp2-data1-v2.pdf
Figure 4 with 2 supplements

Rpl24Bst mutation does not suppress proteins synthesis or proliferation in Apc-deficient Kras wild-type mouse models of colorectal cancer (CRC).
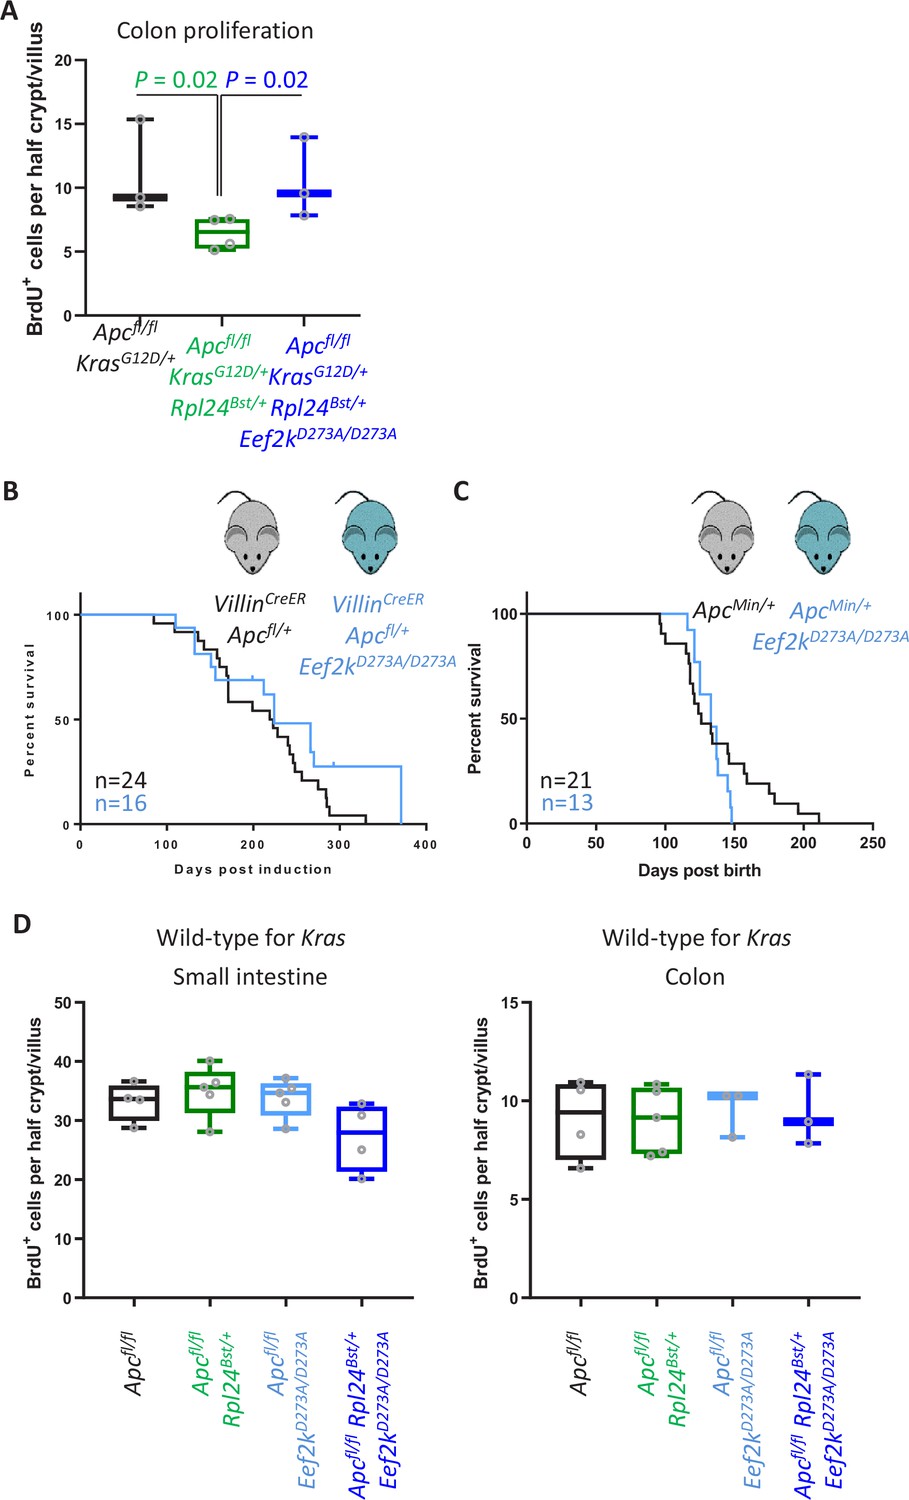
(A) Schematic representation of experimental approach. VillinCreER Apcfl/fl or VillinCreER Apcfl/fl Rpl24Bst/+ mice were induced by two intraperitoneal injection of tamoxifen at 80 mg/kg on days 0 and 1 then intestinal tissue analysed on day 4. Intestines were analysed histologically or intestinal organoids generated. (B) Top: representative micrographs showing proliferation as BrdU positivity and extent of proliferation as a red bar in H&E image. RPL24 and P-eEF2 T56, staining is also shown for each genotype. Bars represent 50 µm. Below: BrdU scoring from Apcfl/fl or Apcfl/fl Rpl24Bst/+ mouse intestines and H-scores for RPL24 and P-eEF2 T56 protein levels. For BrdU scoring BrdU was administered 2 hr before sampling and at least 20 half crypt/villus axes were scored per animal and the mean plotted ± standard error of the mean (standard error of the mean, SEM). (C) ApcMin/+ tumour model survival curve, for mice with and without Rpl24Bst mutation. Lack of a significant difference was determined by Mantel–Cox test. (D) Relative growth of Apcfl/fl and Apcfl/fl Rpl24Bst/+ small intestinal organoids over 3 days, measure by Cell-Titer Blue assay. The average change in proliferation is plotted from three independent biological replicates per genotype. (E) Relative protein synthesis rates quantified from 35S-methionine incorporation into Apcfl/fl, Apcfl/fl treated with 250 nM rapamycin for 24 hr and Apcfl/fl Rpl24Bst/+ small intestinal organoids. Significant changes were calculated by one-way analysis of variance (ANOVA) with Tukey’s multiple comparison. N = 3 per genotype with the mean protein synthesis rate for each genotype plotted ± SEM. (F) Relative expression of ribosomal protein mRNAs in VillinCreER Apcfl/fl and VillinCreER Apcfl/fl KrasG12D/+ whole intestine samples, where wild-type tissue has been normalised to 1. The fold increase in expression from Apcfl/fl to Apcfl/fl KrasG12D/+ samples for Rpl24 and the average of all other RP mRNAs are shown. Statistical analysis was by one sample t-test of the other RP mRNA fold changes using the fold change for Rpl24 mRNA as the hypothetical mean. All scale bars are 50 μm.
-
Figure 4—source data 1
Data relate to Figure 4F and Figure 4—figure supplement 2D.
Raw values tab shows the tabulated RNA sequencing reads for ribosomal proteins from triplicate wild-type (WT), VillinCreER Apcfl/fl (Apc) and VillinCreER Apcfl/fl KrasG12D/+ (Apc Kras) from whole intestine samples. Averages for the replicates are shown and fold change compared to WT expression. Average values tab shows all fold changes and the average fold change across all ribosomal proteins except Rpl24, and the fold change for Rpl24 for comparison.
- https://cdn.elifesciences.org/articles/69729/elife-69729-fig4-data1-v2.xlsx
Figure 4—figure supplement 1
Rpl24Bst mutation has no benefit in a model of colorectal cancer (CRC) with wild-type Kras.
(A) Left: staining for BrdU in the medial colons of VillinCreER Apcfl/fl and VillinCreER Apcfl/fl Rpl24Bst/+ mice. Bottom: scores are from 3 and 5 mice per genotype, each plotted as the average of at least 20 half crypt/villi. Lack of significance was determined by Mann–Whitney U test. (B) Left: schematic of experiment, VillinCreER Apcfl/+ mice with or without Rpl24Bst mutation were induced then aged until showing signs of intestinal tumours. Right: survival curve from the VillinCreER Apcfl/+ tumour model, with and without Rpl24Bst mutation. Censored subjects were sampled for health reasons not relating to the intestine. Lack of a significant difference was determined by Mantel–Cox test. All scale bars are 50 μm.
Figure 4—figure supplement 2
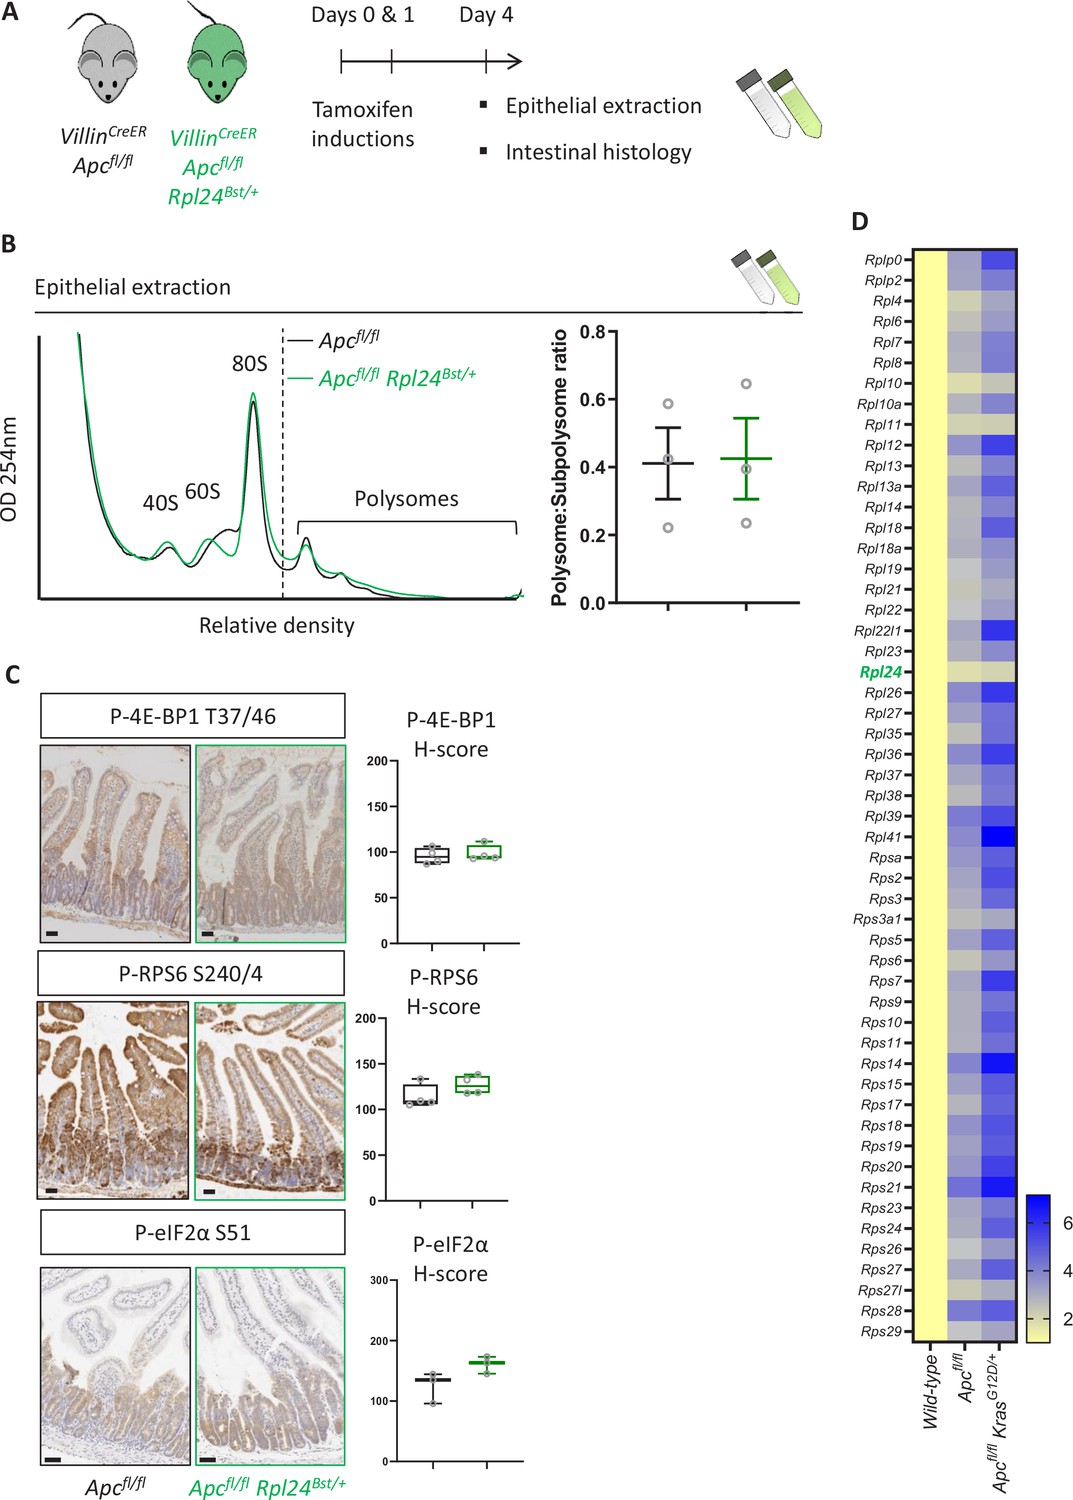
Rpl24Bst mutation has no effect on polysomes or some signaling pathways.
(A) Schematic representation of experimental approach. VillinCreER Apcfl/fl or VillinCreER Apcfl/fl Rpl24Bst/+ mice were induced by two intraperitoneal injection of tamoxifen at 80 mg/kg on days 0 and 1 then intestinal tissue analysed on day 4. Intestines analysed histologically or by epithelial extraction for sucrose density gradient analysis. (B) Left: representative polysome profiles generated from Apcfl/fl intestinal extracts with or without the Rpl24Bst mutation. Subpolysomal components and polysomes are labelled. Right: quantification of the polysome:subpolysome ratio across three biologically independent replicates for each genotype. Data show the mean ± standard error of the mean (SEM). (C) Staining of small intestinal tissue for P-4E-BP1 T37/46, P-RPS6 S240/4, and P-eIF2α S51 from VillinCreER Apcfl/fl or VillinCreER Apcfl/fl Rpl24Bst/+ mice alongside H-score quantification from the proliferative zones of the intestines of at least 3 mice per genotype. (D) Relative ribosomal protein mRNA abundances from RNA sequencing of wild-type, VillinCreER Apcfl/fl and VillinCreER Apcfl/fl KrasG12D/+ whole small intestinal tissue. Three independent biological samples were analysed per genotype with the averages used in this analysis. RNA sequencing reads for VillinCreER Apcfl/fl and VillinCreER Apcfl/fl KrasG12D/+ tissue was normalised to wild-type tissue set to 1. Values are shown horizontally scaled as fold changes to the wild-type tissue for each genotype. All scale bars are 50 μm.
Figure 5 with 2 supplements
Genetic inactivation of Eef2k reverses the reduced tumorigenesis following Rpl24Bst mutation in Apc-deficient Kras-mutant models of colorectal cancer (CRC).
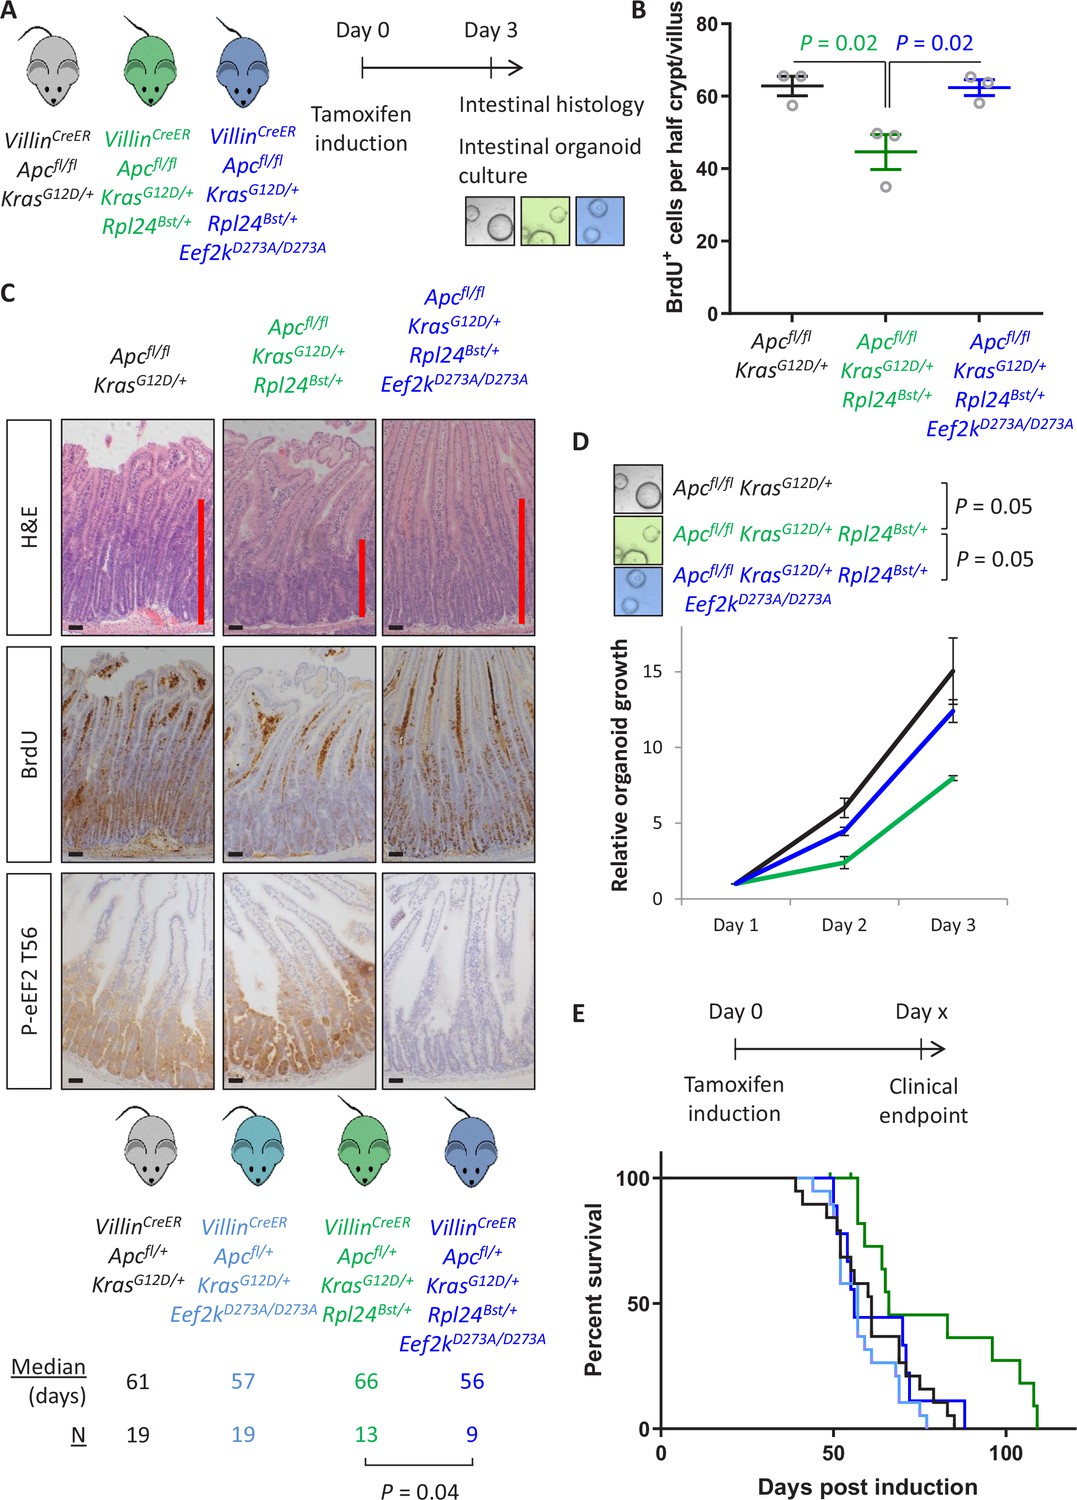
(A) Schematic representation of experimental approach. VillinCreER Apcfl/fl KrasG12D/+, VillinCreER Apcfl/fl KrasG12D/+ Rpl24Bst/+, or VillinCreER Apcfl/fl KrasG12D/+ Rpl24Bst/+ Eef2kD273A/D273A mice were induced by intraperitoneal injection of tamoxifen at 80 mg/kg then intestinal tissue analysed 3 days later. Intestines were analysed histologically or processed into intestinal organoids. (B) BrdU incorporation quantified from within small intestinal crypt/villus axes following deletion of Apc and activation of Kras, either wild-type of mutant for Rpl24, or mutant for Rpl24 and Eef2k. Data are represented as the mean of at least 20 crypt/villi per mouse ± standard error of the mean (SEM) with significance determined by one-way analysis of variance (ANOVA) with Tukey’s multiple comparison. N = 3 per genotype. (C) Representative images of H&E, BrdU, and P-eEF2 T56 staining of intestines from the same experiment as (B). Red bar on H&E indicates extent of proliferative zone. Bars represent 50 µm. (D) Organoids deficient for Apc and with activated Kras with or without Rpl24Bst mutation, or mutant for both Rpl24 and Eef2k were grown for 3 days and growth relative to day 1 determined by Cell-Titer Blue assay. Data show the mean ± SEM of n = 3 biologically independent organoid lines. Significance was determined by one-tailed Mann–Whitney U test. (E) Survival plot for Apc Kras ageing mice with or without the Rpl24Bst mutation, Eef2K mutation and with both Rpl24 and Eef2k mutations. Median survival and n numbers for each cohort are shown and significance determined by Mantel–Cox test. Censored subjects were removed from the study due to non-intestinal phenotypes. All scale bars are 50 μm.
Figure 5—figure supplement 1
Eef2kD273A/D273A mutation has no effect on tumorigenesis in Kras wild-type models.
(A) Scoring for BrdU incorporation in the medial colons of Apcfl/fl KrasG12D/+, Apcfl/fl KrasG12D/+ Rpl24Bst/+, and Apcfl/fl KrasG12D/+ Rpl24Bst/+ Eef2kD273A/D273A mice. Scores are from 3, 4, and 3 mice, respectively, each plotted as the average of at least 20 half crypt/villi. Significance was determined by one-way analysis of variance (ANOVA) with Tukey’s multiple comparison. (B) Survival curve from the Apcfl/+ tumour model for mice bearing the Eef2kD273A/D273A mutation or wild-type for Eef2k. Lack of a significant difference was determined by Mantel–Cox test. (C) ApcMin/+ tumour model survival curve, for mice with wild-type Eef2k or the inactivating mutation, Eef2kD273A/D273A. Lack of a significant difference was determined by Mantel–Cox test. (D) Scoring for BrdU-positive cells in the proximal small intestine and medial colons of Apcfl/fl, Apcfl/fl Rpl24Bst/+, Apcfl/fl Eef2kD273A/D273A, and Apcfl/fl Rpl24Bst/+ Eef2kD273A/D273A mice. Each point on the graphs is plotted as the average of at least 20 half crypt/villi.
Figure 5—figure supplement 2
Heterozygous mutation of Eef2kD273A/+ partially suppresses the effects of Rpl24Bst mutation in the tumour model.
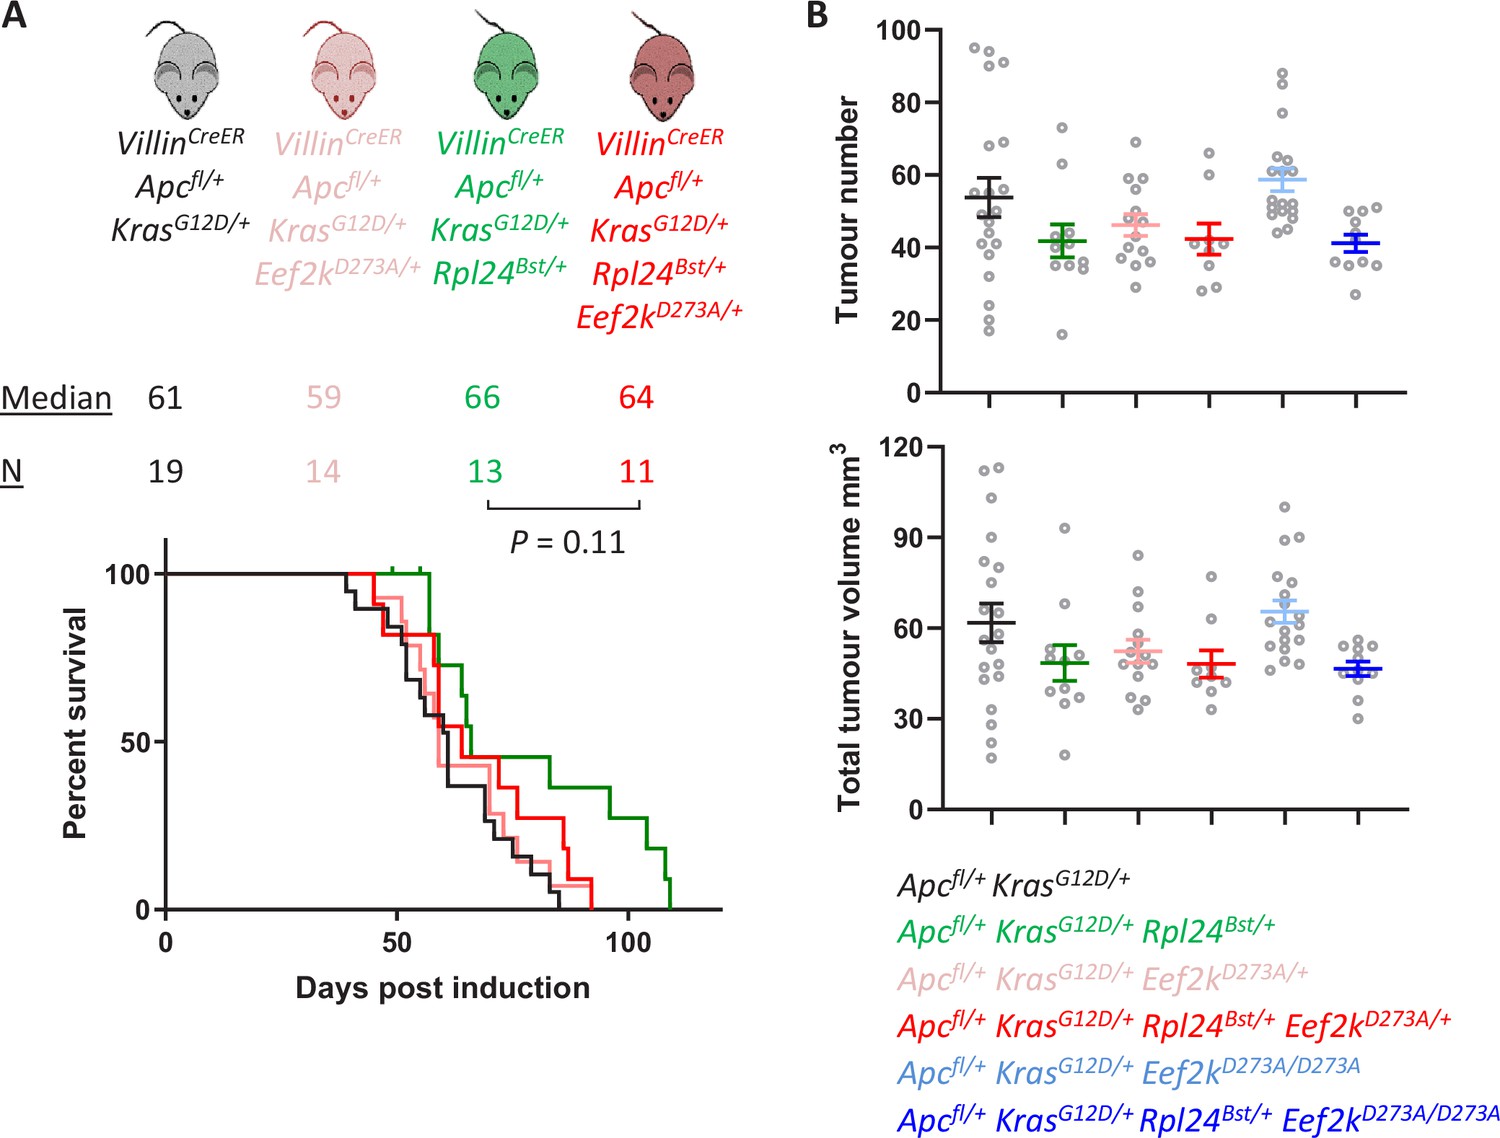
(A) Survival curve from the Apcfl/+ KrasG12D/+ tumour model for mice bearing the Rpl24Bst mutation and/or one copy of the inactivating Eef2k mutation. Median survival in days and n numbers are shown for each genotype. Significance test was performed by Mantel–Cox test. Apcfl/+ KrasG12D/+ and Apcfl/+ KrasG12D/+ Rpl24Bst/+ survival curves are reused from Figure 5E. (B) Tumour number (top) and total volume (bottom) scored macroscopically from Apcfl/+ KrasG12D/+ mice with or without Rpl24Bst mutation and with no, one, or two copies of the inactivating Eef2kD273A mutation. Each point is an individual mouse with the bars depicting the mean ± standard error of the mean (standard error of the mean, SEM). From left to right n = 20, 11, 14, 9, 18, and 11 mice.
Figure 6 with 2 supplements
Genetic inactivation of Eef2k restores translation rates following Rpl24Bst mutation.
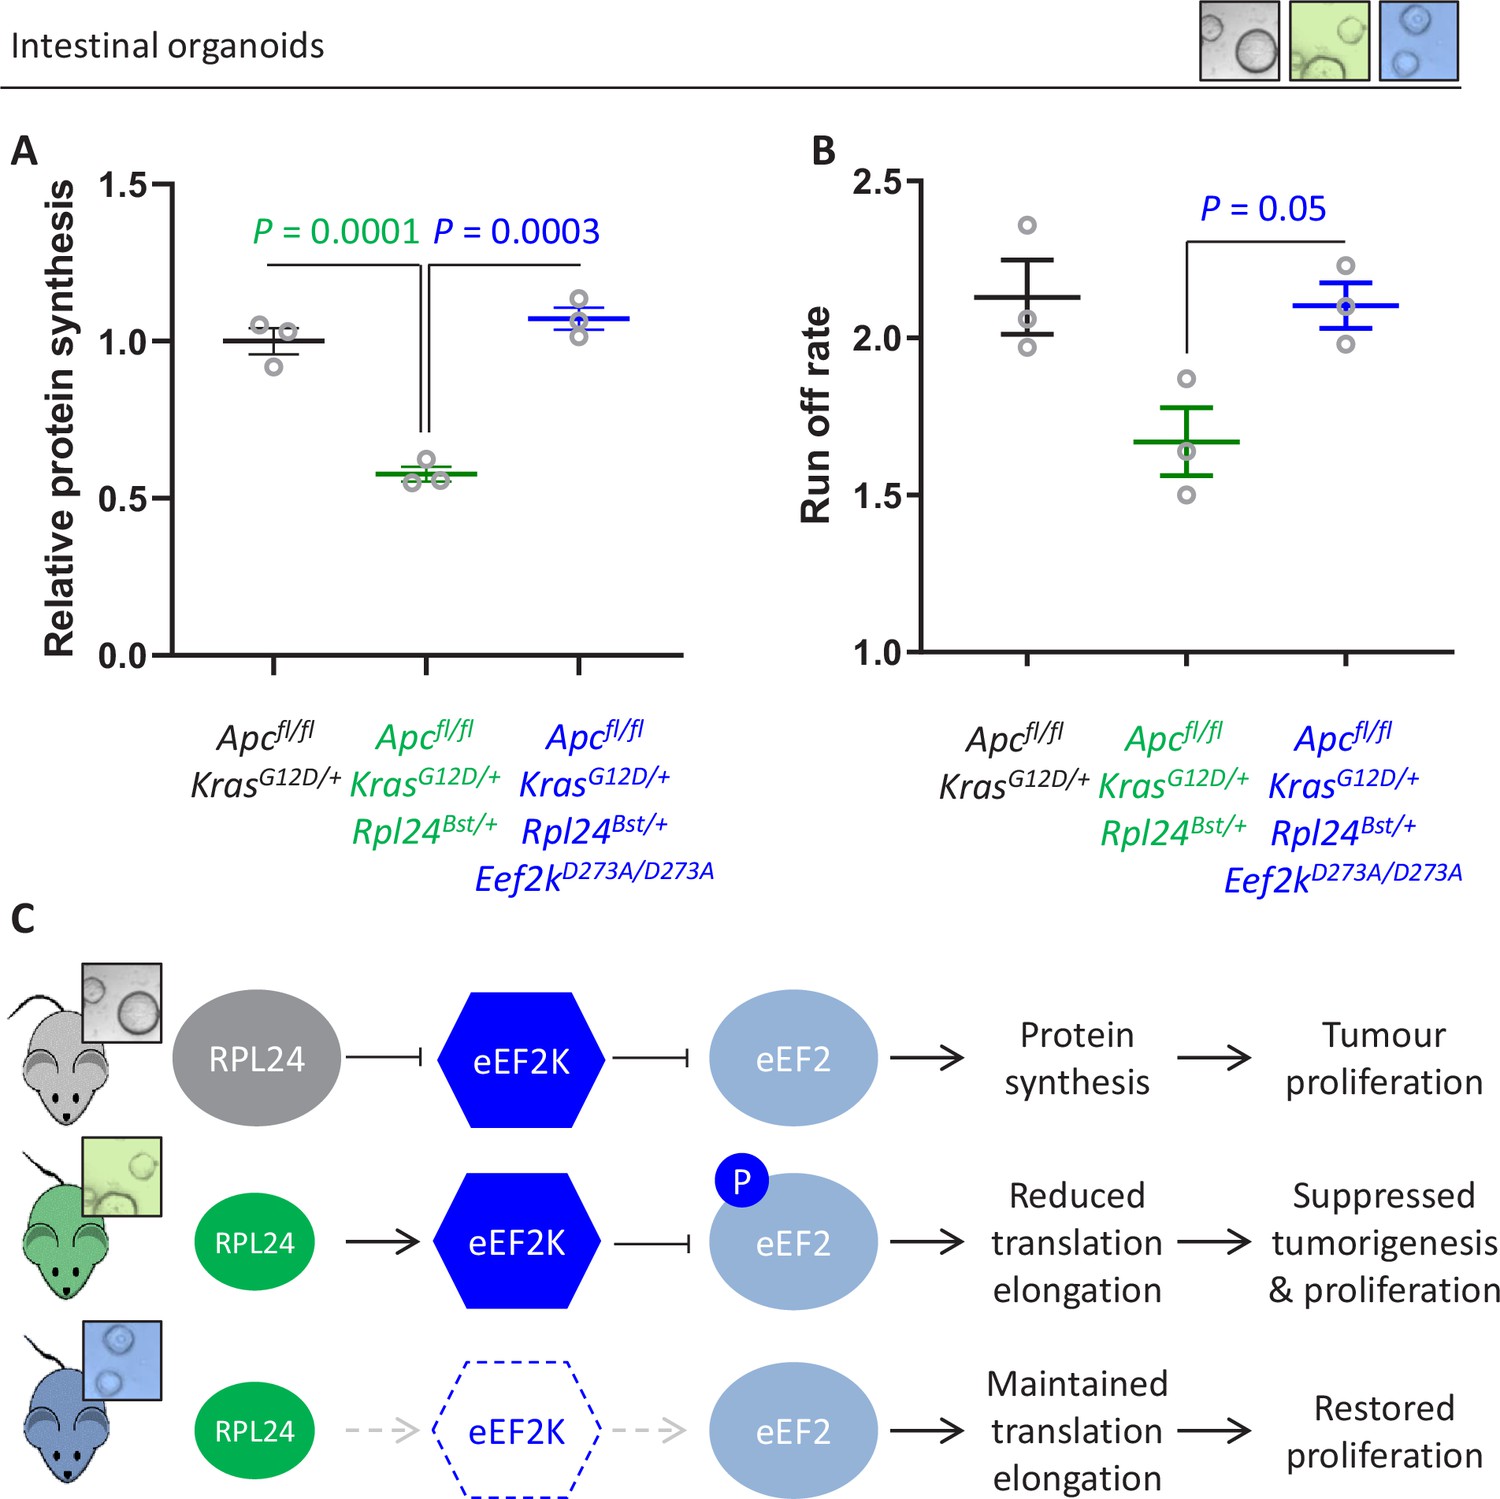
(A) 35S-methionine incorporation to determine relative protein synthesis by in Apcfl/fl KrasG12D/+ small intestinal organoids wild-type or mutant for Rpl24 or with both Rpl24 andConsistent with this, the Eef2k mutations. Data are represented ± standard error of the mean (standard error of the mean, SEM) with significance determined by one-way analysis of variance (ANOVA) with Tukey’s multiple comparison. N = 3 per genotype, each representing an independent organoid line. (B) Ribosome run-off rate determined in Apcfl/fl KrasG12D/+ small intestinal organoids mutant or wild-type for Rpl24 or with both Rpl24 and Eef2k mutations. Data are the mean of three biologically independent organoid lines represented ± SEM with significance determined by Mann–Whitney U test. Raw data are available in Figure 6—figure supplement 1A. The run-off rate for Apcfl/fl KrasG12D/+ control organoids is reproduced from Figure 3E. (C) Schematic representation of findings in Apc-deficient Kras-mutant mouse and organoid models. Top: RPL24 expression maintains translation and proliferation by suppressing the phosphorylation of eEF2 by limiting eEF2K activity. Middle: reduced expression of RPL24 activates eEF2K, increasing P-eEF2, reducing translation elongation and suppressing tumorigenesis and proliferation. Bottom: inactivation of eEF2K reverts the phenotype in Rpl24Bst cells, due to the inability to phosphorylate and suppress eEF2. Elevated elongation rates correlate with increased proliferation following inactivation of eEF2K.
Figure 6—figure supplement 1
Inactivation of Eef2k restores translation elongation speed in Rpl24Bst mutant mice.
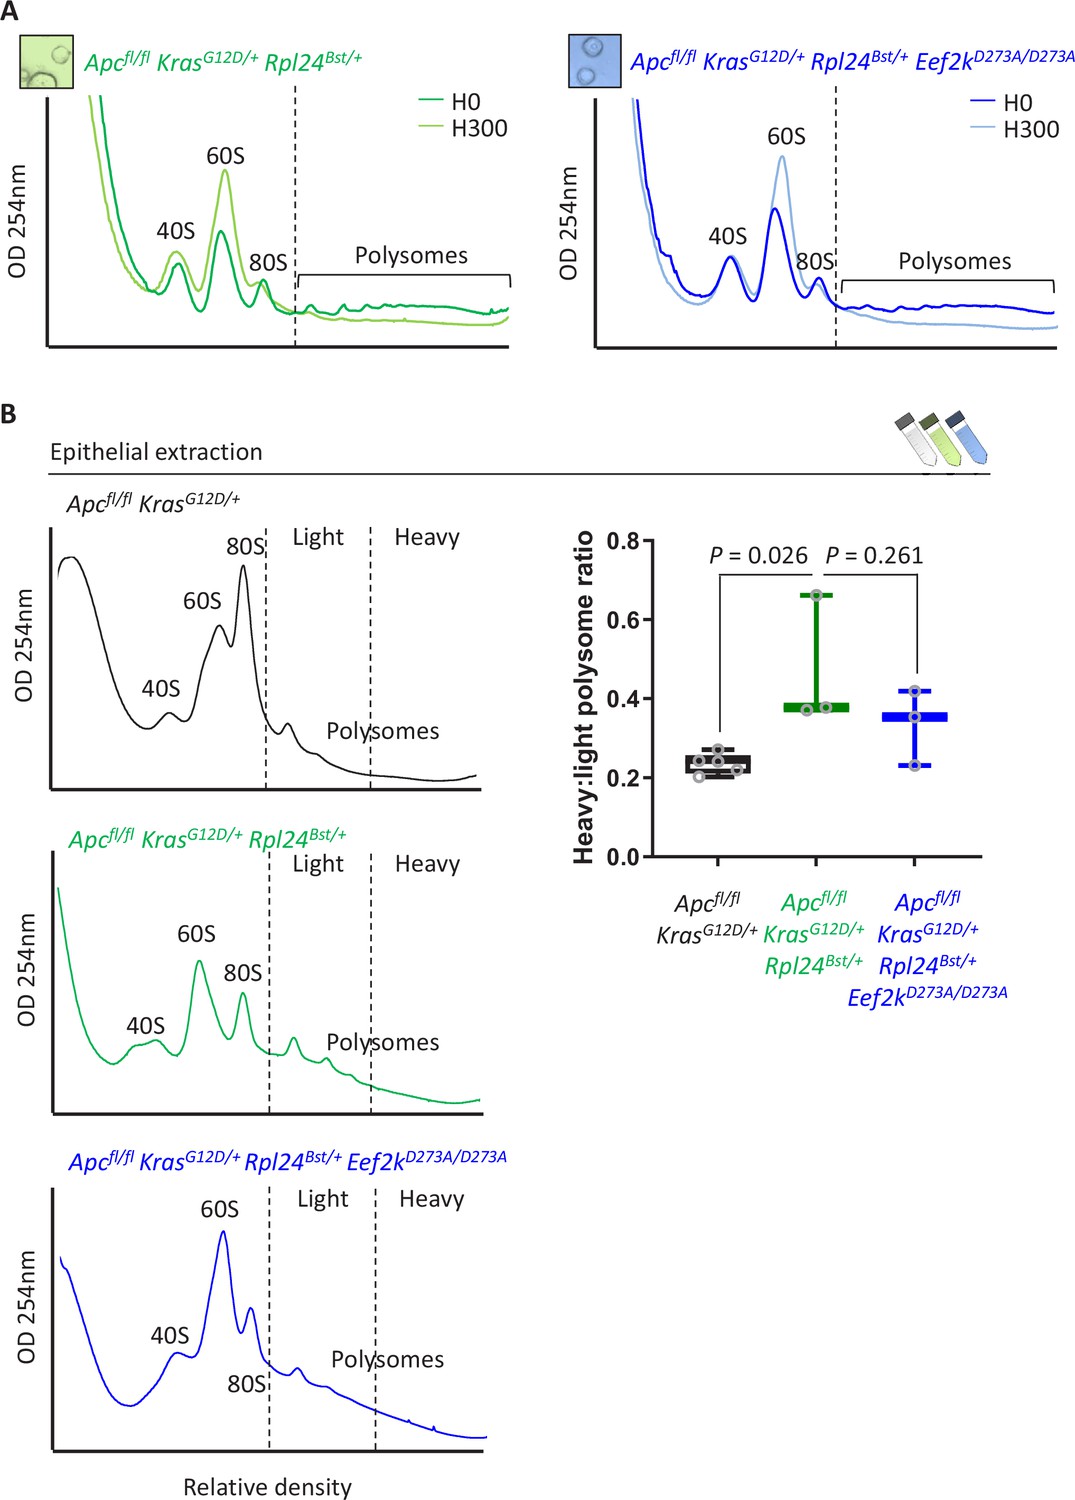
(A) Polysome profiles from sucrose density gradients of Apcfl/fl KrasG12D/+ Rpl24Bst/+ or Apcfl/fl KrasG12D/+ Rpl24Bst/+ Eef2kD273A/D273A small intestinal organoid cultures, pre-treated with harringtonine for 5 min/300 s (H300) or untreated (H0). These traces are representative of those analysed for the run-off rates shown in Figure 6B. (B) Representative sucrose density profiles generated from Apcfl/fl KrasG12D/+ intestinal extracts with or without the Rpl24Bst mutation and inactivation of eEF2K. Subpolysomal components and polysomes are labelled, and the polysomes have been split pictorially into light and heavy. To the right of this is quantification of the heavy:light polysome ratio. Data show the mean ± standard error of the mean (standard error of the mean, SEM) of 5, 3, and 3 mice reading from left to right. Significance was determined by one-way analysis of variance (ANOVA) with Tukey’s multiple comparison.
Figure 6—figure supplement 2
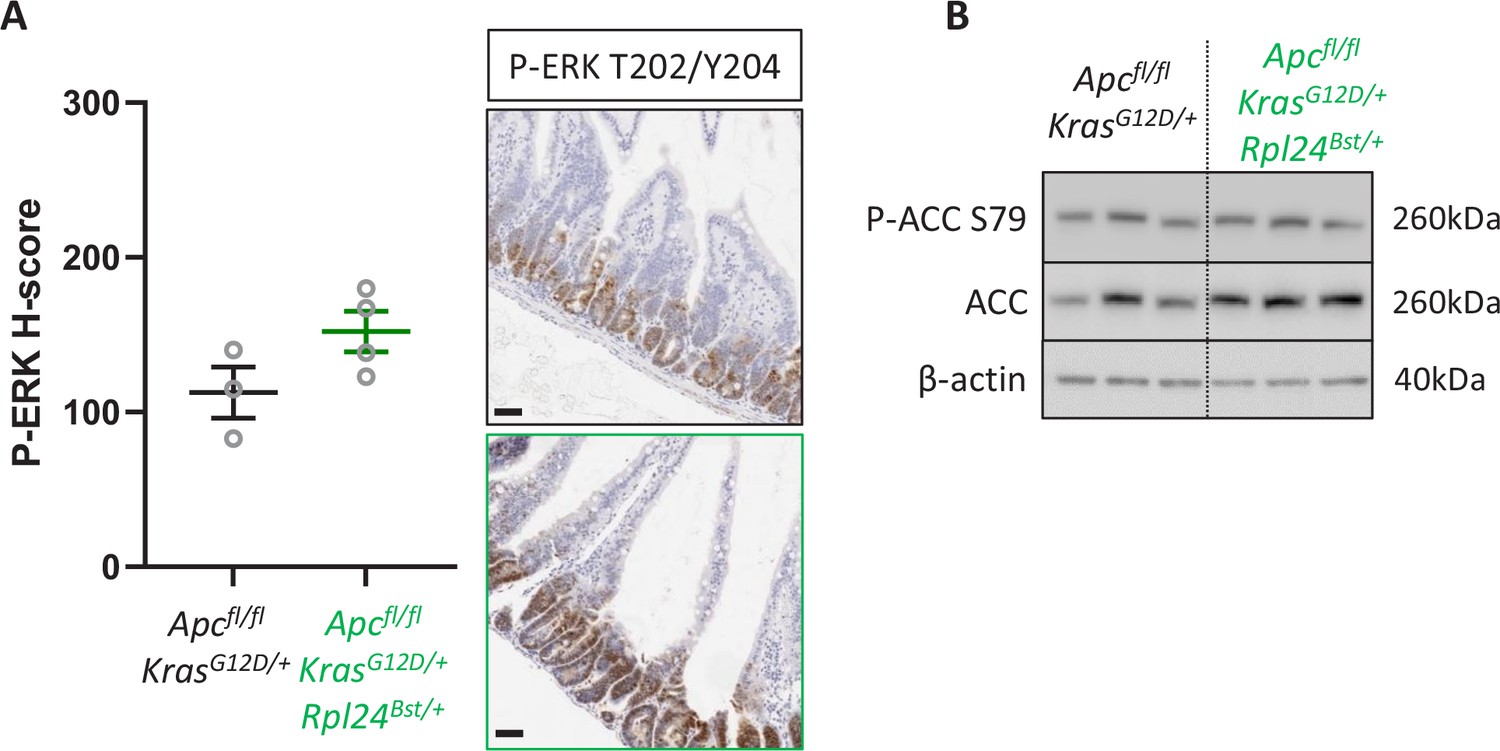
Rpl24Bst mutation has no effect on P-ERK or P-ACC.
(A) Immunohistochemistry (IHC) staining for P-ERK T202/T204 in intestinal tissue form Apcfl/fl KrasG12D/+ or Apcfl/fl KrasG12D/+ Rpl24Bst/+ mice. Representative images from each genotype are shown on the right and H-score quantification from three animals per genotype on the left. (B) Western blotting on lysates from Apcfl/fl KrasG12D/+ or Apcfl/fl KrasG12D/+ Rpl24Bst/+ organoids, for P-ACC S79, ACC, and β-actin as a sample control. All scale bars are 50 μm.
-
Figure 6—figure supplement 2—source data 1
Left: data from Figure 6—figure supplement 2B.
Right: original western blotting images with areas for each antibody annotated and boxed in red.
- https://cdn.elifesciences.org/articles/69729/elife-69729-fig6-figsupp2-data1-v2.pdf
Figure 7 with 1 supplement

Expression of RPL24, EEF2K, and EEF2 is consistent with increased eEF2 activity in colorectal cancer (CRC) tumours.
(A) Schematic of the findings presented here from pre-clinical mouse models. KRAS activation requires RPL24 expression to maintain low eEF2 phosphorylation. This occurs via a double negative regulation of eEF2K, whereby RPL24 suppresses eEF2K, which suppresses eEF2. eEF2 activity correlates with protein synthesis and proliferation rates. Dashed lines indicate indirect or undefined regulatory pathways. (B) RNA expression levels of RPL24, EEF2K, and EEF2 between normal colon and colon adenocarcinoma samples using data extracted from The Cancer Genome Atlas by TNMplot. Relative expression changes are annotated, as well as p values for each transcript.
Figure 7—figure supplement 1
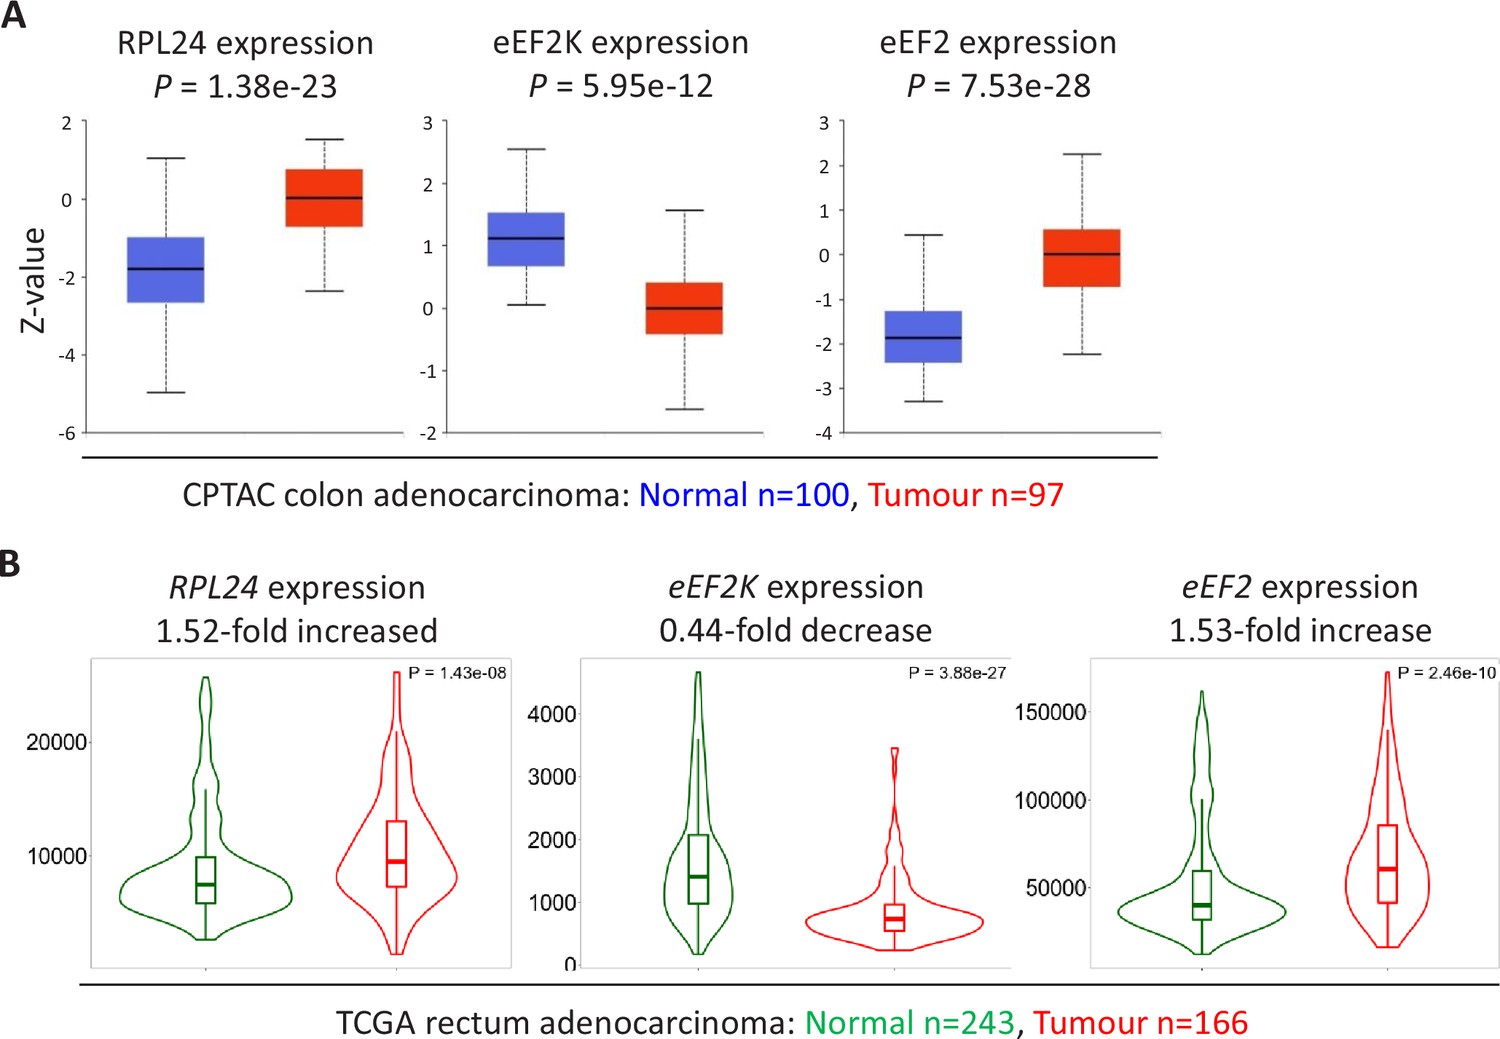
Expression of RPL24, EEF2K, and EEF2 suggest increased eEF2 activity in colorectal cancer (CRC) tumours.
(A) Protein levels of RPL24, eEF2K, and eEF2 in normal colon and colon adenocarcinoma collated from the Clinical Proteomic Tumor Analysis Consortium by UALCAN. Numbers of samples and p values are shown for each protein. (B) RNA expression levels of RPL24, EEF2K, and EEF2 between normal rectum and rectum adenocarcinoma samples using data extracted from The Cancer Genome Atlas by TNMplot. Relative expression changes are annotated, as well as p values for each transcript.
Author response image 1
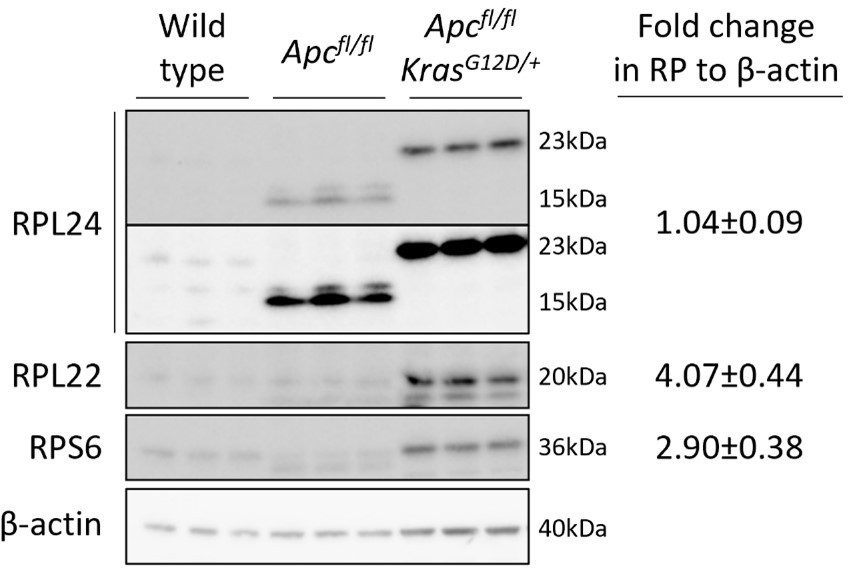
A truncated form of RPL24 is expressed in Apcfl/fl but not Apcfl/fl KrasG12D/+ organoids.
The significance of this in regulating tumorigenesis is currently under investigation. Fold changes in RP abundance from Apcfl/fl to Apcfl/fl KrasG12D/+ are shown relative to β-actin. For RPL24 expression both isoforms were quantified together. Two exposures are shown for RPL24, short on top and longer below.
Author response image 2
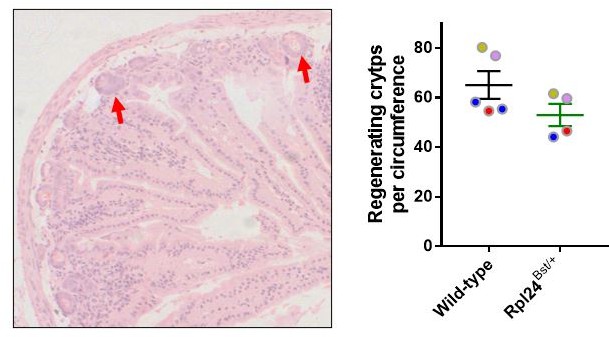
Left, example HandE staining of regenerative small intestine, showing two regenerating crypts with red arrows.
Right, regeneration data before batch normalisation. Colour coded circles show each of 4 batches in yellow (1v1), pink (1v1), blue (2v1) and red (1v1).
Tables
Key resources table
| Reagent type (species) or resource | Designation | Source or reference | Identifiers | Additional information |
|---|---|---|---|---|
| Genetic reagent (Mus musculus) | Tg(Vil1-cre/ ERT2)23Syr | el Marjou et al., 2004 | RRID:MGI:3053826 | |
| Genetic reagent (Mus musculus) | Apctm1Tno | Shibata et al., 1997 | RRID:MGI:1857966 | |
| Genetic reagent (Mus musculus) | Krastm4Tyj | Jackson et al., 2001 | RRID:MGI:2429948 | |
| Genetic reagent (Mus musculus) | Rpl24Bst | Oliver et al., 2004 | RRID:MGI:1856685 | |
| Genetic reagent (Mus musculus) | Eef2kD273A | Gildish et al., 2012 | ||
| Genetic reagent (Mus musculus) | ApcMin | Moser et al., 1990 | RRID:MGI:1856318 | |
| Cell line (Mus musculus) | VillinCreER Apcfl/fl KrasG12D/+ small intestinal organoids | This study | ||
| Cell line (Mus musculus) | VillinCreER Apcfl/fl small intestinal organoids | This study | ||
| Cell line (Mus musculus) | VillinCreER Apcfl/fl KrasG12D/+ Rpl24Bst/+ small intestinal organoids | This study | ||
| Cell line (Mus musculus) | VillinCreER Apcfl/fl Rpl24Bst/+ small intestinal organoids | This study | ||
| Antibody | BrdU(mouse monoclonal) | BD Biosciences #347,580 | RRID:AB_400326 | IHC: (1:250) |
| Antibody | P-eEF2 T56(rabbit polyclonal) | Cell Signaling Technology #2,331 | RRID:AB_10015204 | WB: (1:2000)IHC: (1:100) |
| Antibody | eEF2(rabbit polyclonal) | Cell Signaling Technology #2,332 | RRID:AB_10693546 | WB: (1:2000) |
| Antibody | P-4E-BP1(rabbit monoclonal) | Cell Signaling Technology #2,855 | RRID:AB_560835 | IHC: (1:250) |
| Antibody | P-RPS6 S240/4(rabbit monoclonal) | Cell Signaling Technology #5,364 | RRID:AB_10694233 | IHC: (1:100) |
| Antibody | P-eIF2α S51(rabbit monoclonal) | Cell Signaling Technology#3,398 | RRID:AB_2096481 | IHC: (1:50) |
| Antibody | P-ERK T202/ Y204(rabbit polyclonal) | Cell Signaling Technology #9,101 | RRID:AB_331646 | IHC: (1:400) |
| Antibody | Lysozyme(rabbit polyclonal) | Dako A0099 | RRID:AB_2341230 | IHC: (1:300) |
| Antibody | RPS6(mouse monoclonal) | Cell Signaling Technology #2,317 | RRID:AB_2238583 | WB: (1:2000) |
| Antibody | RPL10(rabbit polyclonal) | Novus NBP1-84037 | RRID:AB_11007661 | WB: (1:2000) |
| Antibody | RPL22(rabbit polyclonal) | Abcam ab111073 | RRID:AB_10863642 | WB: (1:2000) |
| Antibody | Acetyl-CoA carboxylase(rabbit monoclonal) | Cell Signaling Technology #3,676 | RRID:AB_2219397 | WB: (1:1000) |
| Antibody | P-acetyl-CoA carboxylase S79(rabbit monoclonal) | Cell Signaling Technology #3,661 | RRID:AB_330337 | WB: (1:1000) |
| Antibody | β-Actin(mouse monoclonal) | Sigma-Aldrich #A2228 | RRID:AB_476697 | WB: (1:10,000) |
| Antibody | β-Tubulin(mouse monoclonal) | Cell Signaling Technology #2,128 | RRID:AB_823664 | WB: (1:4000) |
| Antibody | Goat Anti-Mouse Immunoglobulins/ HRP(goat polyclonal) | Dako #P0447 | RRID:AB_2617137 | WB: (1:2000) |
| Antibody | Goat Anti-Rabbit Immunoglobulins/ HRP(goat polyclonal) | Dako #P0448 | RRID:AB_2617138 | WB: (1:2000) |
| Sequence- based reagent | Olfm4 RNAScope | ACD #311,838 | RNAScope | |
| Peptide, recombinant protein | Recombinant Murine Noggin | Peprotech #250-38 | 100 ng/ml | |
| Peptide, recombinant protein | Animal-Free Recombinant Human EGF | Peprotech #AF-100-15 | 50 ng/ml | |
| Peptide, recombinant protein | Recombinant Mouse R-Spondin 1 Protein | R&D Systems #3474-RS | 500 ng/ml | |
| Commercial assay or kit | Vectorstain Elite ABC-HRP | Vector Laboratories PK-6102 | RRIDs:AB_2336820 | |
| Commercial assay or kit | Vectorstain Elite ABC-HRP | Vector Laboratories PK-PK-6101 | RRIDs:AB_2336821 | |
| Commercial assay or kit | Cell Proliferation Labelling Reagent | Amersham Bioscience RPN201 | ||
| Commercial assay or kit | Cell-Titer Blue | Promega #G8080 | ||
| Chemical compound, drug | Rapamycin | LC Laboratories #R-5000 | ||
| Chemical compound, drug | Harringtonine | Santa Cruz sc-204771 | ||
| Chemical compound, drug | EasyTag EXPRESS 35S Protein Labeling Mix | Perkin Elmer #NEG772002MC | ||
| software, algorithm | Image J | Rueden et al., 2017 | RRID:SCR_003070 | |
| software, algorithm | G*Power | Faul et al., 2009 | RRID:SCR_013726 |
Additional files
Download links
A two-part list of links to download the article, or parts of the article, in various formats.
Downloads (link to download the article as PDF)
Open citations (links to open the citations from this article in various online reference manager services)
Cite this article (links to download the citations from this article in formats compatible with various reference manager tools)
Rpl24Bst mutation suppresses colorectal cancer by promoting eEF2 phosphorylation via eEF2K
eLife 10:e69729.
https://doi.org/10.7554/eLife.69729


