Functional independence of endogenous μ- and δ-opioid receptors co-expressed in cholinergic interneurons
- The Vollum Institute, Oregon Health & Science University, United States
- Department of Chemical Physiology and Biochemistry, School of Medicine, Oregon Health & Science University, United States
- Program in Biomedical Sciences, Department of Chemical Physiology and Biochemistry, Oregon Health & Science University, United States
Figures
Figure 1 with 1 supplement
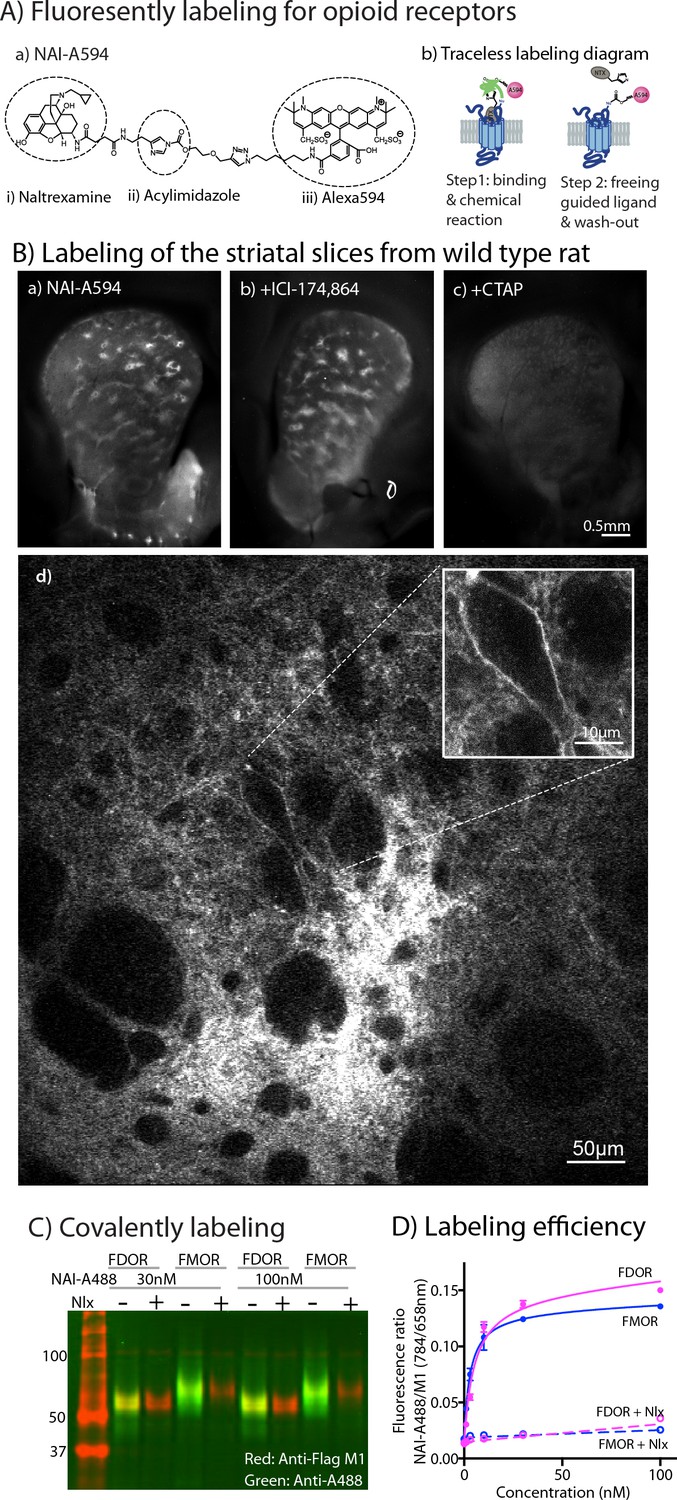
Labeling of naltrexamine-acylimidazole derivatives.
(A) Covalent labeling of opioid receptors with NAI compounds. (a) Chemical structure of naltrexamine-acylimidazole-alexa594 (NAI-A594). (b) Diagram of traceless labeling shown in two steps. Step 1, NAI compound binds and reacts with the receptor. Step 2, washing of naltrexamine moiety released from the reaction. (B) Live images of rat striatum incubated for 1 hr in (a) 100 nM NAI-A594, (b) 100 nM NAI-A594 plus 1 μM ICI-174,864, (c) 100 nM NAI-A594 plus 1 μM CTAP, and (d) zoom area of patch-like structure in the dorsal part of striatum showing a large neuron believed to be the cholinergic interneuron at the boundary of the patch. (C) Near infrared western blots of HEK293 cells expressing FDOR and FMOR labeled with 30 and 100 nM NAI-A488 in the absence and presence of 10 μM naloxone, shown in a merge channel. The FLAG-epitope on opioid receptors was detected with anti-FLAG M1 (red), and the NAI-A488 modification of the receptors was identified with rabbit anti-Alexa Fluor 488 antibody (green). (D) Concentration-dependent curves of FDOR and FMOR labeled with NAI-A488. The fluorescence intensity ratios of NAI-A488 (784 nm of secondary antibody to IR dye CW800) over anti-Flag M1 (658 nm of secondary antibody conjugated to Alexa680) were plotted against NAI-A488 concentrations. The graph shows labeling curves performed in triplicate from one of three experiments. Data are shown as mean ± SEM.
-
Figure 1—source data 1
Uncropped merged gel of western analysis of FDOR and FMOR labeled with NAI-A488.
- https://cdn.elifesciences.org/articles/69740/elife-69740-fig1-data1-v2.zip
-
Figure 1—source data 2
Quantification of labeling efficiency by on-cell western analysis.
- https://cdn.elifesciences.org/articles/69740/elife-69740-fig1-data2-v2.xlsx
Figure 1—figure supplement 1
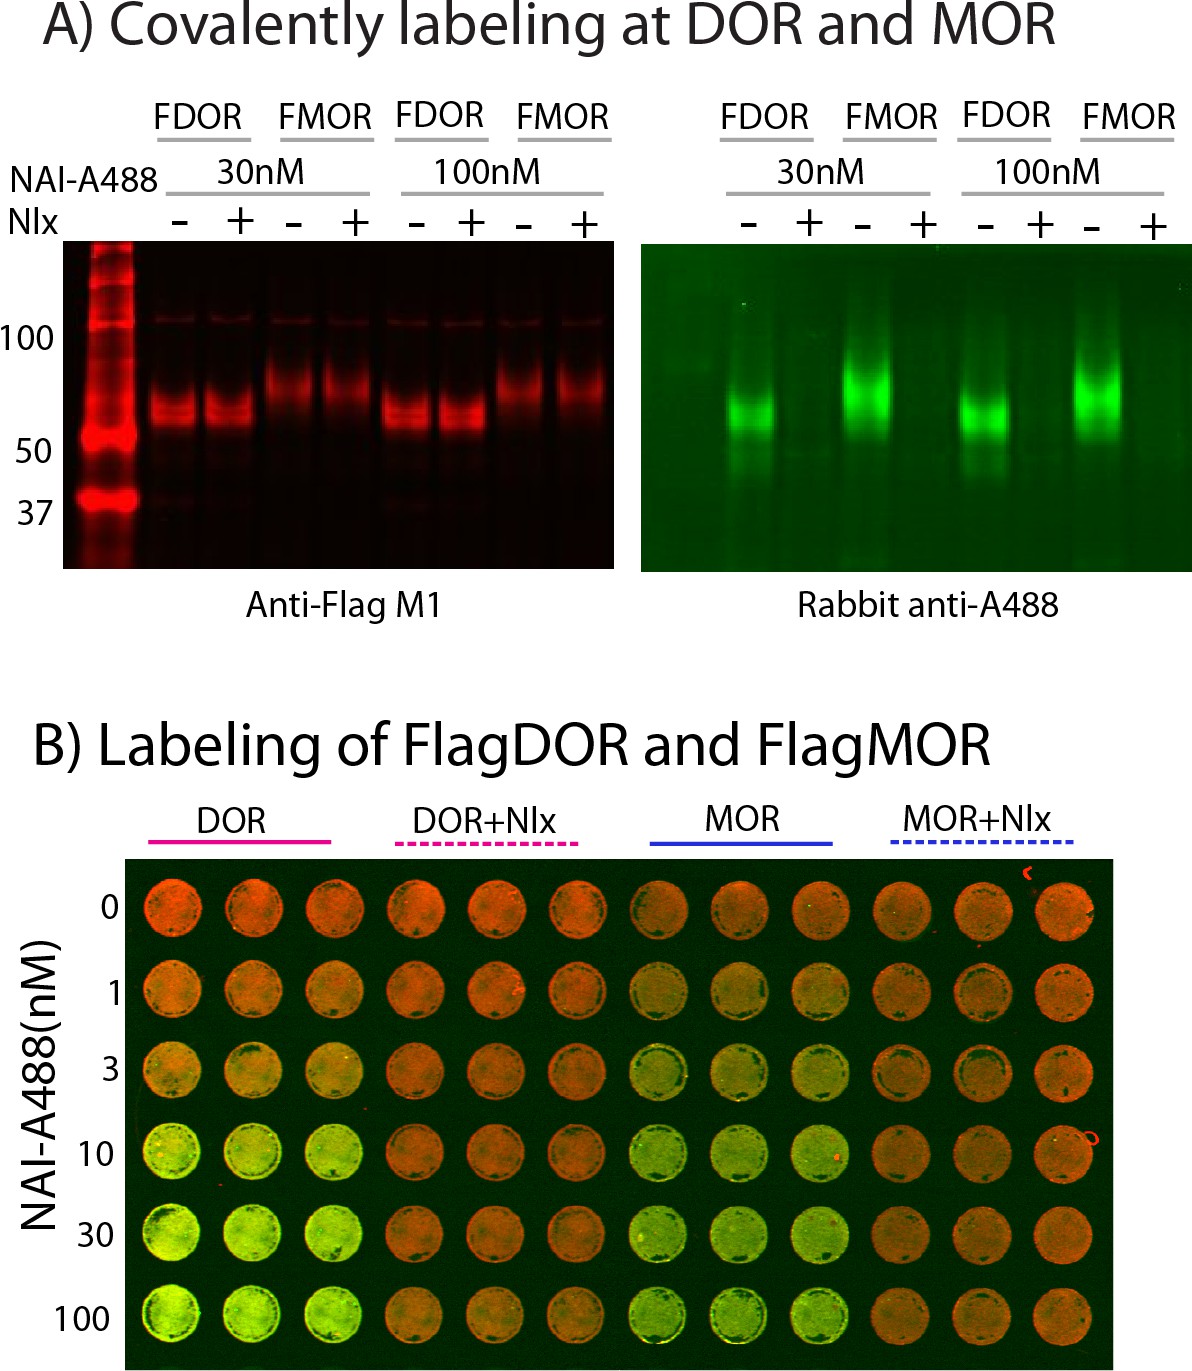
Covalently labeling and quantification of FDOR and FMOR in HEK293 cells.
(A) Single channel of the merged image shown in Figure 1C. (B) On-cell western analysis shows concentration dependence of NAI-A488 labeling FDOR and FMOR cells. The labeling was done in the absence and presence of 10 μM naloxone. Fluorescence intensities were measured with AzureSpot software.
-
Figure 1—figure supplement 1—source data 1
Uncropped red channel (anti-Flag M1) gel of western analysis of FDOR and FMOR labeled with NAI-A488.
- https://cdn.elifesciences.org/articles/69740/elife-69740-fig1-figsupp1-data1-v2.zip
-
Figure 1—figure supplement 1—source data 2
Uncropped green channel (rabbit anti-A488) gel of western analysis of FDOR and FMOR labeled with NAI-A488.
- https://cdn.elifesciences.org/articles/69740/elife-69740-fig1-figsupp1-data2-v2.zip
-
Figure 1—figure supplement 1—source data 3
The raw image of on-cell western analysis of labeled receptors (anti-Flag M1).
- https://cdn.elifesciences.org/articles/69740/elife-69740-fig1-figsupp1-data3-v2.zip
-
Figure 1—figure supplement 1—source data 4
The raw image of on-cell western analysis of labeled receptors (rabbit anti-A488).
- https://cdn.elifesciences.org/articles/69740/elife-69740-fig1-figsupp1-data4-v2.zip
-
Figure 1—figure supplement 1—source data 5
The raw image of on-cell western analysis of labeled receptors (merge).
- https://cdn.elifesciences.org/articles/69740/elife-69740-fig1-figsupp1-data5-v2.zip
Figure 2
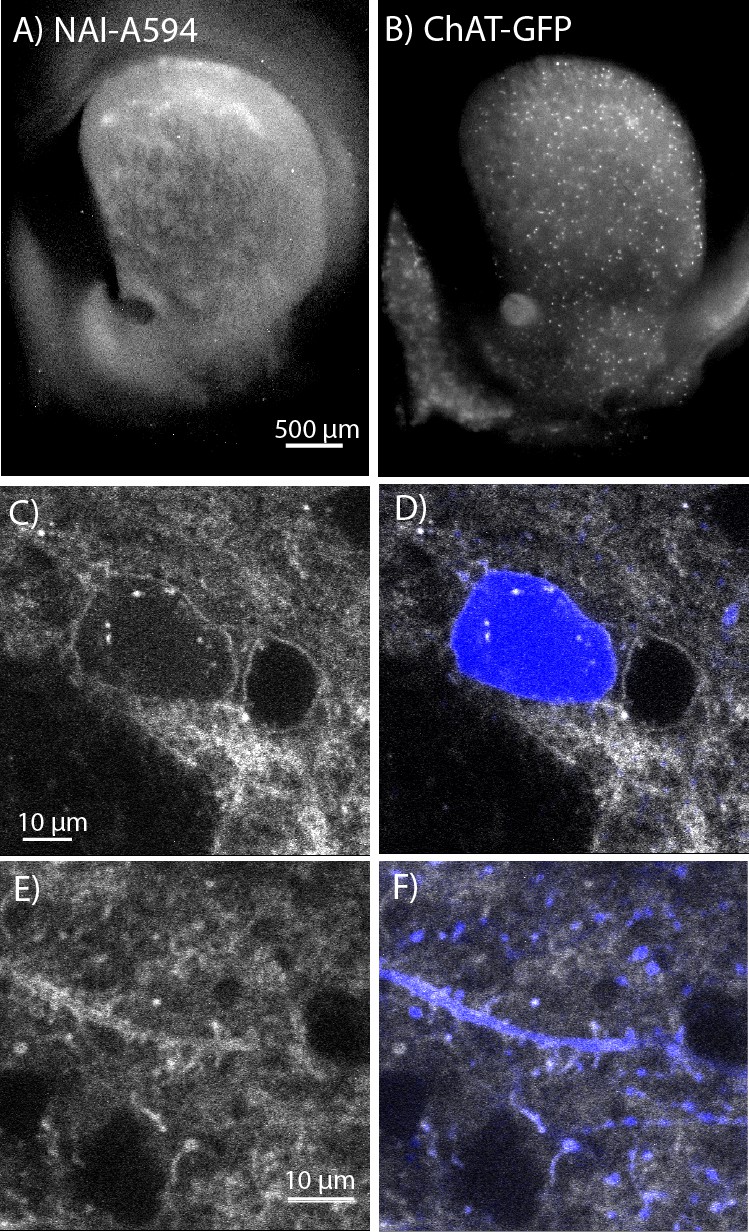
In situ NAI-A594 labeling of ChI neurons in the striatum of ChAT-GFP mice.
(A) An area where a fluorescent patch is clearly observed in the striatum of ChAT-GFP after the staining with NAI-A594. (B) Distribution of GFP-positive neurons in the same section of brain slice in (A). (C–F) The labeling of NAI-A594 is clearly observed along plasma membrane staining of cell body, dendrites, and terminals. The gray outline of two cells in (C) and the merged channel shows GFP (blue) in (D) indicate that the other neuron, presumably MSN is also stained with NAI-A594. Neurites containing GFP are visible after staining (E). Fluorescence of neurites is observed throughout the area. The merged image (F) shows NAI-A594 labeled both positive and negative GFP neurites.
Figure 3 with 1 supplement
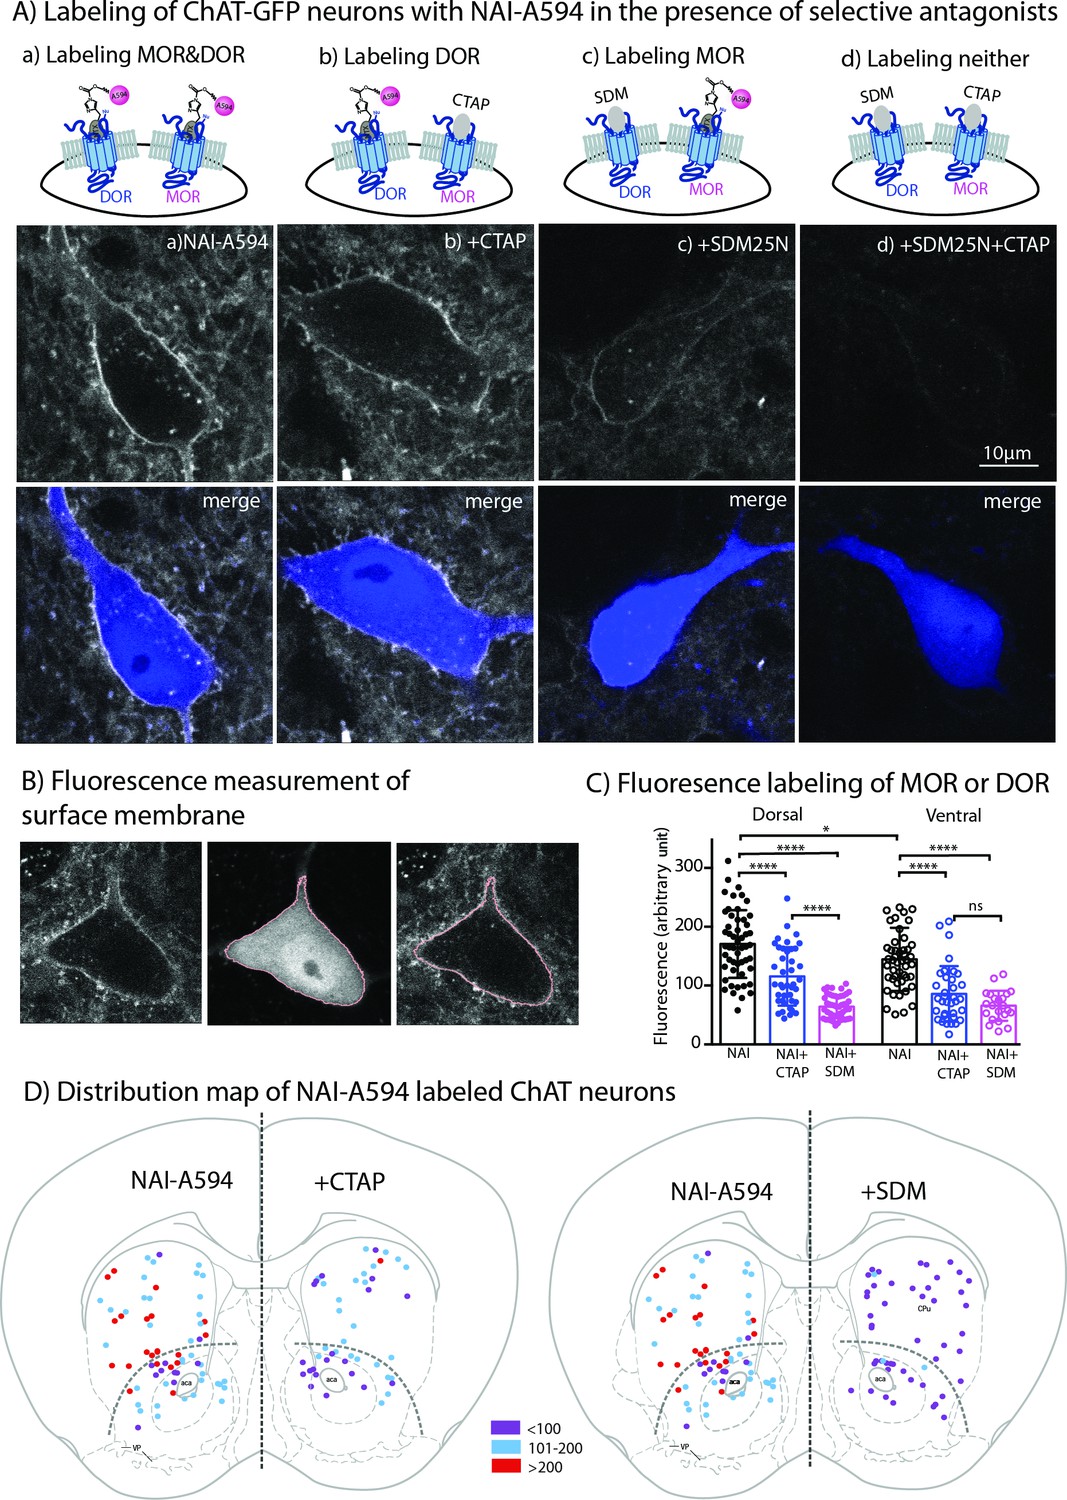
Fluorescent intensities of NAI-A594 labeling of endogenous MOR or DOR receptors.
(A) Examples of single ChAT-GFP positive cell showing staining of NAI-A594 under different conditions: (a) NAI-A594, (b), NAI-A594+ CTAP, (c) NAI-A594+ SDM25 N, and (d) NAI-A594+ CTAP and SDM25N. The upper panel are images from Alexa594 channel, and the bottom panel are the merged images of GFP (blue) and Alexa594 (gray). (B) Diagram images illustrate the method of measurement of surface membrane fluorescent intensity. Left is the raw signal of a neuron labeled with NAI-A594. Middle shows outline boundary derived from GFP signal and thresholding using ImageJ (details in Materials and methods). Right, the fluorescent intensities of Alexa594 channel are measured along the outline drawn in the GFP channel and superimposed onto the raw image. The lines drawn here are enlarged for illustration. The true thickness of line is ~0.08 μm or one pixel. (C) Summarized results of fluorescent intensities in each labeling condition. Dorsal and ventral areas are defined according to the mouse brain atlas (Franklin and Paxinos, 2007). All data are shown in mean ± SD, and statistical analyses using ordinary one-way ANOVA and Sidak’s post-test for multiple comparisons. (D) Distribution maps of the observed ChIs, in which fluorescent intensities were measured in different conditions. Data are presented as combined results from both male and female. Color codes represent the range of fluorescent intensities (in Arbitrary Units, AU) shown in (C).
-
Figure 3—source data 1
Membrane fluorescent intensities of A594-labeled both MOR and DOR (NAI), DOR (NAI+ CTAP), and MOR (NAI+ SDM25 N).
- https://cdn.elifesciences.org/articles/69740/elife-69740-fig3-data1-v2.xlsx
Figure 3—figure supplement 1

Fluorescent labeling of MOR or DOR.
(A) Summary data show that fluorescent intensities in each labeling condition do not differ between male and female mice. Solid dot = male and open dot = female. Data are shown as mean ± SD. Statistical analyses using ordinary one-way ANOVA, Sidak’s post test showed no difference between male and female in each treatment. (B) Comparison of fluorescent intensities after labeling of the ChAT-GFP neurons with NAI-A594 plus CTAP and after labeling of ChI neurons from MOR knockout mice with NAI-A594 alone. Because there is no GFP in MOR knockout cells, both measurements were done manually by drawing the outline corresponding to the Alexa594 signals of both MORKO and ChAT-GFP neurons. ChIs from these animals were identified by their morphology of larger size than nearby neurons. Data are shown as mean ± SD and p values were calculated by one-way ANOVA with Sidak’s post test.
-
Figure 3—figure supplement 1—source data 1
Membrane fluorescent intensities of A594-labeled MOR and DOR (NAI), DOR (NAI+ CTAP) or MOR (NAI+ SDM25 N) from male and female ChAT-GFP mice.
- https://cdn.elifesciences.org/articles/69740/elife-69740-fig3-figsupp1-data1-v2.xlsx
-
Figure 3—figure supplement 1—source data 2
Membrane fluorescent intensities of A594-labeled neurons from MOR-KO and ChAT-GFP mice.
- https://cdn.elifesciences.org/articles/69740/elife-69740-fig3-figsupp1-data2-v2.xlsx
Figure 4
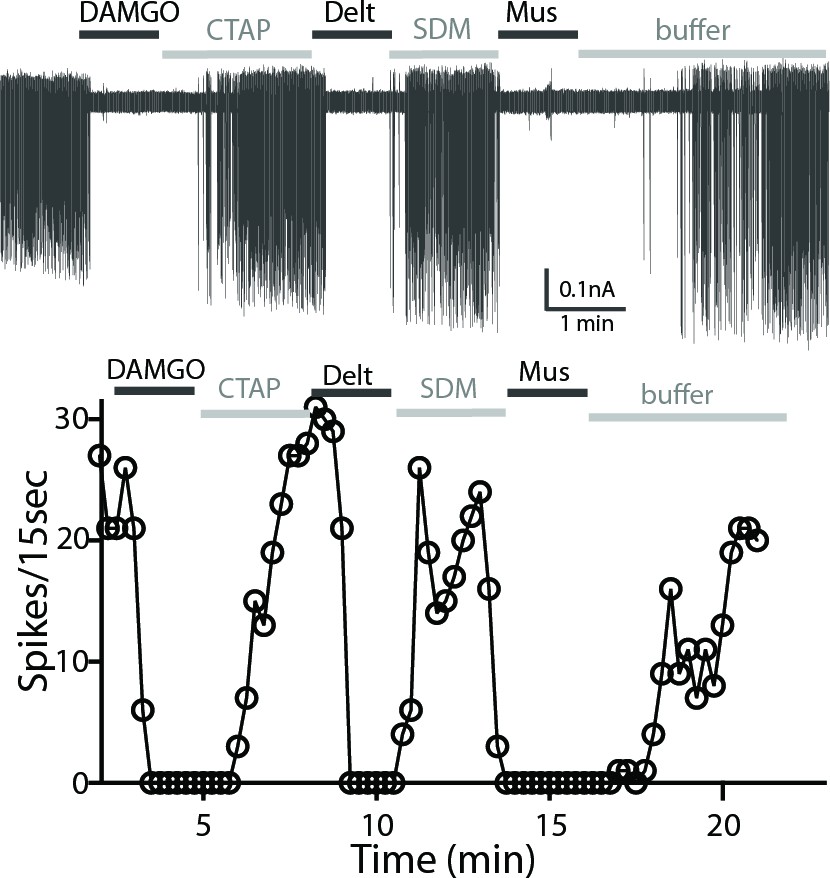
A representative trace of spontaneous firing shows regular spiking at baseline, and a complete stop of firing (100% inhibition) occurs after application of DAMGO (1 µM, 1 min).
The firing returns to baseline with application of CTAP (1 µM). The subsequent application of deltorphin (1 µM, 1 min) also causes 100% inhibition and this effect is reversed with SDM25N (0.5 µM). Lastly, muscarine (10 µM) causes 100% inhibition of firing. The graph below the trace shows the time course of the experiment plotted against the number of spikes at 15 s binning.
Figure 5
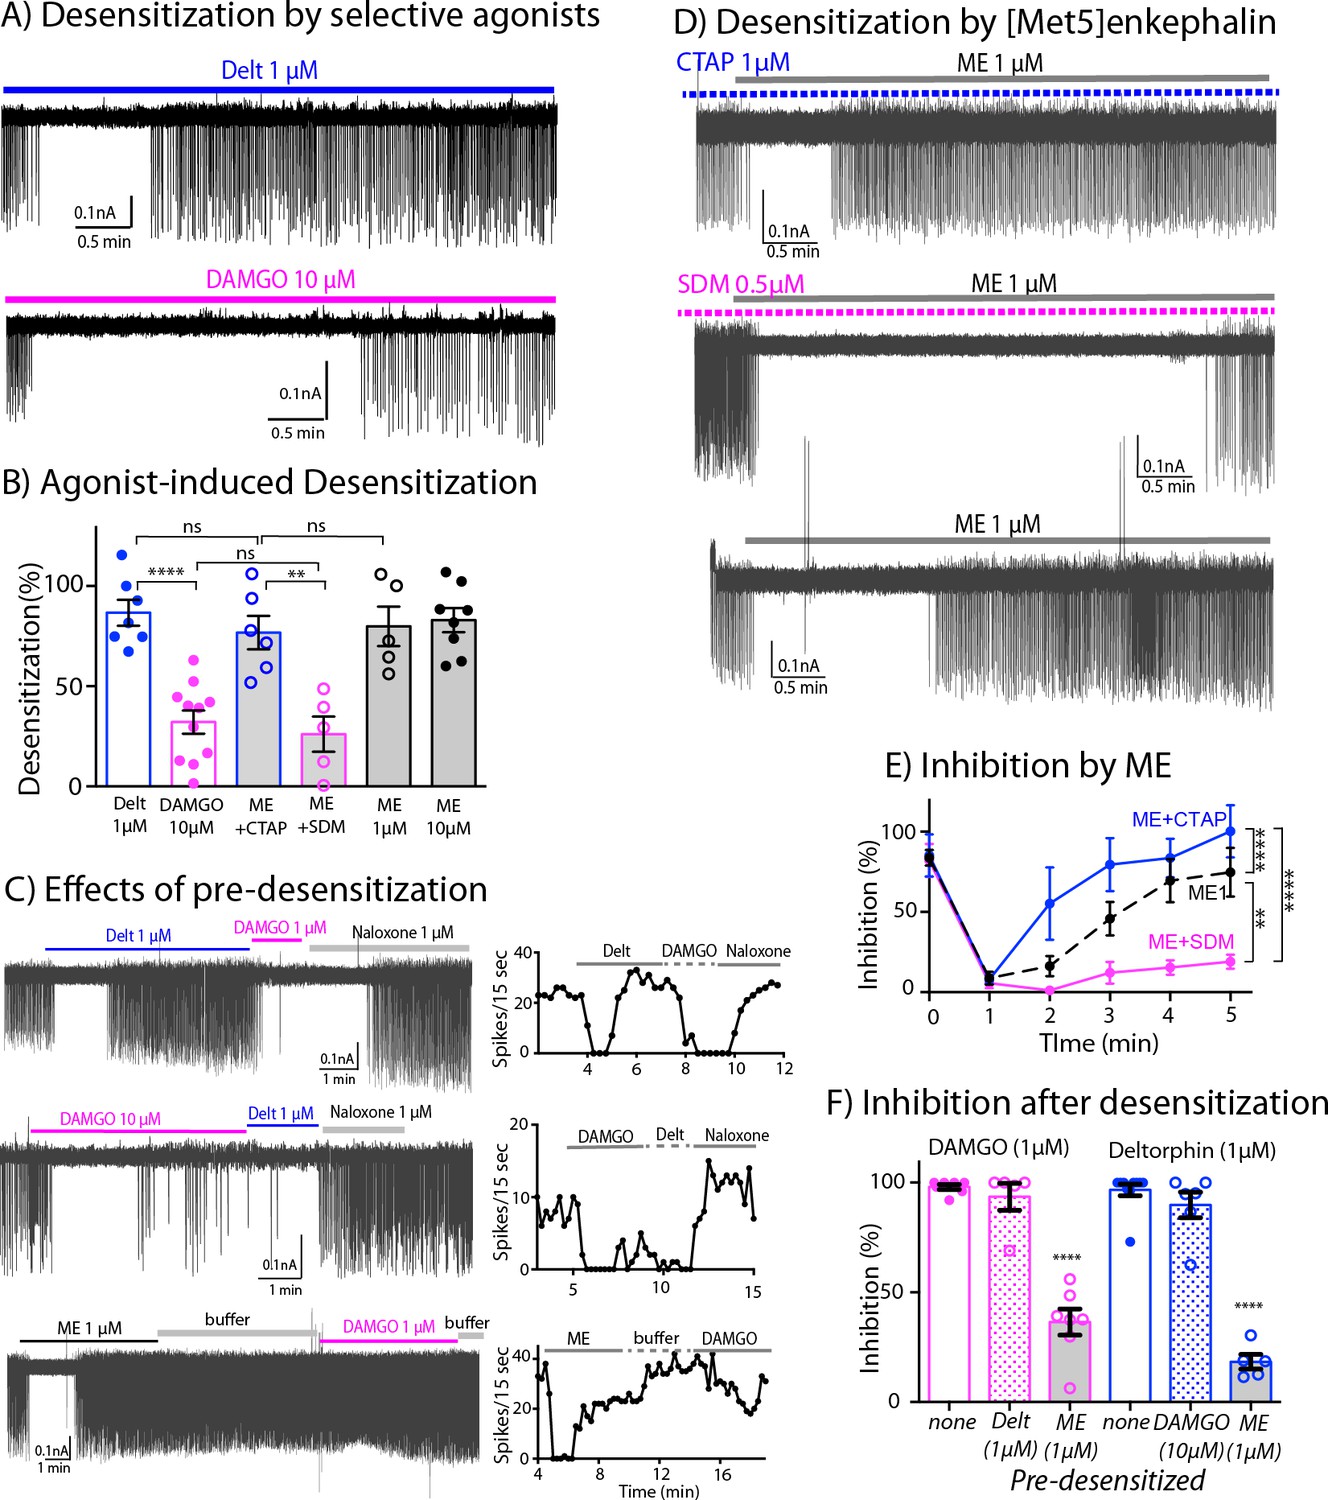
Differential desensitization by selective activation of MOR and DOR.
(A) Top trace shows spontaneous firing of ChI neurons during 5 min application of the DOR selective agonist Deltorphin (1 µM) that caused 100% inhibition of the firing during the first 1–2 min and the firing activity gradually returned to nearly baseline during the last 3 min of continuous application of the agonist, an indication of desensitization. Bottom trace. In contrast, the selective agonist DAMGO caused the persistent inhibition of the firing throughout its 5 min application. (B) Summary results of desensitization by Deltorphin, DAMGO, ME (1 and 10 µM) and ME (1 µM) with selective antagonists, CTAP (1 µM) and SDM25N (0.5 µM). (C) Top trace, desensitization of DORs by deltorphin did not change the ability of DAMGO to stop the firing that was reversed by naloxone. Middle trace shows similar experiment in which DAMGO caused little desensitization and subsequent application of deltorphin also inhibited the firing. Bottom trace illustrates the experiment when desensitization by ME decreased the ability of DAMGO to inhibit the firing. Time courses of each experiment plotted as the number of spikes binned every 15 s are shown next to the activity traces. (D) Desensitization by ME is very different when co-incubated with CTAP or SDM25N. Top trace shows ME desensitization in CTAP developed quickly. Middle trace shows no or little desensitization occurred during application of ME plus SDM25N. Bottom trace represents desensitization caused by ME alone. (E) The graph shows change of % inhibition of firing activity during 5-min application of ME in different conditions, Two-way ANOVA showed ** p = 0.0040 and **** p < 0.0001. (F) Summary of firing inhibition shown in pink, the ability of DAMGO (1 μM) to inhibit ChI firing activity was reduced after pre-desensitization by ME (1 μM) but not deltorphin (1 μM) as compared to the inhibition without pre-desensitization (p < 0.0001 and p = 0.9343, respectively), and in blue, the inhibition of firing by deltorphin (1 μM) was attenuated after pre-desensitization by ME (p < 0.0001) but was not different after pre-desensitization by DAMGO (p = 0.6687) as compared to the inhibition without pre-desensitization.
-
Figure 5—source data 1
Desensitization (%) by agonists.
- https://cdn.elifesciences.org/articles/69740/elife-69740-fig5-data1-v2.xlsx
-
Figure 5—source data 2
Time course analysis during 5-min application of ME, ME + CTAP and ME + SDM25 N.
- https://cdn.elifesciences.org/articles/69740/elife-69740-fig5-data2-v2.xlsx
-
Figure 5—source data 3
Inhibition (%) by DAMGO and deltorphin following pre-desensitization as compared to control (no pre-desensitization).
- https://cdn.elifesciences.org/articles/69740/elife-69740-fig5-data3-v2.xlsx
Figure 6
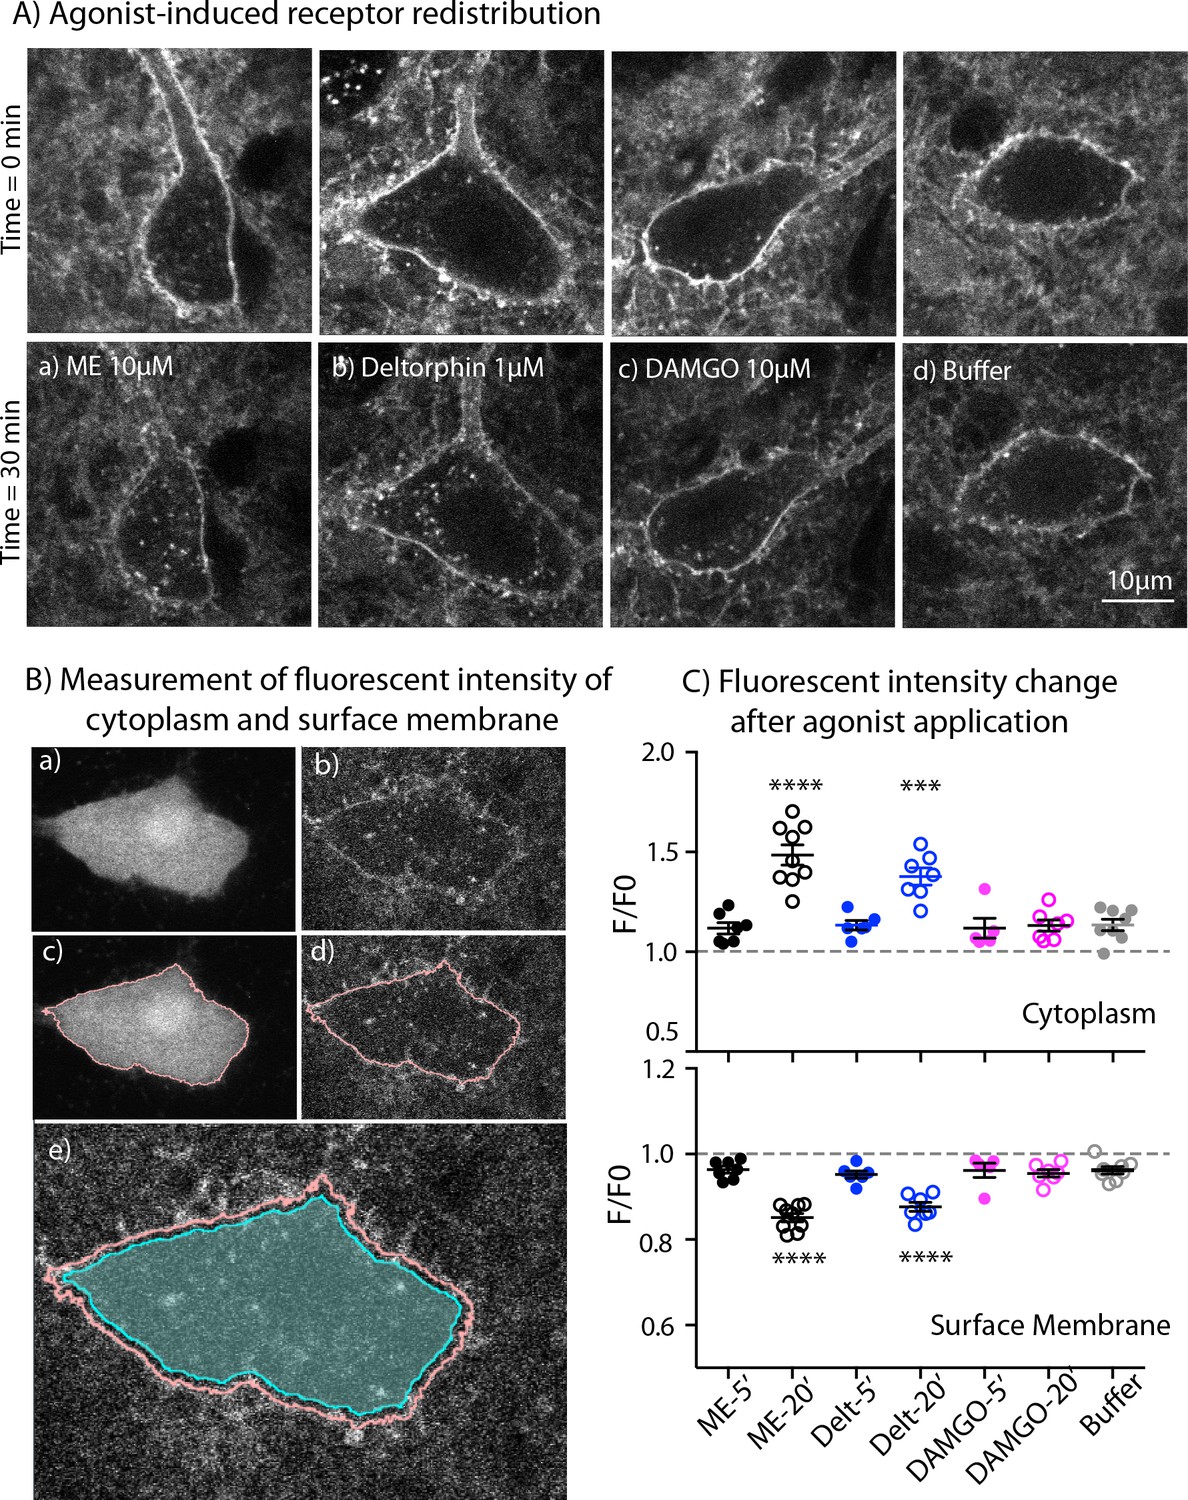
Endocytosis of MOR and DOR.
(A) Images show receptor redistribution induced by different agonists. Upper panel shows images taken before agonist application. Each slice was incubated in NAI-A594 100 nM for 1 hr and washed with Kreb’s buffer with continuous bath-perfusion for 10–15 min before acquiring the image. Lower panels show images taken after agonist application by bath-perfusion for 20 min and following 10 min of buffer. The control experiment was treated with buffer alone for 30 min. (B) Diagram images show measurements of fluorescent intensities along the plasma membrane and inside the cytoplasm using ImageJ. Raw images of one optical slice of a neuron taken simultaneously are shown for GFP (a) and Alexa594 (b). The GFP signal is used to define an outline of plasma membrane (c). This outline is copied to the image of Alexa594 signals (d). The outline of cytoplasm is then dilated eight pixels (~0.6 μm) and the inner line is used to define the area of cytoplasm where internalization is taking place (cyan shade area in (e)). Mean fluorescent intensity along the outline of plasma membrane is measured as F-memb (pink line). Mean fluorescent intensity in the area of cytoplasm is measured as F-cyt (cyan shade area). The ratio values of F-memb/(F-memb+ F cyt) and F-cyt/(F-memb+ F cyt) are then calculated for F/F0. F is the ratio value after agonist application and F0 is the value before agonist application. (C) Summary of fluorescent intensity changes in cytoplasm (top) and plasma membrane (bottom) of neurons treated with agonists. Data shown as mean ± SEM compared to buffer control group, one-way ANOVA, Dunnett’s test p < 0.0001 (****) and p = 0.0002 (***) as compared to control group. ME = [Met5] enkephalin, Delt = deltorphin.
-
Figure 6—source data 1
Quantification of receptor internalization at 5 and 20 min.
- https://cdn.elifesciences.org/articles/69740/elife-69740-fig6-data1-v2.xlsx
Tables
Table 1
Activation and desensitization by opioids.
| Agonists | Inhibition of firing (%)* | Desensitization (%) |
|---|---|---|
| DAMGO (10 μM) | 98.7 ± 0.9 (n = 11, 4 M,3F) | 32.1 ± 5.8 (n = 11)† |
| DAMGO (1 μM) | 98.0 ± 1.2 (n = 7, 2 M,4F) | |
| DAMGO (1 μM) after Deltorphin (1 μM)‡ | 93.5 ± 6.1 (n = 5, 1 M,2F) | |
| DAMGO (1 μM) after ME (1 or 10 μM)‡ | 36.4 ± 6.0 (n = 7, 3 M,3F)§ | |
| Deltorphin (1 μM) | 96.6 ± 2.7 (n = 10, 2 M,2F) | 86.7 ± 6.4 (n = 7) |
| Deltorphin (1 μM) after DAMGO (10 μM)‡ | 89.8 ± 5.8 (n = 6, 3 M,2F) | |
| Deltorphin (1 μM) after ME (10 μM)‡ | 18.3 ± 3.4(n = 5, 1 M,2F)¶ | |
| ME (10 μM) | 99.4 ± 0.6 (n = 11, 3 M,3F) | 83.0 ± 6.0 (n = 8) |
| ME (1 μM) | 92.6 ± 2.6 (n = 12, 6 M,2F) | 79.9 ± 9.9 (n = 5) |
| ME (1 μM)+ CTAP (1 μM) | 97.7 ± 1.4 (n = 6, 2 M,1F) | 76.8 ± 8.4 (n = 6) |
| ME (1 μM)+ SDM (1 μM) | 97.3 ± 1.7 (n = 6, 4 M) | 26.1 ± 8.8 (n = 5) |
| Morphine (10 μM) | 79.4 ± 5.0 (n = 10, 4 M) | |
| Morphine (1 μM) | 48.9 ± 8.3 (n = 8, 4 M) | |
| Morphine (10 μM)+ CTAP (1 μM) | 10.0 ± 3.7 (n = 7, 4 M) |
-
*
n = number of cells (one cell per slice), and numbers of male (M) and female (F) used in the experiments are shown in parentheses.
-
†
p < 0.0001 compared to desensitization induced by Deltorphin (1 μM).
-
‡
Inhibition of firing after agonist-induced desensitization.
-
§
p < 0.0001 compared to firing inhibition of DAMGO (1 μM).
-
¶
p < 0.0001 compared to firing inhibition of Deltorphin (1 μM).
-
Table 1—source data 1
Spontaneous firing inhibition (%) and desensitization induced by agonists.
- https://cdn.elifesciences.org/articles/69740/elife-69740-table1-data1-v2.xlsx
Key resources table
| Reagent type (species) or resource | Designation | Source or reference | Identifiers | Additional information |
|---|---|---|---|---|
| Strain, strain background | R.norvegicus, Sprague Dawley, male and female | Charles River Laboratories | Stock# 001RRID:RGD_734476 | |
| Strain, strain background | M. musculus, C57BL/6 J, male and female | Jackson Laboratories | Stock# 000664RRID:IMSR_JAX:000664 | |
| Strain, strain background (M. musculus) | M. musculusC57BL/6 J (ChAT-BAC-eGFP) | Jackson Laboratories | Stock # 007902RRID:IMSR_JAX:007902 | |
| Strain, strain background | M. musculus C57BL/6 J MOR-KO | Schuller et al., 1999 | Oprm1-exon-1 knockout mice | Dr. John E. Pintar, RWJMS |
| Cell line | Homo sapiens HEK293, female | ATCC | CRL-1573:RRID:CVCL_0045 | Human embryonic kidney |
| Antibody | Anti-Flag-M1 (mouse monoclonal) | Sigma | Cat#F-3040RRID:AB_439712 | 1:600 |
| Antibody | Anti-Alexa Fluor 488 (rabbit polyclonal) | Thermo Fisher | Cat#A-11094RRID:AB_221544 | 1:500 |
| Antibody | Goat-anti mouse IgG Alexa 680 | Thermo Fisher | Cat#A28183RRID:AB_2536167 | 1:5,000 |
| Antibody | Goat-anti rabbit IgG IRDYE CW800 | LI-COR | Cat#P/N 926–32211RRID:AB_621843 | 1:10,000 |
| Chemical compound, drug | NAI-A594 and NAI-A488 | Arttamangkul et al., 2019 | N/A | |
| Chemical compound, drug | [Met5]-enkephalin | GenScript | Cat# RP10886 | |
| Chemical compound, drug | Morphine | NIDA | N/A | |
| Chemical compound, drug | CTAP | Sigma | Cat# C6352 | |
| Chemical compound, drug | SDM25N | Tocris | Cat# 1,410 | |
| Chemical compound, drug | Naloxone HCl | Hello Bio | Cat# HB2451 | |
| Chemical, drug | DAMGO | Hello Bio | Cat# HB2409 | |
| Chemical compound, drug | [D-Ala2]-Deltorphin II | Tocris | Cat# 1,180 | |
| Software, algorithm | ScanImage | Vidrio Technologies, LLC | ScanImageRRID:SCR_014307 | |
| Software, algorithm | Fiji Image J | Rueden et al., 2017 | FijiRRID:SCR_002285 |
Additional files
Download links
A two-part list of links to download the article, or parts of the article, in various formats.
Downloads (link to download the article as PDF)
Open citations (links to open the citations from this article in various online reference manager services)
Cite this article (links to download the citations from this article in formats compatible with various reference manager tools)
Functional independence of endogenous μ- and δ-opioid receptors co-expressed in cholinergic interneurons
eLife 10:e69740.
https://doi.org/10.7554/eLife.69740


