Pathogen invasion-dependent tissue reservoirs and plasmid-encoded antibiotic degradation boost plasmid spread in the gut
- Institute of Microbiology, Department of Biology, ETH Zurich, Switzerland
- Swiss Institute of Bioinformatics, Switzerland
- Institute of Integrative Biology, Department of Environmental Systems Science, ETH Zurich, Switzerland
- Botnar Research Centre for Child Health, Switzerland
- Biozentrum, University of Basel, Switzerland
Figures
Figure 1 with 6 supplements
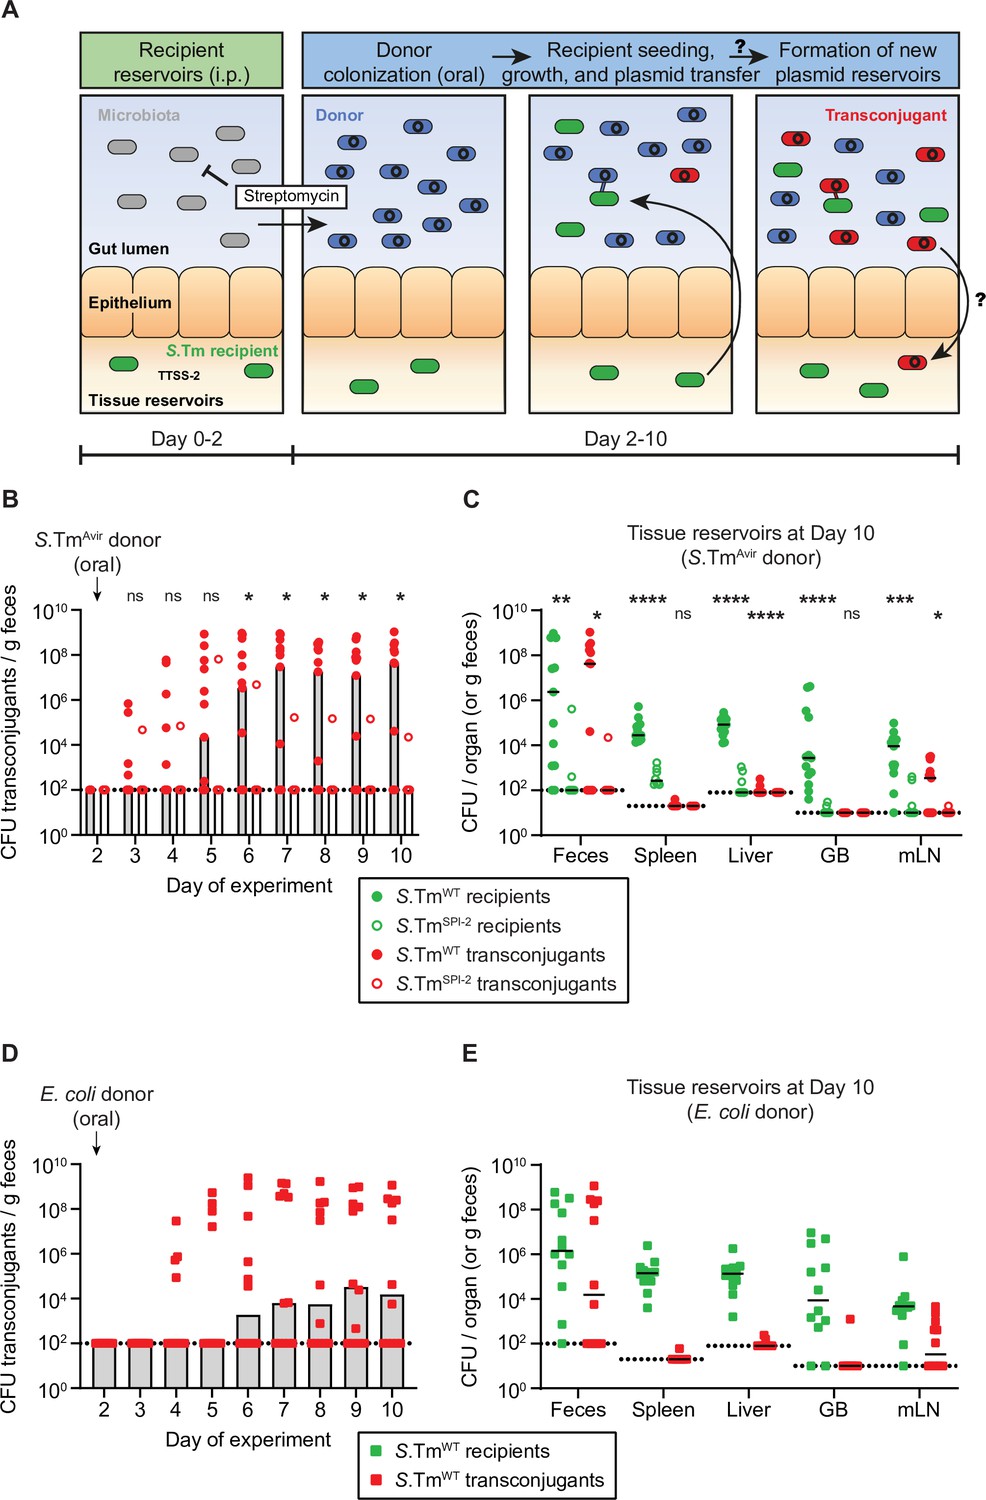
Salmonella enterica serovar Typhimurium (S.Tm) in tissue reservoirs can re-seed the gut lumen, obtain a plasmid from Enterobacteriaceae in the gut lumen, and form new plasmid-bearing reservoirs.
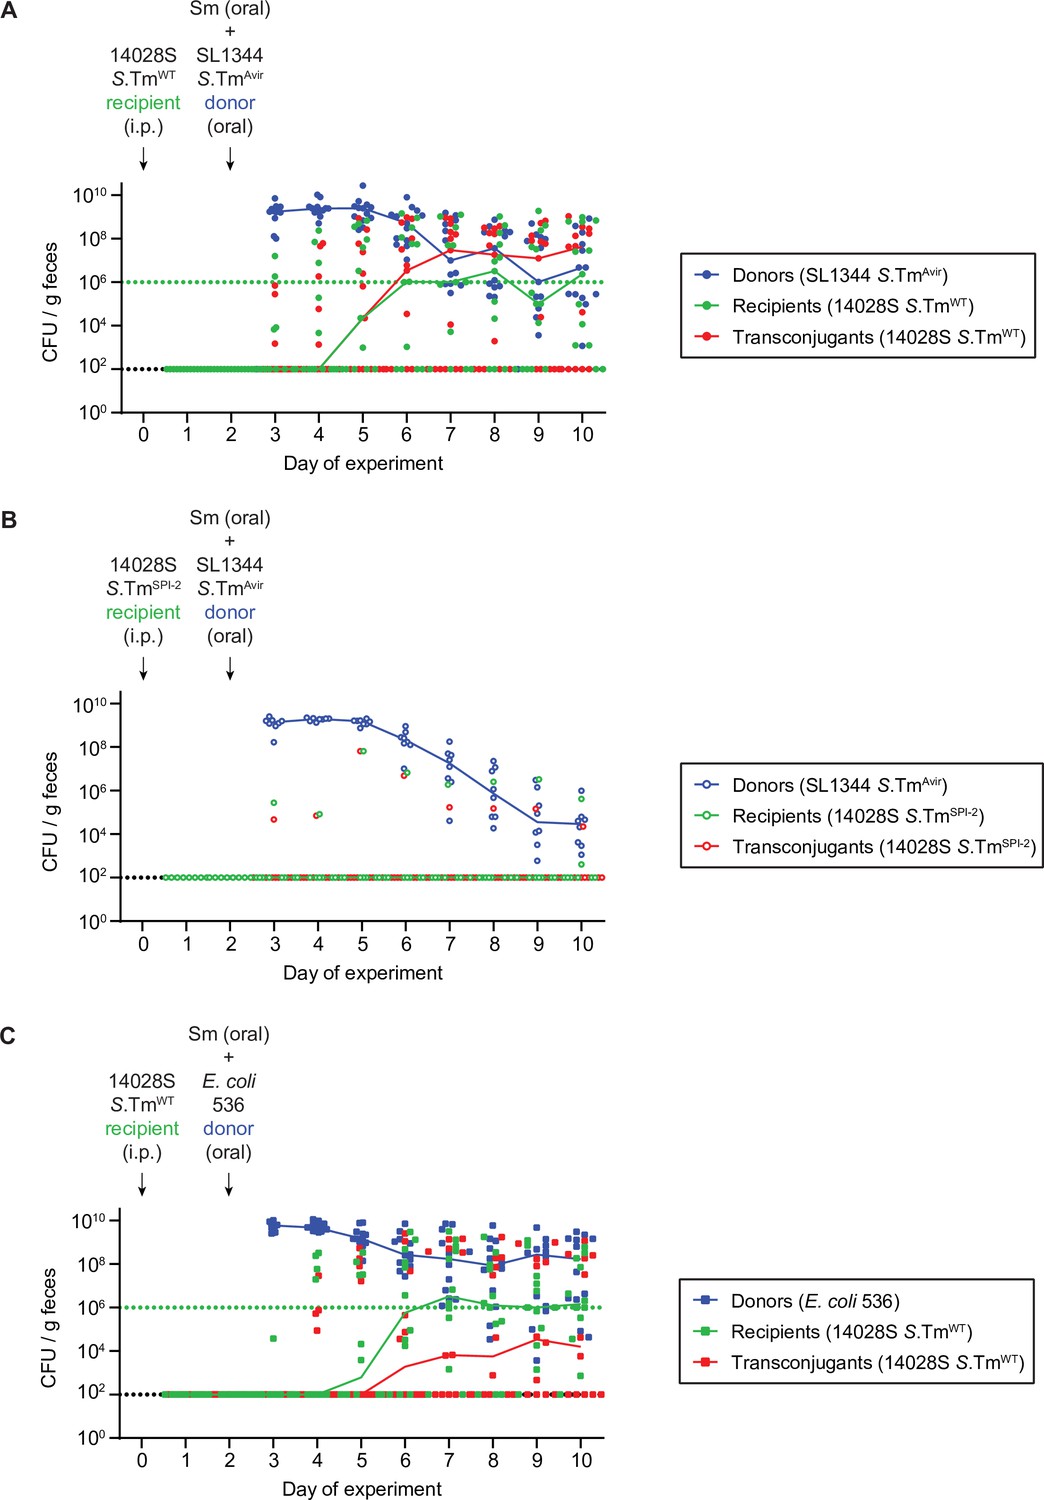
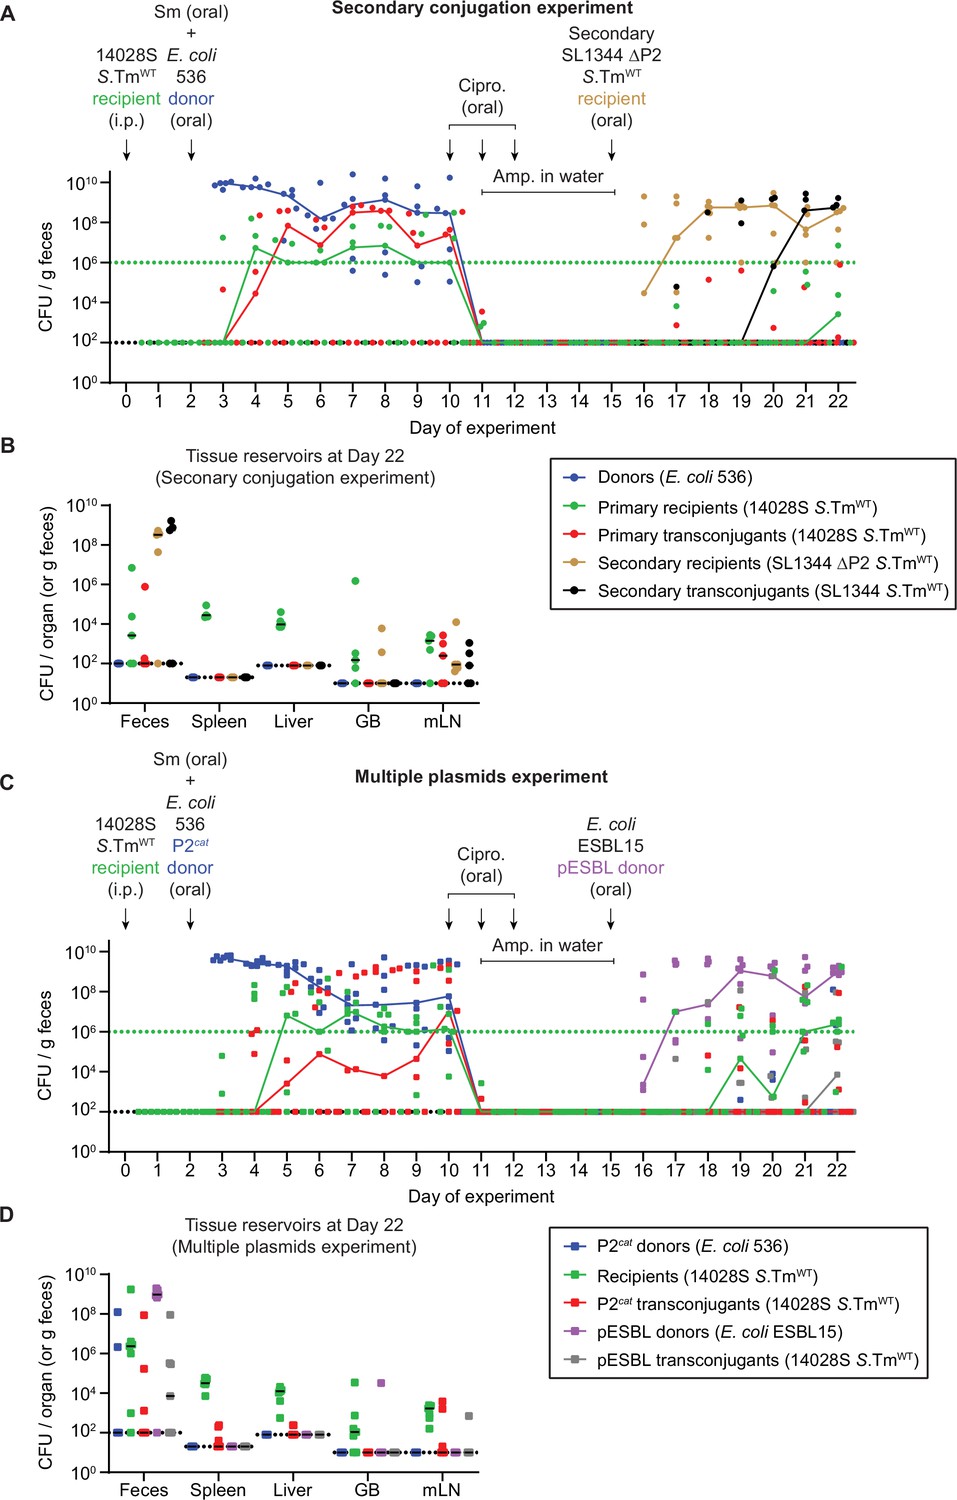
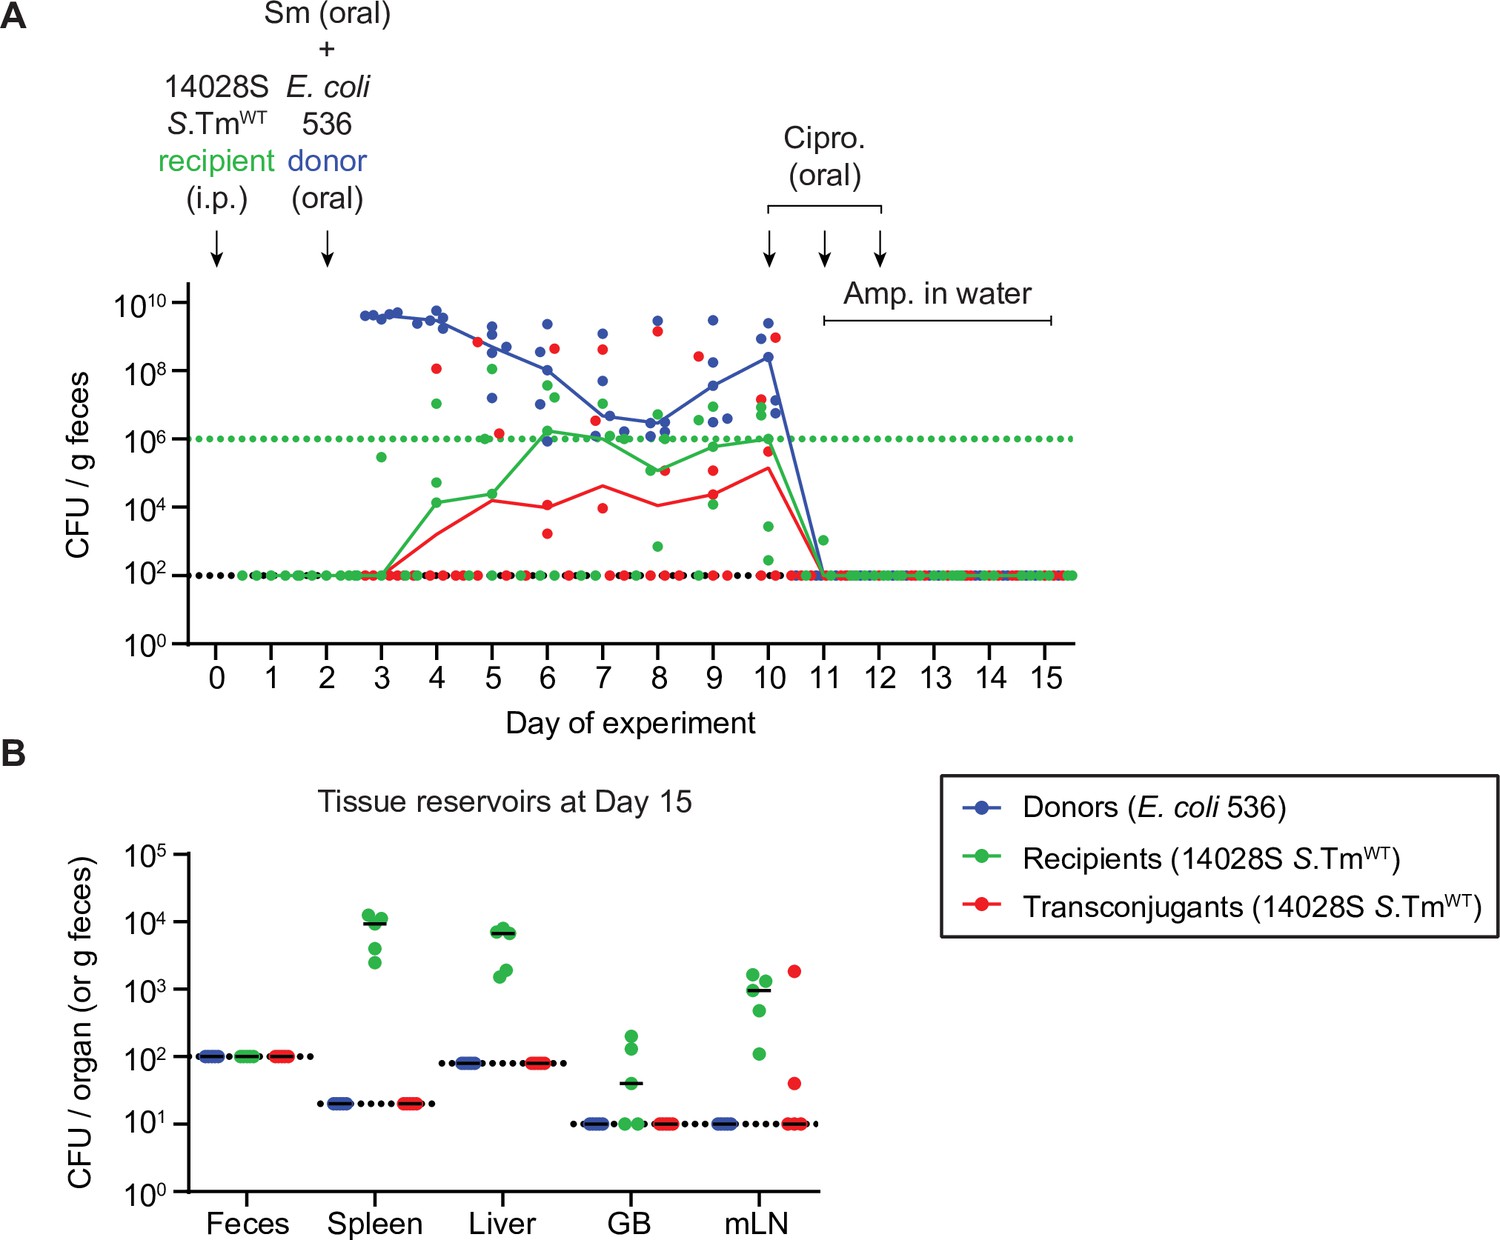
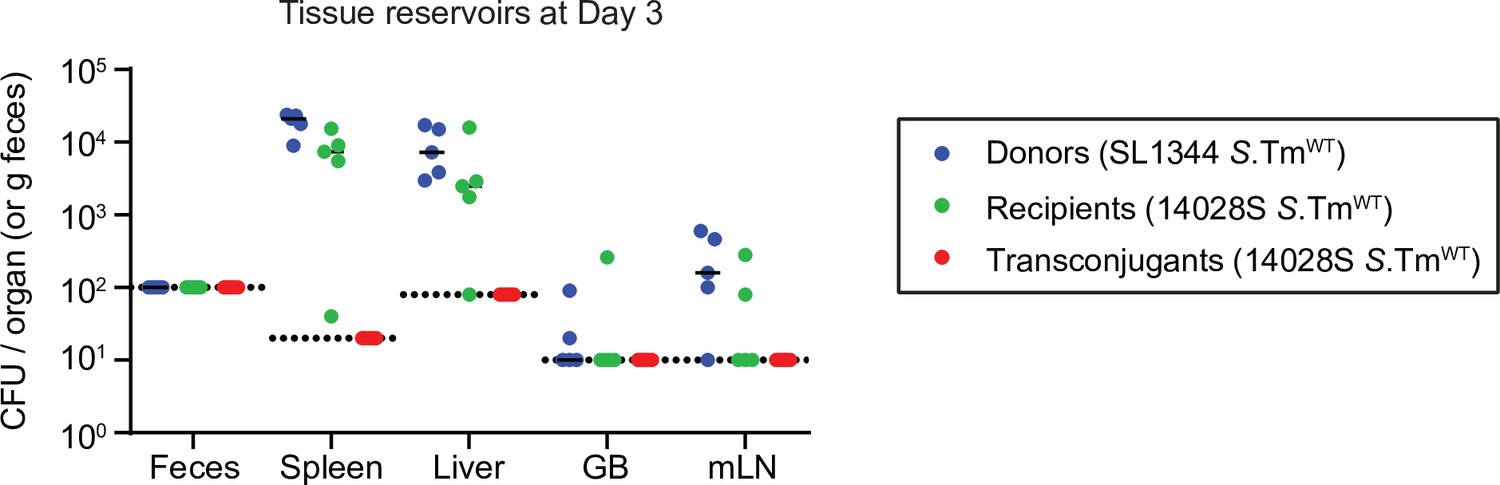
(A) Proposed hypothesis. S.Tm recipients (green) establish tissue reservoirs after intraperitoneal injections and spread to organs, dependent on the Type three secretions system-2 (TTSS-2; encoded on SPI-2). The microbiota (grey) provides colonization resistance against colonization of the gut lumen. Donors (blue) colonize the gut lumen by an oral infection following a streptomycin treatment to suppress the microbiota. S.Tm recipients re-seed from their reservoirs and obtain a plasmid from donors forming a transconjugant (red). These transconjugants then form new tissue reservoirs. (B) Transconjugants are formed in the gut lumen. Mice were i.p. infected with 103 CFU of a 1:1:1 mix of 14028S SmR TAG1-3 (S.TmWT; n = 13) or 103 CFU of 14028SSPI-2 SmR (S.TmSPI-2; ssaV mutant; n = 8). On day 2 post infection, 20 mg of streptomycin was given 4 hr before 5 × 10⁷ CFU of a 1:1:1:1 mix of S.TmAvir (invG ssaV mutant) P2TAG4-7. Selective plating was used to determine the fecal transconjugant loads. (C) Tissue reservoirs of S.Tm. Organs of mice in panel B were analysed for recipients (green circles) or transconjugants (red circles). (B–C) Dotted line indicates the detection limit. A two-tailed Mann-Whitney U-test was used to compare S.TmWT (solid circles) to S.TmSPI-2 (hollow circles) in each sample (p > 0.05 not significant (ns), p < 0.05 (*), p < 0.01 (**), p < 0.001 (***), p < 0.0001 (****)). (D) S.Tm recipients can obtain P2cat from Escherichia coli. Mice were i.p. infected with 103 CFU of 14,028S SmR TAG1 (S.TmWT; n = 12). On day 2 post infection, 20 mg of streptomycin was given 4 hr before 5 × 10⁷ CFU of E. coli 536 P2cat. Selective plating and colony colour on MacConkey agar was used to determine the fecal transconjugant loads. (E) Tissue reservoirs of S.Tm after conjugation with E. coli. Organs in panel B were analysed for recipients (green squares) or transconjugants (red squares). (D–E) Dotted line indicates the detection limit. (B,D) Bars indicate median. (C,E) Lines indicate median. GB = gall bladder; mLN = mesenteric lymph node. (B–E) Fecal populations of donors, recipients, and transconjugants are presented in Figure 1—figure supplement 1.
-
Figure 1—source data 1
CFU data for Figure 1.
- https://cdn.elifesciences.org/articles/69744/elife-69744-fig1-data1-v1.xlsx
Figure 1—figure supplement 1
Fecal populations for mice in Figure 1.
Donors (blue; CmR), recipients (green; KanR), and transconjugants (red; CmR and KanR) were enumerated by selective and/or replica plating on MacConkey agar. The black dotted lines represent the detection limits for transconjugants and donors (and recipients in panel B). The green dotted lines represent the detection limits for recipients. The detection limit is higher for recipients once the density of bacteria reaches >108 CFU/g feces (because of the limit of colonies on a plate for replica plating). Before this happens, recipient populations can appear below this line (then the black dotted line is the detection limit). Lines of colour connect medians between days. (A–B) Mice from Figure 1B–C infected with SL1344Avir P2cat as donors. (A) Mice infected with Salmonella enterica serovar Typhimurium (S.TmWT) recipients (n=13). (B) Mice infected with S.TmSPI-2 recipients (n=8). (C) Mice from Figure 1D–E infected with S.TmWT recipients and Escherichia coli 536 P2cat as donors (n=12).
-
Figure 1—figure supplement 1—source data 1
CFU data for Figure 1—figure supplement 1.
- https://cdn.elifesciences.org/articles/69744/elife-69744-fig1-figsupp1-data1-v1.xlsx
Figure 1—figure supplement 2
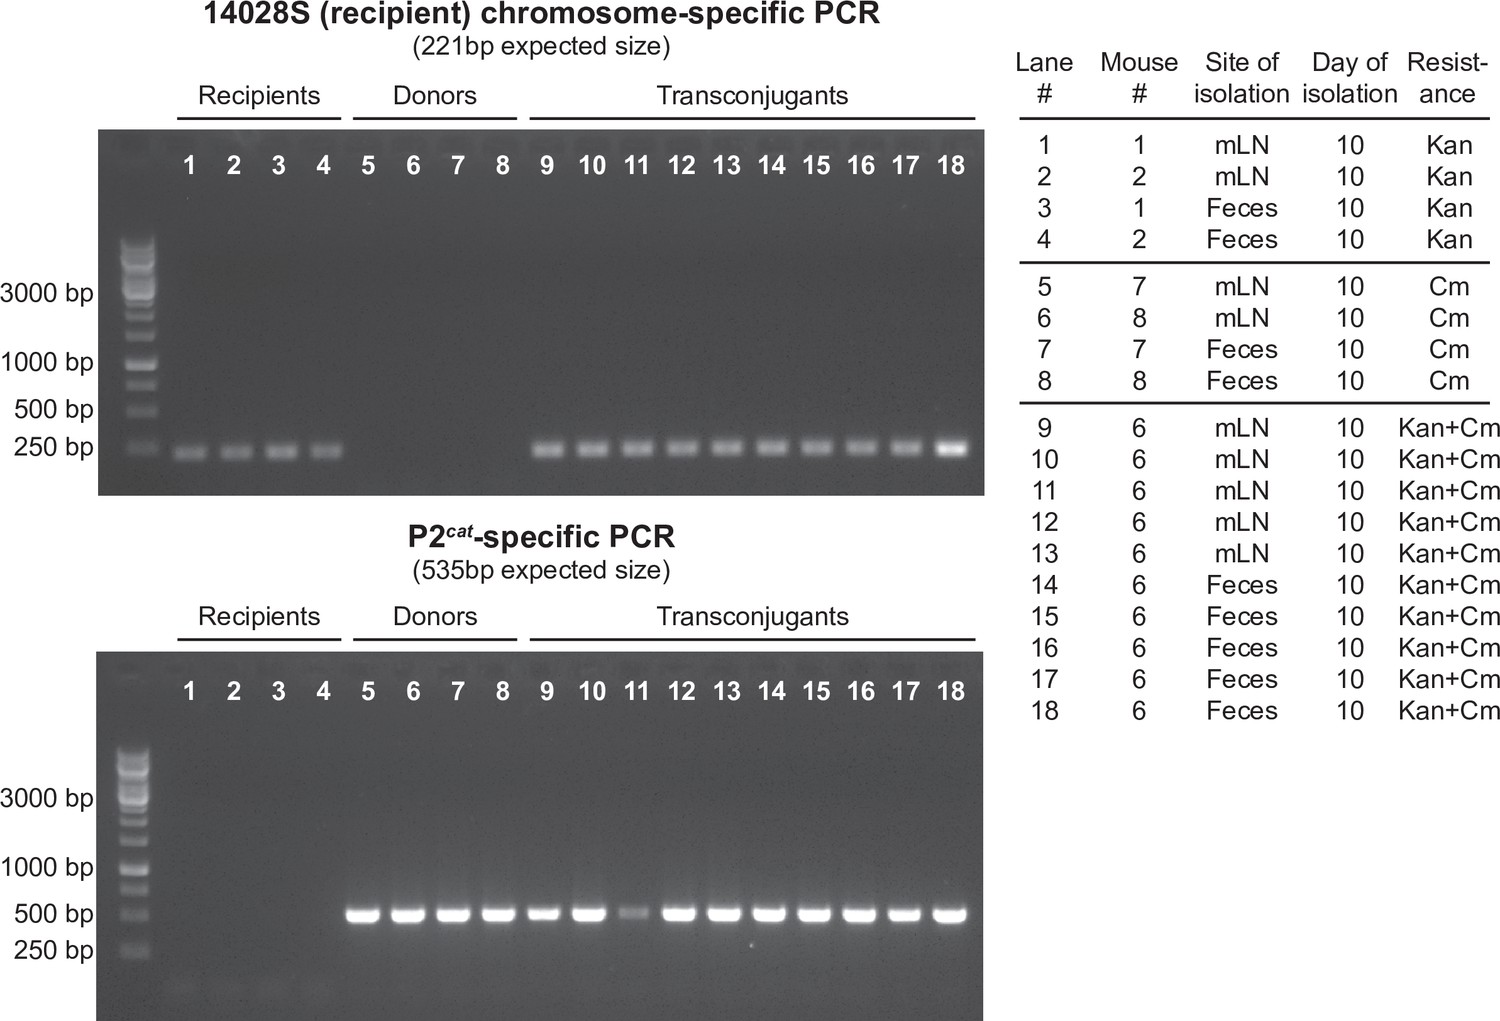
Verification of transconjugant formation by colony PCR.
Four donor clones, 4 recipient clones, and 10 transconjugant clones were isolated from mice on day 10 of the experiment in Figure 1—figure supplement 4 (either feces or the mesenteric lymph node [mLN]; the individual mice are labelled the same as in Figure 2—figure supplement 2) according to the resistance profile used to classify subpopulations (donors = CmR; recipients = KanR; transconjugants = CmR + KanR). A colony PCR was performed using primers specific to either the 14028S recipient chromosome (top) or the P2cat conjugative plasmid (bottom), and PCR products were run on a 1% agarose gel.
Figure 1—figure supplement 3
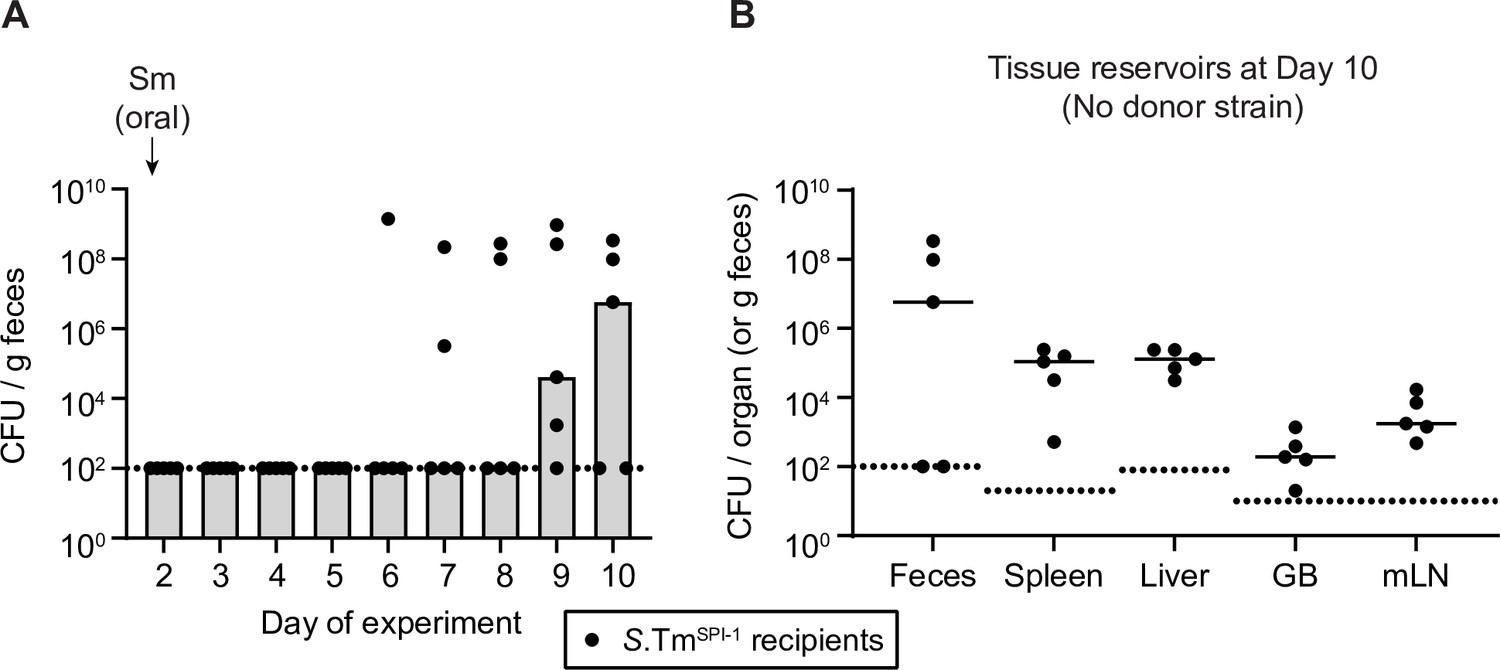
Type three secretions system-1 (TTSS-1)-dependent invasion of recipients is not necessary for re-seeding.
(A) Mice were i.p. infected with 103 CFU of 14028S SmR invG (TTSS-1-deficient encoded on SPI-1; S.TmSPI-1; n=5). On day 2 post infection, 25 mg of streptomycin was given. Selective plating was used to determine the fecal loads for 10 days. (B) Tissue reservoirs of Salmonella enterica serovar Typhimurium (S.Tm) at day 10 of the experiment. Organs of mice in panel A were analysed for S.Tm population sizes using selective plating on MacConkey agar. GB = gall bladder; mLN = mesenteric lymph node. (A–B) Bars or solid lines indicate median. Dotted lines indicate the detection limit.
-
Figure 1—figure supplement 3—source data 1
CFU data for Figure 1—figure supplement 3.
- https://cdn.elifesciences.org/articles/69744/elife-69744-fig1-figsupp3-data1-v1.xlsx
Figure 1—figure supplement 4
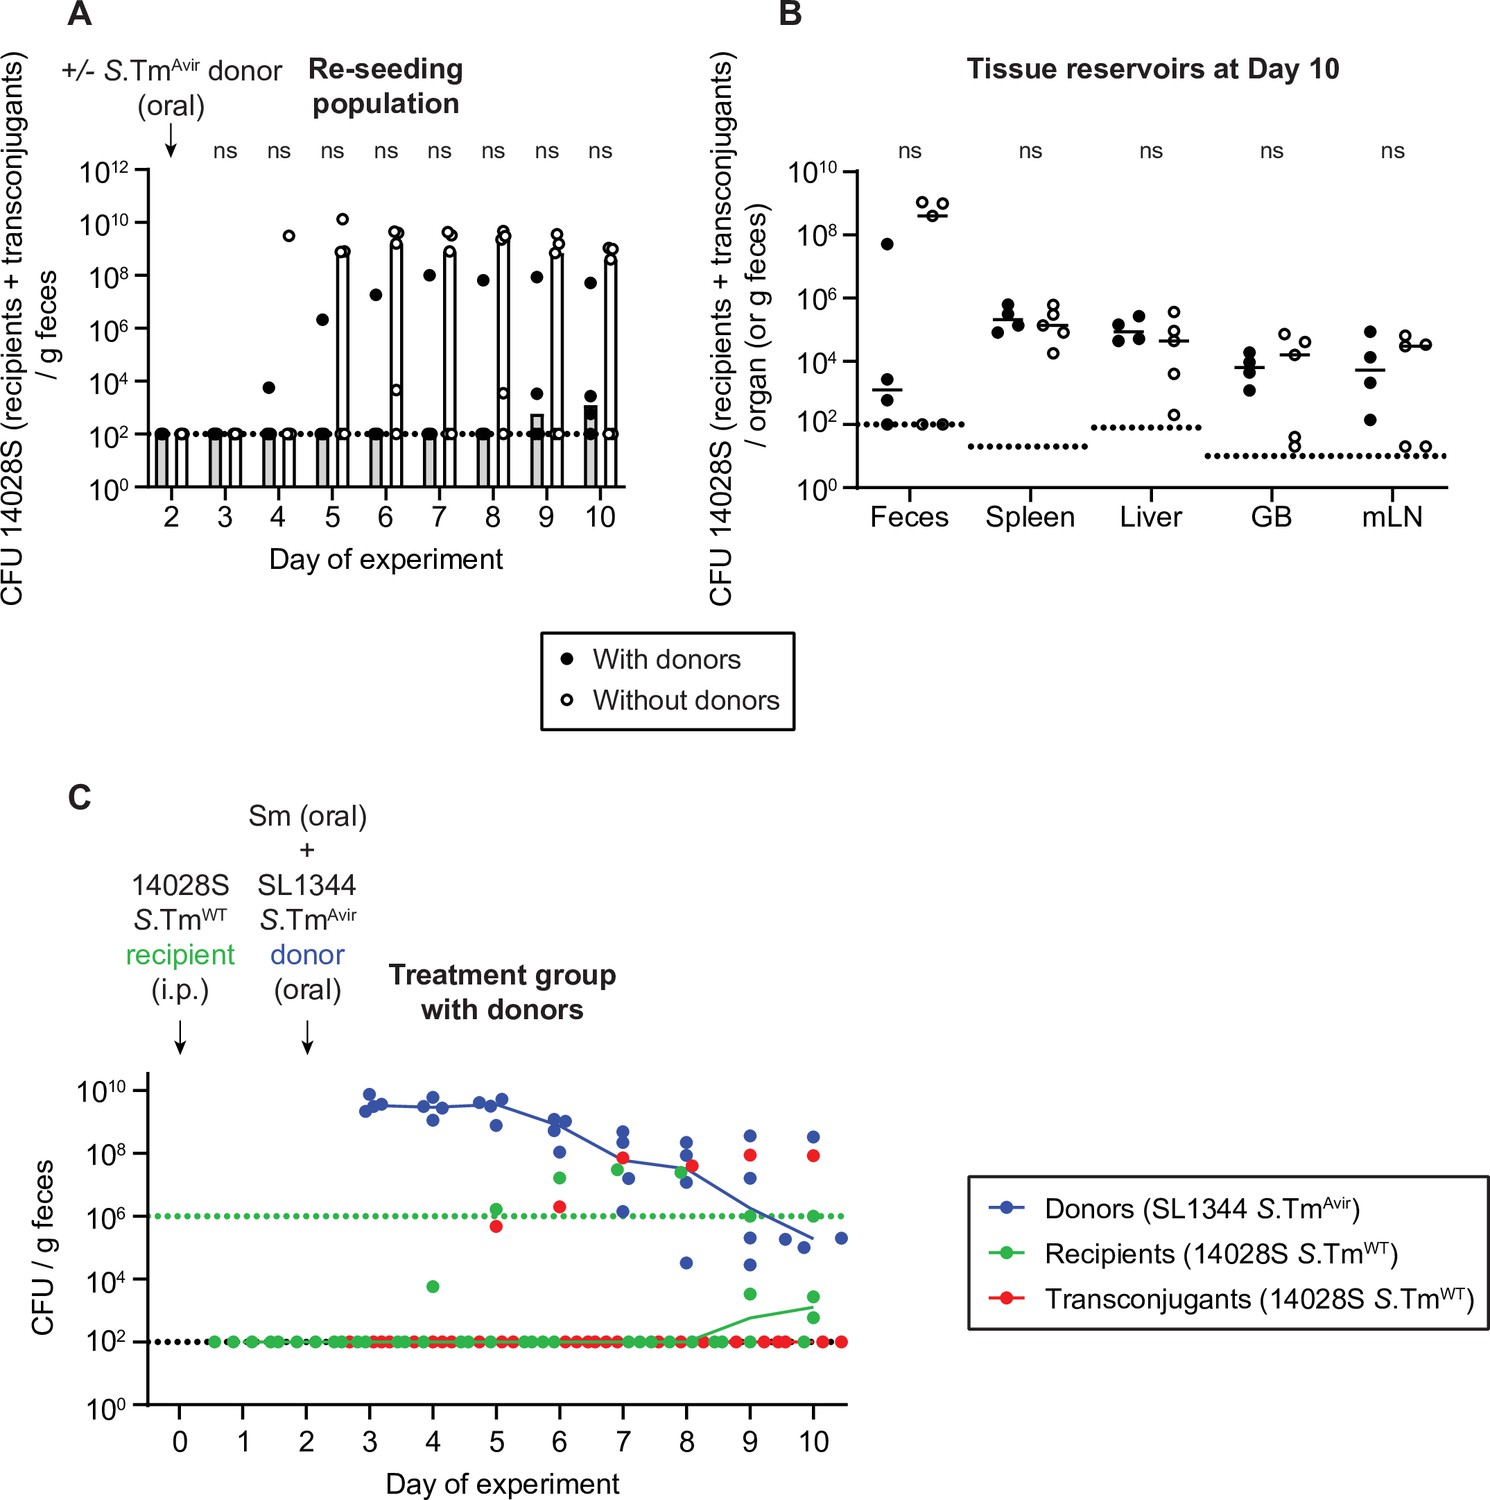
Donor inoculation does not promote re-seeding.
Mice were i.p. infected with 103 CFU of a 1:1:1:1:1:1:1 mix of 14028S SmR TAG1-7. On day 2 post infection, 20 mg of streptomycin was given. Four hours later 5×10⁷ CFU of S.TmAvir (invG ssaV mutant) P2cat were given to half the mice (with donors; solid black circles; n=4) and half the mice were left untreated (without donors; hollow black circles; n=5). (A) Selective plating was used to determine the re-seeding population (KanR colonies, which includes the transconjugant population in same cases). Bars indicate the median. (B) Tissue reservoirs of Salmonella enterica serovar Typhimurium (S.Tm) recipients at day 10. Organs of mice in panel A were analysed for the total 14028S population (recipients + transconjugants; KanR). Lines indicate median. GB = gall bladder; mLN = mesenteric lymph node. (A–B) Dotted line indicates the detection limit. A two-tailed Mann-Whitney U-test was used to compare mice with donors (solid circles) to mice without donors (hollow circles) in each sample (p>0.05 not significant [ns]). (C) Fecal population of donors (blue), recipients (green), and transconjugants (red) for the mice in panels A and B with donors. Selective and/or replica plating was used to determine these subpopulations. The black dotted lines represent the detection limits for transconjugants and donors. The green dotted lines represent the detection limits for recipients. The detection limit is higher for recipients once the density of bacteria reaches >108 CFU/g feces (because of the limit of colonies on a plate for replica plating). Before this happens, recipient populations can appear below this line (then the black dotted line is the detection limit). Lines of colour connect medians between days.
-
Figure 1—figure supplement 4—source data 1
CFU data for Figure 1—figure supplement 4.
- https://cdn.elifesciences.org/articles/69744/elife-69744-fig1-figsupp4-data1-v1.xlsx
Figure 1—figure supplement 5
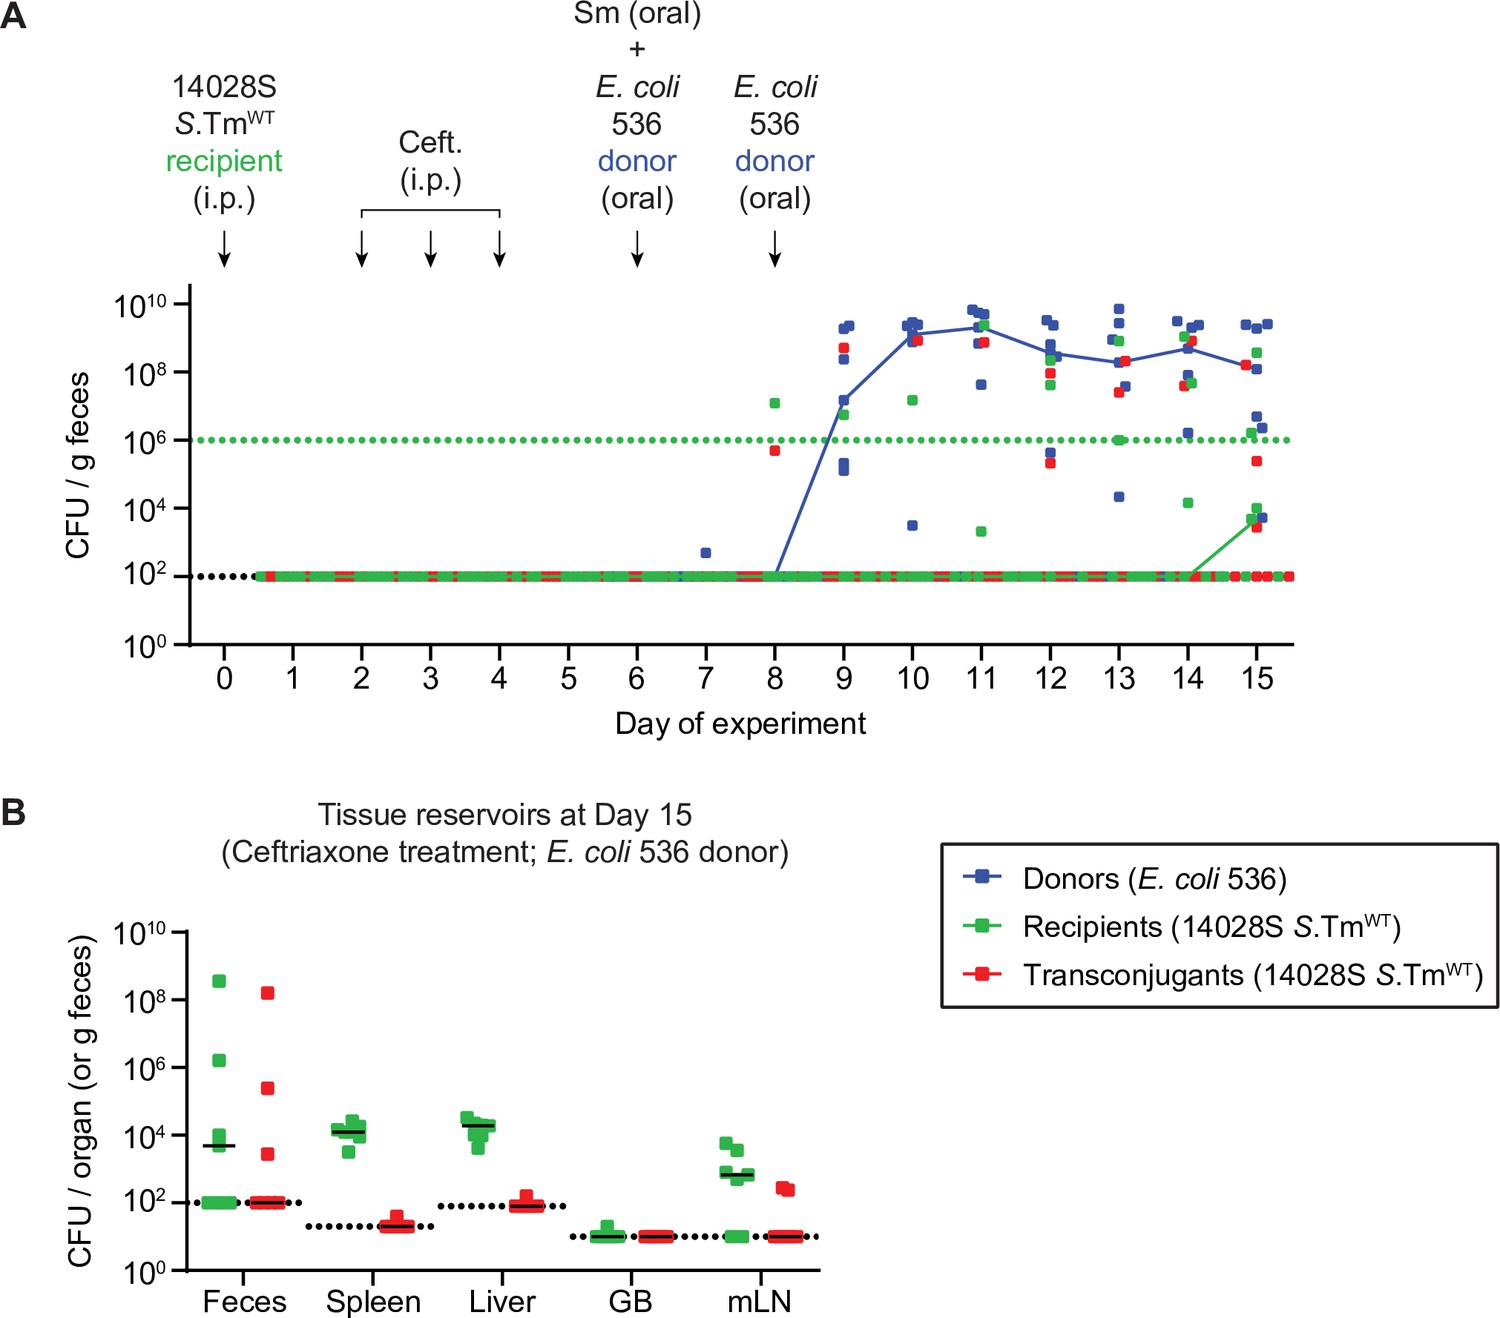
Control for re-seeding and obtaining a plasmid from persisters induced by antibiotic treatment.
Mice were i.p. infected with 103 CFU of 14028S SmR TAG1 (KanR; n=7). On day 2 post infection, doses of ceftriaxone (1.5 mg i.p. per mouse per day) were given for 3 consecutive days. On day 6, 20 mg of streptomycin was given 4 hr before 5×10⁷ CFU of Escherichia coli 536 P2cat (CmR). E. coli was given again on day 8 post infection to ensure colonization. (A) Donors (blue; CmR), recipients (green; KanR), and transconjugants (red; CmR and KanR) were enumerated by selective and/or replica plating on MacConkey agar. The black dotted lines represent the detection limits for transconjugants and donors. The green dotted lines represent the detection limits for recipients. The detection limit is higher for recipients once the density of bacteria reaches >108 CFU/g feces (because of the limit of colonies on a plate for replica plating). Before this happens, recipient populations can appear below this line (then the black dotted line is the detection limit). Lines of colour connect medians between days. (B) Organs of mice in panel A were analysed for population sizes of recipients and transconjugants. Lines indicate medians. Dotted line indicates the detection limit. GB = gall bladder; mLN = mesenteric lymph node.
-
Figure 1—figure supplement 5—source data 1
CFU data for Figure 1—figure supplement 5.
- https://cdn.elifesciences.org/articles/69744/elife-69744-fig1-figsupp5-data1-v1.xlsx
Figure 1—figure supplement 6
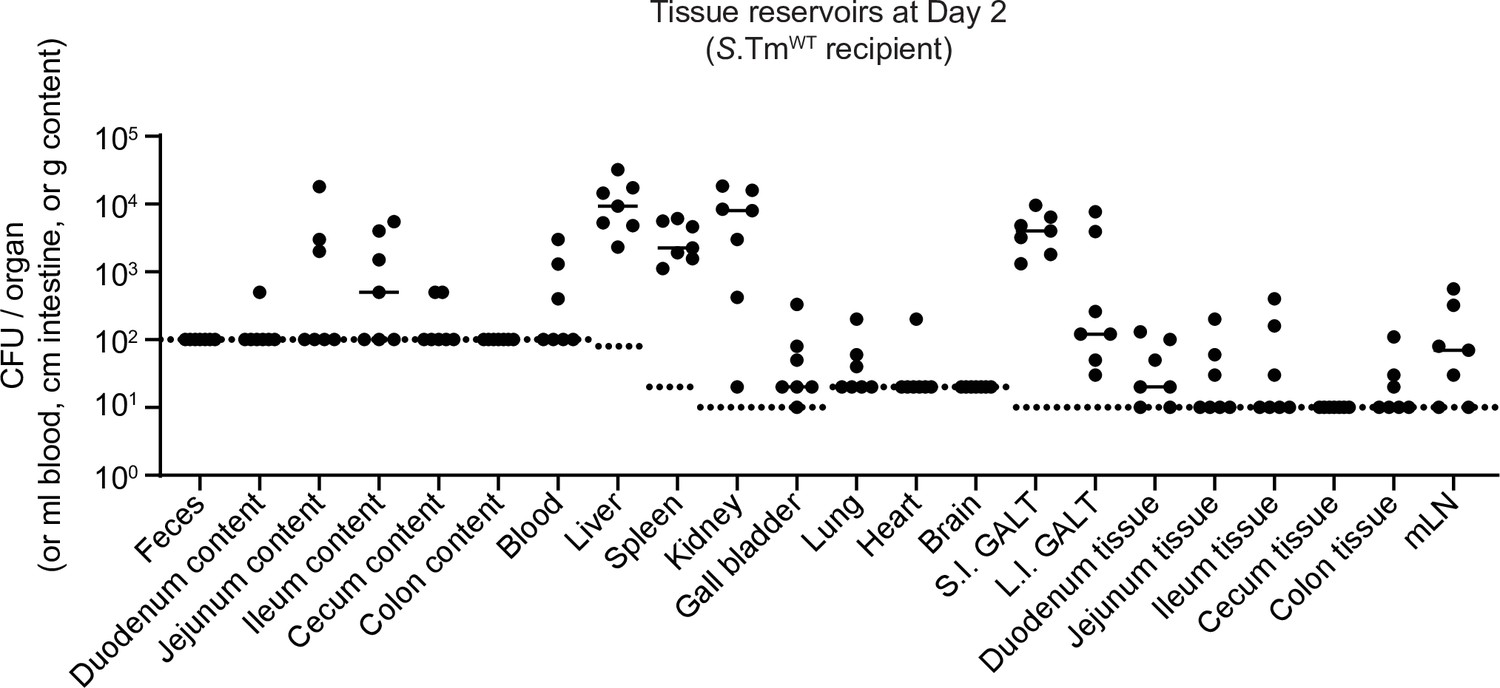
Localization of tissue reservoirs of Salmonella enterica serovar Typhimurium (S.Tm) prior to re-seeding.
Mice (n=7) were i.p. infected with 103 CFU of a 1:1:1:1:1:1:1 mix of 14028S SmR TAG1-7. At day 2 post infection, S.Tm in the organs were enumerated. For feces and the intestinal content, pre-weighed tubes were used to determine S.Tm per g of content. Blood is reported per ml. Intestinal tissues are reported per cm. The small intestinal (S.I.) and large intestinal (L.I.) gut-associated lymphoid tissues (GALT) contain the lining of the intestinal tissues, which includes the GALT (but also fat). Here, we called them S.I. and L.I. GALT, but they can contain more than just this region. Dotted lines indicate the detection limits. Lines indicate medians.
-
Figure 1—figure supplement 6—source data 1
CFU data for Figure 1—figure supplement 6.
- https://cdn.elifesciences.org/articles/69744/elife-69744-fig1-figsupp6-data1-v1.xlsx
Figure 2 with 4 supplements
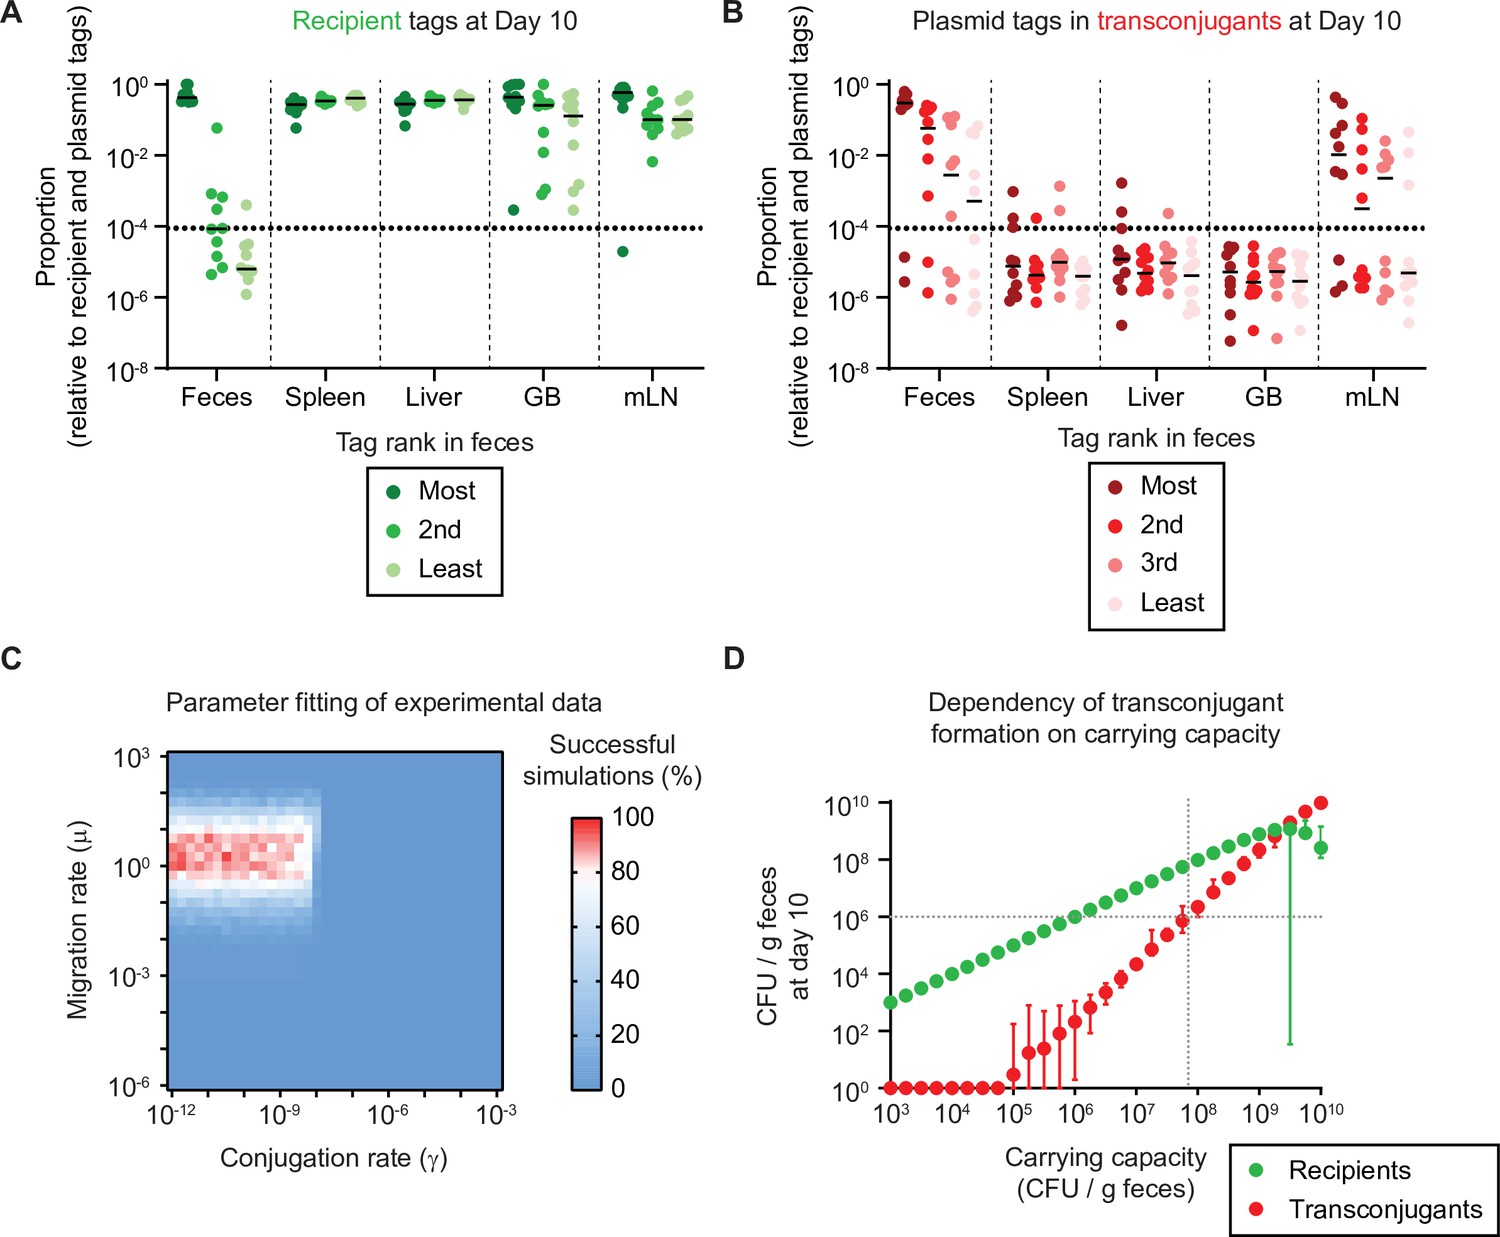
Re-seeding from tissue reservoirs is a rate limiting step that suffices in conjugation and formation of new reservoirs given a sufficient carrying capacity.
(A–B) Mice in Figure 1 where re-seeding of recipients occurred (n = 10) were analysed for the distribution of sequence tags in enrichments of recipients at day 10 of the experiment (including transconjugants) by quantitative PCR (qPCR) (raw tag data shown in Figure 2—figure supplement 1). The dotted line indicates the conservative detection limit. Lines indicate the median. The proportions of tags are plotted relative to all seven tags (three recipient and four plasmid tags). (A) Recipient tags and (B) plasmid tags were sorted according the most abundant recipient or plasmid tag in the feces, in each mouse. GB = gall bladder; mLN = mesenteric lymph node. (C) Fitting of simulations to experimental data. Individual summary statistics used to fit simulations are shown in Figure 2—figure supplement 3. Parameters and method for fitting is described in Supplementary information. The migration rate of µ = 1.78 recipient CFU/g feces per day and the conjugation rate of γ = 3.16 × 10⁻¹¹ events per CFU/g feces per day provide the best fit to the experimental data (red indicates rate pairs that fit the experimental data most often). (D) The migration and conjugation rates were fixed to the most likely values in panel C and the carrying capacity was varied. Recipient (green) and transconjugant (red) populations at the end of the simulation (day 10; n = 100 simulations per carrying capacity) are shown as the mean with the range of values. The lowest value was set to 1 CFU/g feces to allow visualization on a log scale. The grey dotted lines correspond to the carrying capacity at which transconjugants are present at 106 CFU/g feces, as a density threshold that we speculate should facilitate some frequency of invasion into tissue reservoirs.
-
Figure 2—source data 1
Tag frequency data for Figure 2.
- https://cdn.elifesciences.org/articles/69744/elife-69744-fig2-data1-v1.xlsx
Figure 2—figure supplement 1
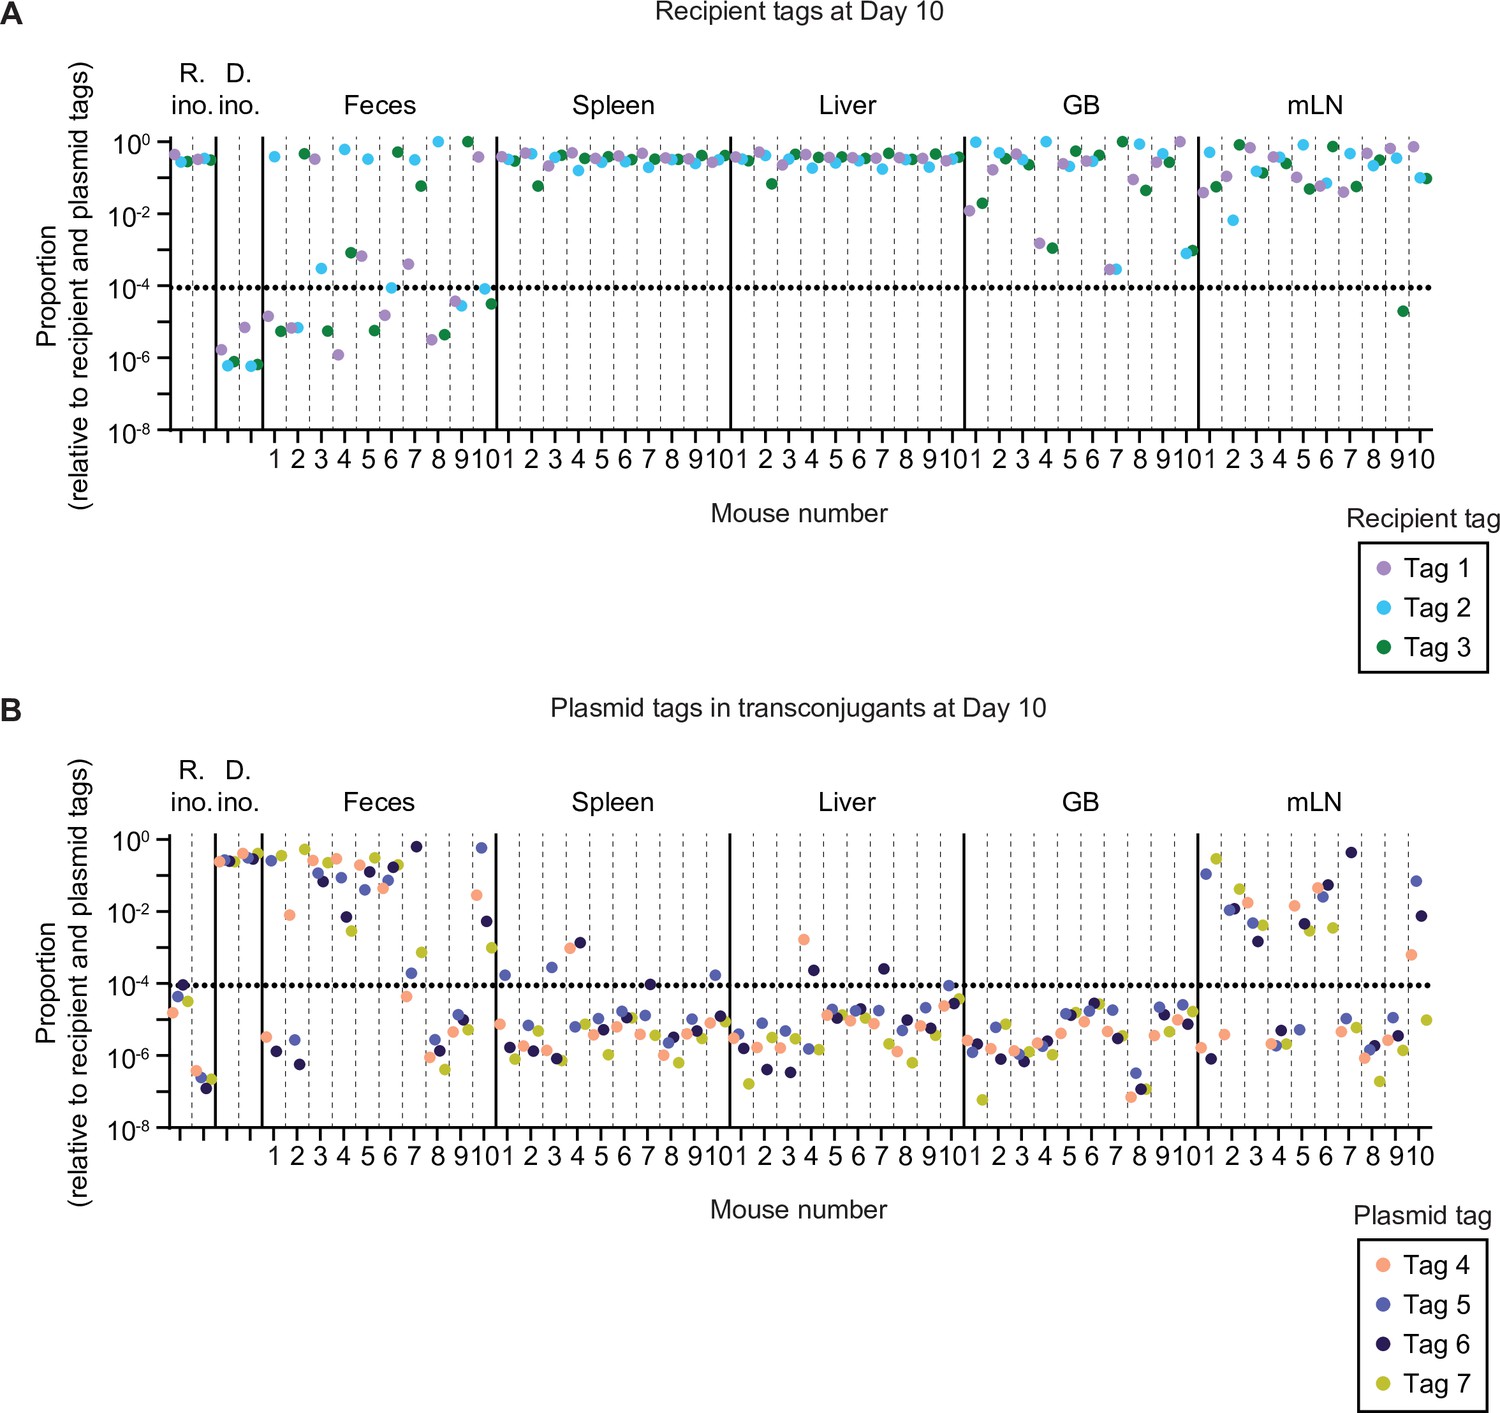
Raw tag proportions before sorting and re-colouring for mice in Figure 2.
Relative tag proportions detected by quantitative PCR (qPCR) in the inocula (R.ino. = recipient inoculum; D. ino. = donor inoculum), the feces, and the organs at day 10 of the experiment. All samples are derived from an enrichment in LB+kanamycin (to enrich for recipients+transconjugants). Each tag is given a unique colour. Mice are separated by vertical dashed lines. Sample groups are separated by vertical solid lines. Dotted line indicates the conservative detection limit. GB = gall bladder; mLN = mesenteric lymph node. (A) Recipient tags. (B) Plasmid tags.
-
Figure 2—figure supplement 1—source data 1
Raw tag frequency data for Figure 2—figure supplement 1.
- https://cdn.elifesciences.org/articles/69744/elife-69744-fig2-figsupp1-data1-v1.xlsx
Figure 2—figure supplement 2
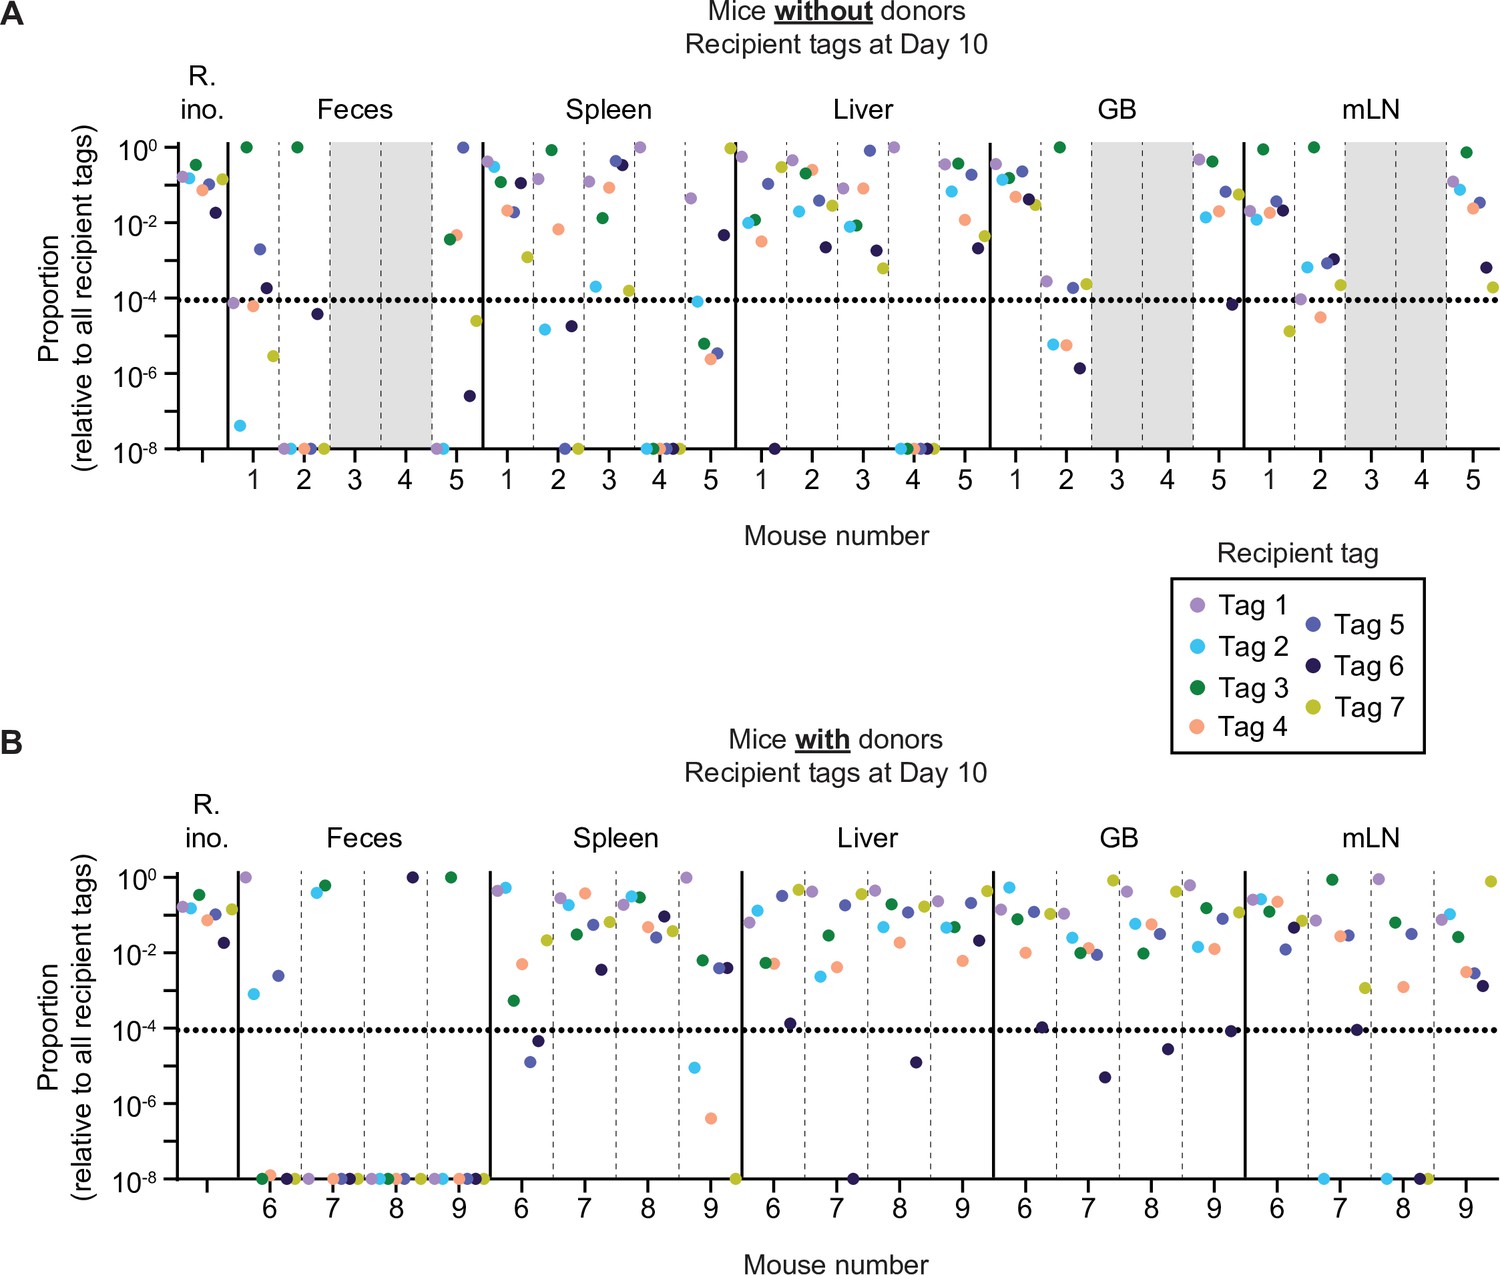
Distribution of tag proportions dependent on the presence or absence of donors.
Further analysis of mice in Figure 1—figure supplement 4. Relative tag proportions detected by quantitative PCR (qPCR) in the inocula (R. ino. = recipient inoculum), the feces, and the organs at day 10 of the experiment. All samples are derived from an enrichment in LB+kanamycin (to enrich for recipients+transconjugants). Each tag is given a unique colour. Mice are separated by vertical dashed lines. Sample groups are separated by vertical solid lines. Dotted line indicates the conservative detection limit. If a tag was not detected or below 10–8, it was set to a proportion of 10–8 for better visualization of tag skew. Grey fill indicates samples where no enrichments could be taken because there were no KanR Salmonella enterica serovar Typhimurium (S.Tm). GB = gall bladder; mLN = mesenteric lymph node. (A) Mice without donors. (B) Mice with donors.
-
Figure 2—figure supplement 2—source data 1
Raw tag frequency data for Figure 2—figure supplement 2.
- https://cdn.elifesciences.org/articles/69744/elife-69744-fig2-figsupp2-data1-v1.xlsx
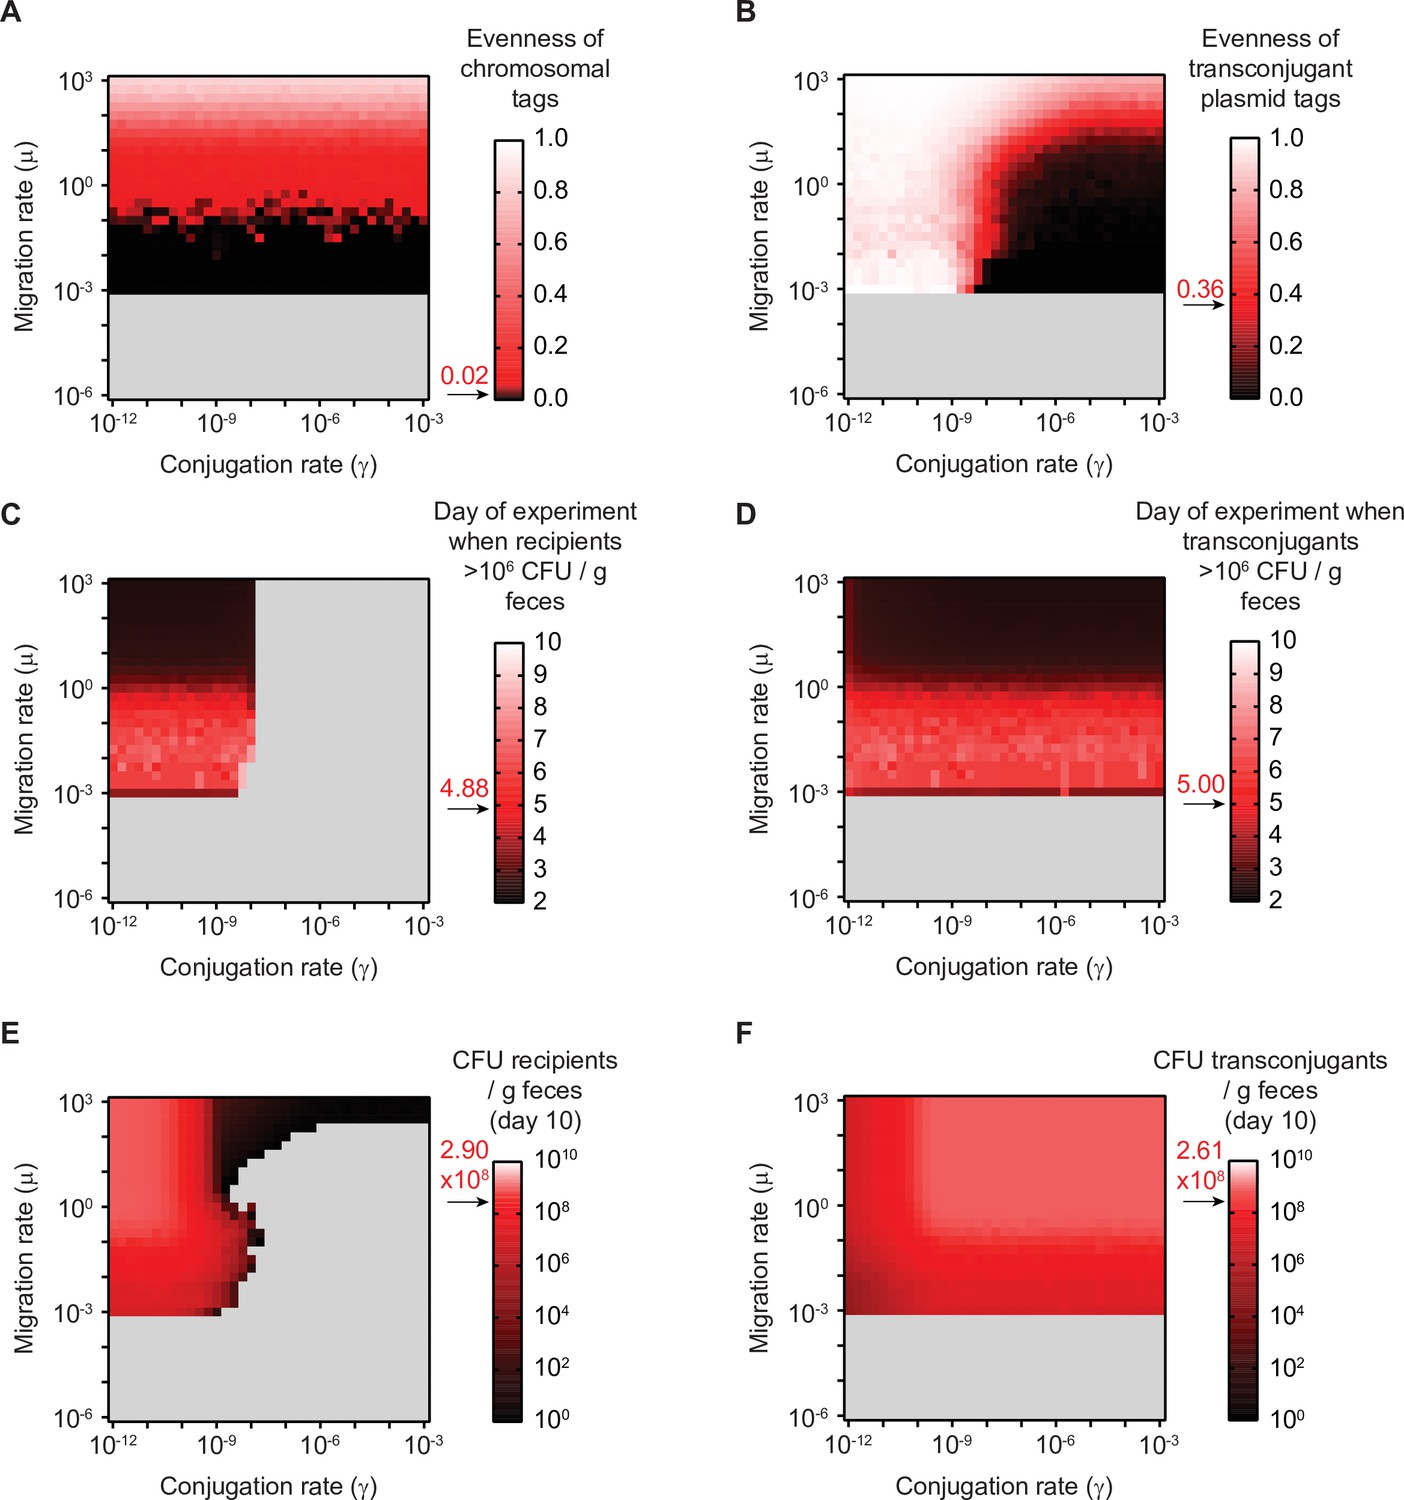
Figure 2—figure supplement 3
Summary statistics used for fitting the mathematical model to the experimental data in Figure 2C.
(A–F) The mathematical model was fit to the experimental data using six metrics (described in the Supplementary information). The values of all six metrics were calculated on the grid of possible migration and conjugation rate pairs. For each metric, the experimentally determined mean is shown in red (an arrow and red text indicates the mean value), and values of simulations that are above the experimental mean are indicated in a gradient towards white, whereas values that are below the experimental mean are indicated in a gradient towards black. Grey fill indicates migration and conjugation rate pairs where the given metric cannot be calculated (e.g. evenness of tags cannot be calculated if re-seeding of recipients into the feces does not occur; the recipient population never reaches appreciable densities if the conjugation rate is too high). (A) Evenness of chromosomal tags in the recipient+transconjugant fecal population at day 10 (experimental mean = 0.0166; SD = 0.0508). (B) Evenness of plasmid tags in the transconjugant fecal population at day 10 (experimental mean = 0.358; SD = 0.282). (C) Days of the experiment (timeline as in Figure 1) until the recipient population exceeds 106 CFU/g feces (experimental mean = 4.875; SD = 1.642). (D) Days of the experiment (timeline as in Figure 1) until the transconjugant population exceeds 106 CFU/g feces (experimental mean = 5.00; SD = 0.926). (E) Recipient population in the feces at day 10 (experimental mean = 2.9 × 10⁸ CFU/g feces; SD = 3.75 × 10⁸ CFU/g feces). (F) Transconjugant population in the feces at day 10 (experimental mean = 2.61 × 10⁸ CFU/g feces; SD = 3.45 × 10⁸ CFU/g feces).
Figure 2—figure supplement 4
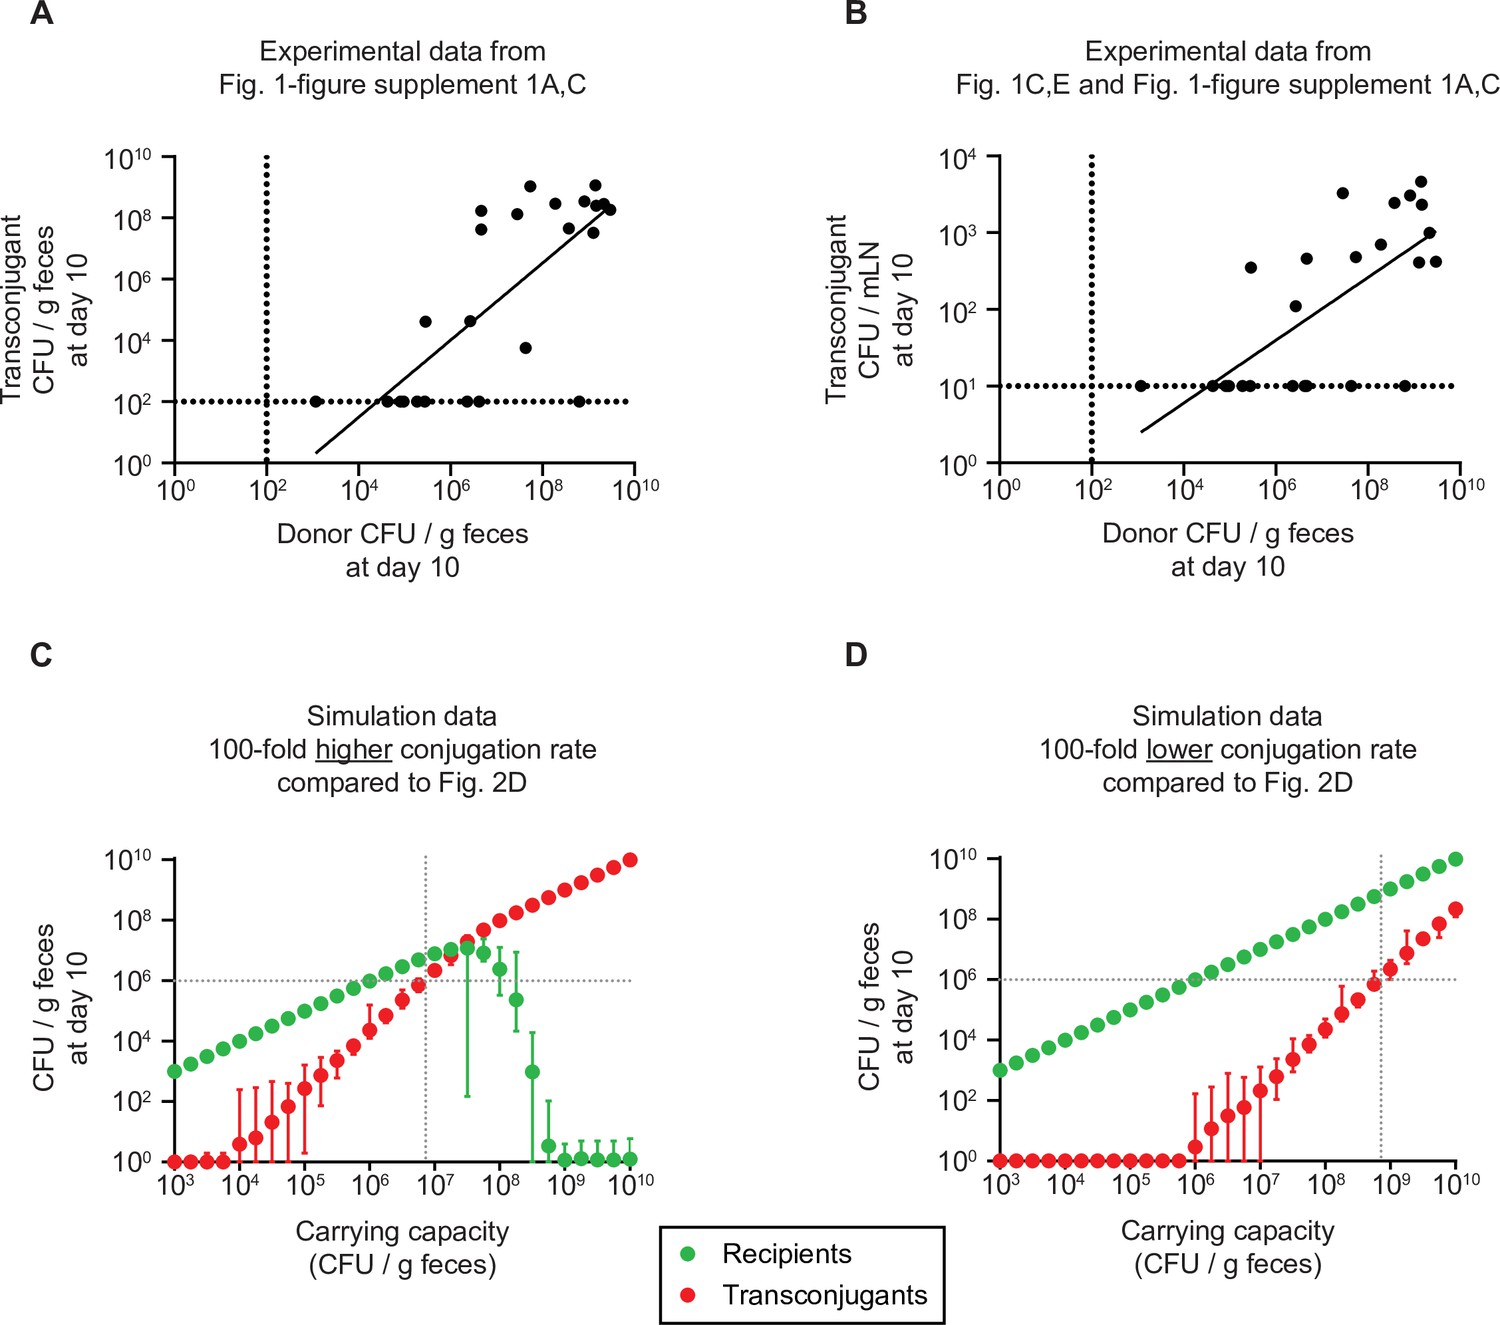
Dependence of recipient and transconjugant population sizes on the carrying capacity with a higher or lower conjugation rate compared to Figure 2D, and correlation with experimental data in Figure 1.
(A–B) Transconjugant invasion increases proportional to the carrying capacity, as a proxy for colonization resistance provided by the microbiota. Correlation of the donor population size at day 10 (as a measure for carrying capacity; either SL1344 Salmonella enterica serovar Typhimurium (S.TmAvir) or Escherichia coli 536; data from Figure 1—figure supplement 1A, C; n=25) to the transconjugant population in the feces (panel A; data from Figure 1—figure supplement 1A,C) or mesenteric lymph node (mLN; panel B; data from Figure 1C, E). Dotted lines indicate the detection limits by selective plating. A line of best fit is shown and a linear regression is performed: (A) R2 = 0.5604; F test determined non-zero slope (p<0.0001); (B) R2 = 0.4913; F test determined non-zero slope (p<0.0001). (C–D) Simulation data. The migration rate was fixed to the most likely values in Figure 2C, but the conjugation rate was fixed to 3.16 × 10⁻⁹, 100-fold higher than in Figure 2D to test the case of a plasmid with a higher conjugation rate (panel C), or fixed to 3.16 × 10⁻¹³, 100-fold lower than in Figure 2D to test the case of a plasmid with a lower conjugation rate (panel D). The carrying capacity was varied. Recipient (green) and transconjugant (red) populations at the end of the simulation (day 10; n = 100 simulations per carrying capacity) are shown as the mean with the range of values. The lowest value was set to 1 CFU/g feces to allow visualization on a log scale. The grey dotted lines correspond to the carrying capacity at which transconjugants are present at 106 CFU/g feces, as a density threshold that we speculate should facilitate some frequency of invasion into tissue reservoirs.
-
Figure 2—figure supplement 4—source data 1
Data used for correlations in Figure 2—figure supplement 4.
- https://cdn.elifesciences.org/articles/69744/elife-69744-fig2-figsupp4-data1-v1.xlsx
Figure 3 with 4 supplements
Newly formed plasmid reservoirs can spread plasmids to recipients after antibiotic treatment and plasmids can accumulate in the gut dependent on tissue reservoirs.
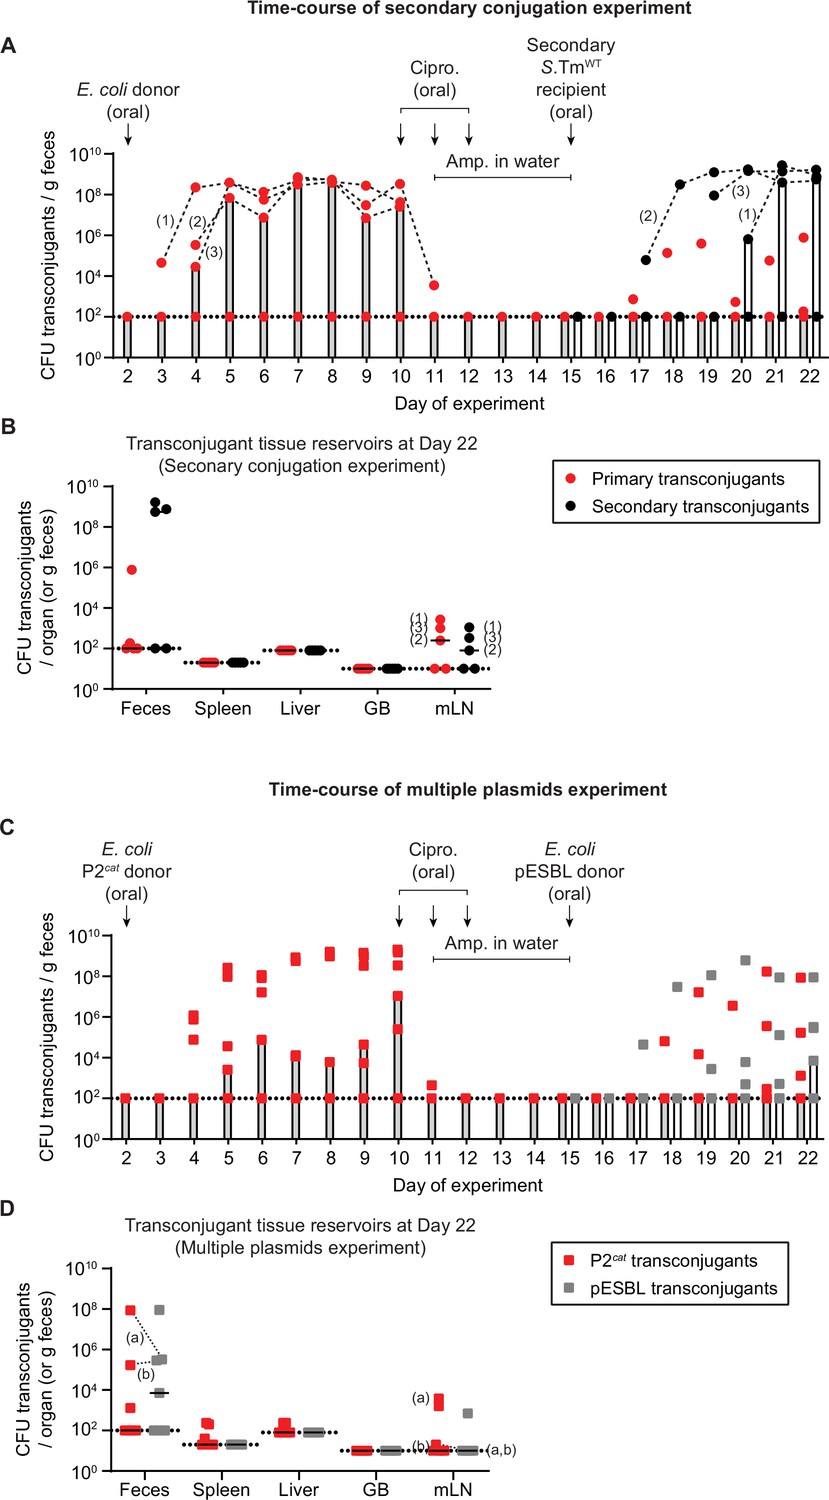
(A) Salmonella enterica serovar Typhimurium (S.Tm) transconjugants can conjugate to secondary recipients after survival of antibiotic treatment, by survival in tissue reservoirs. Mice were i.p. infected with 103 CFU of 14028S SmR TAG1 (KanR; n = 5). On day 2 post infection, 20 mg of streptomycin was given 4 hr before 5 × 10⁷ CFU of Escherichia coli 536 P2cat (CmR). Selective plating and colony colour on MacConkey agar was used to determine the fecal transconjugant loads (red circles). On day 10, mice were given 3 mg ciprofloxacin for 3 days in a row, along with 2 g/l ampicillin in the drinking water from day 11 to 15. On day 15, a secondary recipient (SL1344 ΔP2; AmpR) was added (5 × 10⁷ CFU oral). Selective plating allowed the enumeration of secondary transconjugants (black circles). Bars indicate the median. Dashed black lines connect primary or secondary transconjugant populations of the same mice (mice are numbered 1–3; the same numbering is used in panel B). (B) Tissue reservoirs of S.Tm. Organs of mice in panel A were analysed for primary transconjugants and secondary transconjugants. Lines indicate the median. GB = gall bladder; mLN = mesenteric lymph node. The numbers correspond to the same mouse numbering as in panel A. (C) S.Tm recipients can allow the formation of multiple transconjugants over time dependent on multiple re-seeding events. Mice (n = 7) were i.p. infected with recipients 14028S SmR TAG1 (KanR) and donors E. coli 536 P2cat (CmR) as in panel A. On day 10, mice were given antibiotics as in panel A. On day 15, a second donor, (E. coli pESBL; AmpR) was added (5 × 10⁷ CFU oral). Selective plating allowed the enumeration of both P2cat (red squares) and pESBL transconjugants (grey squares). Bars indicate the median. (D) Tissue reservoirs of S.Tm. Organs of mice in panel C were analysed for P2cat and pESBL transconjugants. Lines indicate the median. GB = gall bladder; mLN = mesenteric lymph node. Dashed lines connect the two transconjugant populations in the same fecal sample (two mice harbor both types of transconjugants: mouse (a) and (b); these mouse labels are also shown on the mLN population). (A–D) Dotted lines indicate the detection limits. Population sizes of all strains and subpopulations are presented in Figure 3—figure supplement 1.
-
Figure 3—source data 1
CFU data for Figure 3.
- https://cdn.elifesciences.org/articles/69744/elife-69744-fig3-data1-v1.xlsx
Figure 3—figure supplement 1
Additional fecal and organ populations for mice in Figure 3.
(A–B) Secondary conjugation experiment (circles); mice in Figure 3A–B. Donors (blue; CmR), primary recipients (green; KanR), primary transconjugants (red; CmR and KanR), secondary recipients (beige; AmpR), and secondary transconjugants (black; AmpR and CmR) were enumerated by selective and/or replica plating on MacConkey agar. (B) Organs of mice in panel A were analysed for population sizes of donors, recipients, and transconjugants. (C–D) Multiple plasmids experiment (squares); mice in Figure 3C–D. P2cat donors (blue; CmR), recipients (green; KanR), P2cat transconjugants (red; CmR and KanR), pESBL donors (purple; AmpR), and pESBL transconjugants (grey; AmpR and KanR) were enumerated by selective and/or replica plating on MacConkey agar. (D) Organs of mice in panel A were analysed for population sizes of donors, recipients, and transconjugants. (A,C) The black dotted lines represent the detection limits for transconjugants and donors. The green dotted lines represent the detection limits for recipients. The detection limit is higher for recipients once the density of bacteria reaches >108 CFU/g feces (because of the limit of colonies on a plate for replica plating). Before this happens, recipient populations can appear below this line (then the black dotted line is the detection limit). Lines of colour connect medians between days. (B,D) Lines indicate medians. Dotted line indicates the detection limit. GB = gall bladder; mLN = mesenteric lymph node.
-
Figure 3—figure supplement 1—source data 1
CFU data for Figure 3—figure supplement 1.
- https://cdn.elifesciences.org/articles/69744/elife-69744-fig3-figsupp1-data1-v1.xlsx
Figure 3—figure supplement 2
Control that Escherichia coli donors are not detected in tissue reservoirs after antibiotic treatment.
Mice (n=5) were i.p. infected with 103 CFU of 14028S SmR TAG1 recipients (KanR) and 5×10⁷ CFU of E. coli 536 P2cat donors (CmR) as in Figure 3. Selective plating and colony colour on MacConkey agar was used to determine population sizes of donors (blue), recipients (green), and transconjugants (red; CmR and KanR). On day 10, mice were given 3 mg ciprofloxacin for 3 days in a row, along with 2 g/l ampicillin in the drinking water from day 11 to 15. (A) Fecal population sizes. The black dotted lines represent the detection limits for transconjugants and donors. The green dotted lines represent the detection limits for recipients. The detection limit is higher for recipients once the density of bacteria reaches >108 CFU/g feces (because of the limit of colonies on a plate for replica plating). Before this happens, recipient populations can appear below this line (then the black dotted line is the detection limit). Lines of colour connect medians between days. (B) Organs of mice in panel A were analysed for population sizes of donors, recipients, and transconjugants. Lines indicate medians. Dotted line indicates the detection limit. GB = gall bladder; mLN = mesenteric lymph node.
-
Figure 3—figure supplement 2—source data 1
CFU data for Figure 3—figure supplement 2.
- https://cdn.elifesciences.org/articles/69744/elife-69744-fig3-figsupp2-data1-v1.xlsx
Figure 3—figure supplement 3
Further control experiment to determine that Escherichia coli 536 cannot form persister reservoirs in host tissues.
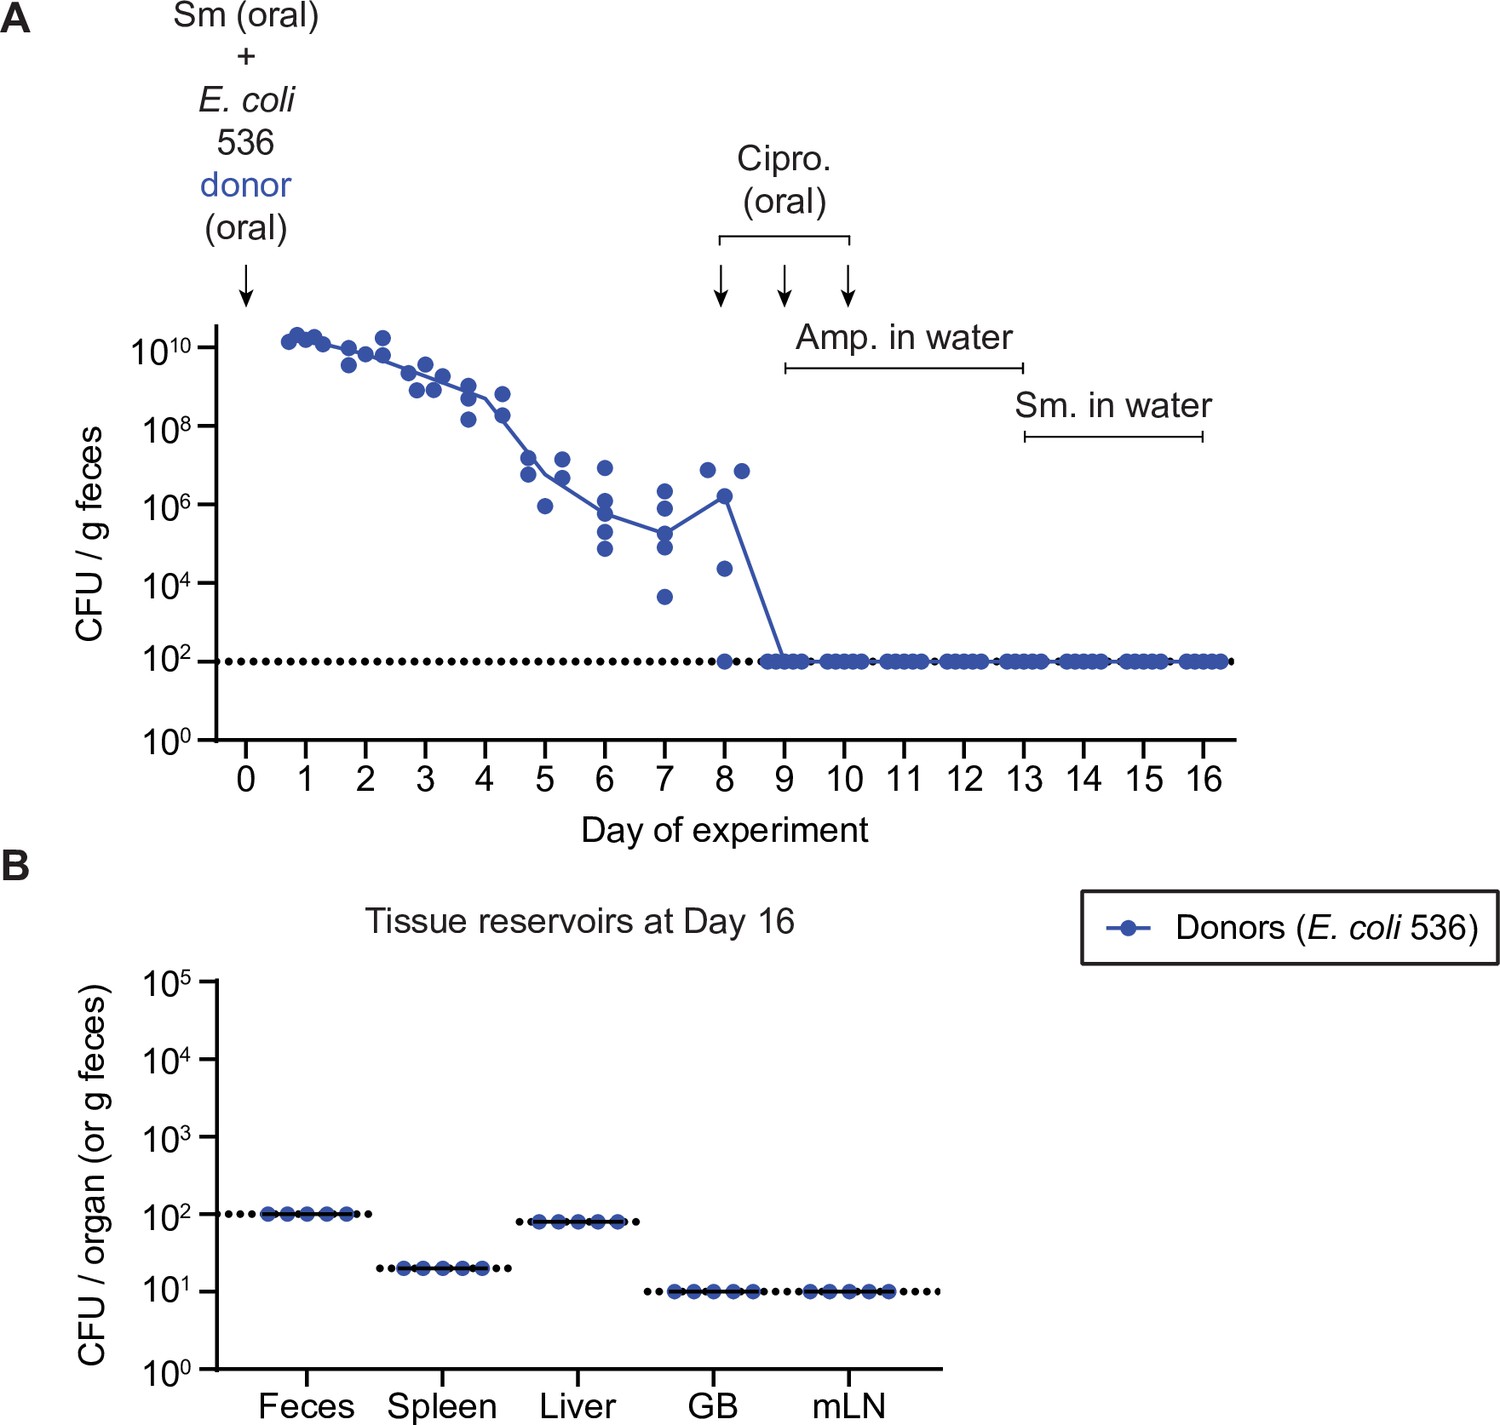
Mice (n=5) were streptomycin treated (20 mg oral dose) 4 hr before oral gavage of 5×10⁷ CFU of E. coli 536 P2cat donors (CmR). On day 8, mice were given 3 mg ciprofloxacin for 3 days in a row, along with 2 g/l ampicillin in the drinking water from day 9 to 13. This protocol follows the same treatment regime as in Figure 3 relative to the colonization time of the E. coli 536 donors. Mice were switched to streptomycin drinking water (1 g/l) from day 13 to 16 to select for any remaining E. coli 536 until the end of the experiment. (A) Selective plating was used to determine fecal population sizes of E. coli 536. Lines connect medians. (B) Tissue reservoirs were analysed by selective plating on day 16 of the experiment. GB = gall bladder; mLN = mesenteric lymph node. Lines indicate the median. (A–B) Dotted lines indicate the detection limit.
-
Figure 3—figure supplement 3—source data 1
CFU data for Figure 3—figure supplement 3.
- https://cdn.elifesciences.org/articles/69744/elife-69744-fig3-figsupp3-data1-v1.xlsx
Figure 3—figure supplement 4
Conjugation is not detectable within host tissue reservoirs.
Mice (n=5) were i.p. infected with both SL1344 P2cat donors (blue) and 14,028S SmR recipients (KanR; green) sequentially (5 min apart; ~103 CFU total). On day 3, mice were euthanized, and tissue reservoirs were analysed for transconjugant formation (red). Dotted lines indicate the detection limit by selective plating. Lines indicate media.
-
Figure 3—figure supplement 4—source data 1
CFU data for Figure 3—figure supplement 4.
- https://cdn.elifesciences.org/articles/69744/elife-69744-fig3-figsupp4-data1-v1.xlsx
Figure 4 with 1 supplement
Re-seeding of Salmonella enterica serovar Typhimurium (S.Tm) followed by reception of a plasmid and storage in new tissue reservoirs can occur under beta-lactam counterselection, dependent on Escherichia coli conjugative extended spectrum beta-lactamases (ESBL) plasmids.
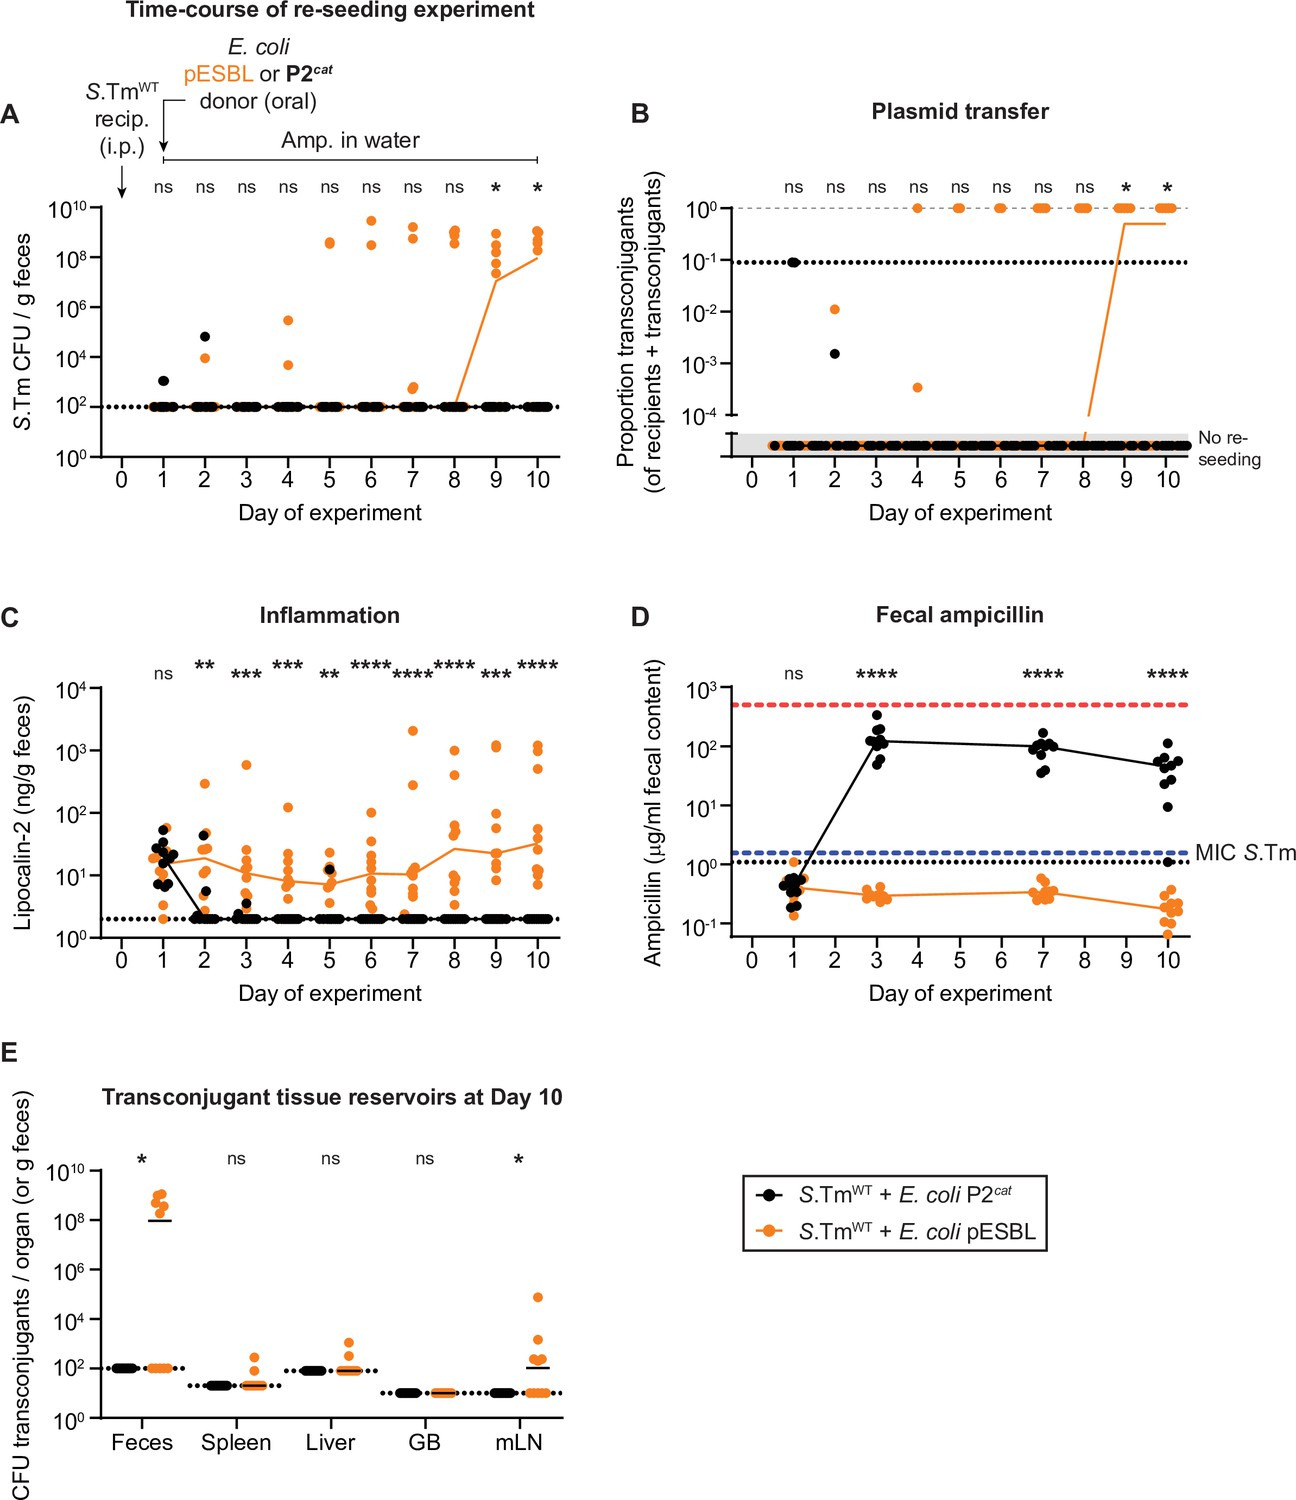
(A–E) Mice were i.p. infected with 103 CFU of a 1:1:1:1:1:1:1 mix of 14028S SmR TAG1-7 (KanR). On day 1 post infection, mice were given 0.5 g/l ampicillin in the drinking water and either 5 × 10⁷ CFU of E. coli P2cat (CmR; black circles; n = 10) or E. coli pESBL (AmpR; orange circles; n = 10). Dotted lines indicate detection limits. Lines connect medians on each day. A two-tailed Mann-Whitney U-test was used to compare S.TmWT+ E. coli. coli P2cat to S.TmWT+ E. coli. coli P2cat in each sample (p > 0.05 not significant (ns), p < 0.05 (*), p < 0.01 (**), p < 0.001 (***), p < 0.0001 (****)). (A) Re-seeding S.Tm was analysed by selective plating on kanamycin-containing MacConkey agar. (B) Conjugation was determined by selective and/or replica plating. The proportion transconjugants is calculated by the population size of transconjugants divided by the sum of both transconjugants and recipients. The grey dashed line indicates a proportion of 1. The dotted line indicates the conservative detection limit for transconjugants (since the proportion depends on the recipient population size), each sample has a different detection limit and therefore values can appear below the detection limit. Values in the grey box in the lower part of the y-axis are plotted to indicate mice with no re-seeding. (C) Inflammation was quantified using an ELISA for fecal lipocalin-2. (D) Fecal ampicillin was measured using mass spectrometry. The blue dashed line indicates the minimum inhibitory concentration of S.Tm in vitro (Bakkeren et al., 2019). The red dashed line indicates the concentration of ampicillin given to the mice in the drinking water. (E) Organs were analysed for transconjugant populations on day 10 of the experiment. GB = gall bladder; mLN = mesenteric lymph node.
-
Figure 4—source data 1
CFU, LCN2 ELISA, and ampicillin quantification data for Figure 4.
- https://cdn.elifesciences.org/articles/69744/elife-69744-fig4-data1-v1.xlsx
Figure 4—figure supplement 1
Escherichia coli population sizes and total Salmonella enterica serovar Typhimurium (S.Tm) population sizes in tissue reservoirs of mice in Figure 4.
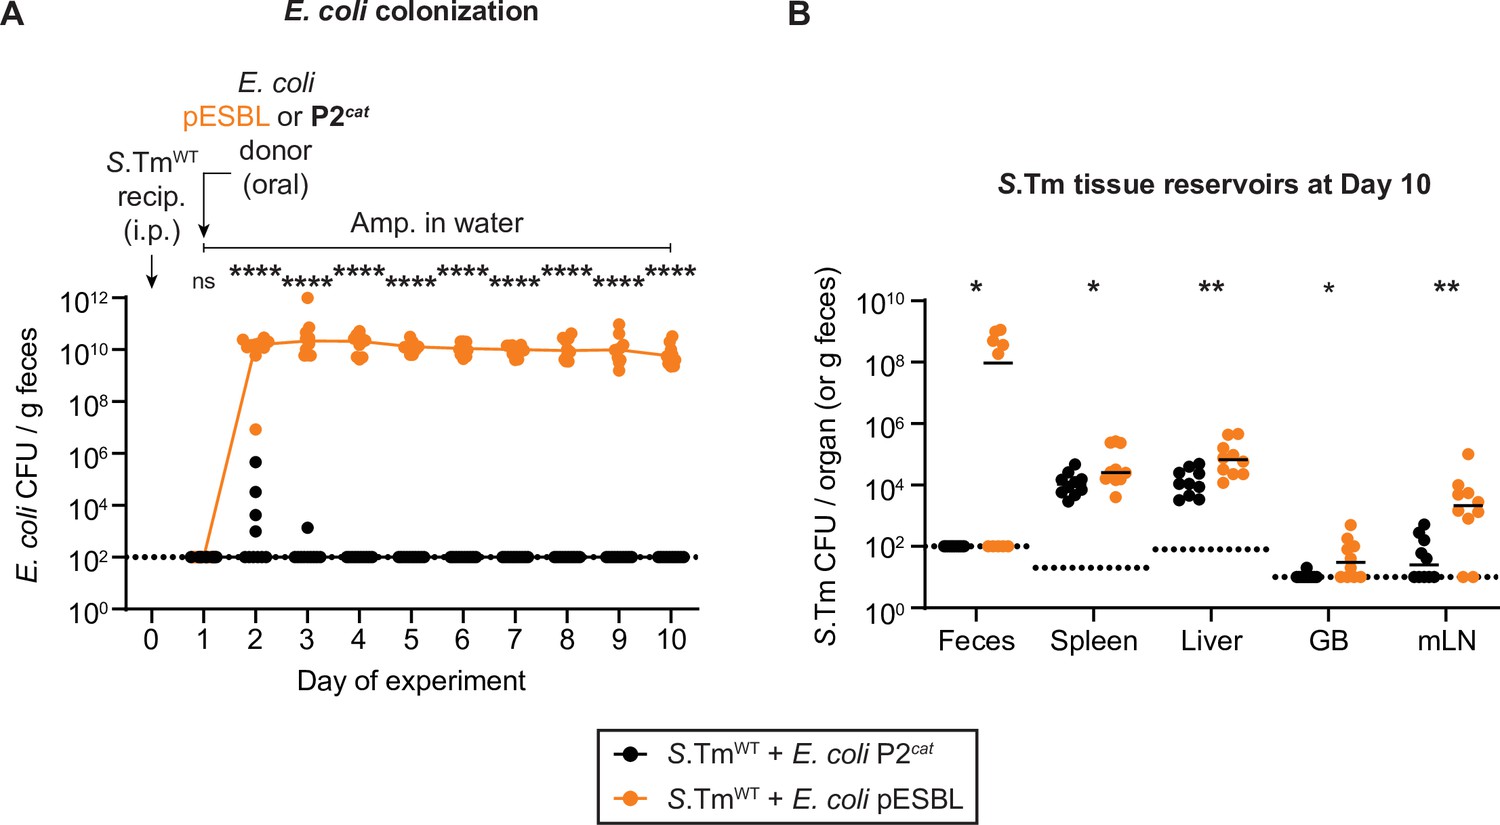
(A) E. coli P2cat (CmR) and E. coli pESBL (AmpR) populations were enumerated by selective plating and colour on MacConkey agar. Coloured lined connect medians. (B) Total S.Tm populations (KanR) in organs were determined by selective plating on kanamycin MacConkey agar. GB = gall bladder; mLN = mesenteric lymph node. Lines indicate the media. (A–B) A two-tailed Mann-Whitney U-test was used to compare S.TmWT + E. coli. coli P2cat (black; n=10) to S.TmWT + E. coli. coli P2cat (orange; n=10) in each sample (p>0.05 not significant (ns), p<0.05 (*), p<0.01 (**), p<0.0001 (****)). Dotted lines indicate the detection limits.
-
Figure 4—figure supplement 1—source data 1
CFU data for Figure 4—figure supplement 1.
- https://cdn.elifesciences.org/articles/69744/elife-69744-fig4-figsupp1-data1-v1.xlsx
Figure 5
Working model for how the infection cycle of Salmonella enterica serovar Typhimurium (S.Tm) may promote the spread and accumulation of plasmids within a host.
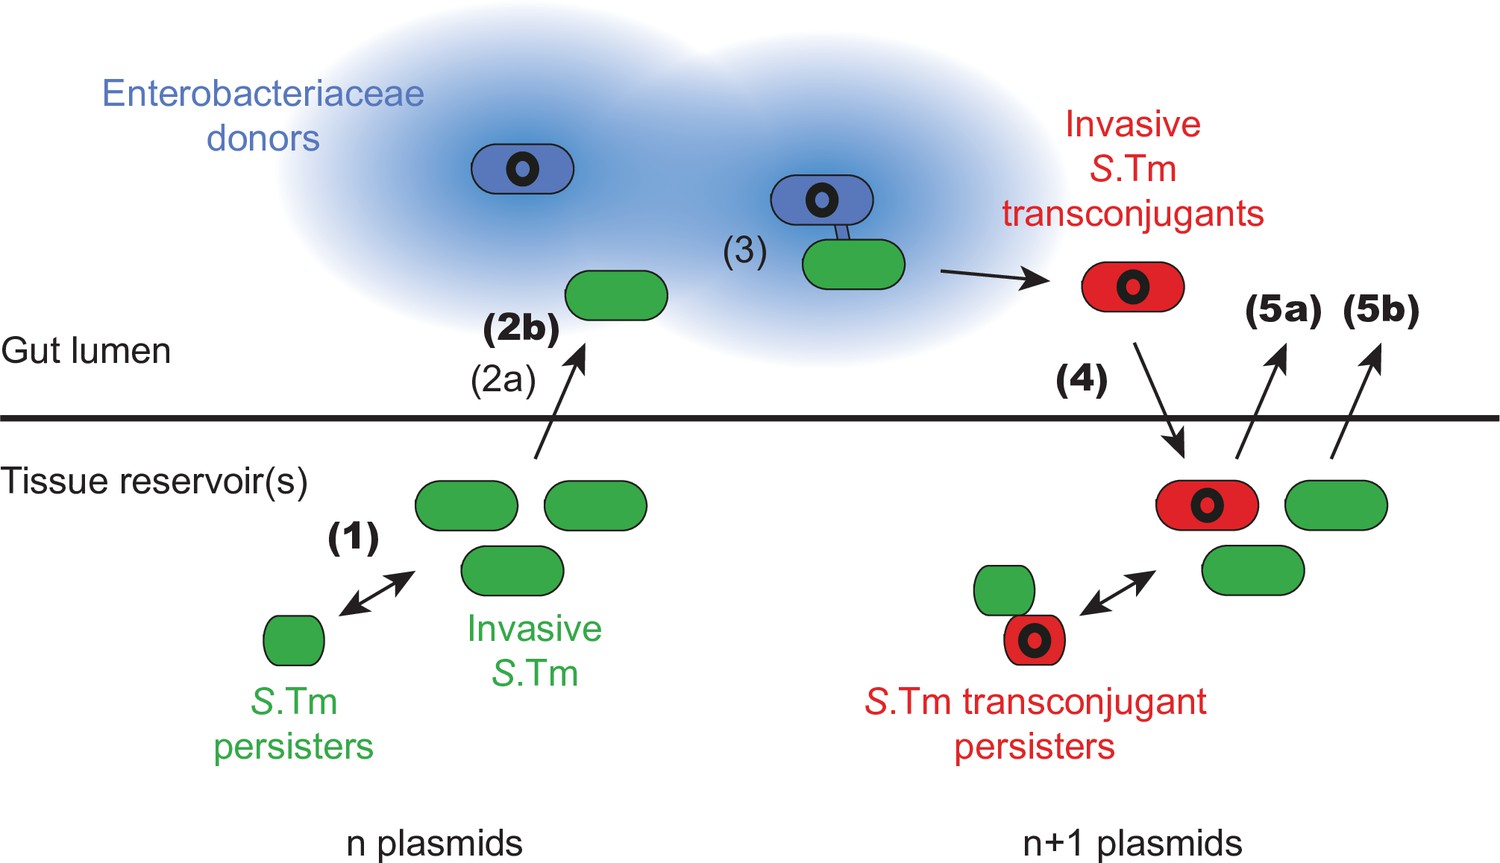
Invasive S.Tm (green for recipients, red for transconjugants) can establish reservoirs within host tissues, storing their current plasmid complement in these reservoirs (n plasmids). A subpopulation of these cells can survive antibiotic treatment as persisters (smaller green or red cells), which can regrow after the withdrawal of antibiotics. In extension to previous work (Bakkeren et al., 2019), here we show that reservoirs of S.Tm that chronically infect the host can re-seed from host tissues, even in the absence of selection for persisters (step 1). Exiting the host tissues into the gut lumen is a rate-limiting process (step 2a; Bakkeren et al., 2019). This process can be facilitated by Enterobacteriaceae donors (blue; plasmid shown in black) that produce extracellularly acting plasmid-encoded antibiotic resistance genes (such as beta-lactamases; blue colour radiating from the cell indicates local degradation of beta-lactam antibiotics by beta-lactamases), which can allow the local survival of re-seeding recipients under antibiotic treatment (step 2b). Once both donors and recipients co-occur in the gut lumen at sufficient density, plasmid transfer proceeds (step 3; Bakkeren et al., 2019; Benz et al., 2021; Diard et al., 2017; Moor et al., 2017; Stecher et al., 2012; Wotzka et al., 2019). When colonization resistance is relaxed, invasive transconjugants (red) can reach sufficient densities to invade back into host tissues and form new reservoirs that now contain n + 1 plasmids (step 4). In the tissue, transconjugant subpopulations can also survive antibiotic therapy as persisters (smaller red cells). This process is repeatable in certain conditions. Either transconjugants can re-seed to donate the plasmid to further gut luminal recipients (step 5a), or recipients can re-seed to receive an additional plasmids (step 5b). Novel steps of this process, demonstrated here using the streptomycin treatment mouse model, are indicated with bold numbers, whereas steps that have been previously shown are indicated with non-bold numbers (and key references are listed in the caption).
Tables
Key resources table
| Reagent type (species) or resource | Designation | Source or reference | Identifiers | Additional information |
|---|---|---|---|---|
| Strain, strain background (Mus musculus) | 129S6/SvEvTac | Taconic Biosciences | RRID:IMSR_TAC:129sve | Wild-type mouse; specified opportunistic pathogen-free mice bred under hygienic conditions in the ETH Phenomics Center |
| Strain, strain background (Salmonella enterica serovar Typhimurium) | SL1344 | Hoiseth and Stocker, 1981 | Derivatives of this strain used in this study are listed in Table 1 | |
| Strain, strain background (Salmonella enterica serovar Typhimurium) | ATCC 14028S | Jarvik et al., 2010 | Derivatives of this strain used in this study are listed in Table 1 | |
| Strain, strain background (Escherichia coli) | E. coli 536 | Berger et al., 1982; Brzuszkiewicz et al., 2006 | Derivatives of this strain used in this study are listed in Table 1 | |
| Strain, strain background (Escherichia coli) | E. coli ESBL15 | Bakkeren et al., 2019; Tschudin-Sutter et al., 2016 | Derivatives of this strain used in this study are listed in Table 1 | |
| Recombinant DNA reagent | TAG1-7 CmR or KanR | Grant et al., 2008 | Barcodes used for population dynamics analyses | |
| Recombinant DNA reagent | P2cat | Stecher et al., 2012 | Conjugative plasmid labelled with chloramphenicol resistance | |
| Sequence-based reagents | RT-qPCR primers | Grant et al., 2008 | See Table 3 | |
| Sequence-based reagents | PCR primers for strain construction and validation | This study; Bakkeren et al., 2021a | See Table 3 | |
| Software, algorithm | GraphPad Prism | GraphPad Prism (https://graphpad.com) | RRID:SCR_015807 | Version 8 for Windows |
| Software, algorithm | R Project for Statistical Computing | https://www.r-project.org/ | RRID:SCR_001905 |
Table 1
Strains used in this study.
| Strain name | Strain number | Relevant genotype | Resistance* | Reference |
|---|---|---|---|---|
| SL1344 | SB300 | Wild-type | Sm | Hoiseth and Stocker, 1981 |
| ATCC 14028S | 14028S | Wild-type | None | Jarvik et al., 2010 |
| SL1344 P2cat | M995 | cat on P2 | Sm, Cm | Stecher et al., 2012 |
| SL1344 ΔP2 | M1404 | P2 cured | Sm | Stecher et al., 2012 |
| E. coli 536 | Z2366 | Wild-type | Sm | Berger et al., 1982; Brzuszkiewicz et al., 2006 |
| E. coli 536 P2cat | Z2124 | cat on P2 | Sm, Cm | This study |
| SL1344 ΔP2 pM975 | Z2287 | P2 cured; bla | Sm, Amp | This study |
| E. coli ESBL15 | Z2115 | CTX-M1 on pESBL | Amp | Bakkeren et al., 2019; Tschudin-Sutter et al., 2016 |
| 14028S SmR | T186 | strAB on P3 | Sm | This study |
| 14028S SmR TAG1 | Z2279 | WITS1-aphT | Sm, Kan | This study |
| 14028S SmR TAG2 | Z2281 | WITS2-aphT | Sm, Kan | This study |
| 14028S SmR TAG3 | Z2283 | WITS11-aphT | Sm, Kan | This study |
| 14028S SmR TAG4 | T270 | WITS13-aphT | Sm, Kan | This study |
| 14028S SmR TAG5 | T272 | WITS17-aphT | Sm, Kan | This study |
| 14028S SmR TAG6 | T274 | WITS19-aphT | Sm, Kan | This study |
| 14028S SmR TAG7 | T276 | WITS21-aphT | Sm, Kan | This study |
| 14028SSPI-2 SmR | T284 | ssaV::aphT | Sm, Kan | This study |
| SL1344Avir P2TAG4 | Z2292 | WITS13-cat on P2; ΔinvG ΔssaV | Sm, Cm | This study |
| SL1344Avir P2TAG5 | Z2293 | WITS17-cat on P2; ΔinvG ΔssaV | Sm, Cm | This study |
| SL1344Avir P2TAG6 | Z2294 | WITS19-cat on P2; ΔinvG ΔssaV | Sm, Cm | This study |
| SL1344Avir P2TAG7 | Z2295 | WITS21-cat on P2; ΔinvG ΔssaV | Sm, Cm | This study |
| E. coli ΔpESBL | Z2156 | pESBL cured | None | This study |
| E. coli ΔpESBL P2cat | T305 | pESBL cured; cat on P2 | Cm | This study |
| 14028SSPI-1 SmR | T2429 | invG::aphT | Sm, Kan | This study |
-
*
Relevant resistances only: Sm = ≥50 µg/ml streptomycin; Cm = ≥15 µg/ml chloramphenicol; Kan = ≥50 µg/ml kanamycin; Amp = ≥100 µg/ml ampicillin.
Table 2
Plasmids used in this study.
| Plasmid name | Relevant genotype | Resistance | Reference |
|---|---|---|---|
| pM975 | bla; used to confer ampicillin resistance | Amp | Hapfelmeier et al., 2005 |
| pCP20 | FLP recombinase | Amp, Cm | Datsenko and Wanner, 2000 |
| pCP20-IncI1 (pZ2496) | FLP-bla::IncI1 replicon | Cm | This study |
| P3 (pRSF1010) | strAB | Sm | Kroger et al., 2012 |
| P2 (pCol1b9) | Wild-type | None | Stecher et al., 2012 |
| P2cat | cat | Cm | Stecher et al., 2012 |
| P2TAG | WITS13, 17, 19,or 21-cat on P2 | Cm | Bakkeren et al., 2019 |
| pESBL (pESBL15) | CTX-M-1 | Amp | Bakkeren et al., 2019; Tschudin-Sutter et al., 2016 |
Table 3
Primers used in this study.
| Primer name | Sequence (5' to 3') | Purpose | Reference |
|---|---|---|---|
| ESBL15_repl_gibs_for | GCC AGT TAA TAG TTT GCG CAA CGT TGT TGC CAT TGC TGC ACT GAG CTA CCA TAG ATG AC | PCR amplification of IncI1 replicon from pEBSL for Gibson assembly | This study |
| ESBL15_repl_gibs_rev | TAC AAT TAT TCC TTA CTA TGG ACA AAA ACA TCA ATC TGA T GTG GTT TCA GAA CGG TGA G | PCR amplification of IncI1 replicon from pEBSL for Gibson assembly | This study |
| ESBL15_ori_ver_up | CCA GTT AAT AGT TTG CGC AAC | Validation of pCP20-IncI1 cloning | This study |
| ESBL15_ori_intl_ rev | CTT TCA GCG CTT TAT AGC G | Validation of pCP20-IncI1 cloning | This study |
| ESBL15_ori_intl_for | CTG TTC CGA TGA CCA TCT G | Validation of pCP20-IncI1 cloning | This study |
| ESBL15_ori_ver_dw | CTC CAG TTT AAA TAC AAG ACG | Validation of pCP20-IncI1 cloning | This study |
| ssaV-137F | GCAGCGTTCCA GGGTATTCC | Verification of ΔssaV in the chromosome | Bakkeren et al., 2021a |
| ssaV +155 R | CAGCAAGTTCT TCTCCAGGC | Verification of ΔssaV in the chromosome | Bakkeren et al., 2021a |
| invG-134F | GAAGGCCACGA GAACATCAC | Verification of ΔinvG in the chromosome | Bakkeren et al., 2021a |
| invG +112 R | GCGGCCTGTT GTATTTCCGC | Verification of ΔinvG in the chromosome | Bakkeren et al., 2021a |
| P3_SmR_for | CTA GTA TGA CGT CTG TCG C | Verification of P3 | This study |
| P3_SmR_rev | CAC GTT TCG CAA CCT GTT C | Verification of P3 | This study |
| WITS1 | ACG ACA CCA CTC CAC ACC TA | qPCR for TAG1 | Grant et al., 2008 |
| WITS2 | ACC CGC AAT ACC AAC AAC TC | qPCR for TAG2 | Grant et al., 2008 |
| WITS11 | ATC CCA CAC ACT CGA TCT CA | qPCR for TAG11 | Grant et al., 2008 |
| WITS13 | GCT AAA GAC ACC CCT CAC TCA | qPCR for TAG13 | Grant et al., 2008 |
| WITS17 | TCA CCA GCC CAC CCC CTC A | qPCR for TAG17 | Grant et al., 2008 |
| WITS19 | GCA CTA TCC AGC CCC ATA AC | qPCR for TAG19 | Grant et al., 2008 |
| WITS21 | ACA ACC ACC GAT CAC TCT CC | qPCR for TAG21 | Grant et al., 2008 |
| ydgA | GGC TGT CCG CAA TGG GTC | qPCR for all tags | Grant et al., 2008 |
| pagJ_fwd | ATC TTC GGG GAA GGG CAC GTC CG | 14028S chromosome-specific PCR | This study |
| pagJ_rev | GCT GTA ACC GTA AGG ATA GTG TGC CAC AAT T | 14028S chromosome-specific PCR | This study |
| cat_fwd | GCATTTCAGTCA GTTGCTCAATGT ACCTATAACC | P2cat-specific PCR | This study |
| cat_rev | CGACATGGAAGC CATCACAAACGG | P2cat-specific PCR | This study |
Appendix 1—table 1
Parameter values used in the simulations.
| Parameter | Function | Value | Units |
|---|---|---|---|
| r | Birth-rate | 44 ln(2) | Per day |
| c | Clearance-rate | 4 ln(2) | Per day |
| Residual birth-rate at carrying capacity | 4 ln(2) | Per day | |
| K = KD/RT | Carrying capacity | 109 | CFU/g feces |
| D0 | Size of the donor inoculum | 107 | CFU/g feces |
| Ni | Number of distinguishable chromosomal tags | 3 | Dimensionless |
| Nj | Number of distinguishable plasmid tags | 4 | Dimensionless |
| μ | Re-seeding rate of recipients from systemic sites | Uniform on the discrete grid 10–6 – 103 in 0.25 log increments | CFU/g feces per day |
| γ = γD/T | The rate of conjugation from donors or transconjugants per mating pair | Uniform on the discrete grid 10–12 – 10–3 in 0.25 log increments | Per CFU/g feces per day |
Appendix 1—table 2
Parameter estimates.
| Simulation | Maximum likelihood(μ,γ) pair | μ Value from the marginal posterior distribution | γ Value from the marginal posterior distribution |
|---|---|---|---|
| Main text (Figure 2C) | μ = 1.78 (CFU/g feces per day)γ = 3.16 × 10⁻¹¹ (per CFU/g feces per day) | 7.1 (CFU/g feces per day)HPD: [0.03, 31.6] | 9.36 × 10⁻¹⁰ (per CFU/g feces per day)HPD: [1 × 10–12, 5.6 × 10⁻⁹] |
-
HPD: Highest posterior density interval.
Additional files
Download links
A two-part list of links to download the article, or parts of the article, in various formats.
Downloads (link to download the article as PDF)
Open citations (links to open the citations from this article in various online reference manager services)
Cite this article (links to download the citations from this article in formats compatible with various reference manager tools)
Pathogen invasion-dependent tissue reservoirs and plasmid-encoded antibiotic degradation boost plasmid spread in the gut
eLife 10:e69744.
https://doi.org/10.7554/eLife.69744


