Sex differences in learning from exploration
- Department of Psychology, University of Minnesota, United States
- Department of Neurosciences, University of Montreal, Canada
Figures
Figure 1 with 2 supplements
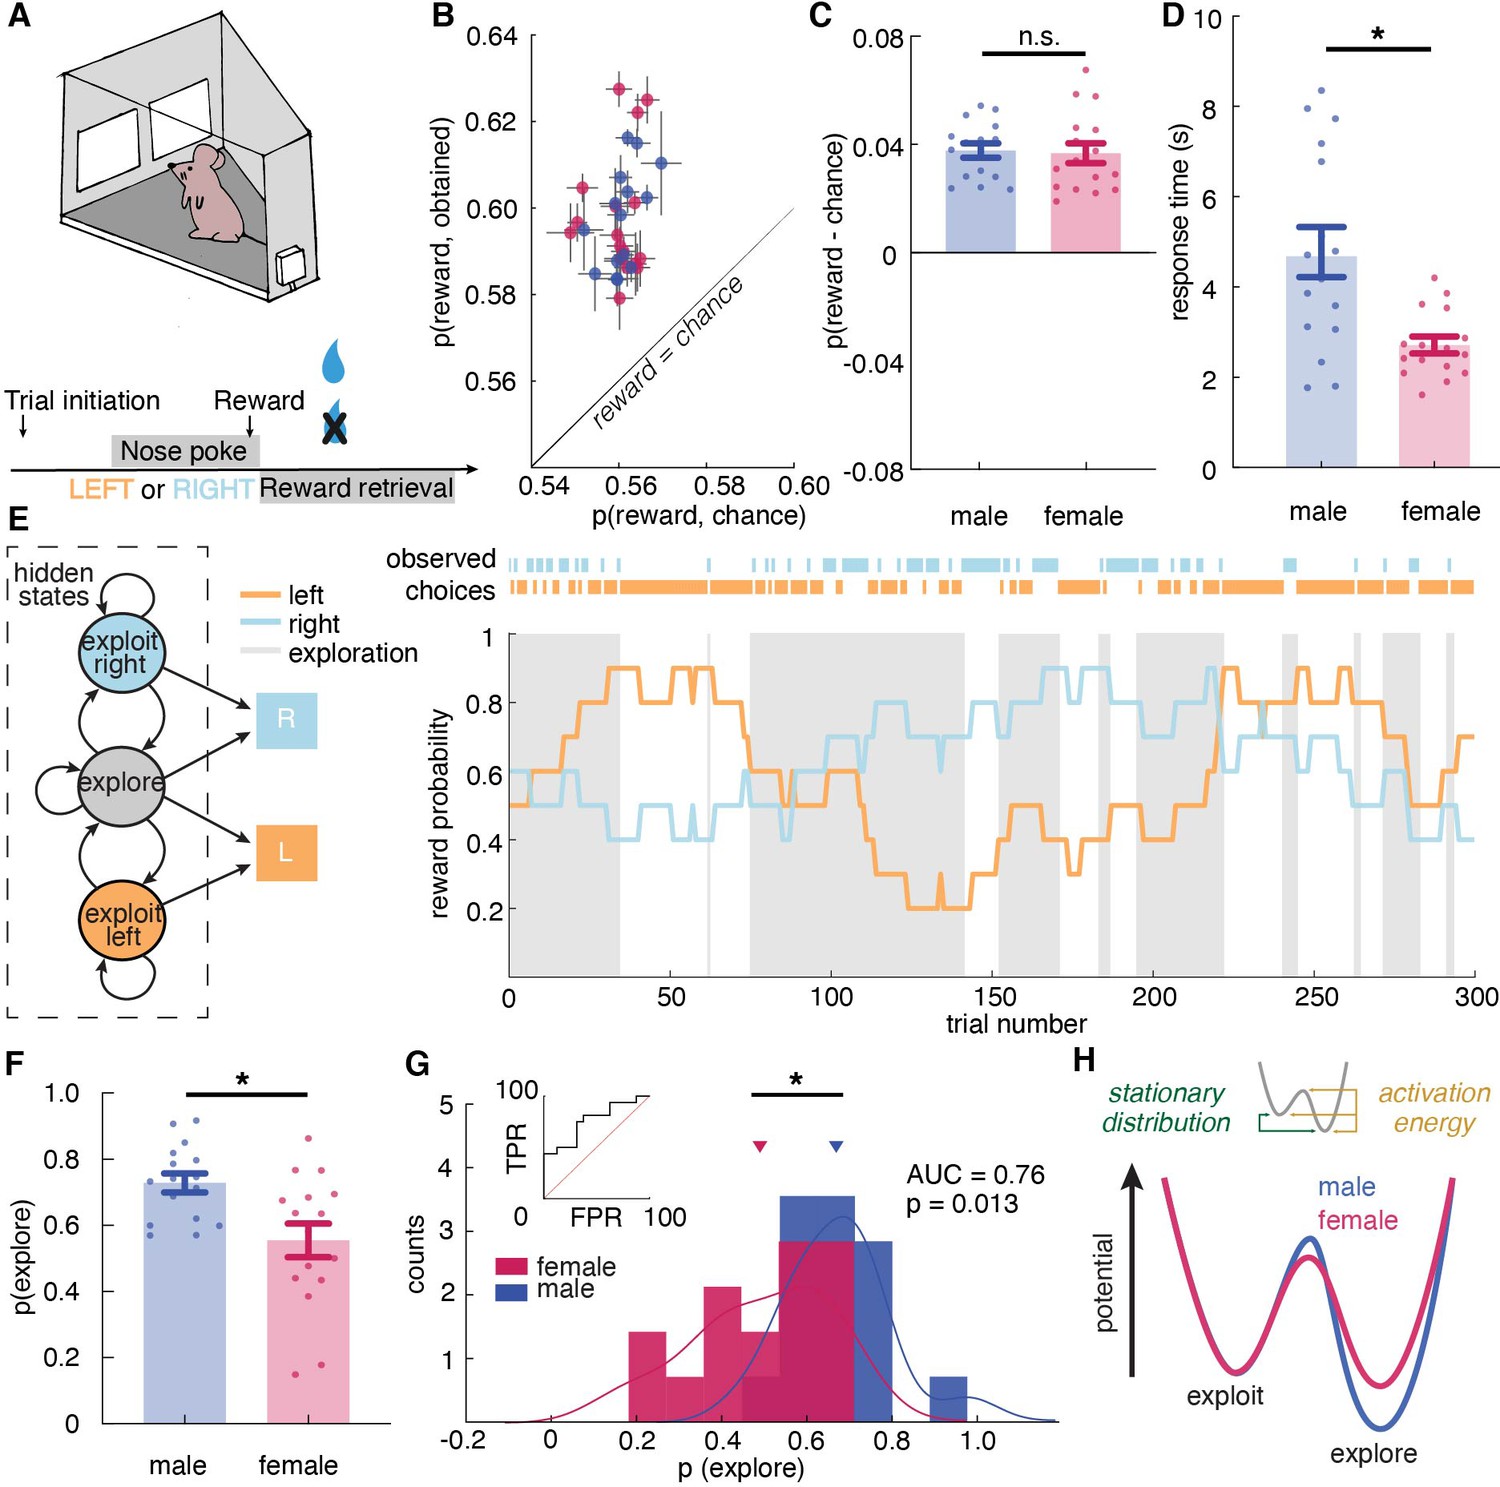
Male and female mice showed different exploratory strategies in a restless bandit task - males explored more than females, and they explored for longer periods of time once started.
(A) Schematic of the mouse touchscreen chamber with the restless two-armed bandit task and trial structure. (B) Average probability of obtaining reward compared to the chance probability of reward across individuals (dots). (C) Average probability of obtaining reward compared to the chance probability of reward across sexes. (D) Average response time across sexes. Females responded significantly faster than did males. (E) (left) A hidden Markov model that labeled exploration and exploitation as latent goal states underlying observed choices. This model includes an exploitation state for each arm and an exploration state where the subject chooses one of the arms randomly. (right) Reward probabilities (lines) and choices (dots) for 300 example trials for a given mouse. Shaded areas highlight explore-labeled choices. (F, G) Average (F) and distribution (G) of the percentage of Hidden Markov Model (HMM)-labeled exploratory trials in females and males. (H) Dynamic landscape of the fitted HMMs for males and females. The model fit to males had deeper exploratory states, with higher activation energy between the states. * indicates p < 0.05. Graphs depict mean ± SEM across animals.
Figure 1—figure supplement 1
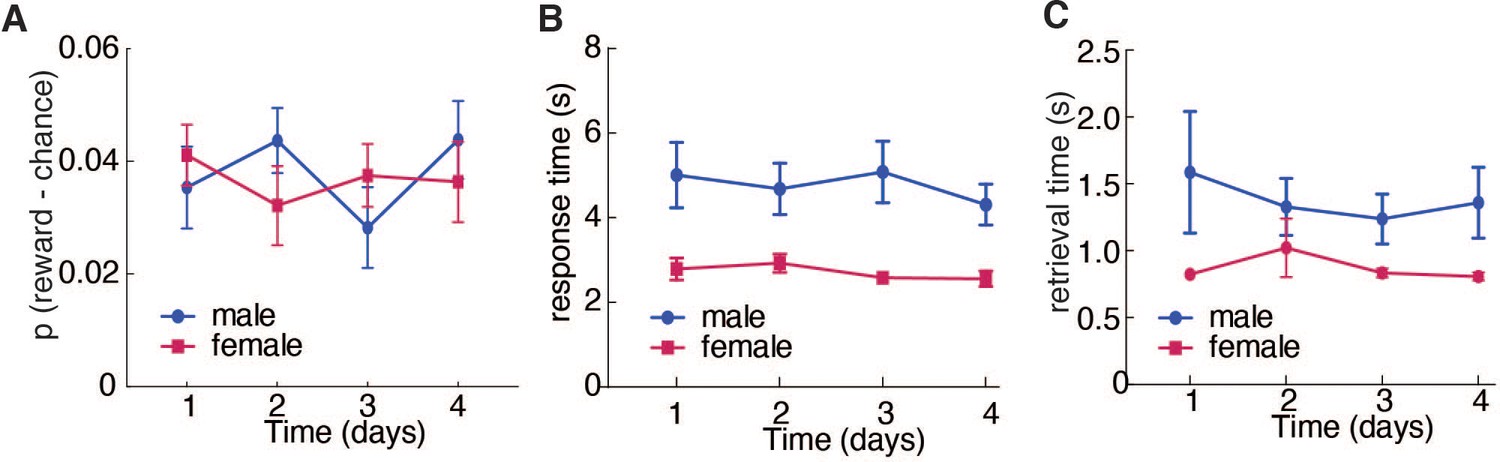
Male and female mice had reached asymptotic performance.
There is no change in reward acquisition, response time, and reward retrieval time across days. (A) Average probability of obtaining reward compared to the chance probability of reward across days in male and female mice. (B) Average response time across days in male and female mice. (C) Average reward retrieval time across days in male and female mice.
Figure 1—figure supplement 2
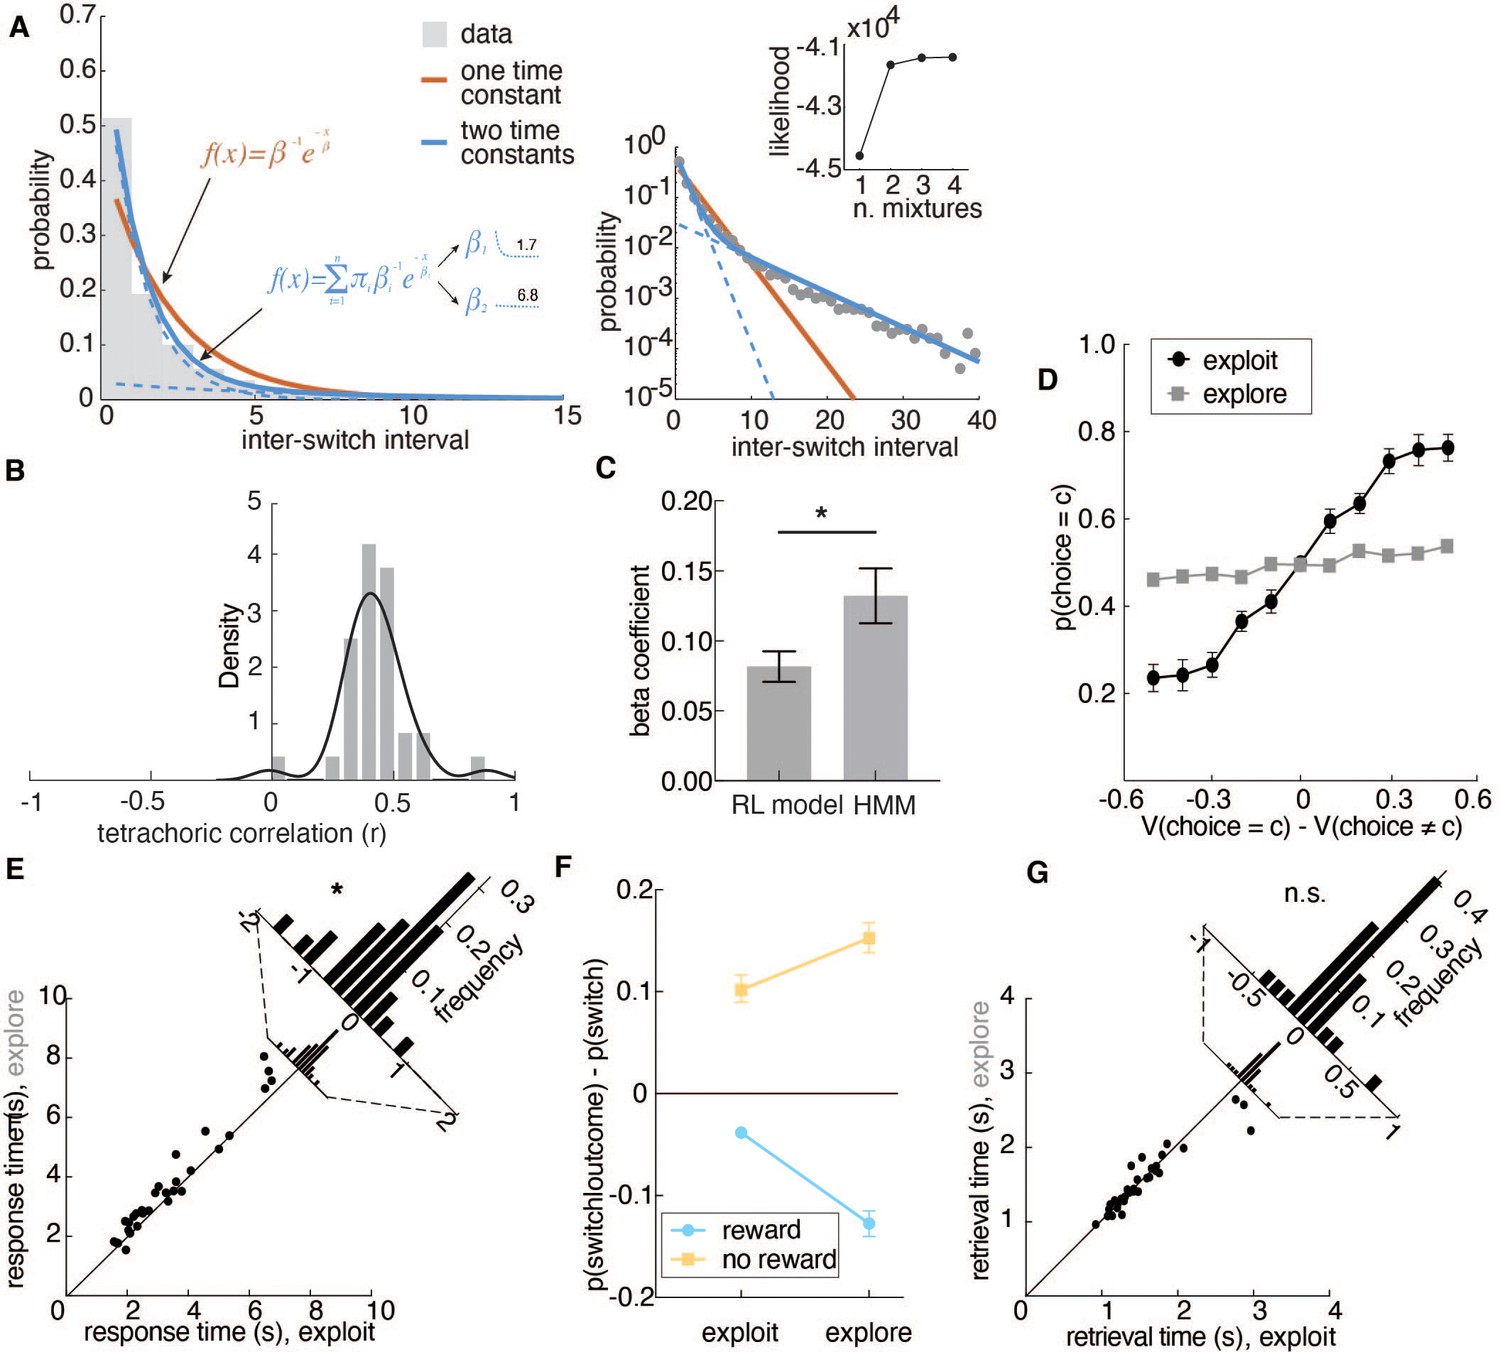
Two time constants combined best describe the rate of switching choices in animals’ choice behavior and Hidden Markov model validation.
Related to Figure 1D. (A) The tetrachoric correlation (r) between RL model-inferred explore-exploit states and HMM-inferred states. (B) The standardized regression coefficient (beta coefficients) of RL model-inferred states and HMM-inferred states in predicting response time. (C) The distribution of times between switch decisions (inter-switch intervals). A single probability of switching would produce exponentially distributed inter-switch intervals. Orange line, the maximum likelihood fit for a single discrete exponential distribution. Solid blue line, a mixture of two exponential distributions, with each component distribution in dotted blue. The two components reflect one fast-switching time constant (average interval, 1.7 trials) and one persistent time constant (6.8 trials). The right plot is the same as the left, but with a log scale. Inset is the log likelihood of mixtures of different numbers of exponential distributions. (D) Probability of choice as a function of value differences between choices for exploratory and exploitative states. (E) Difference in choice response time between explore and exploit choices. (F) The probability of animals switching targets on the next trial, given the current trial’s outcome and latent state. (G) Difference in choice response time between explore and exploit choices. There is no significant difference in retrieval time between two latent states, suggesting that exploration was not merely disengagement from the task. * indicates p < 0.05. Graphs depict mean ± SEM across animals.
Figure 2
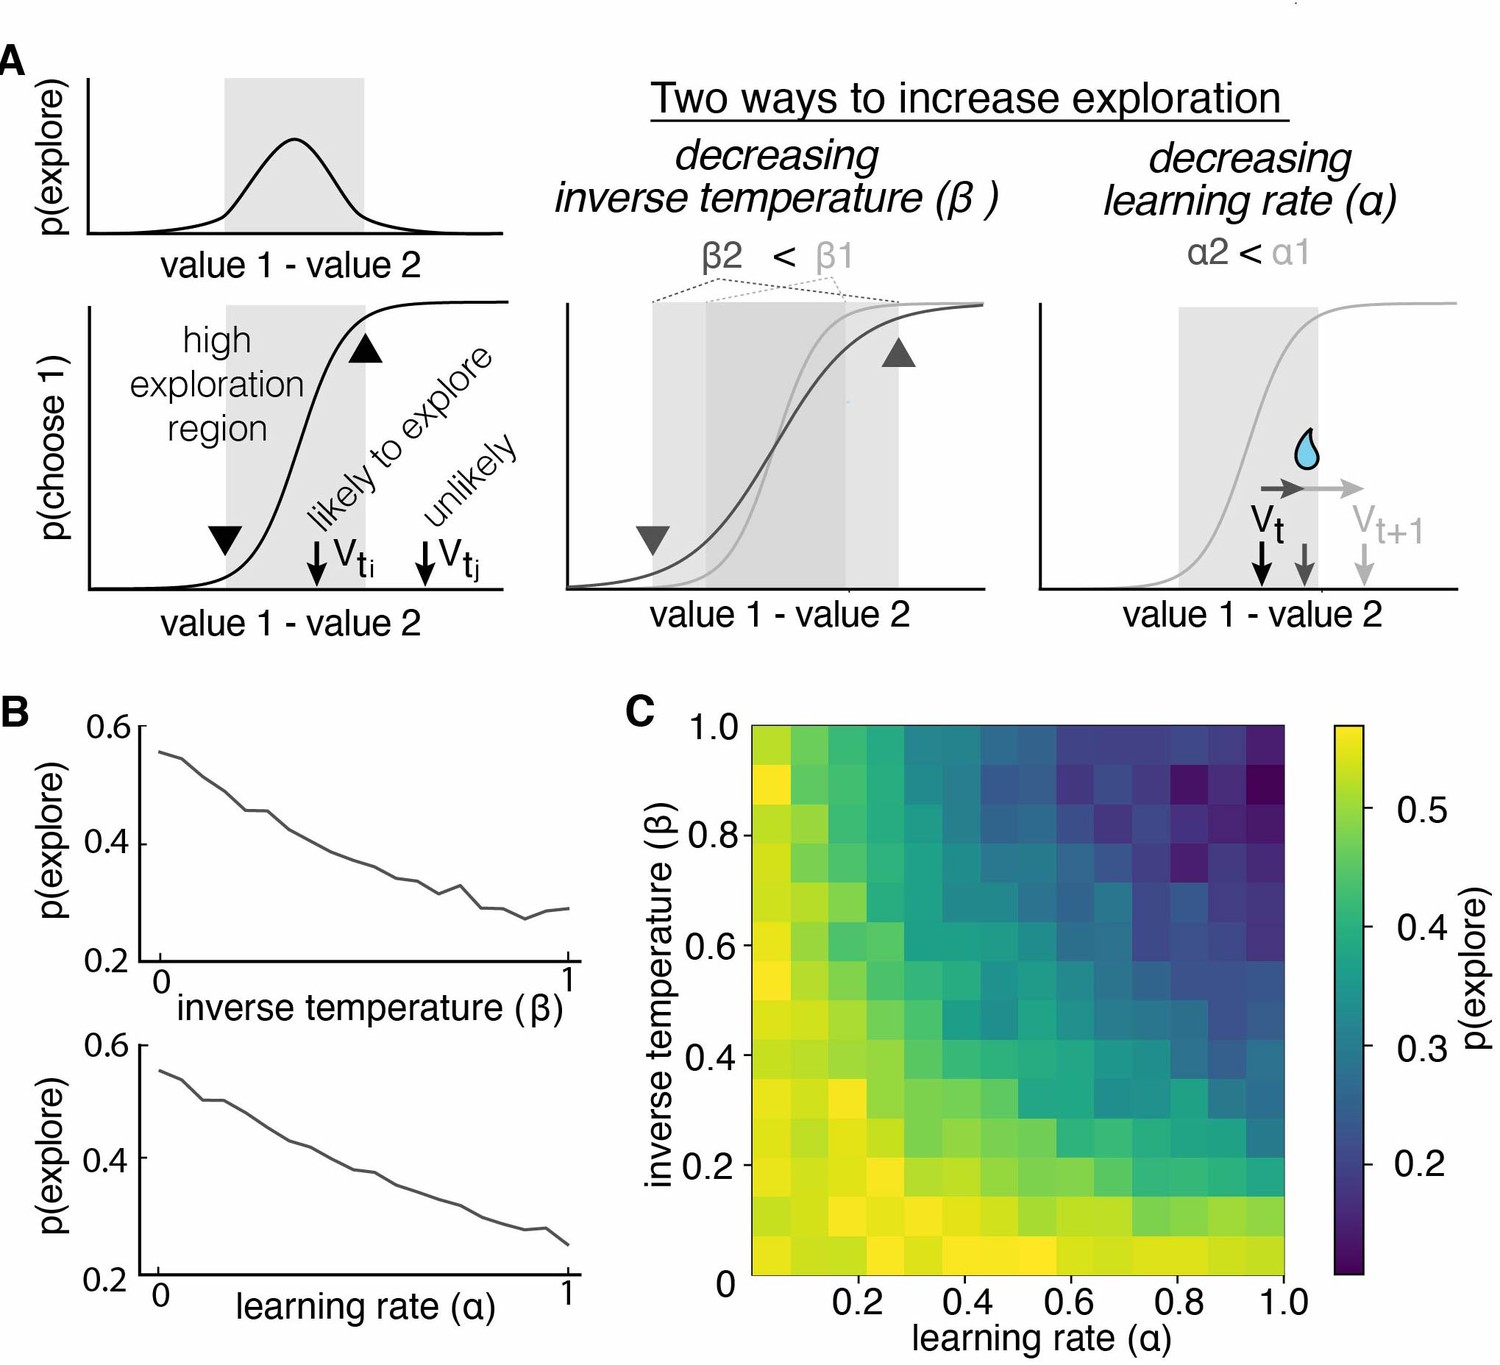
Multiple reinforcement learning parameters can influence the probability of exploration.
(A) Exploration occurs most often when option values are close together, illustrated by the gray shaded boxes in the value-choice functions. Both decreasing inverse temperature (β) and decreasing learning rate increases exploration because each manipulation changes the amount of time spent in the high exploration zone, although the mechanisms are different. Decreasing inverse temperature (β) widens the zone by flattening the value-choice function and increasing decision noise. Decreasing learning rates (α) keeps learners in the zone for longer. (B) Probability of exploration from 10,000 different reinforcement learning agents performing this task, initialized at different random combinations of inverse temperatures (β) and learning rates (α). Marginal relationships between decision noise (top) and learning rate (bottom) are shown here. (C) Heatmap of all pairwise combinations of learning rate and inverse temperature.
Figure 3 with 1 supplement
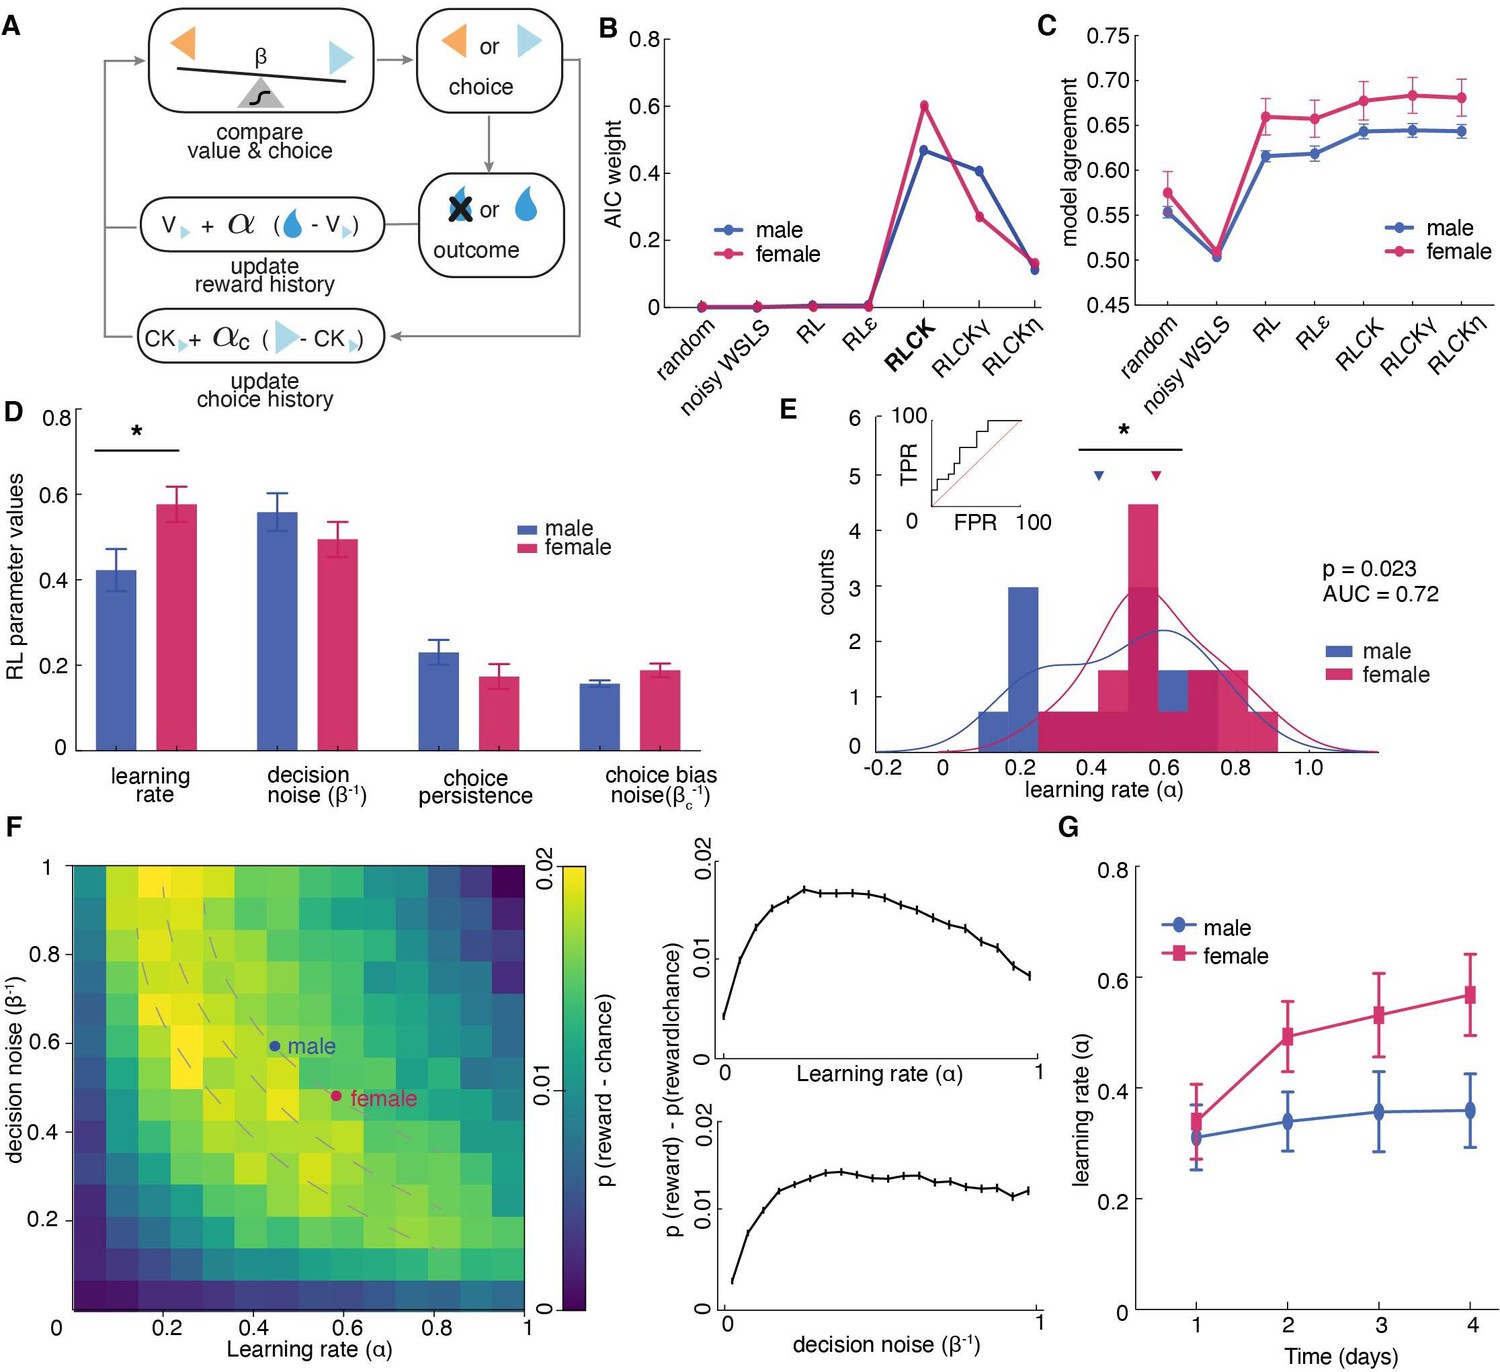
Sex differences in learning rate, but not decision noise, drove differences in explore-exploit decisions.
(A) A diagram of latent parameters that capture learning (α), bias (αc), inverse temperature (β) in reinforcement learning models. The models tested used a combination of these parameters (see Materials and methods). (B) Model comparison across seven reinforcement learning models with various parameter combinations for males and females. The four-parameter reinforcement learning-choice kernel (RLCK) model has the highest relative likelihood in both sexes. (C) Model agreement across seven reinforcement learning models, which measures how well a model predicts the actual choices of animals. (D) All four parameters in the best fit RLCK model across sexes. Learning rate (α) was significantly higher in females than males. (E) Distribution of learning rate across sexes. (F) (left) Simulation of reward acquisition of RL agent with different combinations of learning rate (α) and decision noise (β-1). Different combinations of learning rate and decision noise can result in the same level of reward performance. Average learning rate and decision noise is overlaid on the heatmap for males and females. (right) relationship between reward acquisition and learning rate or decision noise separately. High learning rate is not equivalent to better learning performance. (G) Learning rate in females increased across days, suggestive of meta learning. * indicates p < 0.05. Graphs depict mean ± SEM across animals.
Figure 3—figure supplement 1
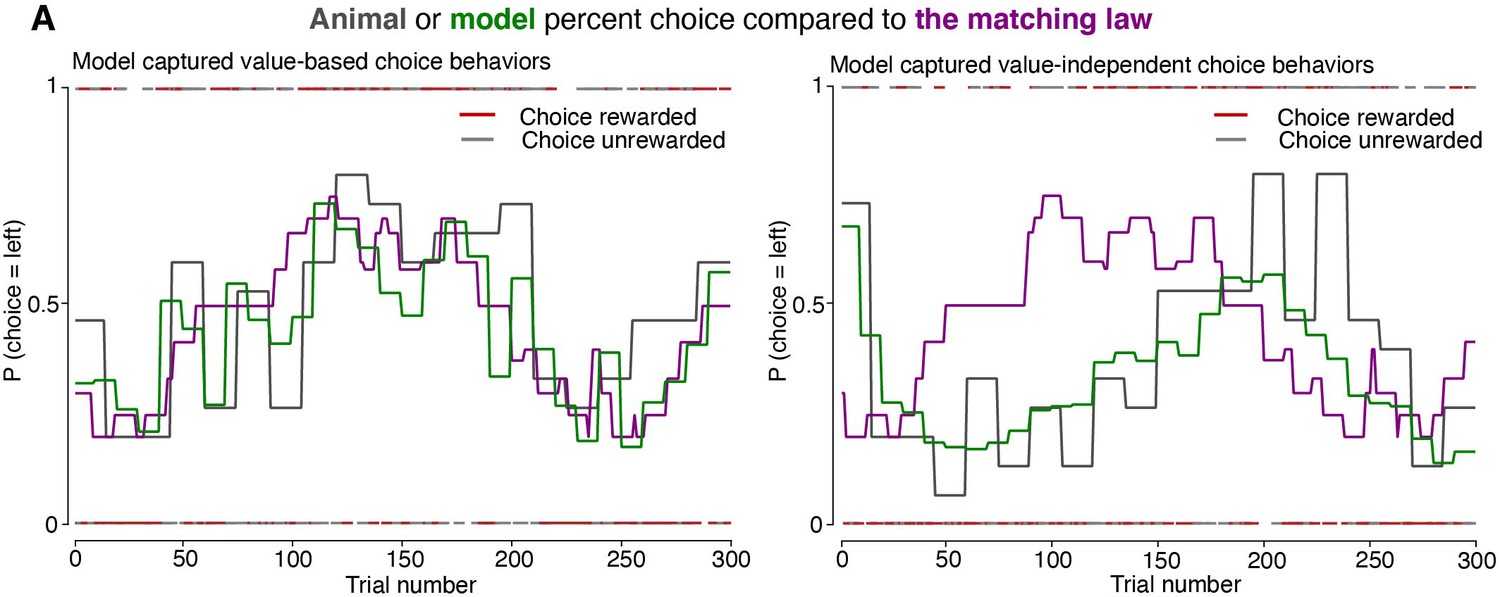
The best fit model, the four-parameter reinforcement learning-choice kernel (RLCK) model, captured both value-dependent and value-independent choice behaviors.
Actual choices (gray) and simulated choices (green) from the best fit model (RLCK) of two example animals. Predictions from the matching law are illustrated as a contrast to the best-fitting RL model.
Figure 4 with 1 supplement
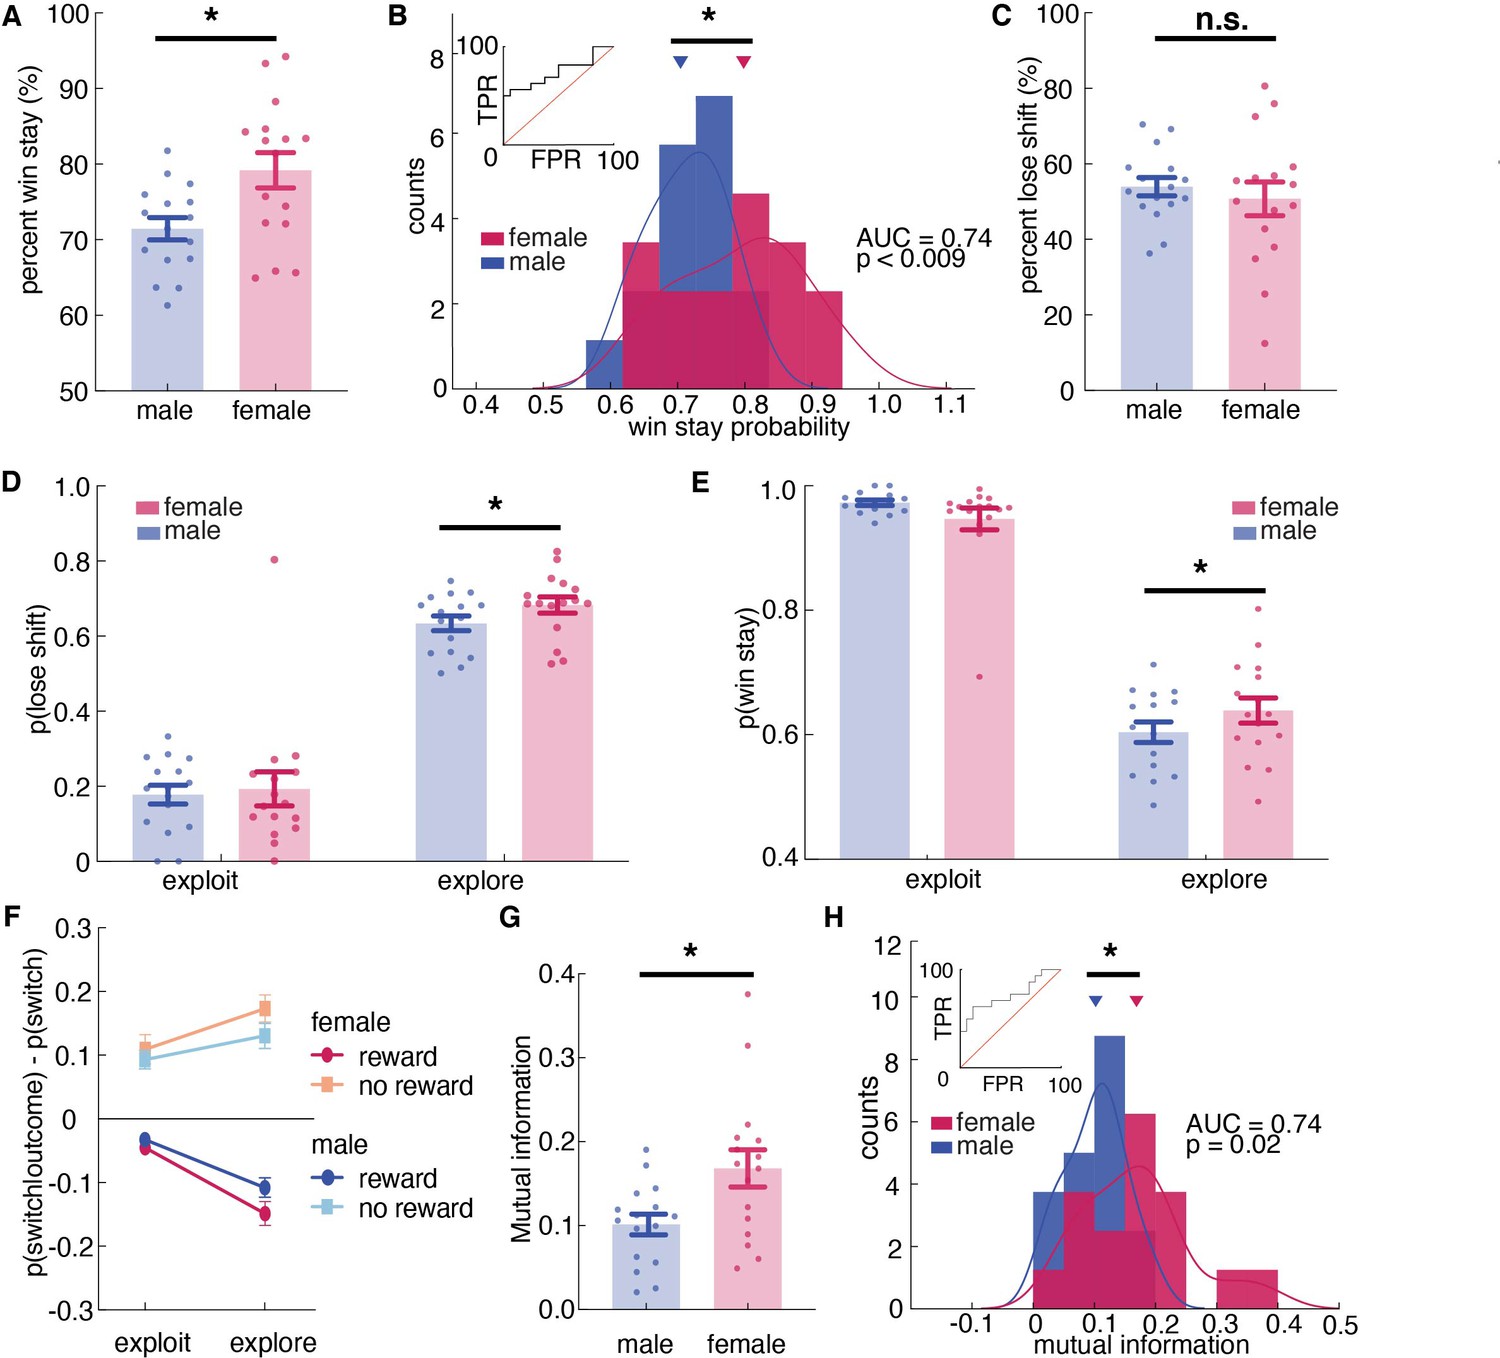
Females used more information about past outcomes and past choices to make decisions, and learned more during exploration.
(A, B) Percent win stay behavior (A: average; B: distribution) reveals that females were more likely to stay with the same choice after a reward. (C) Average percentage of lose shift behavior across sexes. (D) Probability of shifting after a loss during explore or exploit trials. (E) Probability of staying after a win during explore or exploit trials. (F) The probability of males and females switching targets on the next trial, given the current trial’s outcome and latent state. Females learned more only during exploratory trials. (G, H) Average (G) and distribution (H) of percentage of mutual information across all trials in females and males reveals that females use more information about past trials (choice and outcome) in making future decisions. * indicates p < 0.05. Graphs depict mean ± SEM across animals.
Figure 4—figure supplement 1
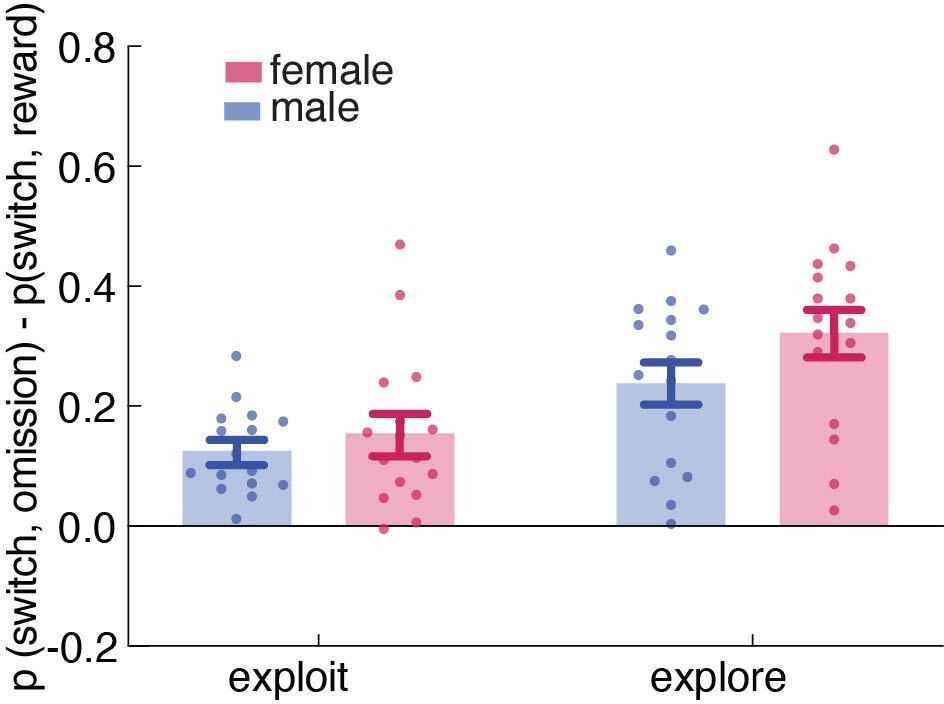
Reward learning in explore vs. exploit state across sexes.
The probability of males and females switching targets on the next trial, given the current trial’s outcome and latent state. Females showed increased reward learning only during exploratory state (Supplementary file 1, sex X reward X state interaction, p = 0.0438).
Tables
Key resources table
| Reagent type (species) or resource | Designation | Source or reference | Identifiers | Additional information |
|---|---|---|---|---|
| Strain, strain background (mouse) | B6129SF1/J | The Jackson Laboratory | JAX: 101,043 | |
| Software, algorithm | Python 3 | Python | SCR_008394 | |
| Software, algorithm | MATLAB R2013a | MathWorks | SCR_001622 |
Additional files
-
Supplementary file 1
Four-way Repeated Measures ANOVA showing main effects and interaction effects (pairwise and 3-way) of sex, outcome, latent state, and subject identity.
- https://cdn.elifesciences.org/articles/69748/elife-69748-supp1-v3.docx
-
Supplementary file 2
Tukey’s multiple comparison test of model agreement across RL models showing how well each model predicts animals’ actual choices.
- https://cdn.elifesciences.org/articles/69748/elife-69748-supp2-v3.docx
-
Transparent reporting form
- https://cdn.elifesciences.org/articles/69748/elife-69748-transrepform1-v3.pdf
Download links
A two-part list of links to download the article, or parts of the article, in various formats.
Downloads (link to download the article as PDF)
Open citations (links to open the citations from this article in various online reference manager services)
Cite this article (links to download the citations from this article in formats compatible with various reference manager tools)
Sex differences in learning from exploration
eLife 10:e69748.
https://doi.org/10.7554/eLife.69748


