Consequences of PDGFRα+ fibroblast reduction in adult murine hearts
- Center for Cardiovascular Research, John A. Burns School of Medicine, University of Hawaii at Manoa, United States
- Department of Cell and Molecular Biology, John A. Burns School of Medicine, University of Hawaii at Manoa, United States
- Department of Biomedical Engineering, Cleveland Clinic Lerner Research Institute, United States
- Dorothy M. Davis Heart and Lung Research Institute, Department of Physiology and Cell Biology, The Ohio State University Wexner Medical Center, United States
Figures
Figure 1 with 3 supplements
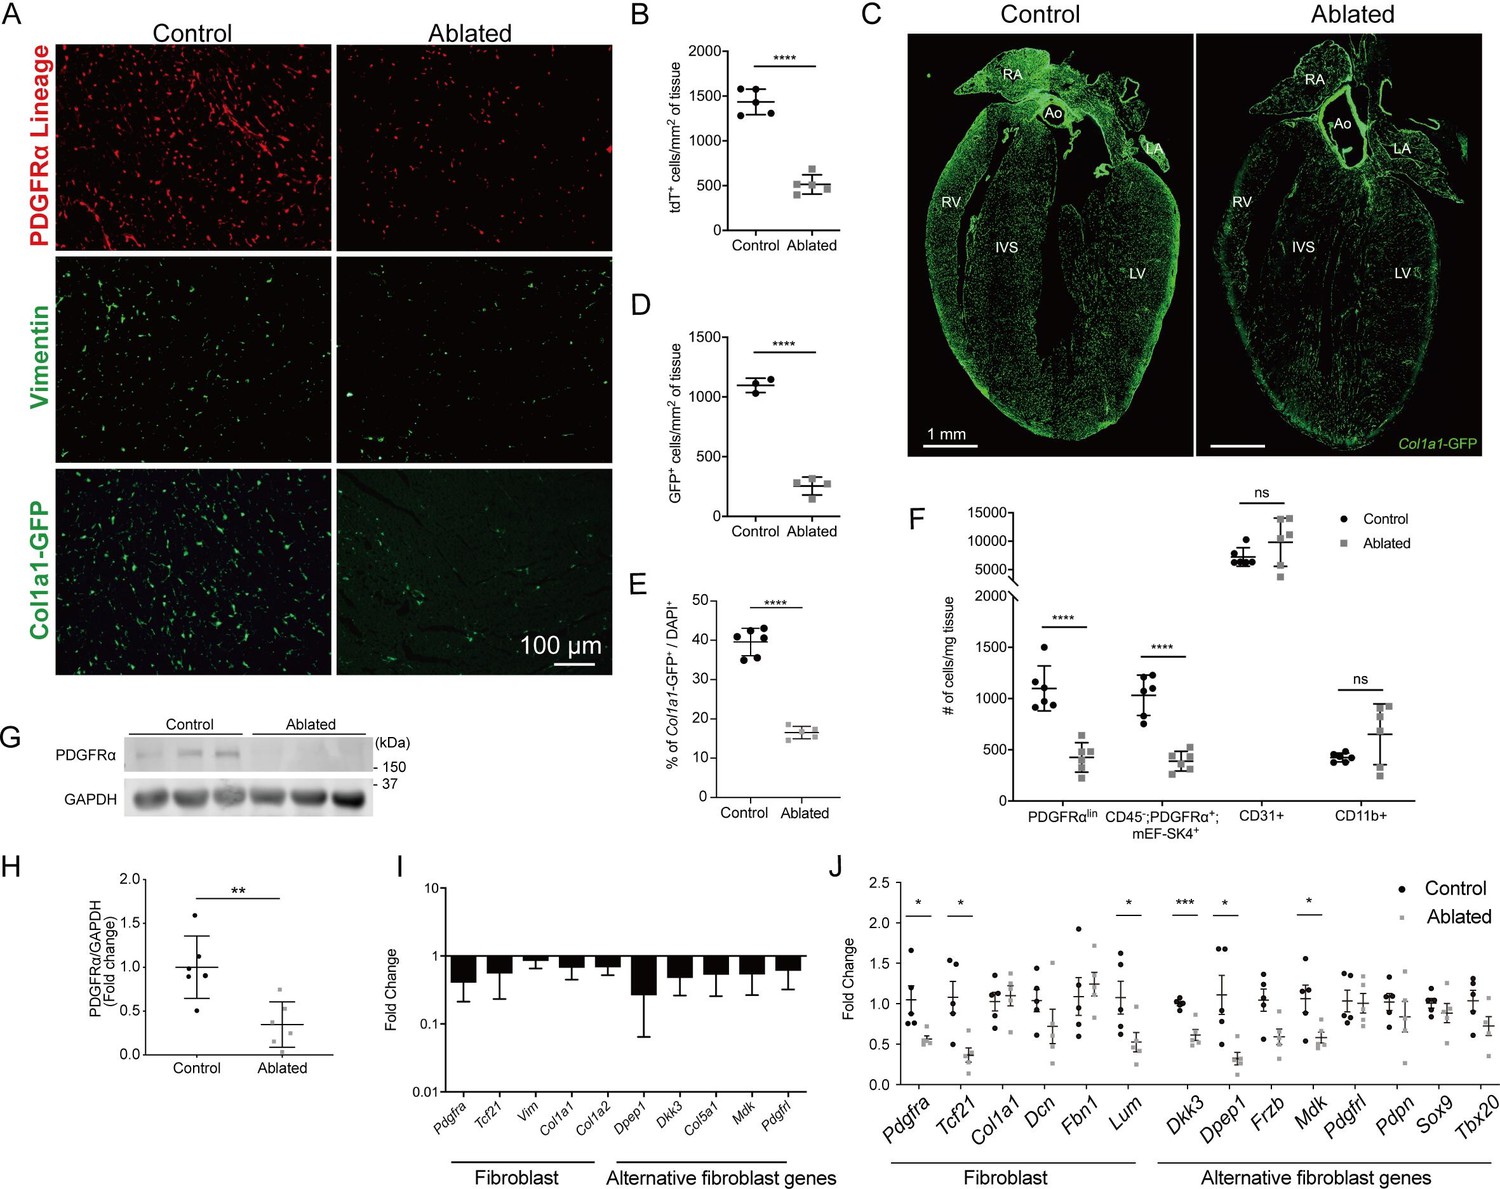
Loss of fibroblasts in adult ablated hearts.
(A) Representative images of PDGFRα lineage (tdTomato), vimentin immunostaining, and Col1a1-GFP reporter fluorescence in the left ventricular (LV) myocardium. A representative from a minimum of three biological replicates for each staining. (B) Quantification of tdTomato. Three fields of view (FOV) at 20× from two non-consecutive sections per biological replicate were quantified. Control: n=5; ablated: n=5. (C) A four chamber view of Col1a1-GFP expression. Ao: aorta; IVS: interventricular septum; LA: left atrium; LV: left ventricle; RA: right atrium; RV: right ventricle. A representative from a minimum of three biological replicates. (D–E) Quantification of Col1a1-GFP (D) 2 weeks after induction (control: n=3; ablated: n=4) and (E) over 1 year after induction (control n=6; ablated: n=5). (F) Quantification of fibroblasts (PDGFRαlin, CD45-; PDGFRα+; mEF-SK4+), endothelial cells (CD31+), and immune cell (CD11b+) populations by flow cytometry. Neutrophils, mast cells, and eosinophils were fewer than 100 cells/mg of tissue in both control and ablated hearts. Control: n=6; ablated: n=6. (G, H) Representative western blot of whole ventricle lysates and band intensities. Control: n=6; ablated: n=6. (I) The quantitative real-time polymerase chain reaction (qRT-PCR) analysis of selected fibroblast and alternative fibroblast genes in whole ventricles from ablated hearts compared to controls. Control: n=3; ablated: n=4. (J) The qPCR analysis of selected fibroblast and alternative fibroblast genes in primary fibroblasts isolated from indicated genotypes 8 months after induction. (A–D, F) 4–14 days after induction. Control: n=5; ablated: n=5. (C, I) 8–14 months after induction. (G, H) 2–4 months after induction. Results are mean ± SD. Statistical significance was determined by an unpaired t-test. ns: not significant, p>0.05; *p≤0.05; **p≤0.01; ***p≤0.001; ****p≤0.0001.
-
Figure 1—source data 1
Full unedited western blots.
- https://cdn.elifesciences.org/articles/69854/elife-69854-fig1-data1-v2.zip
Figure 1—figure supplement 1
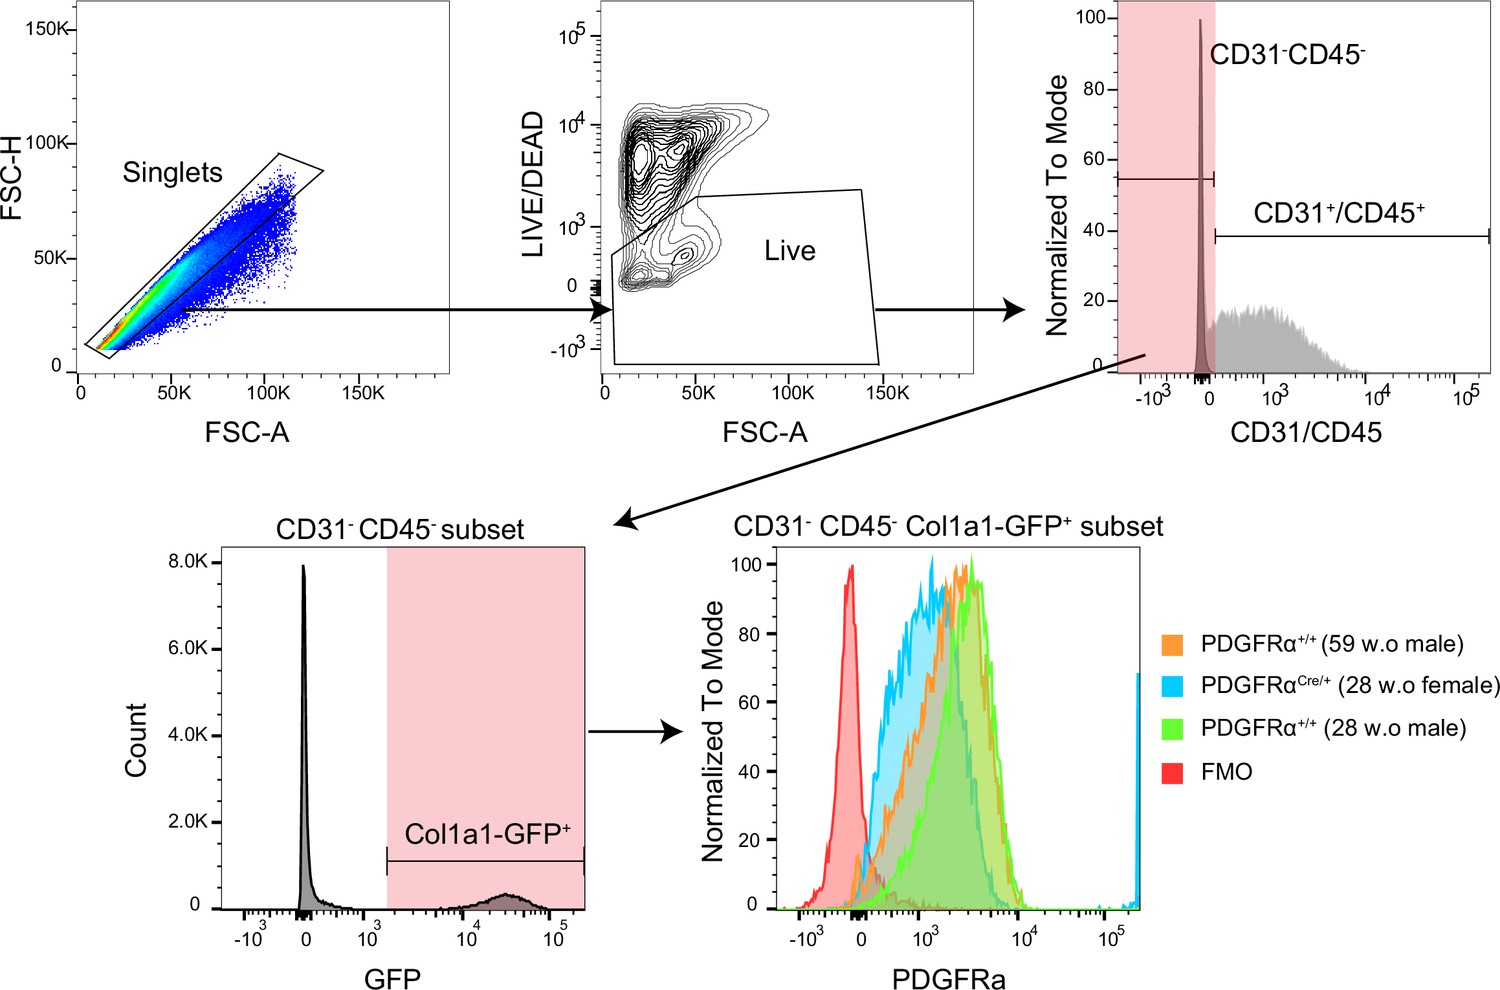
The PDGFRα detection by flow cytometry.
Gating strategy for PDGFRα expression.
Figure 1—figure supplement 2
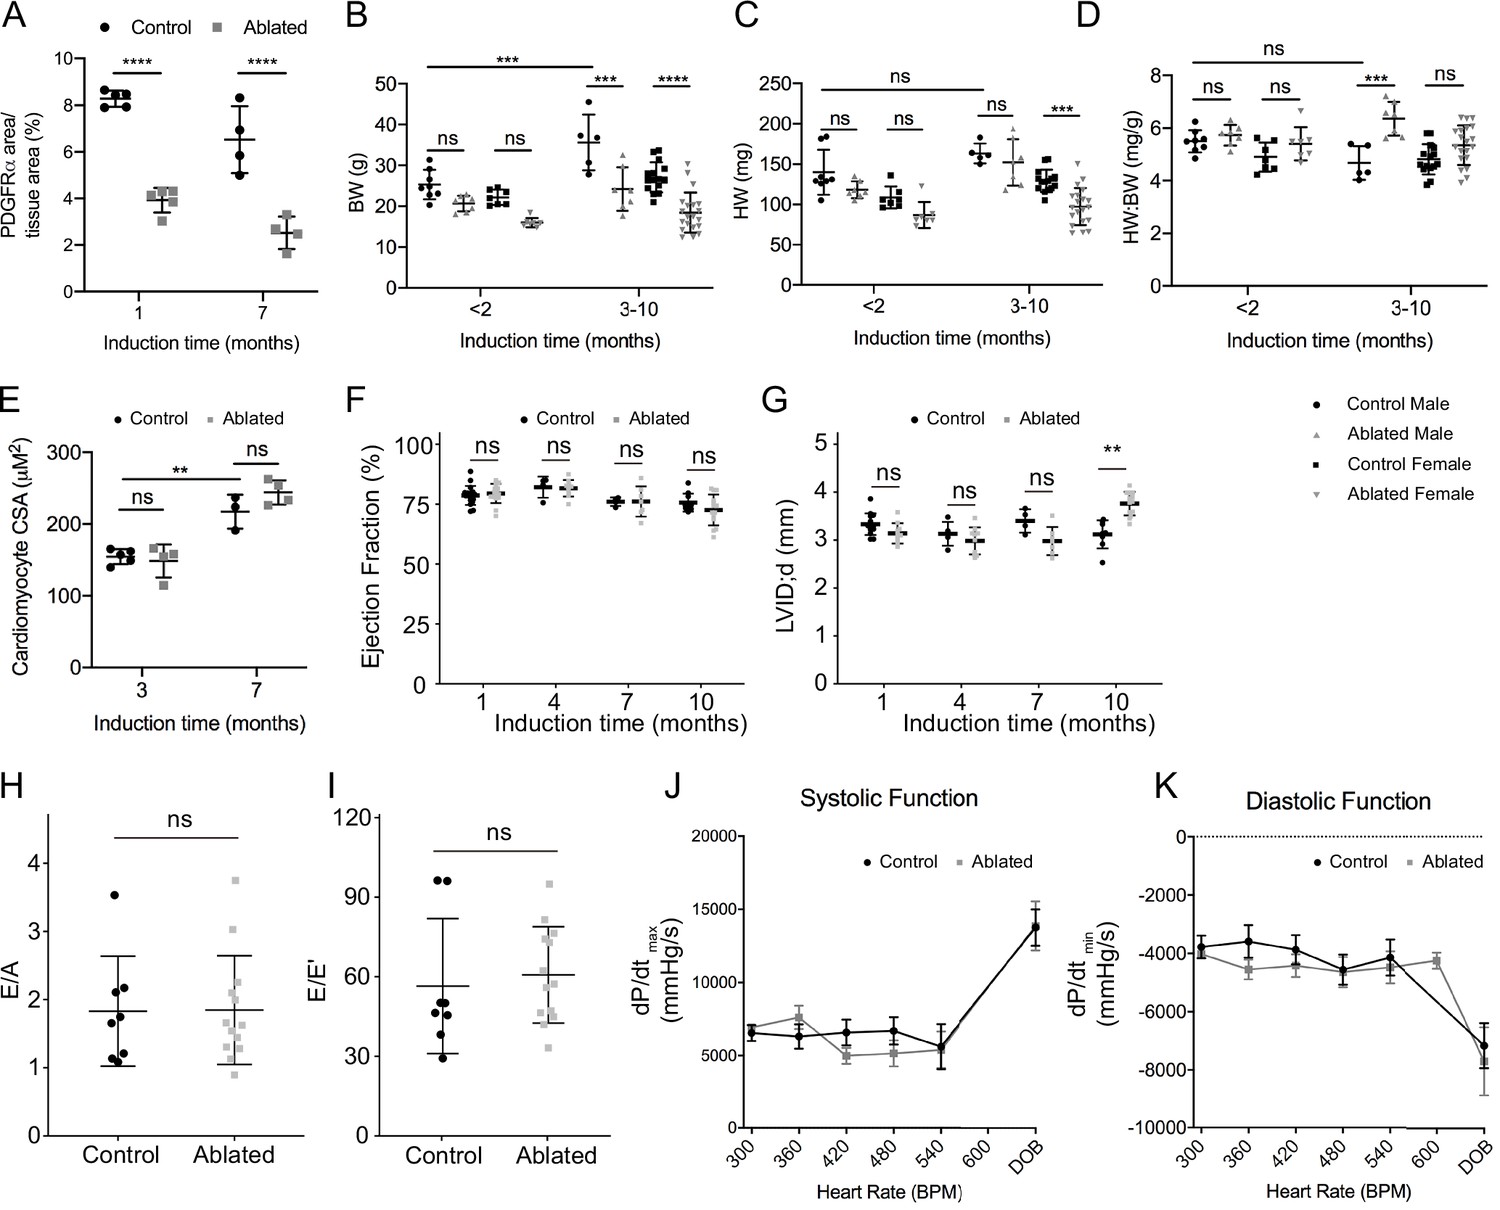
Basal phenotype after short- and long-term fibroblast loss.
(A) Area of PDGFRα staining normalized to tissue area at indicated induction times. Control: n=5, 4; ablated: n=5, 4 (1 and 7 months, respectively). (B) Body weight (BW), (C) heart weight (HW), (D) HW:BW ratio (<2 months; control male: n=8; ablated male: n=7; control female: n=7; ablated female: n=7. 3–10 months; control male: n=5; ablated male: n=7; control female: n=15; ablated female: n=20), (E) cardiomyocyte cross-sectional area (CSA; control: n=5, 3; ablated n=4, 4 [3 and 7 months, respectively]), (F) left ventricular (LV) ejection fraction (EF), and (G) diastolic LV internal diameter (LVID; control: n=14, 5, 4, 8; ablated: n=10, 10, 7, 13 [1, 4, 7 and 10 months, respectively]) after the indicated time of induction. (H, I) Ratio between mitral E wave and A wave (E/A), or E’ wave (E/E’), representing diastolic function 10 months after induction. Control: n=8; ablated: n=13. (J, K) Pressure-volume loop analysis for systolic and diastolic function over increasing heart rate (HR). dP/dtmax and dP/dtmin, maximum and minimum rate of pressure change in the ventricle, respectively. DOB: dobutamine. Around 7 months after induction. Control: n=7; ablated: n=6. Results are mean ± SD. Statistical significance was determined by an unpaired t-test. ns: not significant, p>0.05; **p≤0.01; ***p≤0.001; ****p≤0.0001.
Figure 1—figure supplement 3
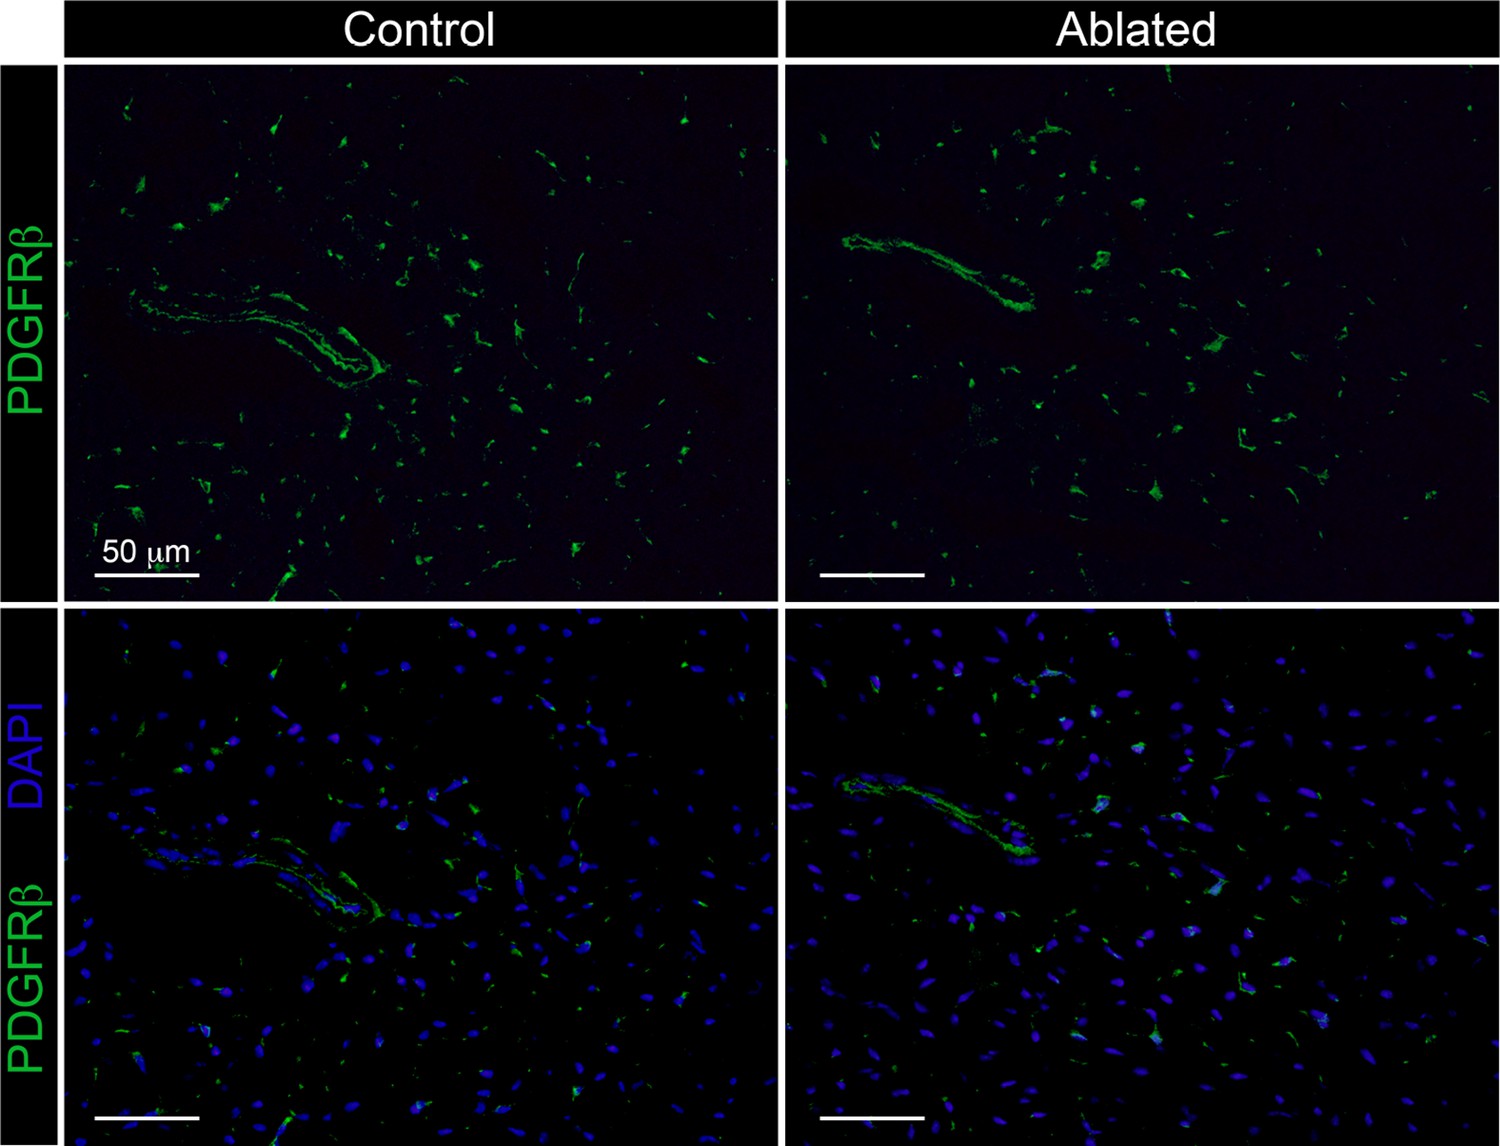
The PDGFRβ expressing cells.
Representative images of PDGFRβ immunostaining at 14 days post-induction in 6-week-old animals. Control: n=3; ablated n=4.
Figure 2
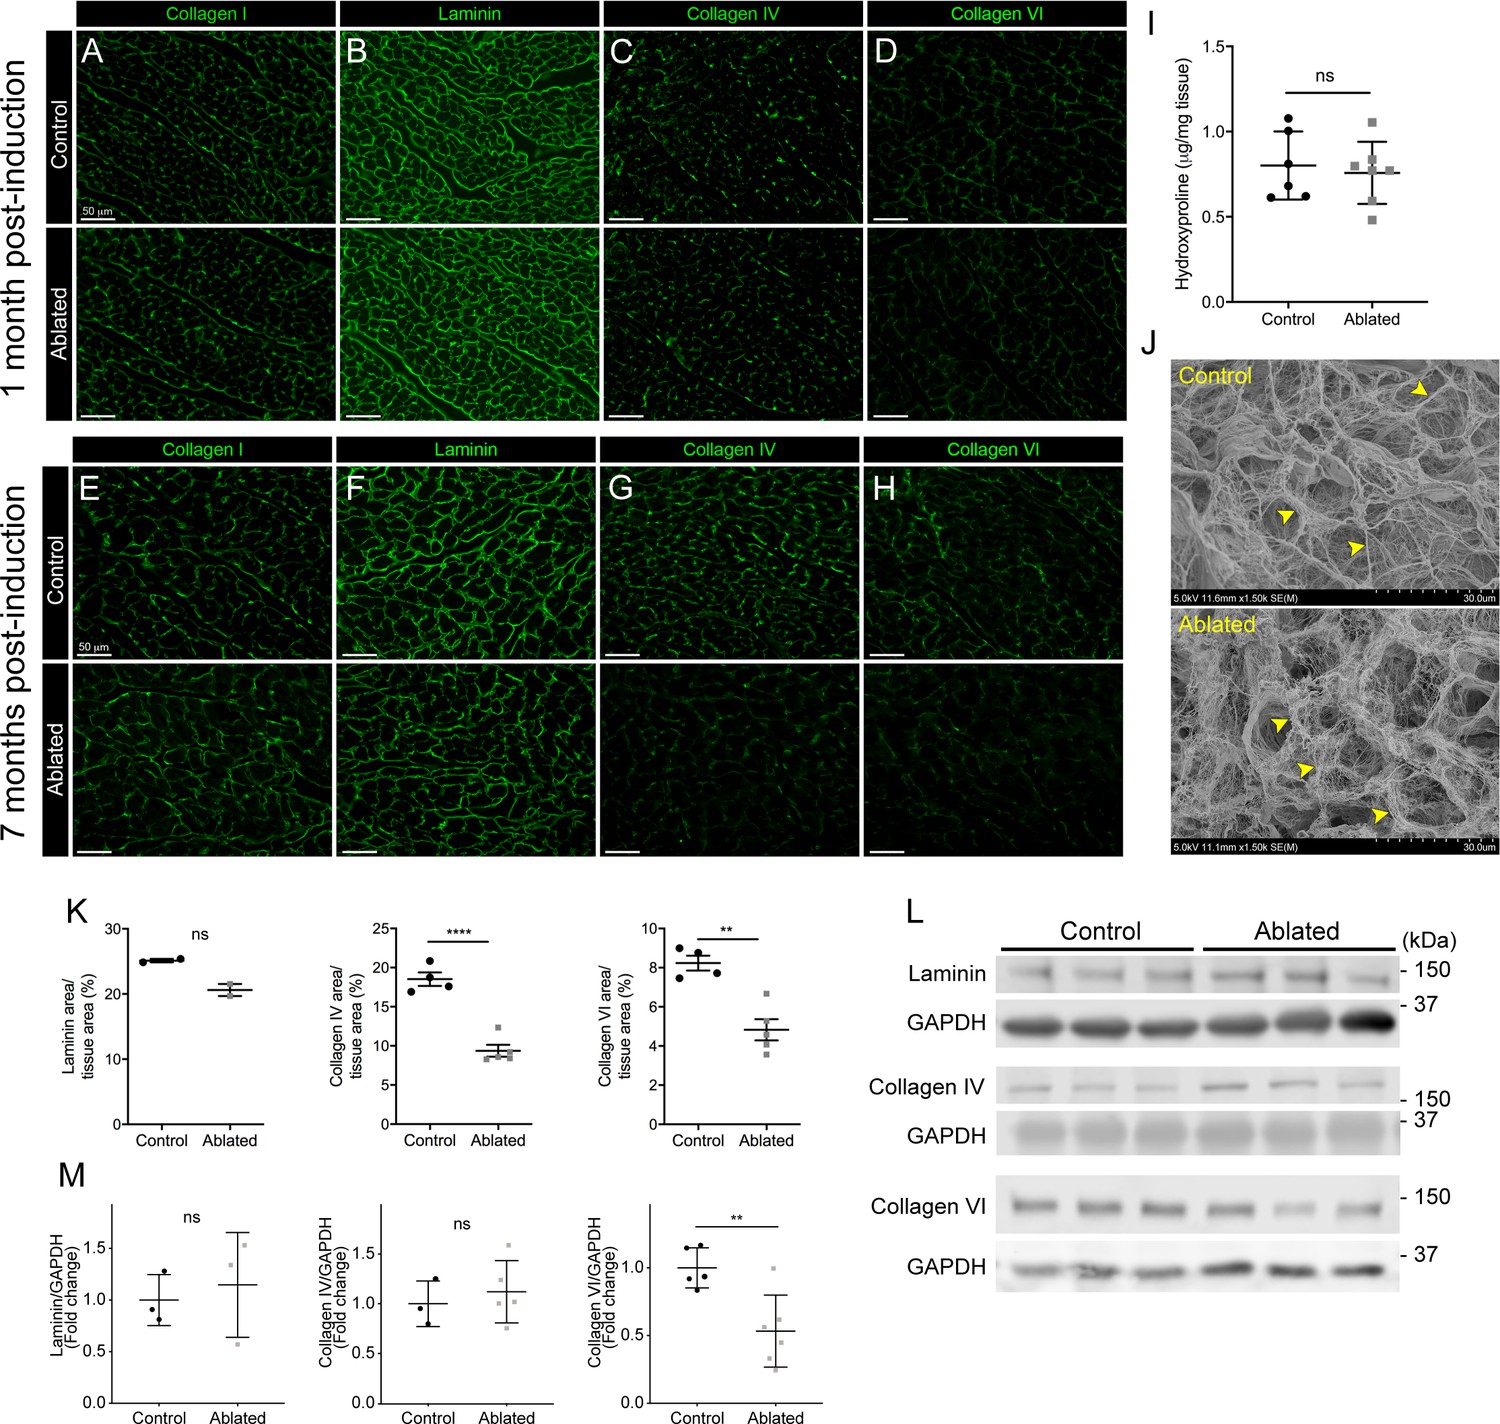
Collagen distribution and basement membrane alterations following fibroblast ablation.
(A–H) Representative images of (A, E) collagen I, (B, F) laminin, (C, G) collagen IV, and (D, H) collagen VI immunostaining at indicated post-induction time points. A representative from a minimum of three biological replicates for each staining. (I) Hydroxyproline content from whole ventricle tissue 5 months after induction. Control: n=6; ablated: n=7. (J) Representative scanning electron microscopy (SEM) images of decellularized left ventricular (LV) tissue at 2 months post-induction. Arrowheads indicate collagen fibrils. Control: n=3; ablated: n=3. (K) Area of laminin (control: n=2; ablated: n=2), collagen IV (control: n=4; ablated: n=5), and collagen VI (control: n=4; ablated: n=5) staining normalized to tissue area 7 months after induction. (L–M) Western blot analysis of whole ventricle lysate 7 months after induction for laminin (control: n=3; ablated: n=3), collagen IV (control: n=3; ablated: n=5), and collagen VI (control: n=5; ablated: n=6). Results are mean ± SD. Statistical significance was determined by an unpaired t-test or a Mann-Whitney U test. ns: not significant, p>0.05; *p≤0.05; **p≤0.01; ****p≤0.0001.
-
Figure 2—source data 1
Full unedited western blots.
- https://cdn.elifesciences.org/articles/69854/elife-69854-fig2-data1-v2.zip
Figure 3 with 3 supplements
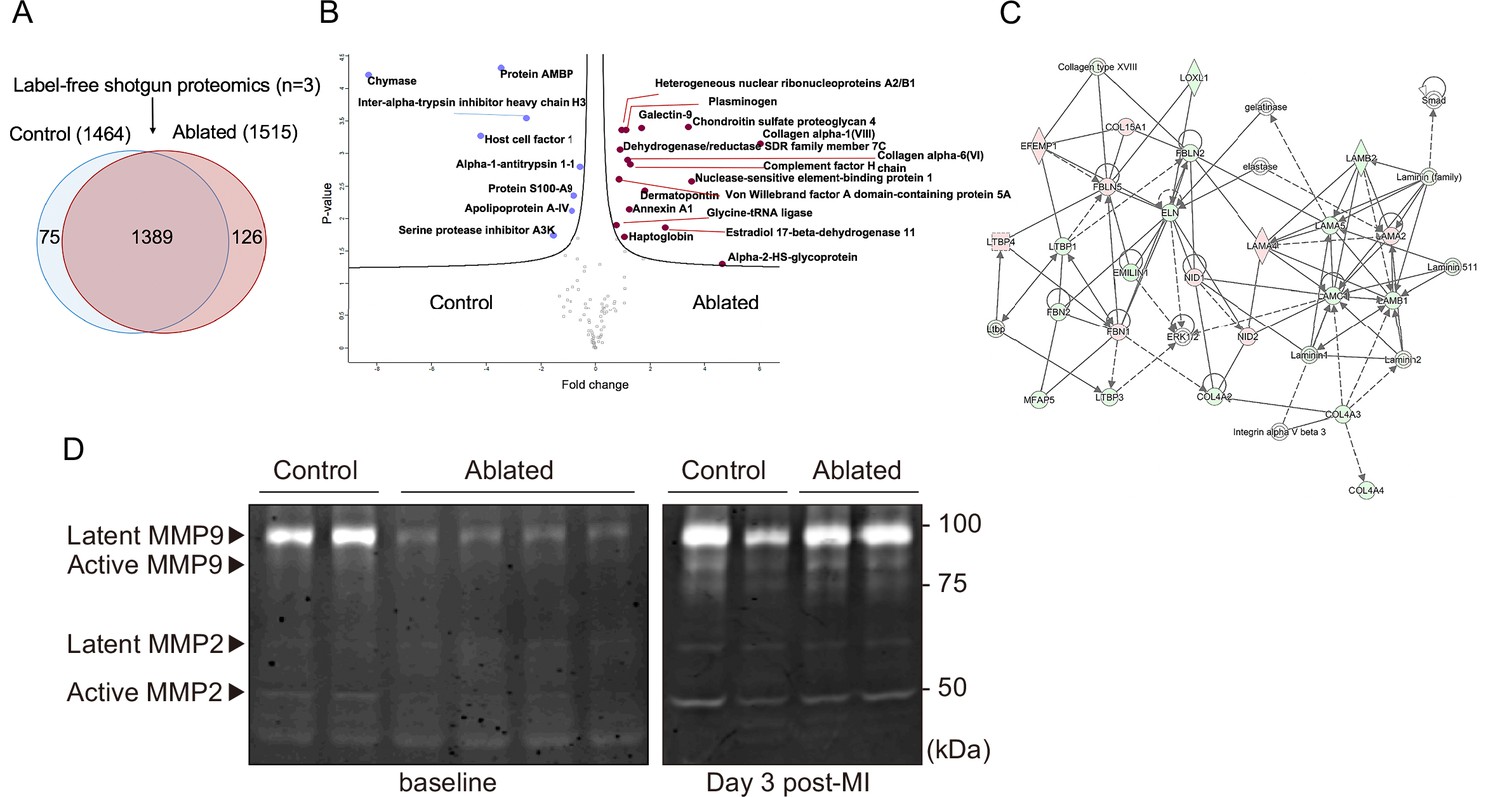
Minimal change in matrisome after fibroblast ablation.
(A) Venn diagram of proteins identified by label-free quantitative shotgun proteomics from decellularized control and ablated heart tissue >2 months after induction. (B) Volcano plot showing the distribution of quantified proteins by shotgun proteomics according to p-value and fold change. Blue dots indicate proteins with higher abundance in control ventricles, and red dots indicate proteins with higher abundance in fibroblast-ablated ventricles (all dots are false discovery rate [FDR] <0.05). The p-values are calculated from the data of three replicates. (C) Extracellular matrix (ECM) network generated using Ingenuity Pathway Analysis (IPA). Red and green nodes represent up- and down-regulated proteins in control samples, respectively. Empty nodes represent proteins that were not identified in this study but extrapolated from the IPA database. Dashed and continuous lines represent indirect and direct relationships between the proteins, respectively. Control: n=3; ablated: n=3. (D) Gelatin zymography of whole ventricles. Control: n=2, 2; ablated: n=4, 2 (baseline and myocardial infarction [MI], respectively).
-
Figure 3—source data 1
Full unedited gelatin zymogram.
- https://cdn.elifesciences.org/articles/69854/elife-69854-fig3-data1-v2.zip
Figure 3—figure supplement 1
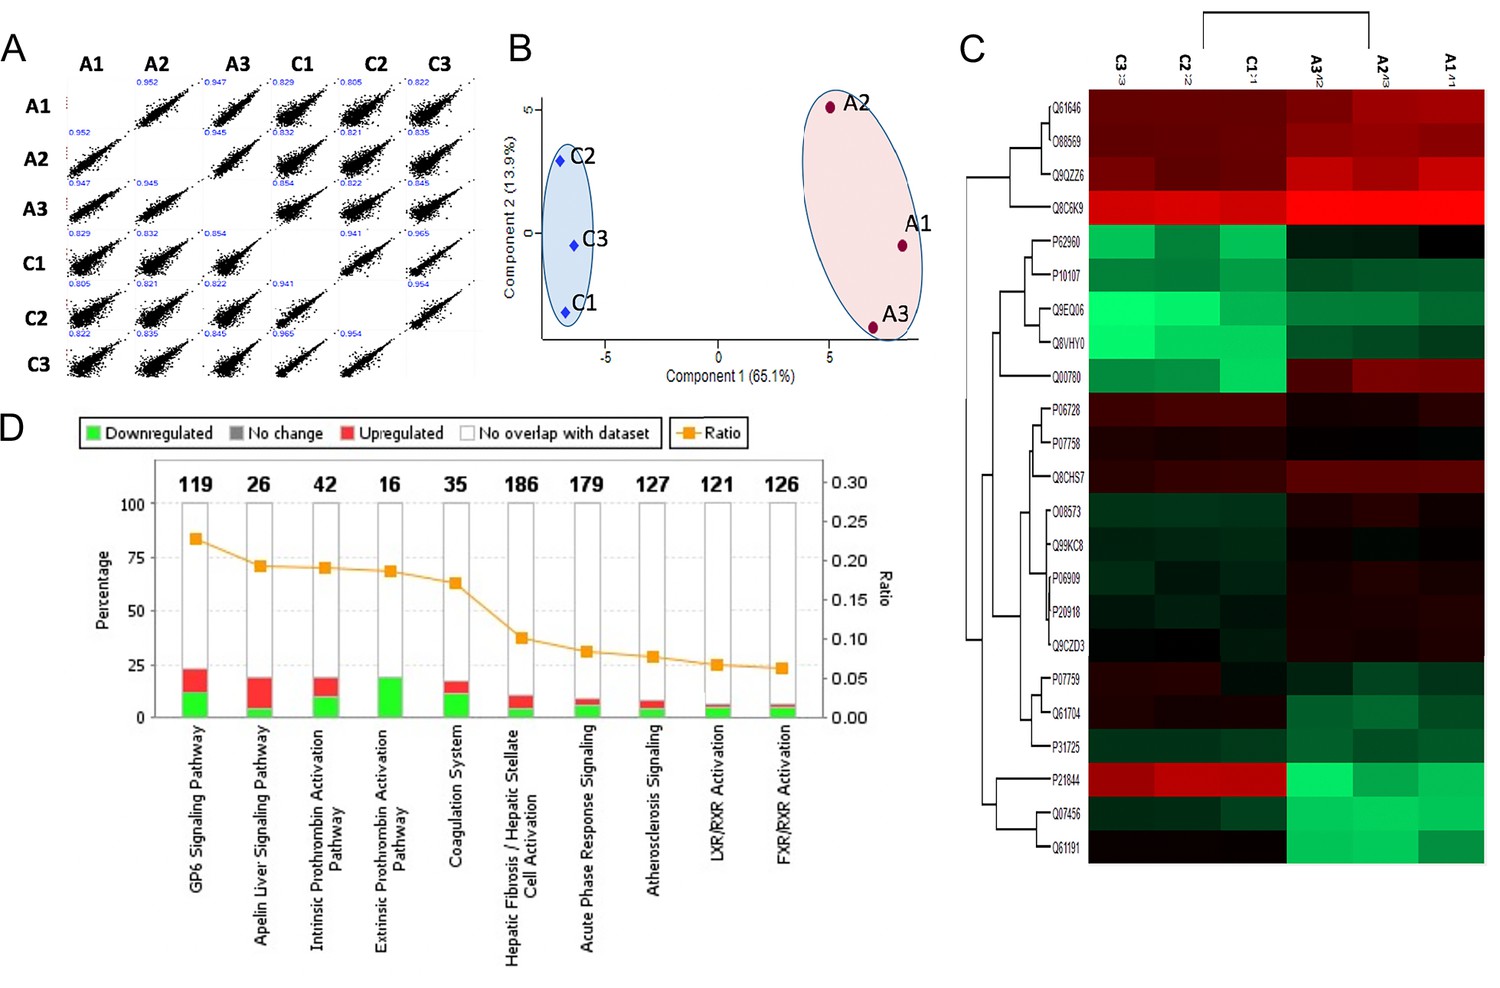
Shotgun proteomics of decellularized heart tissue.
(A) Multi-sample scatter plots with Pearson’s correlation coefficient value (blue text) showing a strong correlation between individual samples. (B) Principal component analysis (PCA) of decellularized ventricular proteomes from control (C1, C2, and C3) and ablated samples (A 1, A2, and A3). The first and second component segregation account for 65.1 and 13.9% of the differences between the two clusters, respectively. (C) Heat map of differentially abundant extracellular matrix (ECM) proteins after unsupervised hierarchical clustering. (D) Top 10 canonical pathways from secreted/ECM proteins showing statistically significant differential abundance. Control: n=4; ablated: n=4.
Figure 3—figure supplement 2
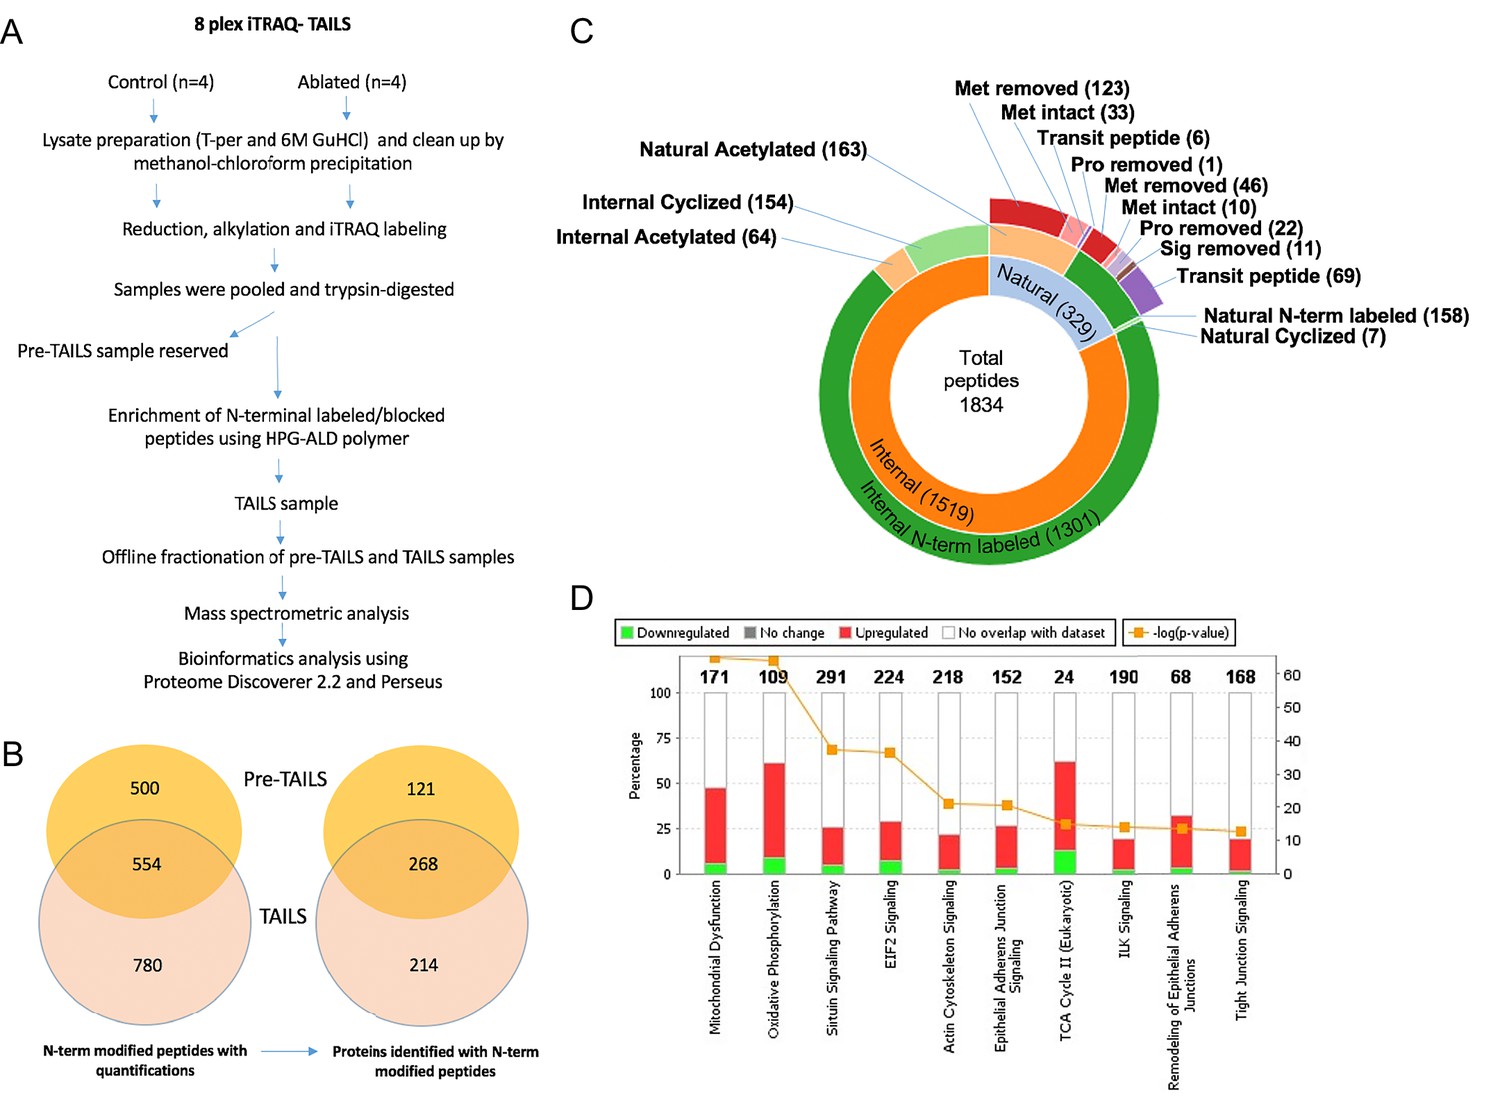
N-terminomics of whole ventricle tissue.
(A) Proteolytic changes were determined by 8-plex isobaric tags for relative and absolute quantitation (iTRAQ)-terminal amine isotopic labeling of substrates (TAILS) N-terminomics on whole heart tissue using the illustrated workflow. (B) A Venn diagram illustrating the overall yield of N-terminally blocked/labeled peptides from the pre-TAILS and TAILS samples and the corresponding number of proteins they originated from. Of 1834 N-terminally blocked/labeled peptides, 780 were identified exclusively in TAILS demonstrating the value of excluding unblocked tryptic peptides by highly-branched polyglycerol aldehydes (HPG-ALD) polymer. (C) Sunburst plot displaying all N-termini from fibroblast-ablated and control ventricles. The plot shows the distribution of blocked natural N-termini and internal N-termini in the innermost ring. The middle ring shows that the majority of internal N-termini were experimentally labeled with iTRAQ, whereas only a minority were acetylated or cyclized, contrasting with natural N-termini. The outermost ring indicates the origins of the natural N-termini. Met: methionine; Pro: propeptide; Sig: signal peptide. (D) Pathway analysis of the N-terminome differences showing the top 10 canonical pathways differentially affected by fibroblast-ablation. Control: n=3; ablated: n=3.
Figure 3—figure supplement 3
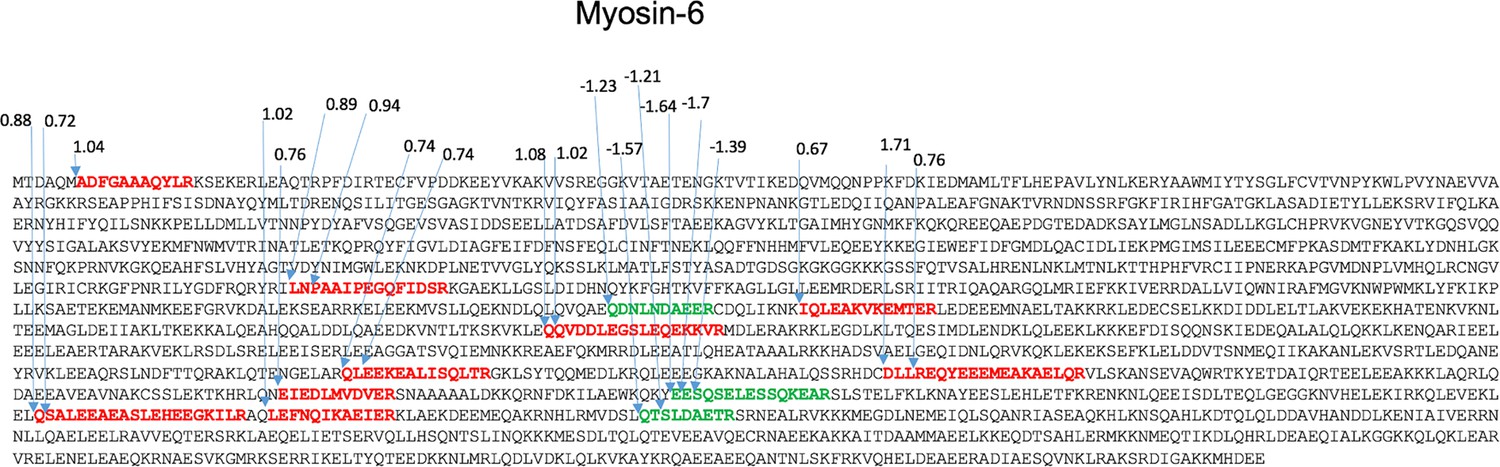
Potential proteolytically cleaved peptides mapped on myosin-6.
The sequence of myosin-6 showing the locations of the internal peptides identified and indicating the respective increase (red peptides) or decrease (green peptides) in 1092 ratios of control/ablated levels. See also Supplementary file 1c and d.
Figure 4 with 1 supplement
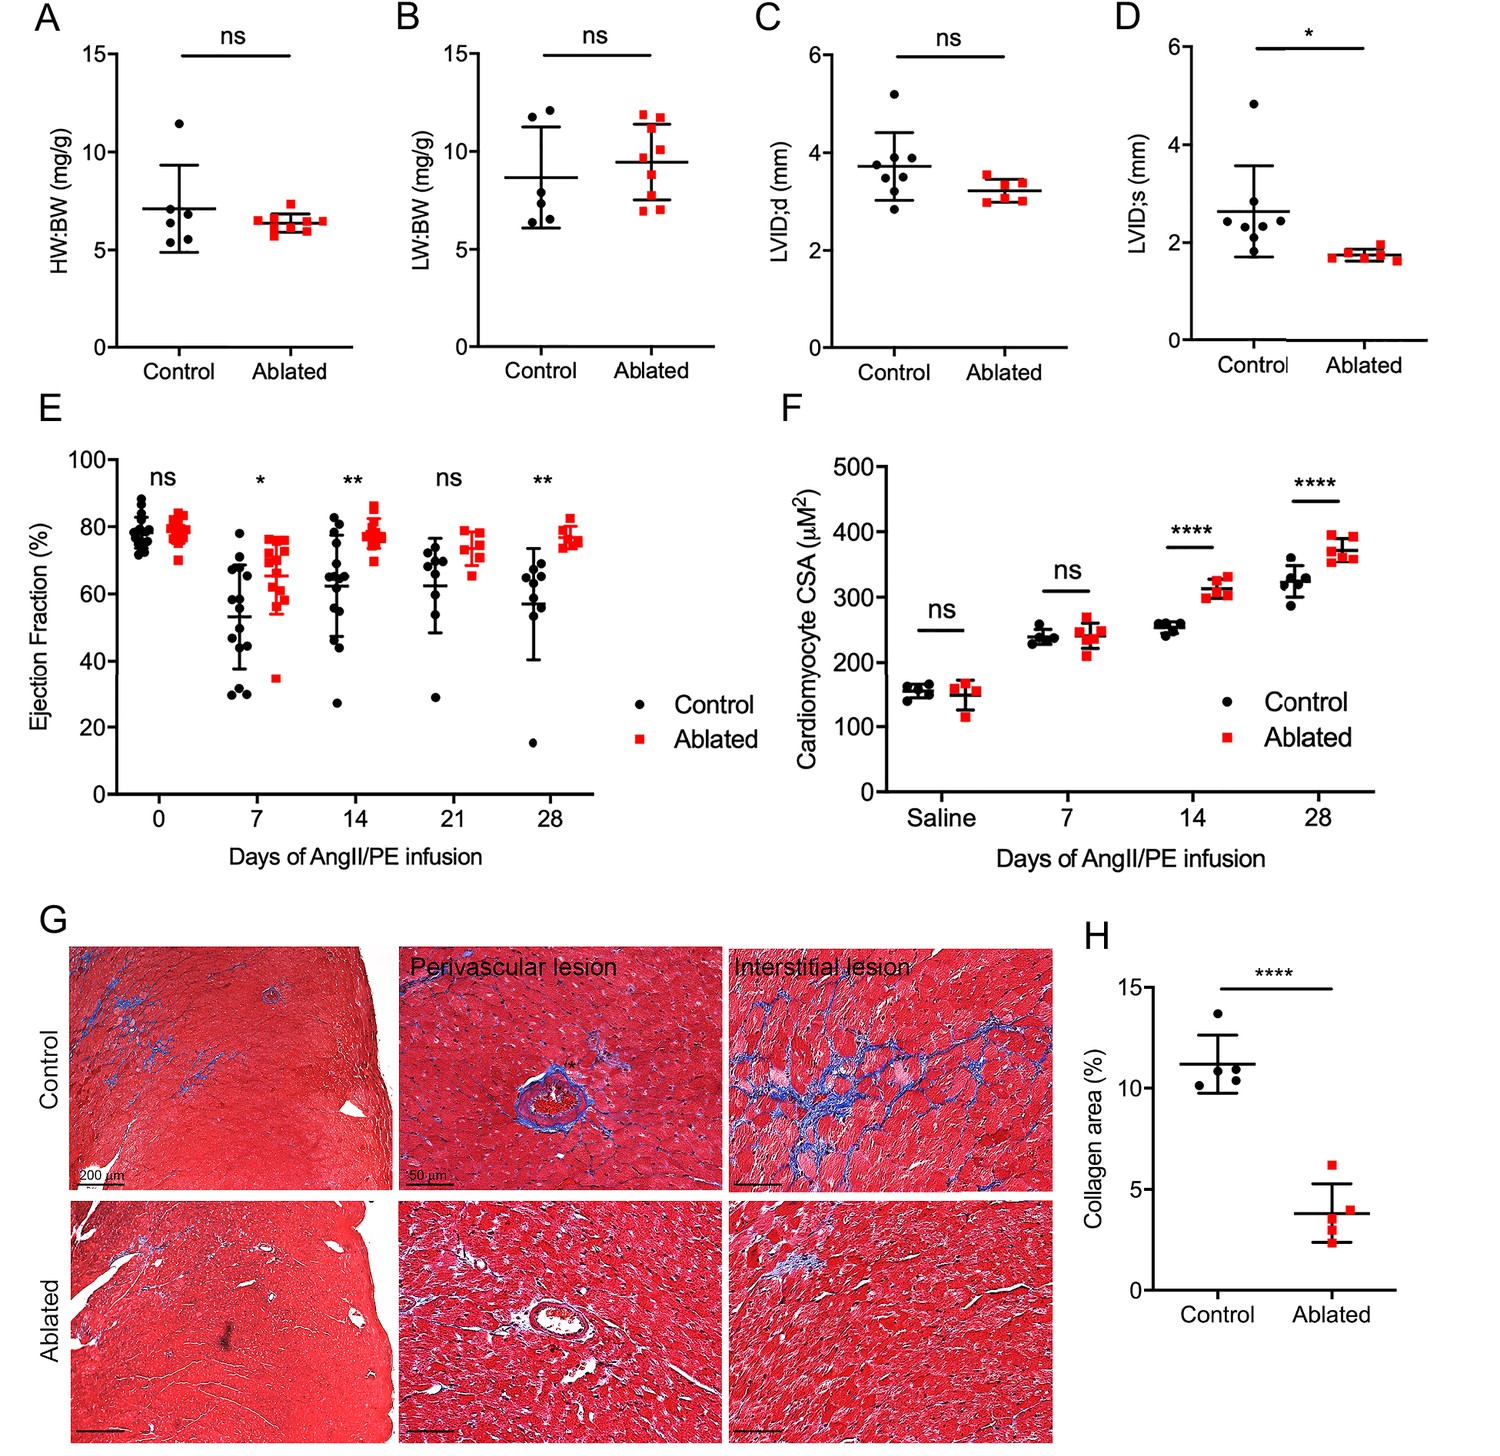
Effects of fibroblast loss on heart function and collagen accumulation after angiotensin II and phenylephrine (AngII/PE) infusion.
(A) Heart weight to body weight (HW:BW) ratio, (B) lung weight to body weight (LW:BW) ratio (control: n=6; ablated: n=9), (C) diastolic left ventricle internal diameter (LVID), and (D) systolic LVID (control: n=8; ablated: n=6) after 28 days of AngII/PE infusion. (E) Ejection fraction (EF; control: n=15, 15, 15, 9, 9; ablated: n=13, 13, 13, 6, 6 [baseline, 7, 14, 21, and 28 days AngII/PE, respectively]) and (F) cardiomyocyte cross-sectional area (CSA) after AngII/PE infusion (control: n=5, 5, 5, 6; ablated: n=4, 6, 5, 6 [baseline, 7, 14, and 28 days AngII/PE, respectively]). (G) Representative images of trichrome staining of the LV myocardium showing perivascular and interstitial regions after 28 days of AngII/PE infusion. (H) Quantification of percent collagen in control and ablated hearts. Control: n=5; ablated: n=5. (A–H) >7 weeks post-induction at the time of AngII/PE infusion. Results are mean ± SD. The EF results are mean ± SEM. Statistical significance was determined by an unpaired t-test. ns: not significant, p>0.05; *p≤0.05; **p≤0.01; ****p≤0.0001.
Figure 4—figure supplement 1
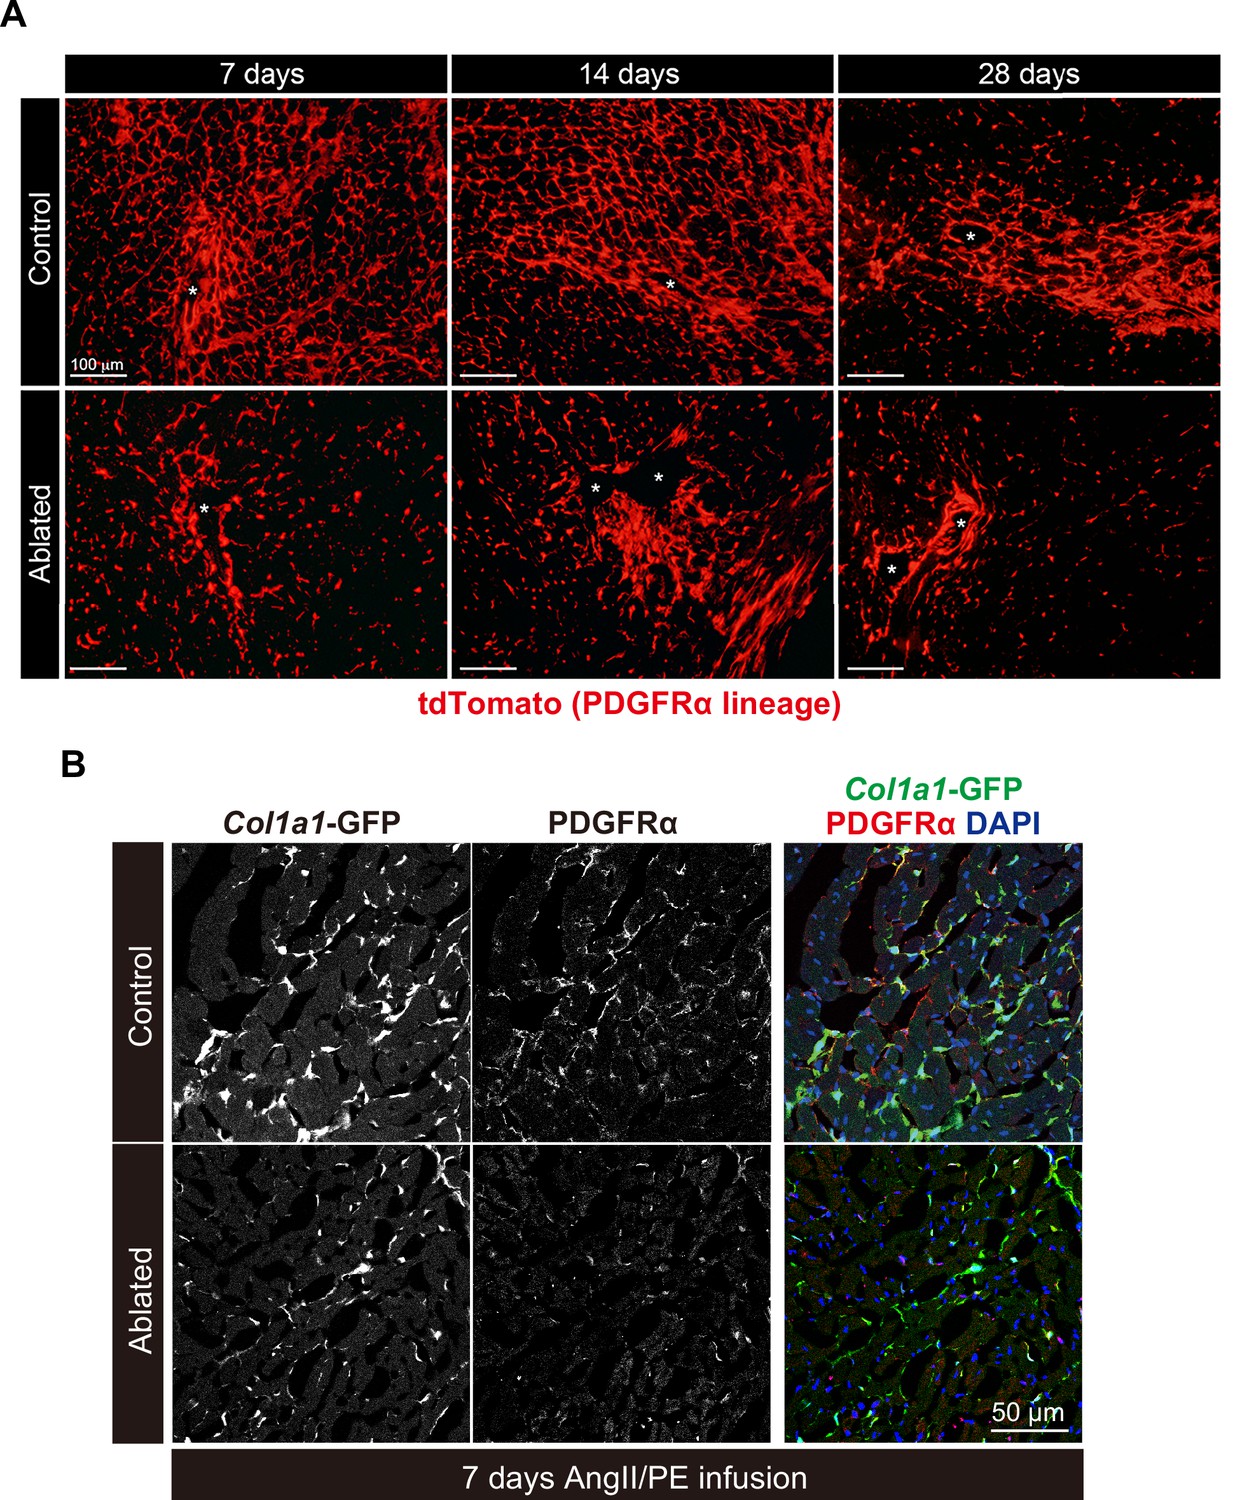
Fibroblast expansion after angiotensin II/phenylephrine (AngII/PE) infusion.
(A) PDGFRα cell expansion after Angll/PE infusion. Representative images of PDGFRα lineage cells in the left ventricular (LV) myocardium at 7, 14, and 28 days of Angll/PE infusion. Asterisks indicate blood vessels. Representative of control: n=3; ablated: n=3 at each timepoint. (B) Immunohistochemistry of PDGFRα at 7 days post-AngII/PE infusion. Representative of control: n=3; ablated: n=4.
Figure 5 with 1 supplement
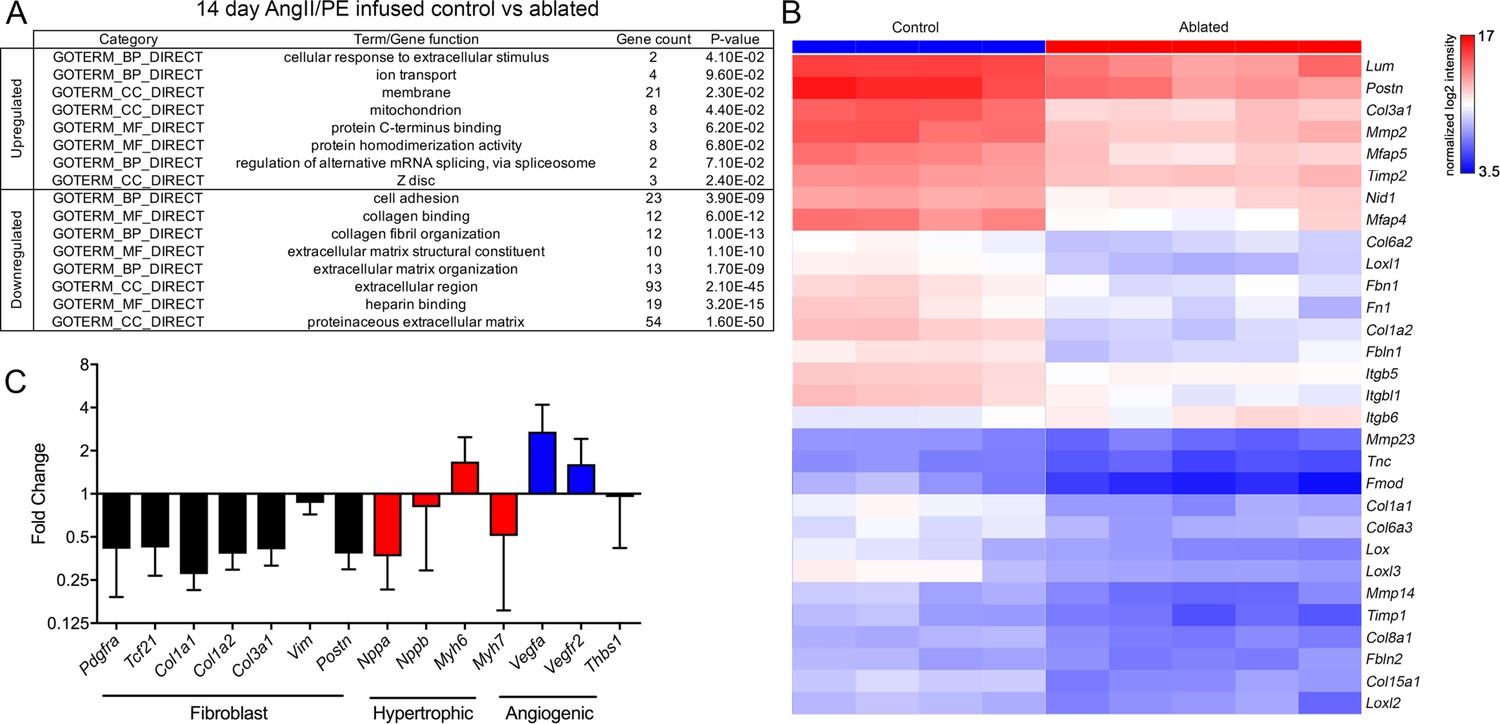
Differential gene expression after angiotensin II/phenylephrine (AngII/PE) infusion.
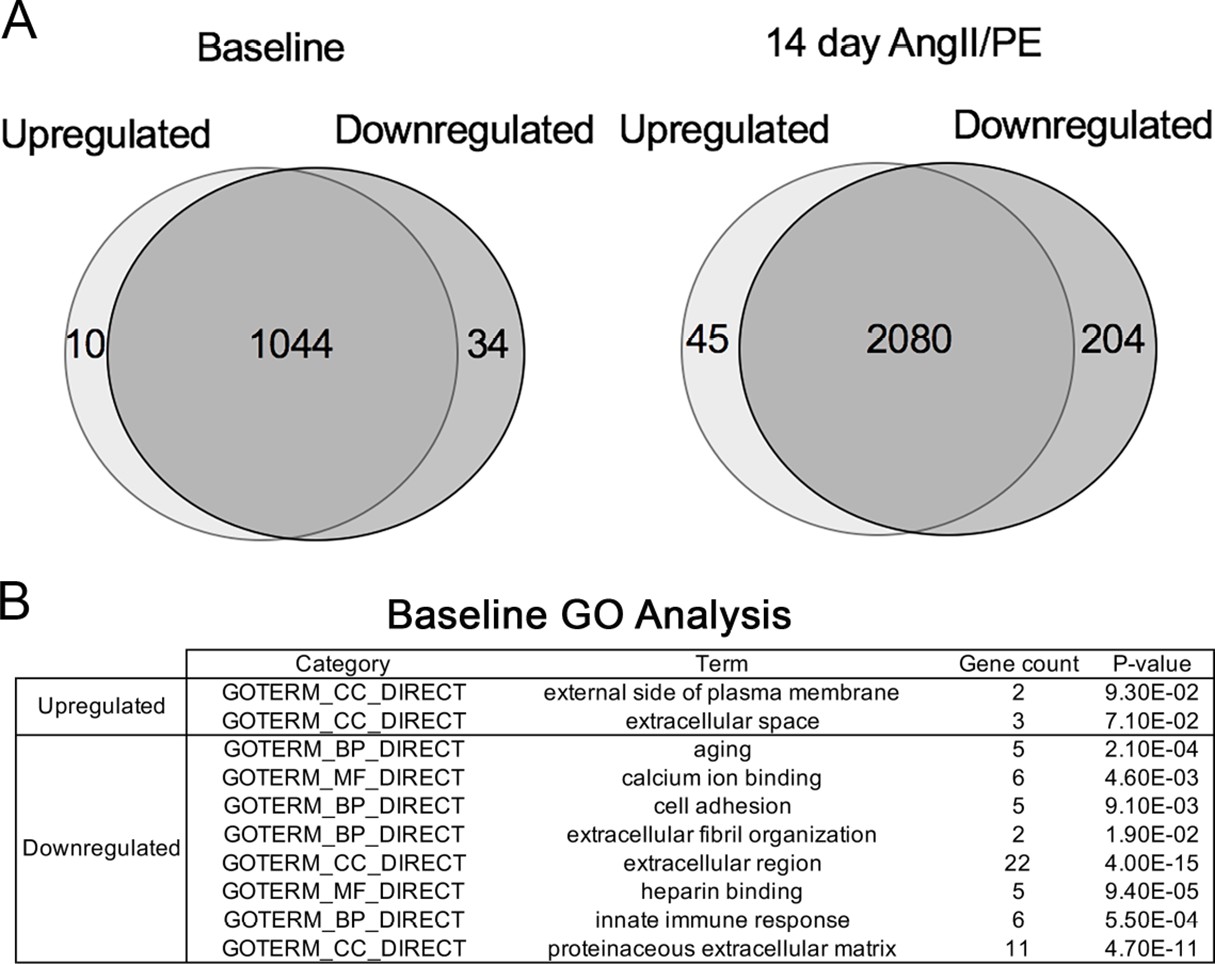
(A) Gene ontology (GO) analysis of differentially expressed genes between control and ablated hearts infused with AngII/PE for 14 days. All genes included had fold change values of log2 ≥2 or ≤–2 and p≤0.05. (B) Hierarchical clustering of extracellular matrix (ECM)-related genes differentially expressed in 14-day AngII/PE infused control and ablated. Control: n=4; ablated: n=5. (C) The qPCR analysis in whole ventricle tissue infused with 14 days of AngII/PE from ablated hearts compared to controls. The 18s was used as a housekeeping gene. Control: n=4; ablated: n=5. Results are mean ± SD.
Figure 5—figure supplement 1
Differentially expressed genes at baseline and after 14 days of angiotensin II/phenylephrine (AngII/PE) infusion.
(A) Venn diagrams of differentially expressed genes comparing ablated to controls at baseline (left) and after AngII/PE (right). (B) Gene ontology (GO) analysis of differentially expressed genes between control and ablated hearts at baseline (7weeks after induction). Control: n=4; ablated: n=5. All genes included had fold change values of log2 ≥2 or ≤2 and p≤0.05.
Figure 6
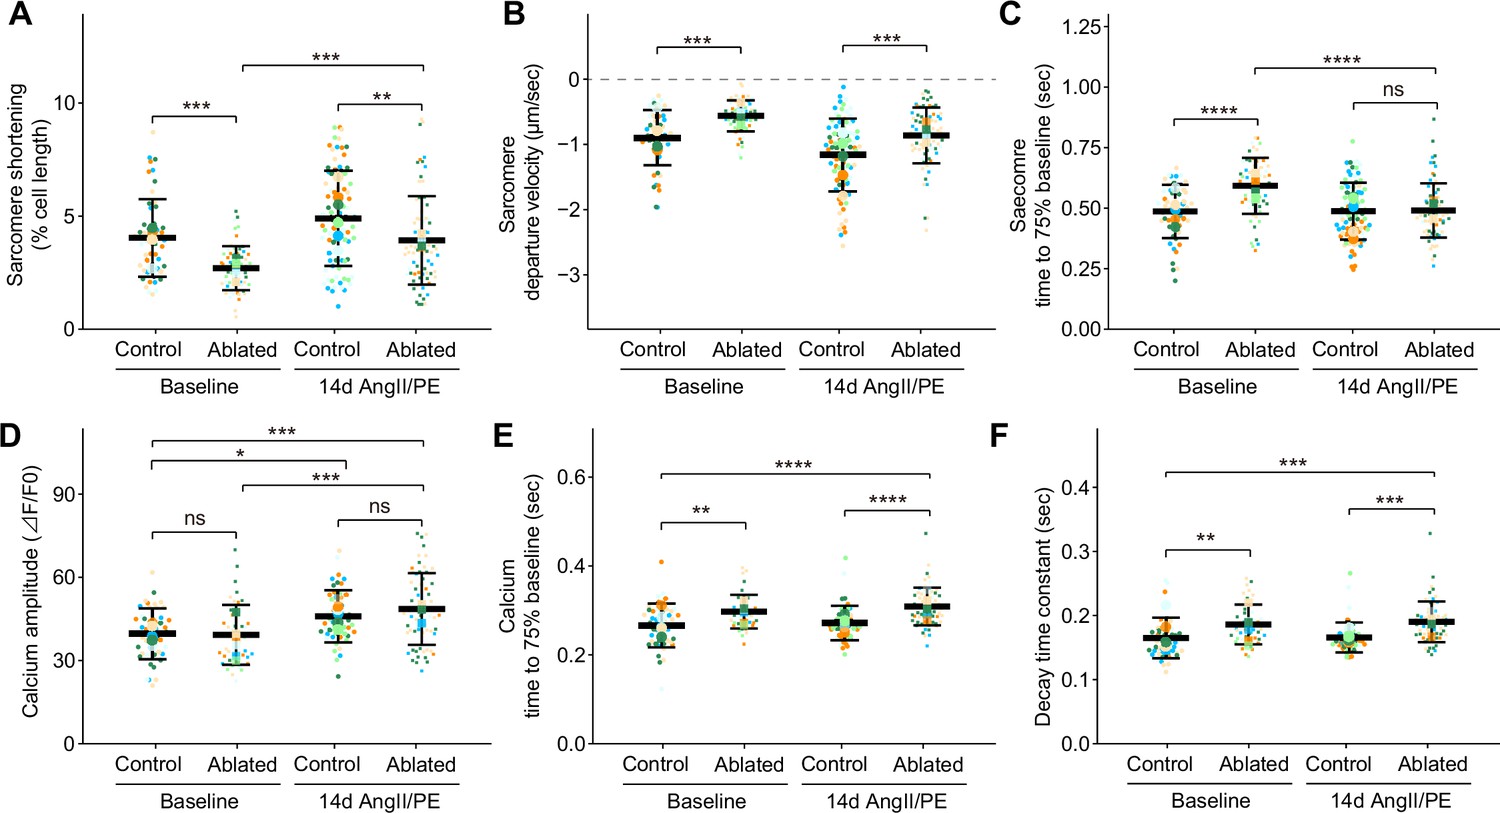
Cardiomyocyte contraction and calcium handling after fibroblast ablation.
Cardiomyocyte (A–C) contraction and (D–F) calcium-handling recording by edge detection from control and fibroblast-ablated hearts at baseline and after 14 days of angiotensin II/phenylephrine (AngII/PE) infusion. Small dots represent individual measurements and large dots mean values of each subject colored separately. Results are mean ± SD. Statistical significance was determined by a two-way ANOVA with Tukey’s test. Control: n=5, 6; ablated: n=6, 5 (baseline and AngII/PE, respectively). ns: not significant, p>0.05; *p≤0.05; **p≤0.01; ***p≤0.001; ****p≤0.0001.
Figure 7
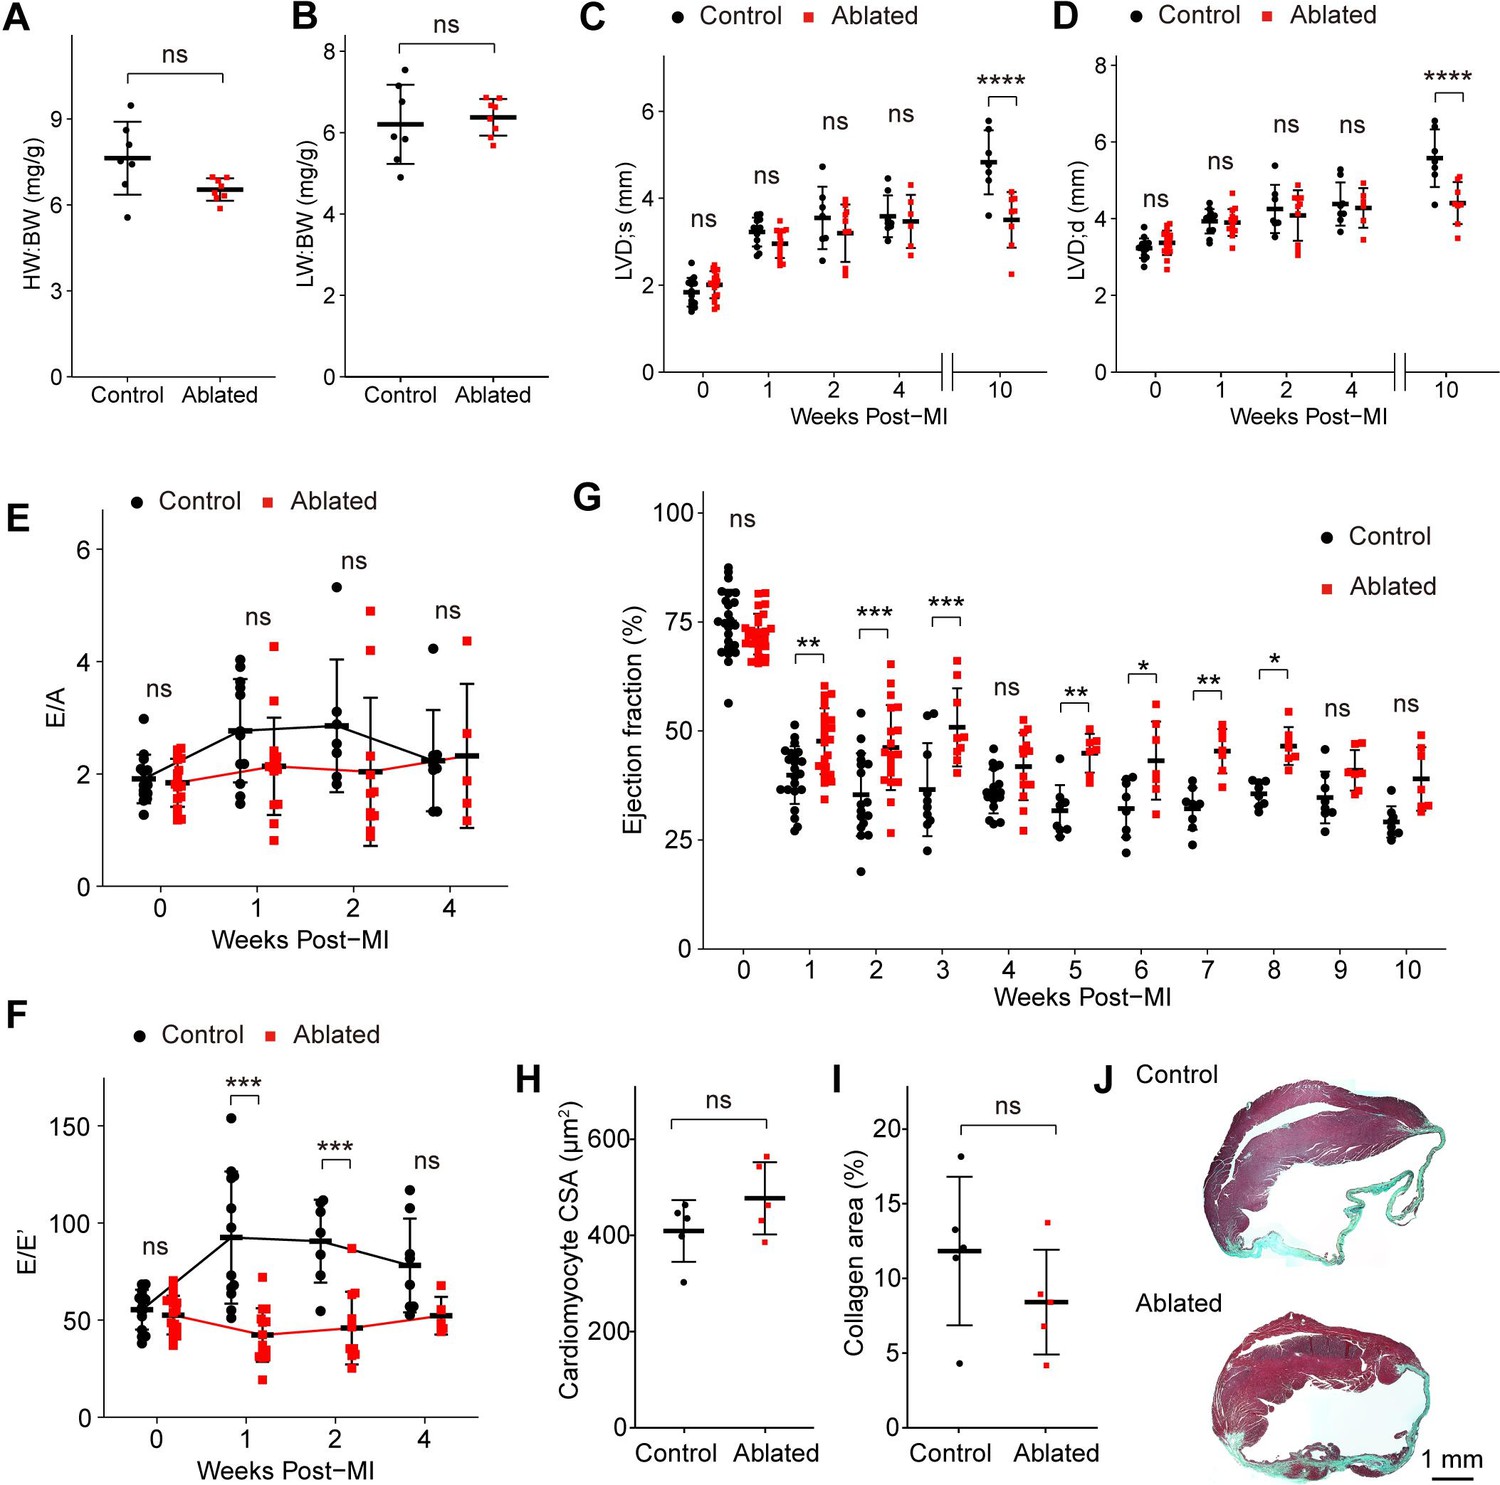
Key cardiac parameters and function after myocardial infarction (MI).
(A) Heart weight to body weight (HW:BW) ratio, (B) lung weight to body weight (LW:BW) ratio (control: n=7; ablated: n=8), (C) diastolic left ventricle internal diameter (LVID), and (D) systolic LVID at each timepoint post-MI. Control: n=14, 12, 7, 8, 7; ablated: n=17, 14, 10, 6, 8 (baseline, 1, 2, 4, and 10 weeks post-MI, respectively). Ratio between mitral E wave and A wave (E/A) and (F) E’ wave (E/E’) representing diastolic function. Control: n=14, 12, 7, 8; ablated: n=17, 14, 10, 6 (baseline, 1, 2, and 4 weeks post-MI, respectively). (G) The LV ejection fraction (EF) post-MI. Control: n=24, 22, 17, 10, 16, 8, 8, 8, 8, 8, 8; ablated: n=26, 23, 19, 9, 13, 7, 7, 7, 7, 7, 7 for each timepoint. (H) Cardiomyocyte cross-sectional area (CSA) 10 weeks post-MI. Control: n=5; ablated: n=5. (I) Quantification of percent collagen stained with Masson trichrome (control: n=5; ablated: n=5), and (J) representative images in control and ablated hearts. (A–J) >7 weeks post-induction at the time of ligation. Results are mean ± SD. Statistical significance was determined by an unpaired t-test (A–B, H–I), or two-way ANOVA (C–G). ns: not significant, p>0.05; *p≤0.05; **p≤0.01; ***p≤0.001; ****p≤0.0001.
Figure 8 with 1 supplement
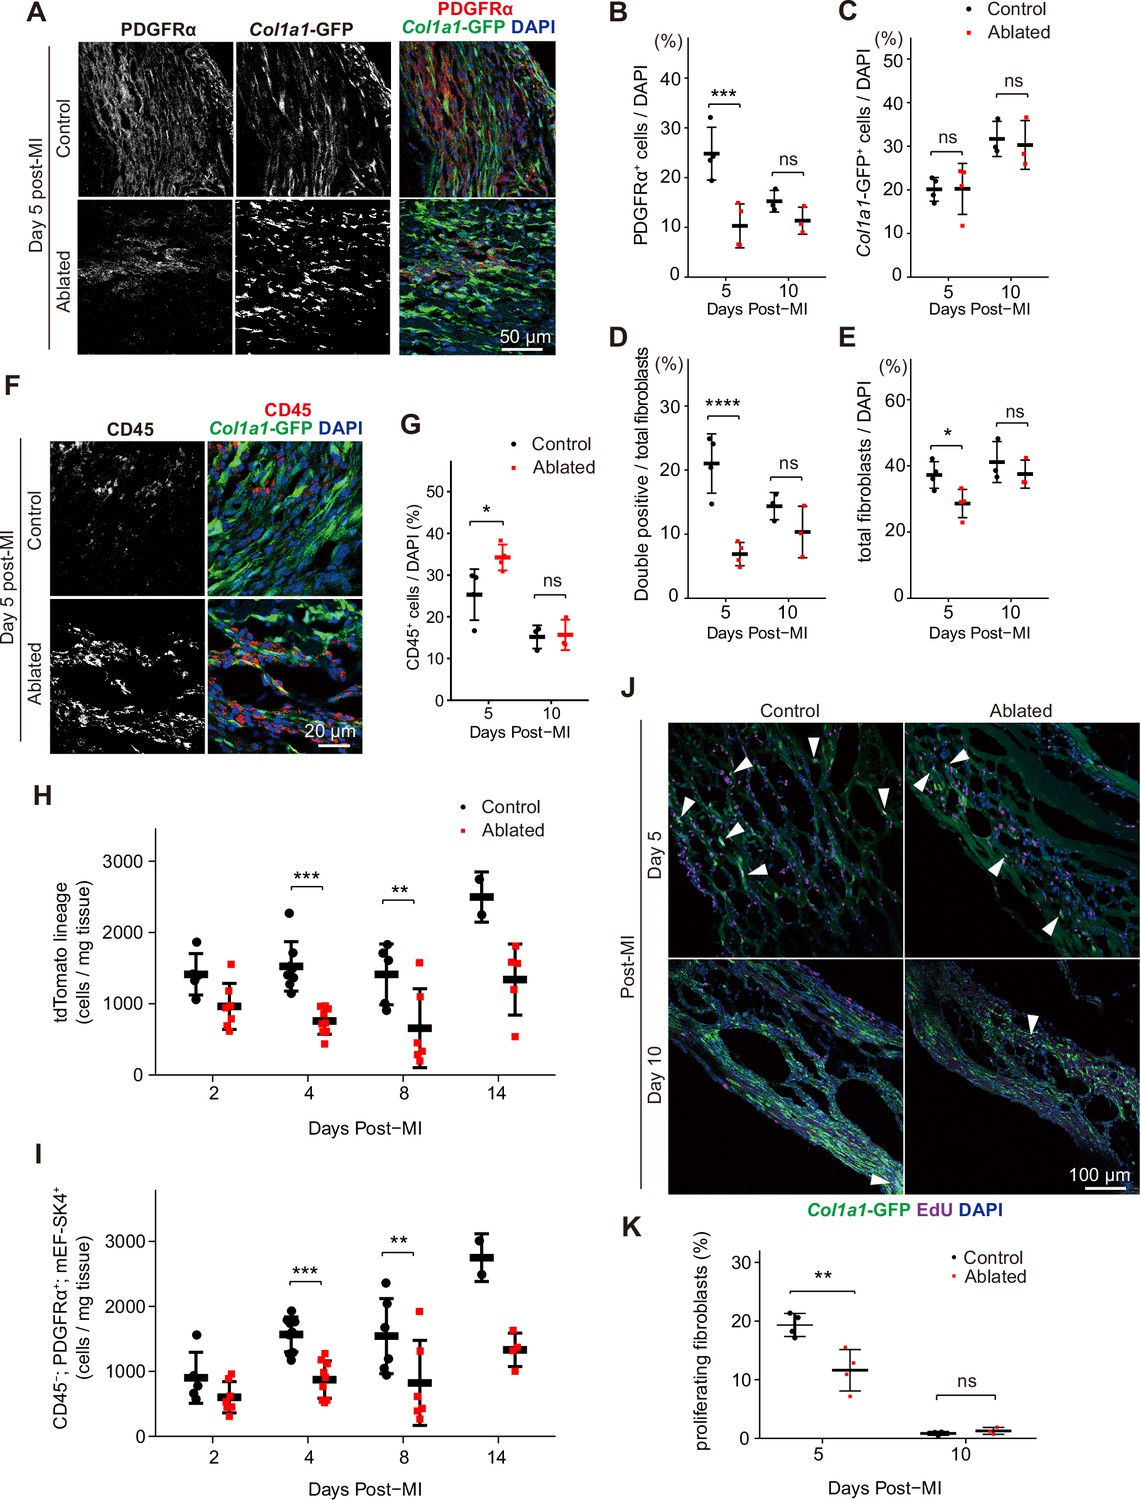
Fibroblast characterization after myocardial infarction (MI).
(A) Representative images of Col1a1-GFP and PDGFRα 5 days post-MI. (B–E) Quantification of indicated populations normalized to 4’,6-diamidino-2-phenylindole (DAPI)+ cells (B, C, E) or total fibroblasts within infarct areas (D). Total fibroblasts were calculated as the sum of single positive cells for PDGFRα or Col1a1-GFP and double positive cells. Control: n=4, 3; ablated: n=4, 3 (5 and 10 days post-MI, respectively). (F) Representative images of Col1a1-GFP and CD45 immunostaining at 5 days post-MI. (G) Quantification of CD45+ cells. Control: n=4, 3; ablated: n=4, 3 (5 and 10 days post-MI, respectively). (H–I) Quantification of (H) Pdgfralin (control: n=5, 8, 5, 2; ablated: n=7, 9, 6, 5 [2, 4, 8, and 14 days post-MI, respectively]) and (I) CD45-; PDGFRα+; mEF-SK4+(control: n=5, 9, 6, 2; ablated: n=7, 9, 6, 4 [2, 4, 8, and 14 days post-MI, respectively]) by flow cytometry at indicated time points post-MI from total ventricle tissue. (J) Representative images of Col1a1-GFP and EdU at indicated time points post-MI. White arrowheads indicate proliferating GFP+ fibroblasts. (K) Percentage of proliferating fibroblasts in GFP+ fibroblasts. Control: n=4, 3; ablated: n=4, 3 (5 and 10 days post-MI, respectively). Statistical significance was determined by a two-way ANOVA with the Tukey’s test (B–E, G, H, I, K). ns: not significant, p>0.05; *p≤0.05; **p≤0.01; ***p≤0.001; ****p≤0.0001.
Figure 8—figure supplement 1
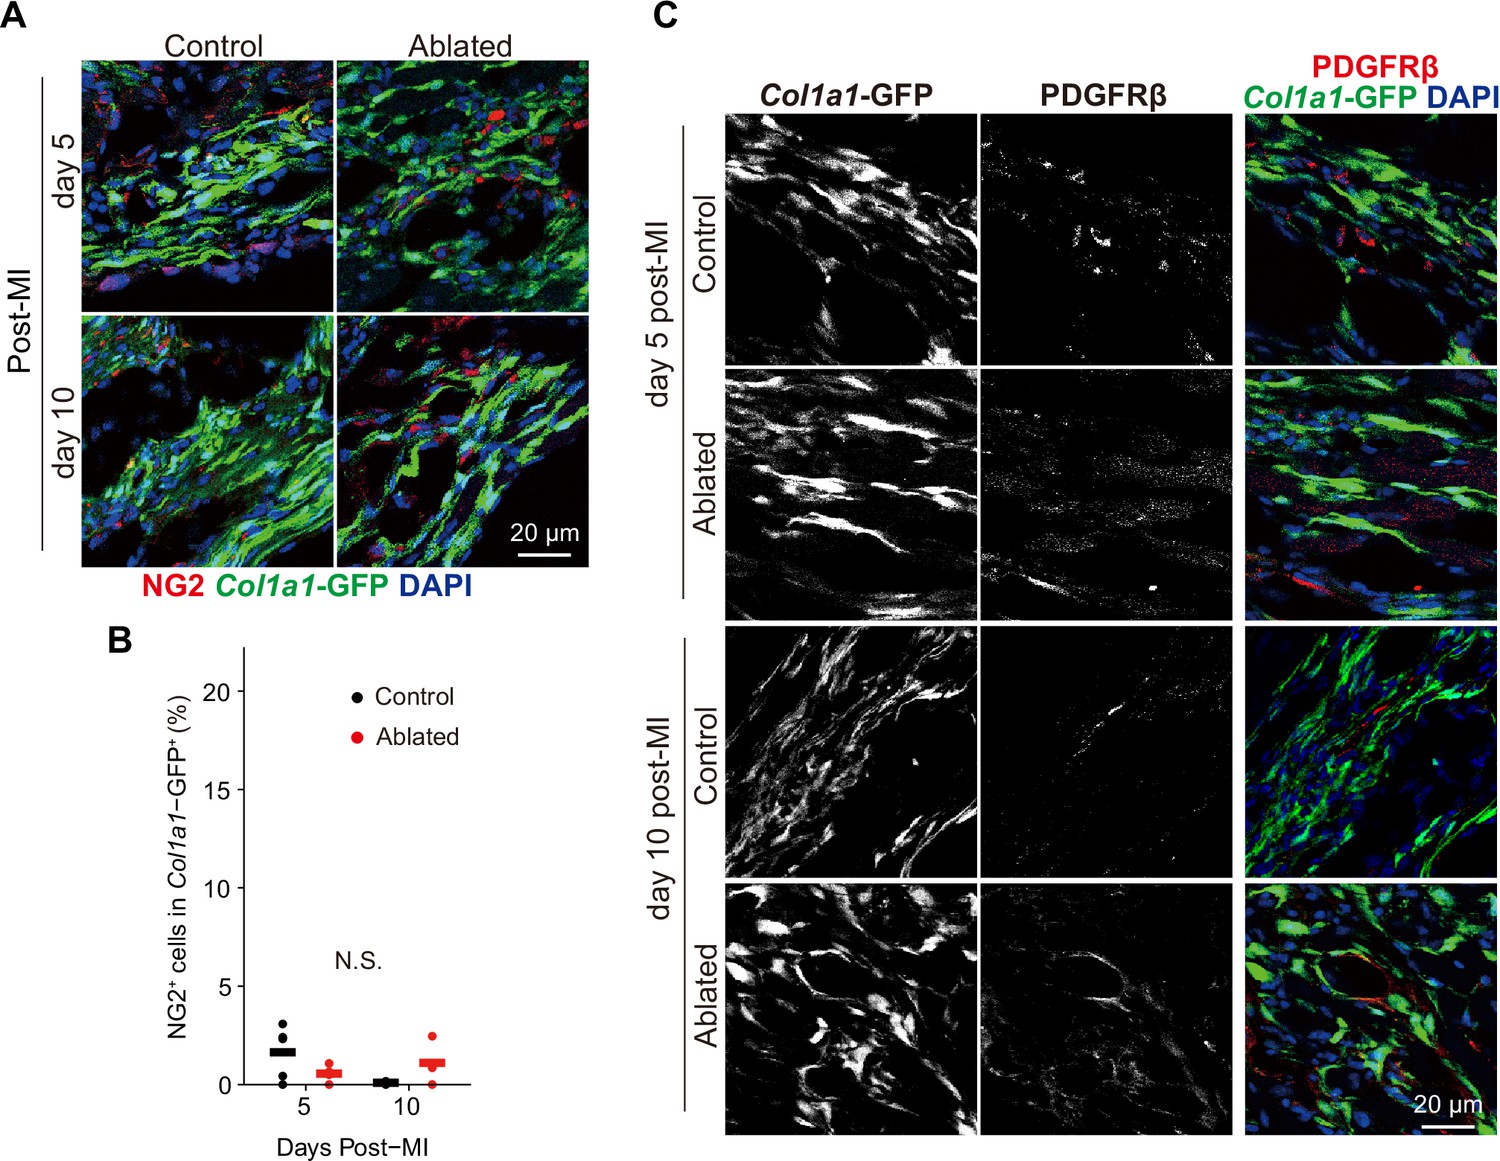
Mural cell contribution after myocardial infarction (MI) (A, B) Chondroitin sulfate proteoglycan 4 (CSPG4/NG-2) and (C) PDGFRβ lineage expansion at the indicated time points.
Representative of immunostaining images are shown in A and C. Control: n=4, 3; ablated: n=4, 3 (5 and10 days post-MI, respectively). Statistical significance was determined by a two-way ANOVA with the Tukey’s test. ns: not significant.
Additional files
-
Supplementary file 1
Supplementary tables.
(a) PDGFRβ+ population in Col1a1-GFP+ cells counted by flow cytometry. (b) Metabolic blood panel. (c) Potential proteolytically cleaved (internal) peptides with statistically significant higher abundance in control hearts. (d) Potential proteolytically cleaved peptides with statistically significant higher abundance in fibroblast-ablated hearts. Eghbali et al., 1988 (e) Efficiency of Pdgfra deletion determined for each experiment (expressed as the percent of cells deleted). (f) Cell-specific reagents for tissue/cell staining. (g) Primers used for qRT-PCR.
- https://cdn.elifesciences.org/articles/69854/elife-69854-supp1-v2.docx
-
MDAR checklist
- https://cdn.elifesciences.org/articles/69854/elife-69854-mdarchecklist1-v2.pdf
Download links
A two-part list of links to download the article, or parts of the article, in various formats.
Downloads (link to download the article as PDF)
Open citations (links to open the citations from this article in various online reference manager services)
Cite this article (links to download the citations from this article in formats compatible with various reference manager tools)
Consequences of PDGFRα+ fibroblast reduction in adult murine hearts
eLife 11:e69854.
https://doi.org/10.7554/eLife.69854


