Thrombopoietin from hepatocytes promotes hematopoietic stem cell regeneration after myeloablation
- Columbia Stem Cell Initiative, Columbia University Medical Center, United States
- Department of Rehabilitation and Regenerative Medicine, Columbia University Medical Center, United States
- Department of Microbiology and Immunology, Columbia University Medical Center, New York, United States, United States
Figures
Figure 1 with 2 supplements
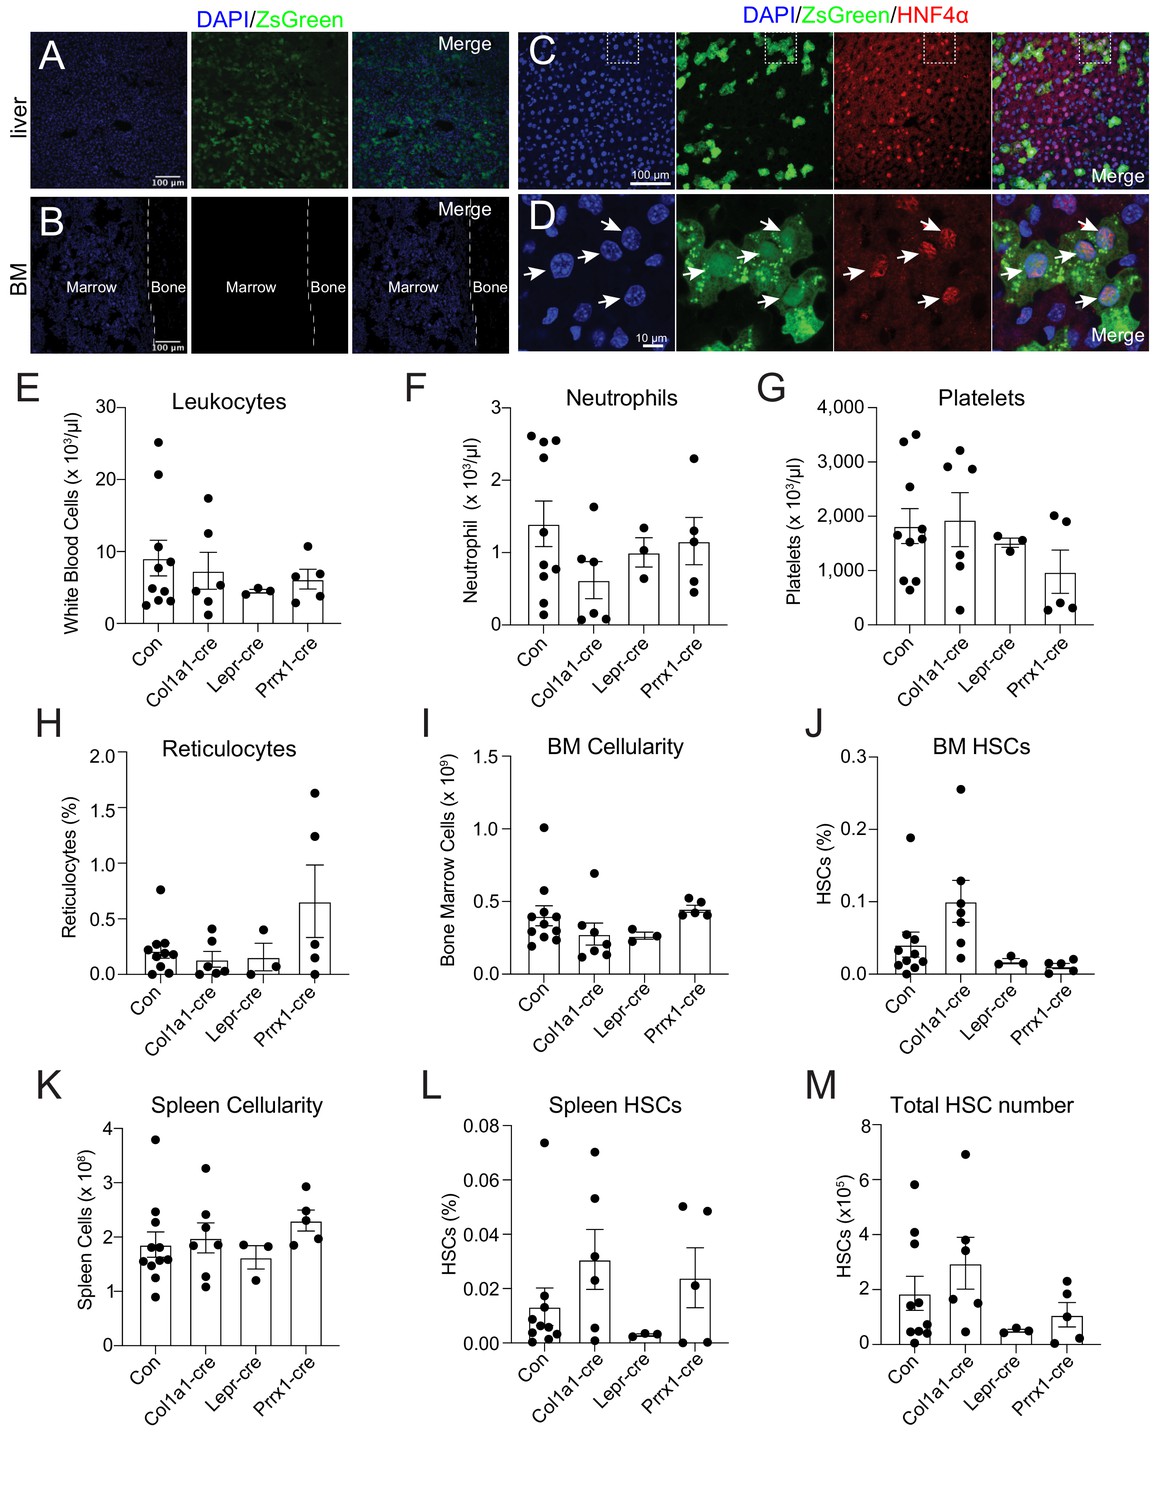
Bone marrow thrombopoietin (THPO) is not required for hematopoietic recovery and hematopoietic stem cell (HSC) expansion after 5-fluorouracil (5-FU) chemoablation.
(A) Confocal images of liver sections from tamoxifen-treated ThpocreER; Rosa26LSL-ZsGreen mice 10 days after 5-FU injection. (B) Confocal images of femur sections from tamoxifen-treated ThpocreER; Rosa26LSL-ZsGreen mice 10 days after 5-FU injection. (C and D) Confocal images showing immunostaining of HNF4α on liver sections from tamoxifen-treated ThpocreER; Rosa26LSL-ZsGreen mice 10 days after 5-FU injection. (D) Enlarged image of the region denoted in C. Arrows point to individual HNF4α+ hepatocytes. (E–H) Blood counts of mice with Thpo conditionally deleted from osteoblasts (Col1a1-cre), bone marrow stromal cells (Lepr-cre), or both (Prrx1-cre), and controls after 5-FU challenge. n = 3–10 mice. (I–L) Cellularity and frequencies of HSCs in the bone marrow and spleens from mice with Thpo conditionally deleted from osteoblasts, bone marrow stromal cells, or both, and controls after 5-FU challenge. n = 3–11 mice. (M) Total numbers of HSCs in the bone marrow and spleens from mice with Thpo conditionally deleted from osteoblasts, bone marrow stromal cells, or both, and controls after 5-FU challenge. n = 3–10 mice. Con: Thpogfp/+ control mice. Col1a1-cre: Col1a1-cre; Thpofl/gfp mice. Lepr-cre: Leprcre; Thpofl/gfp mice. Prrx1-cre: Prrx1-cre; Thpofl/gfp mice. Data represent mean ± SEM. Statistical significance was calculated with one-way ANOVA with Dunnett’s test. Each dot represents one independent mouse in E–M.
-
Figure 1—source data 1
Numerical values of the data plotted in panels E-M.
- https://cdn.elifesciences.org/articles/69894/elife-69894-fig1-data1-v2.xlsx
Figure 1—figure supplement 1
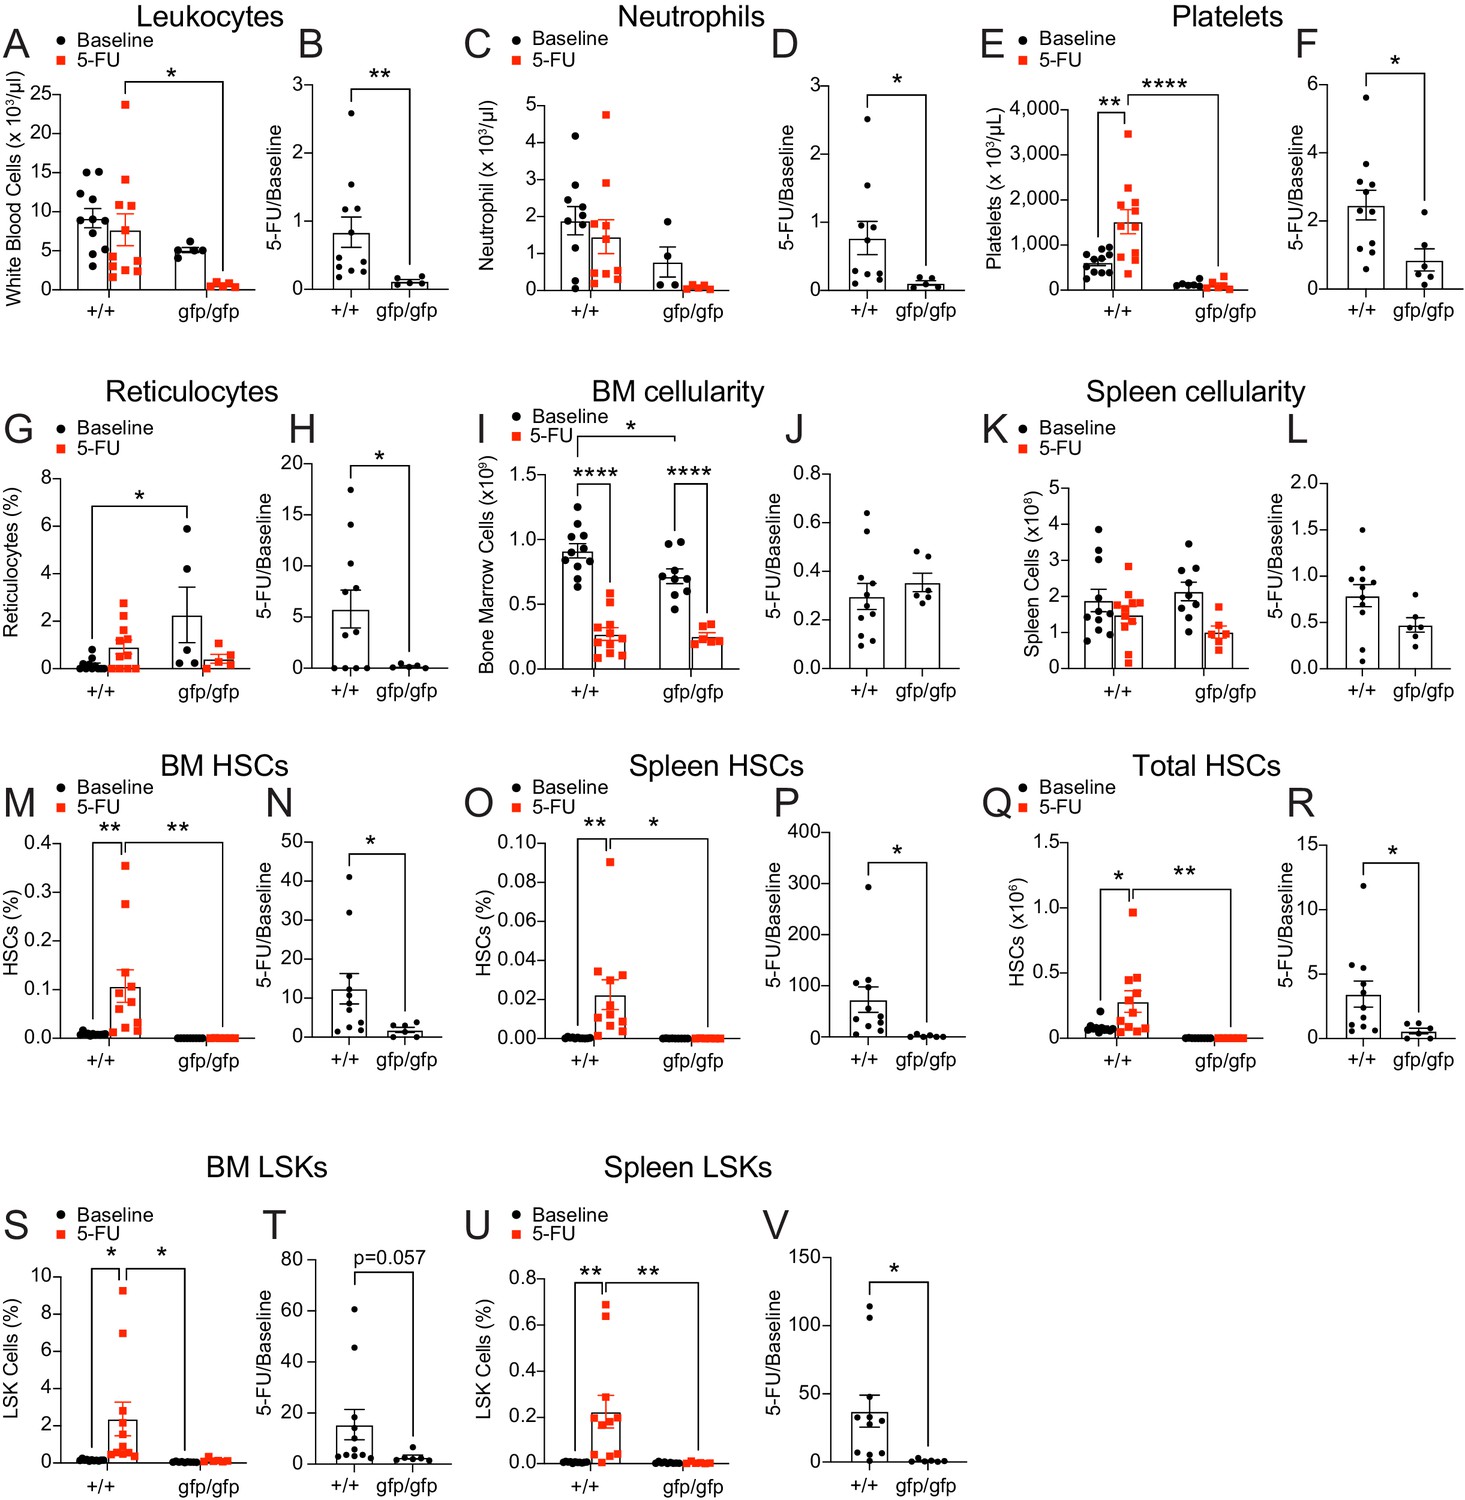
Hematopoietic recovery and hematopoietic stem cell (HSC) expansion after chemoablation with 5-fluorouracil (5-FU) depend on thrombopoietin (THPO).
(A–H) Blood cell counts of wild-type and Thpogfp/gfp mice with and without 5-FU challenge. Normalized fold changes (relative to no 5-FU challenge baseline) are also shown. n = 4–11 mice.(I–L) Bone marrow and spleen cellularity of wild-type and Thpogfp/gfp mice with and without 5-FU challenge. Normalized fold changes (relative to no 5-FU challenge baseline) are also shown. n = 6–11 mice. (M–P) Frequencies of HSCs (LSKCD150+CD48-) in the bone marrow and spleens of wild-type and Thpogfp/gfp mice with and without 5-FU challenge. Normalized fold changes (relative to no 5-FU challenge baseline) are also shown. n = 6–11 mice. (Q and R) Total numbers of HSCs in the bone marrow and spleens of wild-type and Thpogfp/gfp mice with and without 5-FU challenge. Normalized fold changes (relative to no 5-FU challenge baseline) are also shown. n = 6–11 mice. (S–V) Frequency of hematopoietic progenitors (LSK) in the bone marrow and spleens of wild-type and Thpogfp/gfp mice with and without 5-FU challenge. Normalized fold changes (relative to no 5-FU challenge baseline) are also shown. n = 6–11 mice. Data represent mean ± SEM. *p < 0.05, **p < 0.01, ****p < 0.0001. Statistical significance was assessed with two-way ANOVA with Turkey’s test or Student’s t-test. Dots represent independent mice.
-
Figure 1—figure supplement 1—source data 1
Numerical values of the data plotted in panels A-V.
- https://cdn.elifesciences.org/articles/69894/elife-69894-fig1-figsupp1-data1-v2.xlsx
Figure 1—figure supplement 2
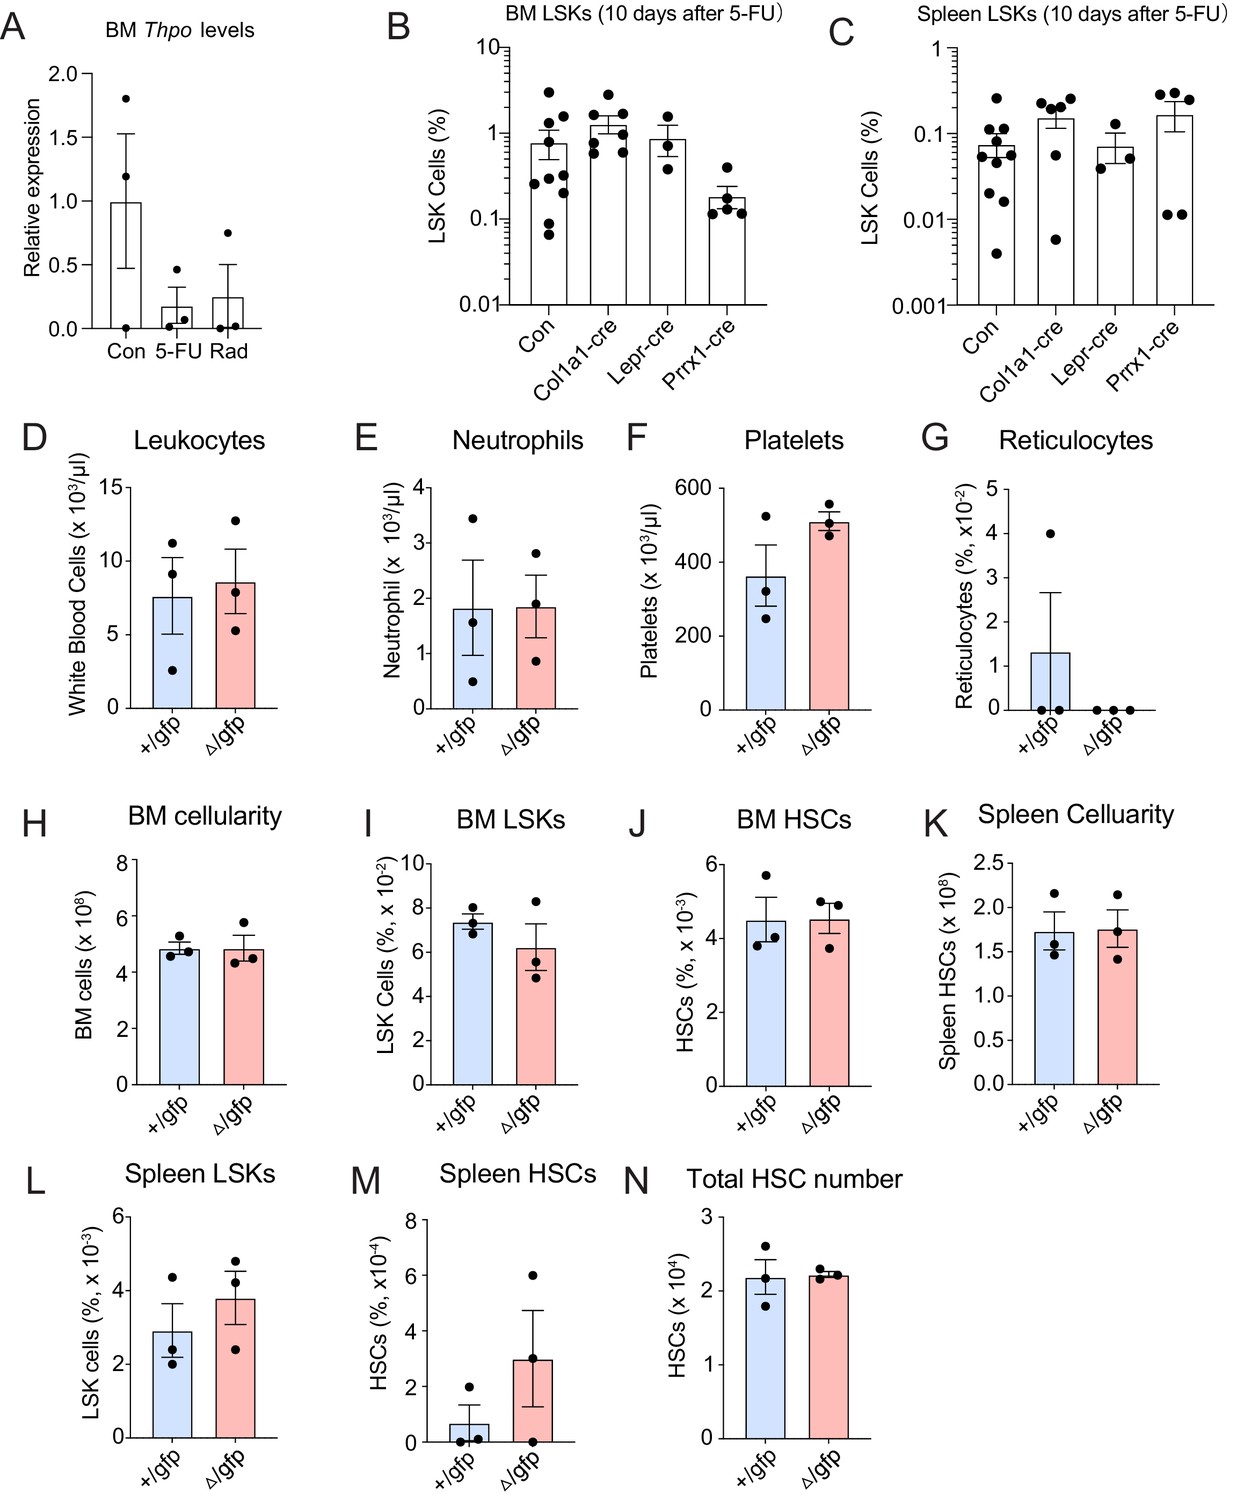
Hematopoietic progenitor expansion after 5-fluorouracil (5-FU) chemoablation does not depend on bone marrow thrombopoietin (THPO) and THPO from bone marrow Prrx1+ mesenchymal cells is dispensable for thrombopoiesis and hematopoietic stem cell (HSC) maintenance.
(A) Relative expression of Thpo transcripts in bone marrow stromal cells 14 days after 5-FU treatment or irradiation. n = 3 mice for each condition. (B and C) Frequencies of LSKs in the bone marrow and spleens from mice with Thpo conditionally deleted from osteoblasts, bone marrow stromal cells, or both, as well as controls after 5-FU challenge. n = 3–10 mice for each genotype. (D–G) Blood cell counts of Prrx1-cre; Thpofl/gfp (Δ/gfp) mice and Prrx1-cre; Thpo+/gfp (+/gfp) littermate controls. n = 3 mice for each genotype. (H–M) Cellularity and frequencies of LSKs and HSCs from the bone marrow and spleens of Prrx1-cre; Thpofl/gfp (Δ/gfp) mice and Prrx1-cre; Thpo+/gfp (+/gfp) littermate controls. n = 3 mice for each genotype. (N) Total HSC numbers from the bone marrow and spleens of Prrx1-cre; Thpofl/gfp (Δ/gfp) mice and Prrx1-cre; Thpo+/gfp (+/gfp) littermate controls. n = 3 mice for each genotype. Con: Thpogfp/+ control mice. Col1a1-cre: Col1a1-cre; Thpofl/gfp mice. Lepr-cre: Leprcre; Thpofl/gfp mice. Prrx1-cre: Prrx1-cre; Thpofl/gfp mice. Data represent mean ± SEM. Dots represent independent mice analyzed.
-
Figure 1—figure supplement 2—source data 1
Numerical values of the data plotted in panels A-N.
- https://cdn.elifesciences.org/articles/69894/elife-69894-fig1-figsupp2-data1-v2.xlsx
Figure 2 with 1 supplement

Hepatic thrombopoietin (THPO) is required for hematopoietic recovery and hematopoietic stem cell (HSC) expansion after 5-fluorouracil (5-FU) chemoablation.
(A–H) Cellularity and frequencies of HSCs (A, C, E, G) in the bone marrow and spleens from mice with Thpo conditionally deleted from hepatocytes (AAV) and controls, with and without 5-FU challenge. Normalized fold changes (relative to no 5-FU challenge baseline) (B, D, F, H) are also shown. n = 4–11 mice. (I and J) Total numbers of HSCs (I) in the bone marrow and spleens from mice with Thpo conditionally deleted from hepatocytes and controls, with and without 5-FU challenge. Normalized fold changes (relative to no 5-FU challenge baseline) (J) are also shown. n = 4–11 mice. (K) Numbers of total recipients and long-term multilineage reconstituted recipients after transplantation of 50,000 bone marrow cells from PBS- or AAV-treated Thpofl/fl and 5-FU challenged mice along with 500,000 unchallenged competitor bone marrow cells. Recipients were scored as reconstituted if they showed donor-derived myeloid, B and T cells in the peripheral blood 16 weeks after transplantation. Data were from recipients of three independent donor pairs from two independent experiments. PBS: PBS-treated Thpofl/fl or wild-type control mice. AAV: AAV8-TBG-cre-treated Thpofl/fl mice. Data represent mean ± SEM. *p < 0.05, **p < 0.01, ****p < 0.0001. Statistical significance was assessed with two-way ANOVA with Turkey’s test (A, C, E, G, I), Student’s t-test (B, D, F, H, J), or Fisher’s exact test (K). Each dot represents one independent mouse in A–J.
-
Figure 2—source data 1
Numerical values of the data plotted in panels A-J.
- https://cdn.elifesciences.org/articles/69894/elife-69894-fig2-data1-v2.xlsx
Figure 2—figure supplement 1
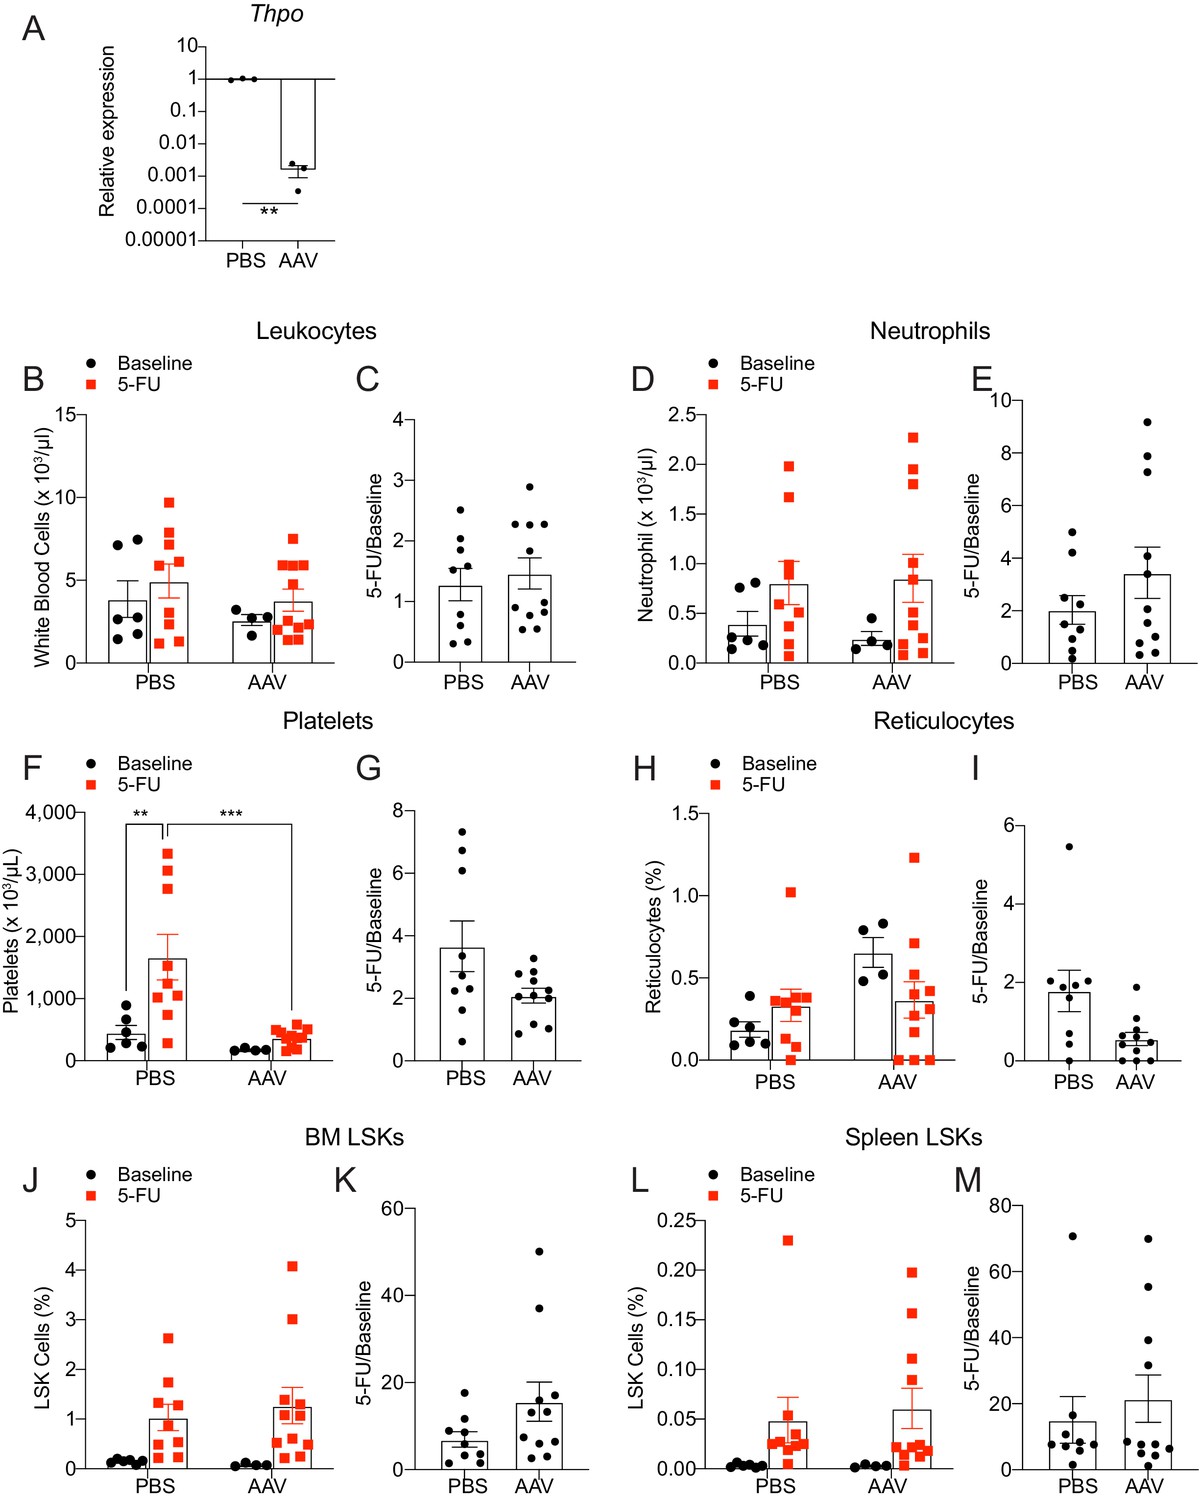
Limited impact of acute Thpo deletion from hepatocytes on leukocytes and hematopoietic progenitors after 5-fluorouracil (5-FU) treatment.
(A) Relative expression of Thpo transcripts in the liver from Thpofl/fl mice treated with PBS or AAV8-TBG-cre. n = 3 mice for each condition. (B–I) Blood cell counts in mice with Thpo conditionally deleted from hepatocytes and controls with and without 5-FU challenge. Normalized fold changes (relative to no treatment baseline) are also shown. n = 4–11 mice. (J–M) Frequencies of bone marrow and spleen hematopoietic progenitors (LSK) in AAV8-TBG-cre-treated and control mice with and without 5-FU challenge. Normalized fold changes (relative to no 5-FU challenge baseline) are also shown. n = 4–11 mice. PBS: PBS-treated Thpofl/fl or wild-type control mice. AAV: AAV8-TBG-cre-treated Thpofl/fl mice. Data represent mean ± SEM. **p < 0.01, ***p < 0.001. Statistical significance was assessed with two-way ANOVA with Turkey’s test or Student’s t-test.
-
Figure 2—figure supplement 1—source data 1
Numerical values of the data plotted in panels A-M.
- https://cdn.elifesciences.org/articles/69894/elife-69894-fig2-figsupp1-data1-v2.xlsx
Figure 3 with 2 supplements

Bone marrow thrombopoietin (THPO) is not required for hematopoietic recovery from irradiation.
(A) Confocal images of liver sections from tamoxifen-treated ThpocreER; Rosa26LSL-ZsGreen mice 10 days after irradiation. (B) Confocal images of femur sections from tamoxifen-treated ThpocreER; Rosa26LSL-ZsGreen mice 10 days after irradiation. (C and D) Confocal images showing immunostaining of HNF4α on liver sections from tamoxifen-treated ThpocreER; Rosa26LSL-ZsGreen mice 10 days after irradiation. (D) Enlarged image of the region denoted in C. Arrows point to individual HNF4α+ hepatocytes. (E–H) Blood counts of mice with Thpo conditionally deleted from osteoblasts (Col1a1-cre), bone marrow stromal cells (Lepr-cre), or both (Prrx1-cre), and controls after irradiation. n = 3–10 mice. (I–L) Cellularity and frequencies of hematopoietic stem cells (HSCs) in the bone marrow and spleens from mice with Thpo conditionally deleted from osteoblasts, bone marrow stromal cells, or both, and controls after irradiation. n = 3–11 mice. (M) Total numbers of HSCs in the bone marrow and spleens from mice with Thpo conditionally deleted from osteoblasts, bone marrow stromal cells, or both, and controls after irradiation. n = 3–11 mice. Con: Thpogfp/+ control mice. Col1a1-cre: Col1a1-cre; Thpofl/gfp mice. Lepr-cre: Leprcre; Thpofl/gfp mice. Prrx1-cre: Prrx1-cre; Thpofl/gfp mice. Data represent mean ± SEM. Statistical significance was assessed with one-way ANOVA with Dunnett’s test. Each dot represents one independent mouse in E–M.
-
Figure 3—source data 1
Numerical values of the data plotted in panels E-M.
- https://cdn.elifesciences.org/articles/69894/elife-69894-fig3-data1-v2.xlsx
Figure 3—figure supplement 1
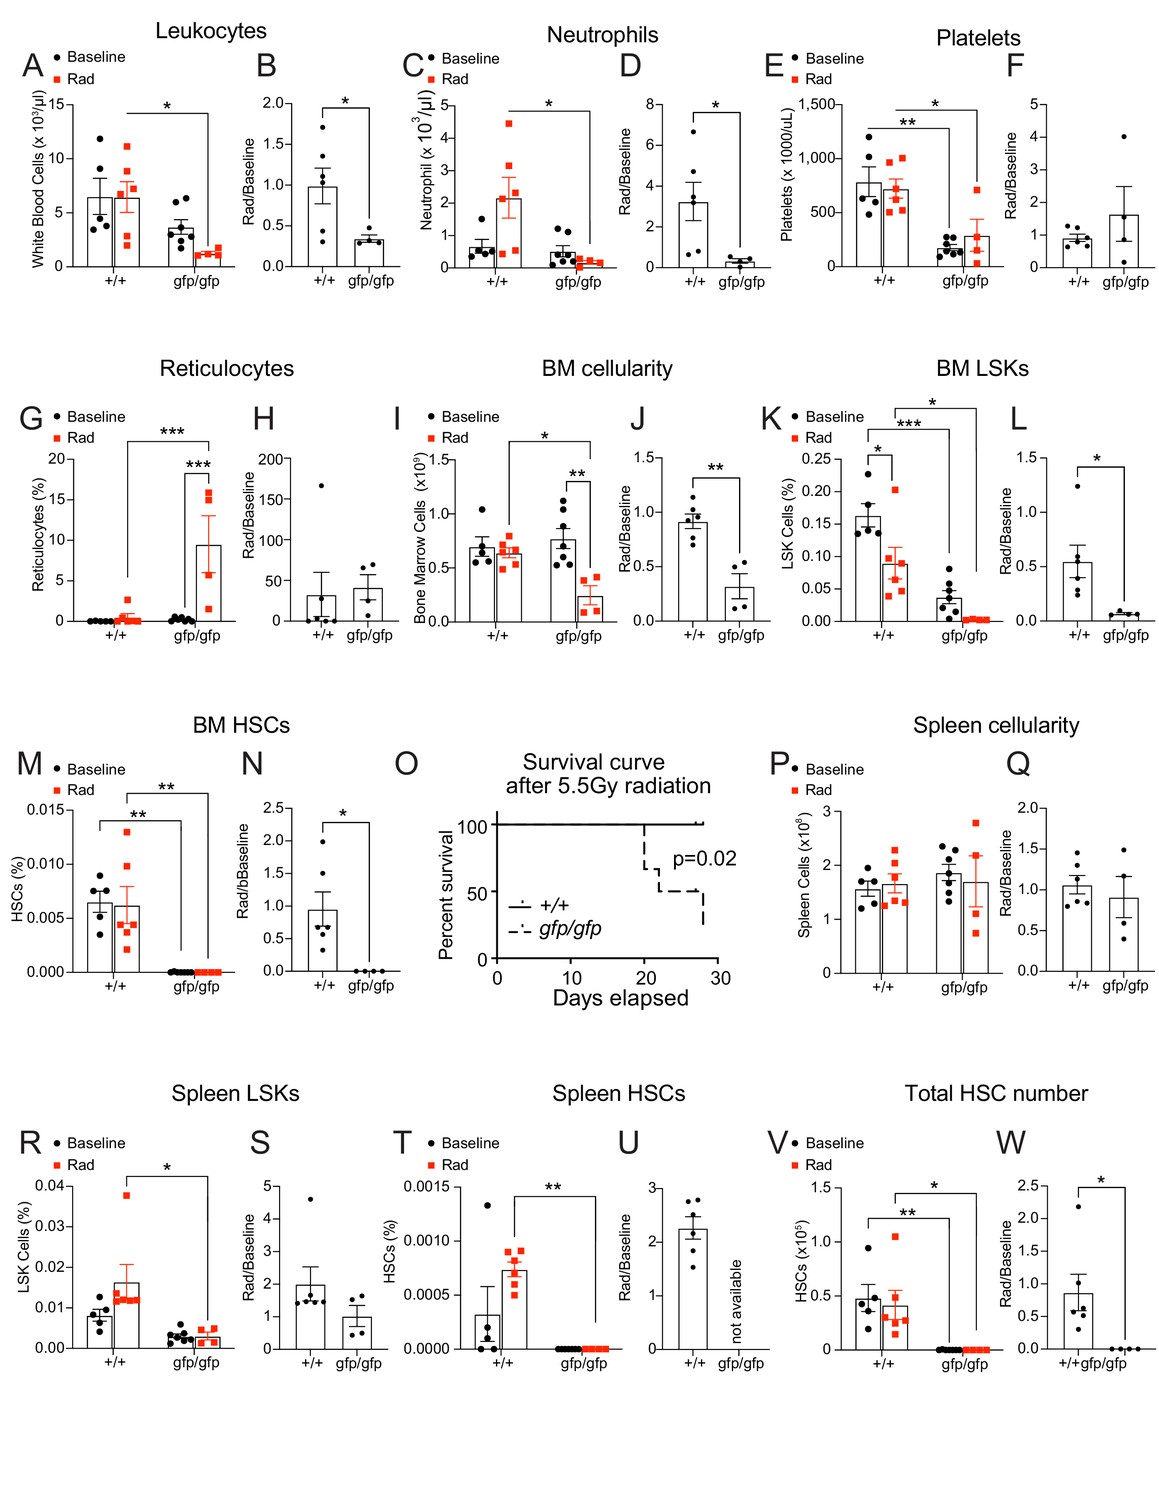
Hematopoietic recovery after irradiation depends on thrombopoietin (THPO).
(A–H) Blood cell counts of Thpo+/+ (+/+) and Thpogfp/gfp (gfp/gfp) mice with and without irradiation treatment. Normalized fold changes (relative to no irradiation baseline) are also shown. n = 4–7 mice for each genotype at each condition. (I and J) Bone marrow cellularity of +/+ and gfp/gfp mice with and without irradiation treatment. Normalized fold changes (relative to no irradiation baseline) are also shown. n = 4–7 mice for each genotype at each condition. (K–N) Frequencies of LSKs and hematopoietic stem cells (HSCs) in the bone marrow of +/+ and gfp/gfp mice with and without irradiation treatment. Normalized fold changes (relative to no irradiation baseline) are also shown. n = 4–7 mice for each genotype at each condition. (O) Survival curve of +/+ and gfp/gfp mice followed for 4 weeks after irradiation. n = 5–6 mice for each genotype. (P–U) Cellularity, frequencies of LSKs and HSCs of +/+ and gfp/gfp mice with and without irradiation treatment. Normalized fold changes (relative to no irradiation baseline) are shown as well. n = 4–7 mice. (V and W) Total HSC numbers in the bone marrow and spleens of +/+ and gfp/gfp mice with and without irradiation. Normalized fold changes (relative to no irradiation baseline) are shown as well. n = 4–7 mice. Data represent mean ± SEM. *p < 0.05, **p < 0.01, ***p < 0.001. Each dot represents one independent mouse. Statistical significance was assessed with two-way ANOVA with Turkey’s test, Log-rank (Mantel-Cox) test, or Student’s t-test.
-
Figure 3—figure supplement 1—source data 1
Numerical values of the data plotted in panels A-N and P-W.
- https://cdn.elifesciences.org/articles/69894/elife-69894-fig3-figsupp1-data1-v2.xlsx
Figure 3—figure supplement 2
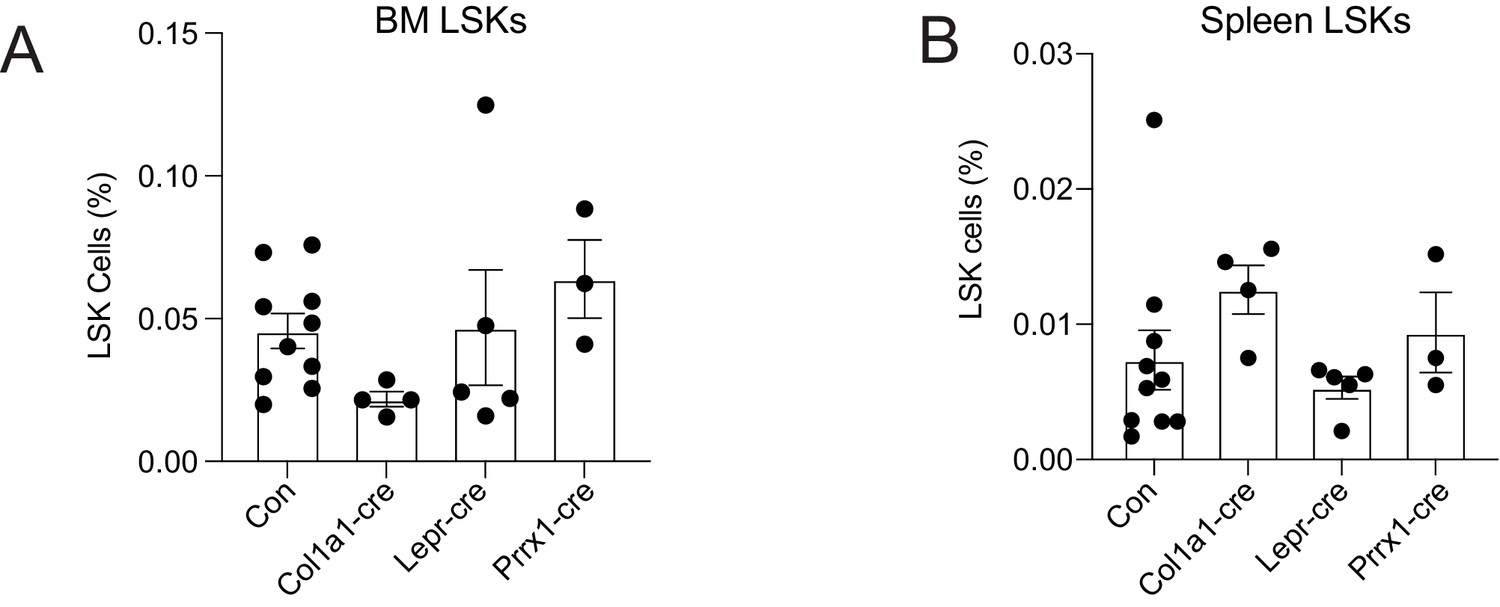
Bone marrow thrombopoietin (THPO) is not required for hematopoietic recovery after irradiation.
(A) LSK frequencies in the bone marrow from mice with Thpo deleted from osteoblasts (Col1a1-cre), mesenchymal stromal cells (Lepr-cre), or both (Prrx1-cre), as well as controls after irradiation. n = 3–10 mice for each genotype. (B) LSK frequencies in the spleens from mice with Thpo deleted from osteoblasts (Col1a1-cre), mesenchymal stromal cells (Lepr-cre) or both (Prrx1-cre), as well as controls after irradiation. n = 3–10 mice for each genotype. Con: Thpogfp/+ control mice. Col1a1-cre: Col1a1-cre; Thpofl/gfp mice. Lepr-cre: Leprcre; Thpofl/gfp mice. Prrx1-cre: Prrx1-cre; Thpofl/gfp mice. Data represent mean ± SEM. Statistical significance was assessed with one-way ANOVA with Dunnett’s test. Each dot represents one independent mouse.
-
Figure 3—figure supplement 2—source data 1
Numerical values of the data plotted in panels A and B.
- https://cdn.elifesciences.org/articles/69894/elife-69894-fig3-figsupp2-data1-v2.xlsx
Figure 4 with 1 supplement
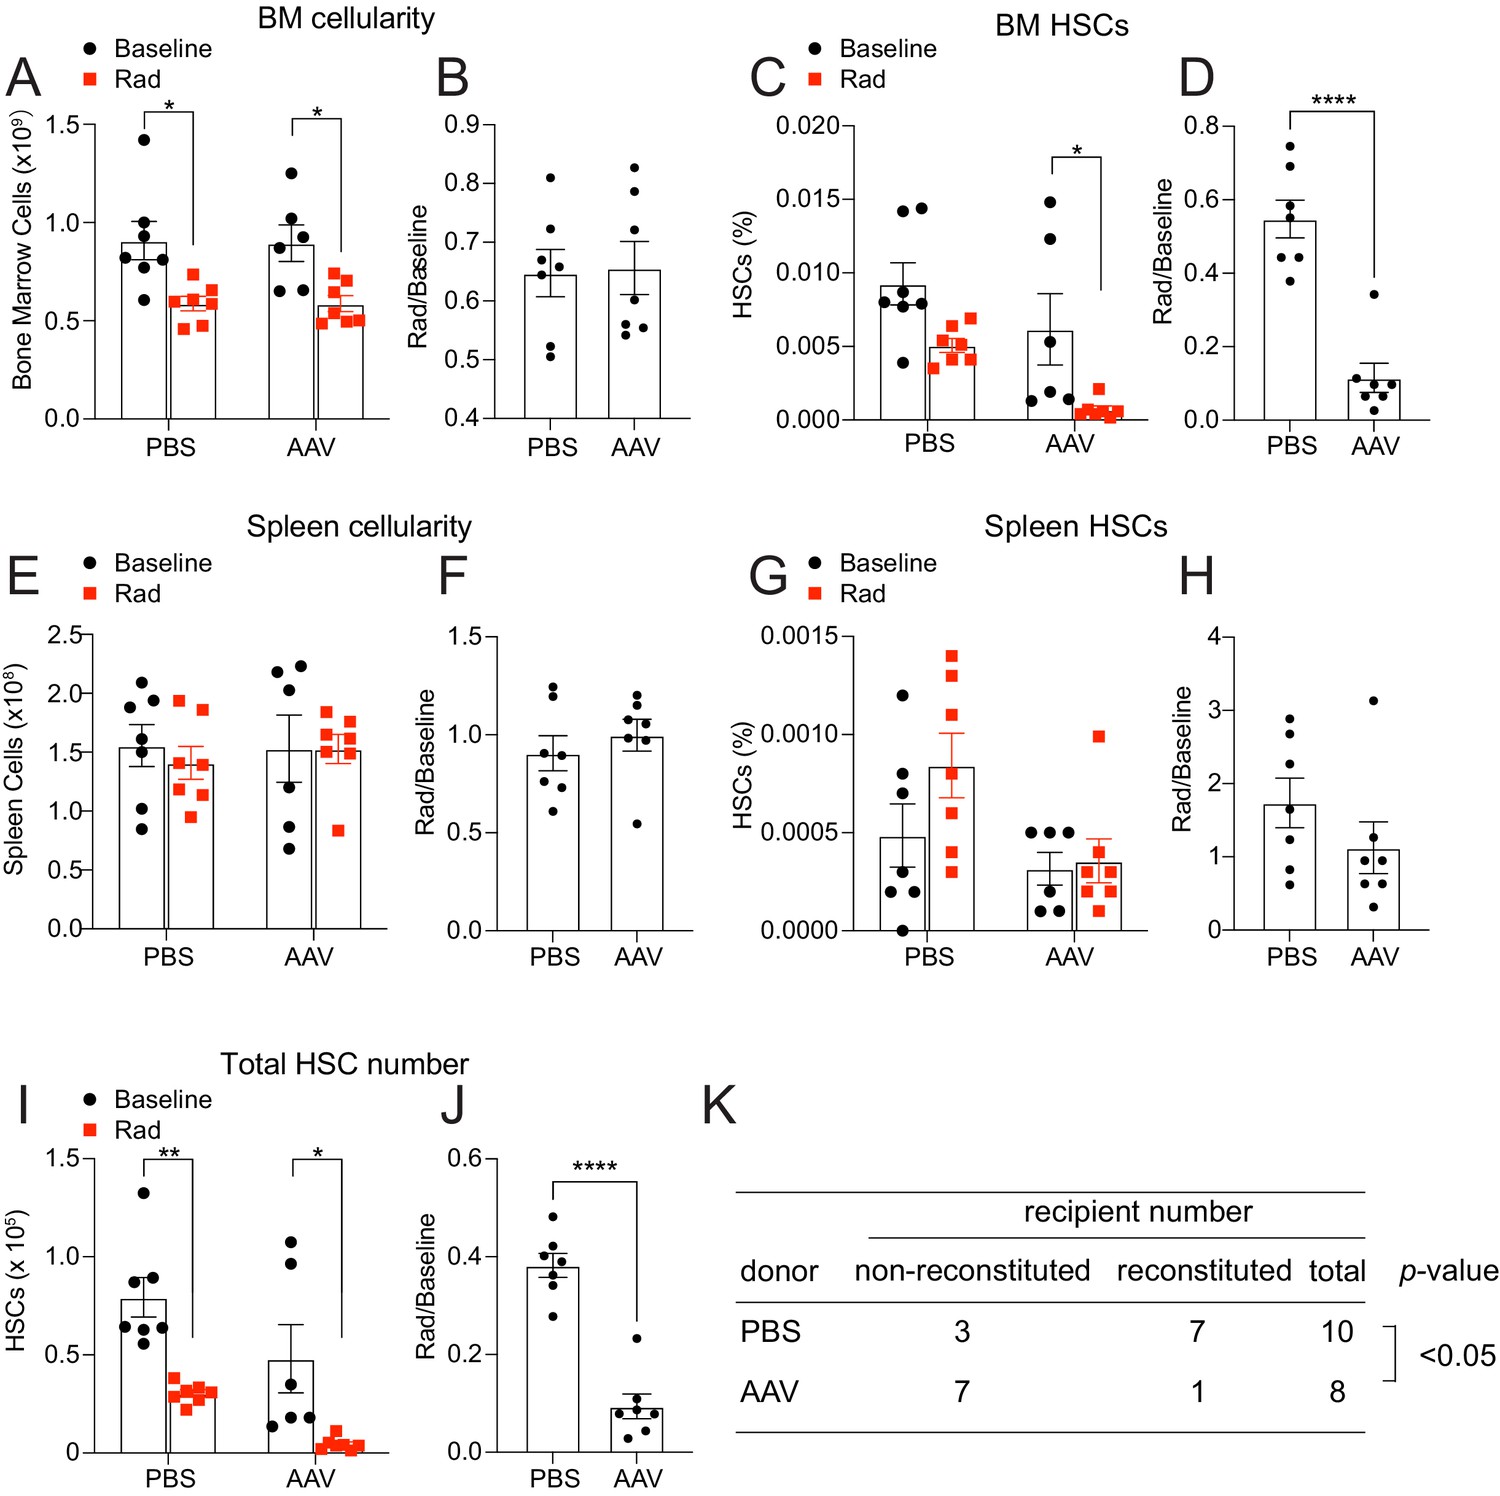
Hepatic thrombopoietin (THPO) is required for effective hematopoietic stem cell (HSC) recovery from ionizing radiation.
(A–H) Cellularity and frequencies of HSCs in the bone marrow and spleens from mice with Thpo conditionally deleted from hepatocytes (AAV) and controls with and without irradiation. Normalized fold changes after irradiation (relative to no irradiation baseline) are also shown. n = 6–7 mice. (I and J) Total numbers of HSCs in the bone marrow and spleens from mice with Thpo conditionally deleted from hepatocytes (AAV) and controls with and without irradiation. Normalized fold changes after irradiation (relative to no irradiation baseline) are also shown. n = 6–7 mice. (K) Numbers of total recipients and long-term multilineage reconstituted recipients after transplantation of 1,000,000 bone marrow cells from PBS- or AAV-treated Thpofl/fl and irradiated donor mice along with 1,000,000 irradiated competitor bone marrow cells. Recipients were scored as reconstituted if they showed donor-derived myeloid, B and T cells in the peripheral blood 16 weeks after transplantation. Data were from recipients of two donor pairs from two independent experiments. PBS: PBS-treated Thpofl/fl or wild-type control mice. AAV: AAV8-TBG-cre-treated Thpofl/fl mice. Data represent mean ± SEM. *p < 0.05, **p < 0.01, ****p < 0.0001. Statistical significance was assessed with two-way ANOVA with Turkey’s test (A, C, E, G, I), Student’s t-test (B, D, F, H, J), or Fisher’s exact test (K). Each dot represents one independent mouse in A–J.
-
Figure 4—source data 1
Numerical values of the data plotted in panels A-J.
- https://cdn.elifesciences.org/articles/69894/elife-69894-fig4-data1-v2.xlsx
Figure 4—figure supplement 1
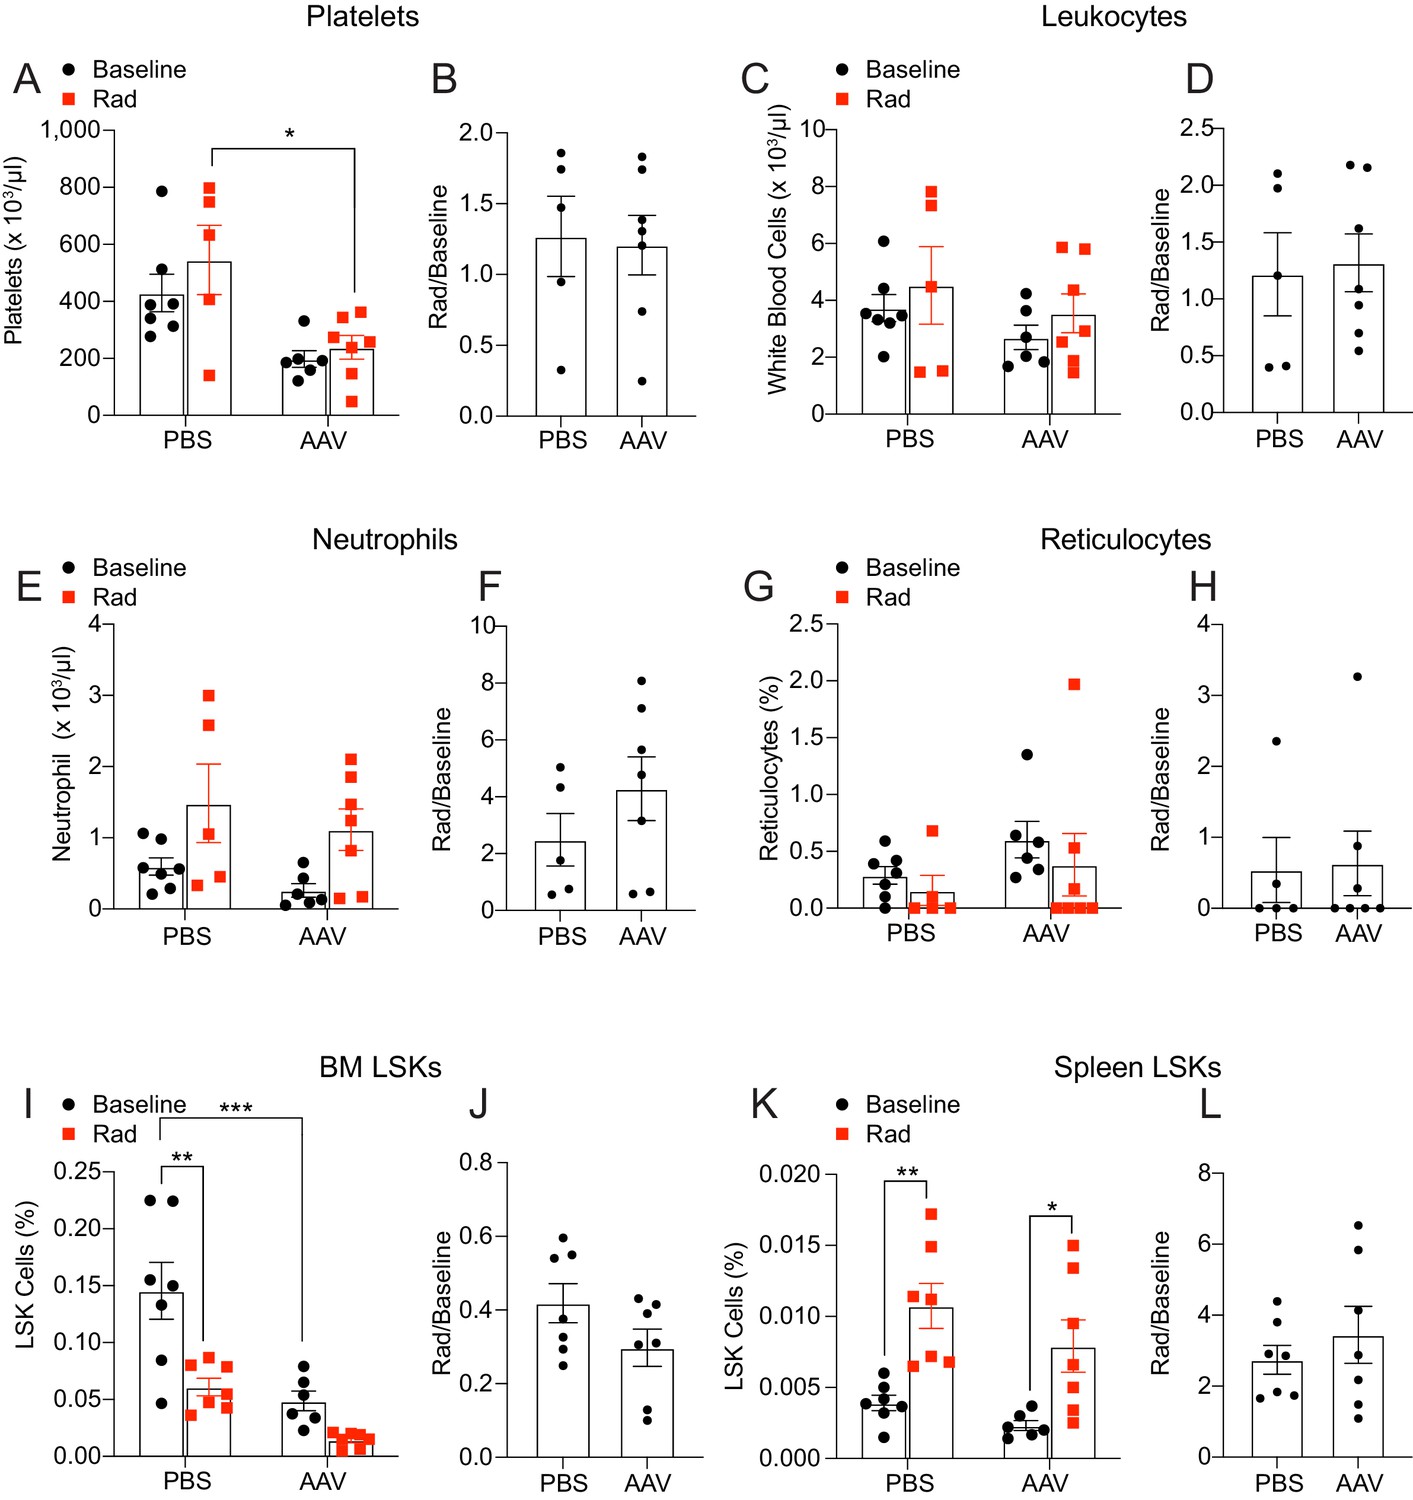
Hepatic thrombopoietin (THPO) is critical for hematopoietic recovery after irradiation.
(A–H) Blood cell counts of mice with Thpo deleted from hepatocytes (AAV) as well as controls with and without irradiation. Normalized fold changes (relative to baseline) are also shown. n = 5–7 mice. (I–L) LSK frequencies in bone marrow and spleens from mice with Thpo deleted from hepatocytes and controls with and without irradiation. Normalized fold changes (relative to baseline) are also shown. n = 6–7 mice. PBS: PBS-treated Thpofl/fl or wild-type control mice. AAV: AAV8-TBG-cre-treated Thpofl/fl mice. Data represent mean ± SEM. *p < 0.05, **p < 0.01, ***p < 0.001. Each dot represents one independent mouse. Statistical significance was assessed with two-way ANOVA with Turkey’s test or Student’s t-test.
-
Figure 4—figure supplement 1—source data 1
Numerical values of the data plotted in panels A-L.
- https://cdn.elifesciences.org/articles/69894/elife-69894-fig4-figsupp1-data1-v2.xlsx
Author response image 1
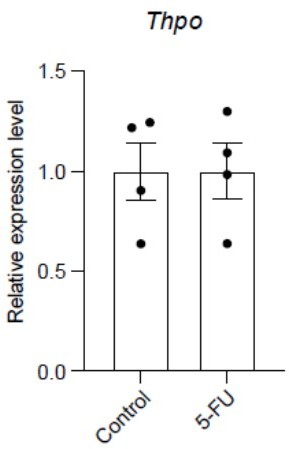
5-FU treatment does not change Thpo transcript levels in the liver.
qPCR analysis showing the relative expression levels of Thpo transcripts in controls and 5-FU-treated mice. n = 4 mice for each condition.
Author response image 2
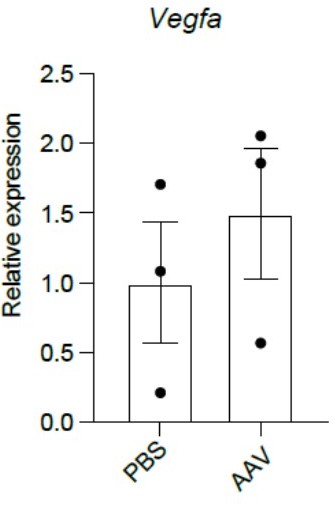
Deletion of Thpo from hepatocytes does not lead to changes in Vegfa expression in HSCs.
qPCR analysis showing that LSKCD150+CD48- HSCs from AAV-treated Thpofl/fl mice had similar Vegfa expression levels as PBS-treated controls. n = 3 mice for each condition.
Tables
Key resources table
| Reagent type (species) or resource | Designation | Source or reference | Identifiers | Additional information |
|---|---|---|---|---|
| Genetic reagent (Mus musculus) | Prrx1-cre | PMID:12112875 | JAX stock (005584) | |
| Genetic reagent (Mus musculus) | Leprcre | PMID:11283374 | JAX stock (008320) | |
| Genetic reagent (Mus musculus) | Rosa26LSL-ZsGreen | PMID:20023653 | JAX stock (007906) | |
| Genetic reagent (Mus musculus) | Col1a1-cre | PMID:15470637 | ||
| Genetic reagent (Mus musculus) | Thpogfp | PMID:29622652 | ||
| Genetic reagent (Mus musculus) | ThpocreER | PMID:29622652 | ||
| Genetic reagent (Mus musculus) | Thpofl | PMID:29622652 | ||
| Recombinant DNA reagent | AAV8-TBG-cre | Penn Vector core or Addgene | Cat# 107787-AAV8 | |
| Chemical compound, drug | 5-Fluorouracil | FreseniusKabi | Cat# 101,710 | 150 mg/kg IP |
| Chemical compound, drug | Tamoxifen | Sigma | Cat# T5648 | |
| Chemical compound, drug | Collagenase, Type IV | Worthington | Cat# LS004188 | |
| Chemical compound, drug | DNase I | Sigma | Cat# D4527 | |
| Antibody | (Rat monoclonal) anti-CD2 (RM2-5) | Biolegend | Flow cytometry (1:200) | |
| Antibody | (Rat monoclonal) anti-CD3 (17A2) | Biolegend | Flow cytometry (1:200) | |
| Antibody | (Rat monoclonal) anti-CD5 (53–7.3) | Biolegend | Flow cytometry (1:400) | |
| Antibody | (Rat monoclonal) anti-CD8a (53–6.7) | Biolegend | Flow cytometry (1:400) | |
| Antibody | (Rat monoclonal) anti-B220 (6B2) | Biolegend | Flow cytometry (1:400) | |
| Antibody | (Rat monoclonal) anti-Gr1 (8C5) | Biolegend | Flow cytometry (1:400) | |
| Antibody | (Rat monoclonal) anti-Ter119 | Biolegend | Flow cytometry (1:200) | |
| Antibody | (Rat monoclonal) anti-Sca1 (E13-161.7) | Biolegend | Flow cytometry (1:200) | |
| Antibody | (Rat monoclonal) anti-cKit (2B8) | Biolegend | Flow cytometry (1:200) | |
| Antibody | Armenian (Hamster monoclonal) anti-CD48 (HM48-1) | Biolegend | Flow cytometry (1:200) | |
| Antibody | (Rat monoclonal) anti-CD150 (TC15-12F12.2) | Biolegend | Flow cytometry (1:200) | |
| Antibody | (Rat monoclonal) anti-CD45.2 (104) | Biolegend | Flow cytometry (1:400) | |
| Antibody | (Rat monoclonal) anti-CD45.1 (A20) | Biolegend | Flow cytometry (1:400) | |
| Antibody | (Rat monoclonal) anti-Mac1 (M1/70) | Biolegend | Flow cytometry (1:400) | |
| Antibody | (Rat monoclonal) anti-CD45 (30 F-11) | Biolegend | Flow cytometry (1:400) | |
| Antibody | (Rabbit monoclonal) anti-HNF4α (EPR16885-99) | AbCam | Cat# Ab201460 | IF (1:10) |
| Sequence-based reagent | OLD815 | IDT DNA | CCACCACCATGCCTAACTCT | |
| Sequence-based reagent | OLD816 | IDT DNA | GTTCTCCTCCACGTCTCCAG | |
| Sequence-based reagent | OLD817 | IDT DNA | TCGCTAGCTGCTCTGATGAA | |
| Sequence-based reagent | ZsGreen F | IDT DNA | GGCATTAAAGCAGCGTATCC | |
| Sequence-based reagent | ZsGreen R | IDT DNA | AACCAGAAGTGGCACCTGAC | |
| Sequence-based reagent | OLD581 | IDT DNA | CATCTCGCTGCTCTTAGCAGGG | |
| Sequence-based reagent | OLD582 | IDT DNA | GAGCTGTTTGTGTTCCAACTGG | |
| Sequence-based reagent | OLD292 | IDT DNA | CGGACACGCTGAACTTGTGG | |
| Sequence-based reagent | OLD528 | IDT DNA | ACTTATTCTCAGGTGGTGACTC | |
| Sequence-based reagent | OLD653 | IDT DNA | AGGGAGCCACTTCAGTTAGAC | |
| Sequence-based reagent | OLD434 | IDT DNA | CATTGTATGGGATCTGATCTGG | |
| Sequence-based reagent | OLD435 | IDT DNA | GGCAAATTTTGGTGTACGGTC | |
| Sequence-based reagent | OLD338 | IDT DNA | GCATTTCTGGGGATTGCTTA | |
| Sequence-based reagent | OLD339 | IDT DNA | ATTCTCCCACCGTCAGTACG | |
| Sequence-based reagent | OLD390 | IDT DNA | CCTTTGTCTATCCCTGTTCTGC | |
| Sequence-based reagent | OLD391 | IDT DNA | ACTGCCCCTAGAATGTCCTGT | |
| Sequence-based reagent | OLD27 | IDT DNA | GCTCTTTTCCAGCCTTCCTT | |
| Sequence-based reagent | OLD28 | IDT DNA | CTTCTGCATCCTGTCAGCAA | |
| Software, algorithm | FacsDiva | BD | ||
| Software, algorithm | FlowJo | FlowJo | ||
| Software, algorithm | Prism | GraphPad | ||
| Other | SuperScript III | ThermoFisher | Cat# 18080093 | |
| Other | ProtoScript II | NEB | Cat# M0368S | |
| Other | PELCO Cryo-Embedding compound | Ted Pella, Inc | Cat# 27,300 |
Additional files
Download links
A two-part list of links to download the article, or parts of the article, in various formats.
Downloads (link to download the article as PDF)
Open citations (links to open the citations from this article in various online reference manager services)
Cite this article (links to download the citations from this article in formats compatible with various reference manager tools)
Thrombopoietin from hepatocytes promotes hematopoietic stem cell regeneration after myeloablation
eLife 10:e69894.
https://doi.org/10.7554/eLife.69894


