CLAMP and Zelda function together to promote Drosophila zygotic genome activation
- Department of Molecular Biology, Cellular Biology, and Biochemistry, Brown University, United States
- Department of Biology, Emory University, United States
- Department of Molecular Biology, Princeton University, United States
- Department of Molecular Pharmacology, Physiology and Biotechnology, Brown University, United States
Figures
Figure 1 with 1 supplement
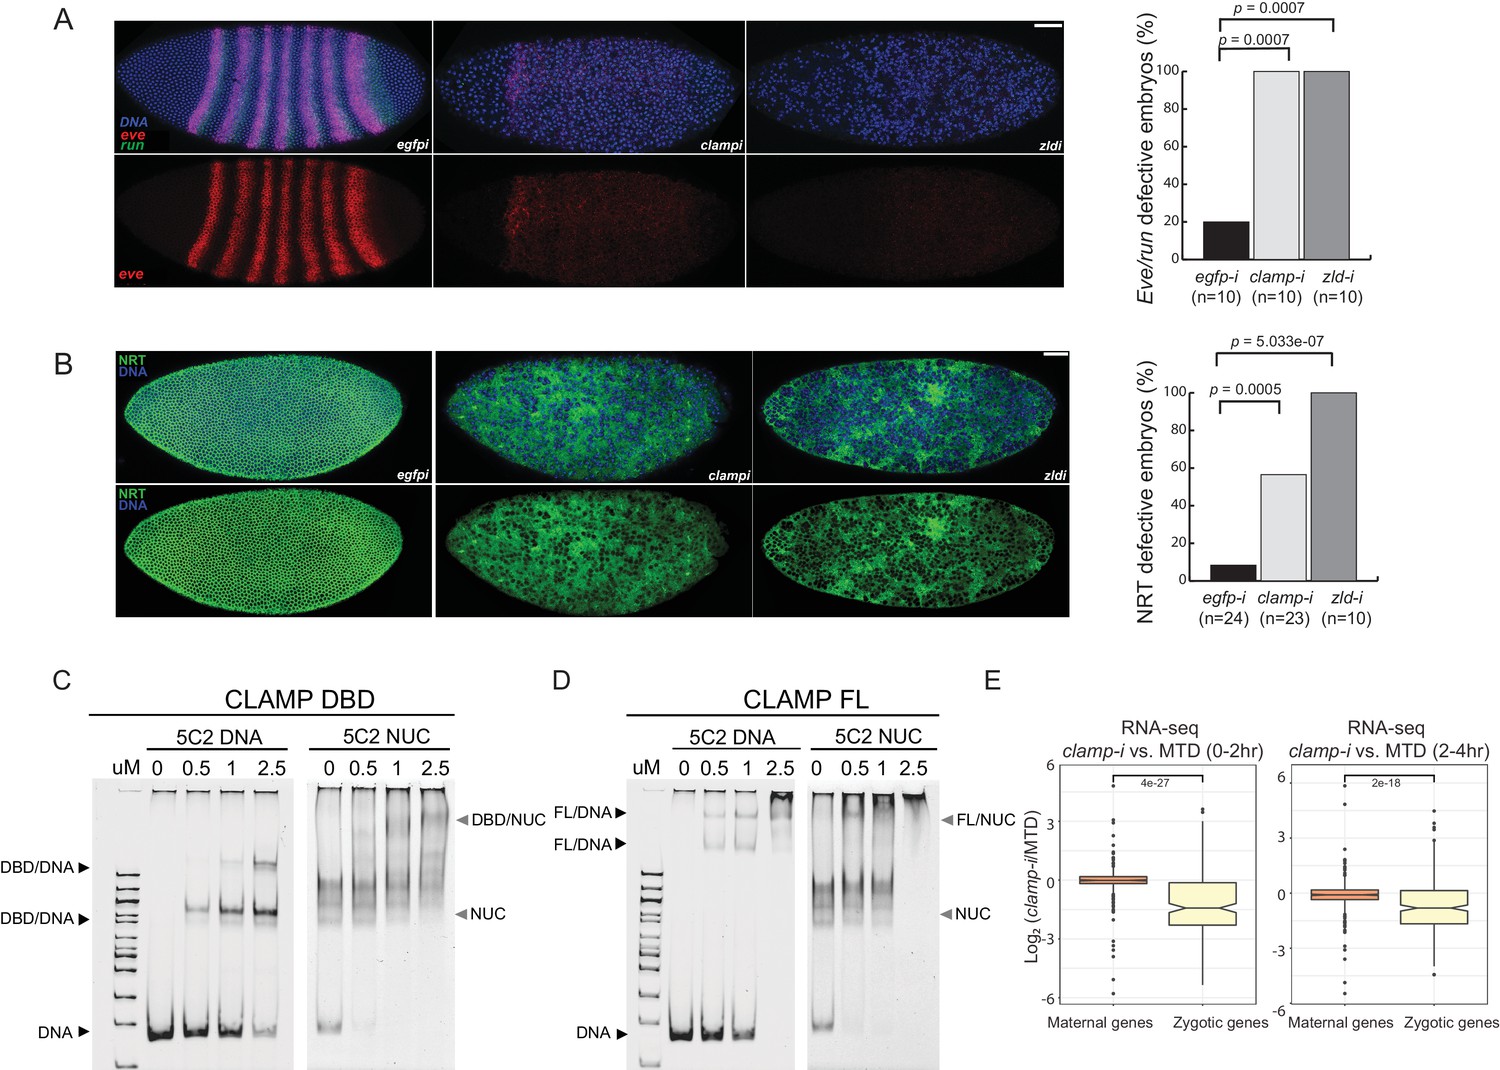
Novel pioneer factor CLAMP is essential for early embryonic development.
(A) Control maternal egfp depletion (left), maternal clamp depletion (middle), and maternal zld depletion (right) syncytial blastoderm stage embryos probed using smFISH for the pair-rule patterning genes run (green) and eve (red). Embryos were co-labeled with Hoechst (blue) to visualize nuclei. Scale bar represents 10 µm. Quantification (%) of eve/run defective embryos is on the right, p-values were calculated with the Fisher’s exact test; number of embryos is in parentheses. (B) Control maternal egfp depletion (left), maternal clamp depletion (middle), and maternal zld depletion (right) syncytial blastoderm stage embryos were assessed for integrity of the developing cytoskeleton using anti-NRT antibody (green) and Hoechst (blue) to label nuclei. Scale bar represents 10 µm. Quantification (%) of NRT defective embryos is on the right, p-values were calculated with the Fisher’s exact test; number of embryos is in parentheses. (C) Electrophoretic mobility shift assay (EMSA) showing the binding of increasing amounts of CLAMP DNA-binding domain (DBD) fused to MBP to 5C2 naked DNA or 5C2 in vitro reconstituted nucleosomes (Nucs). Concentrations (µM) of CLAMP DBD increase from left to right. (D) EMSA showing the binding of increasing amounts of full-length (FL) CLAMP (fused to MBP) to 5C2 DNA or 5C2 Nucs. Concentrations (µM) of CLAMP FL increase from left to right. (E) Effect of maternal clamp RNAi on maternally deposited (orange) or zygotically transcribed (yellow) gene expression log2 (clamp-i/MTD) in 0–2 hr (left) or 2–4 hr (right). Maternal versus zygotic gene categories were as defined in Lott et al., 2011. p-values of significant expression changes between maternal and zygotic genes were calculated by Mann-Whitney U-test and noted on the plot. CLAMP, chromatin-linked adaptor for male-specific lethal (MSL) proteins; smFISH, single-molecule fluorescence in situ hybridization.
-
Figure 1—source data 1
Original western blots and EMSA images.
- https://cdn.elifesciences.org/articles/69937/elife-69937-fig1-data1-v2.zip
Figure 1—figure supplement 1
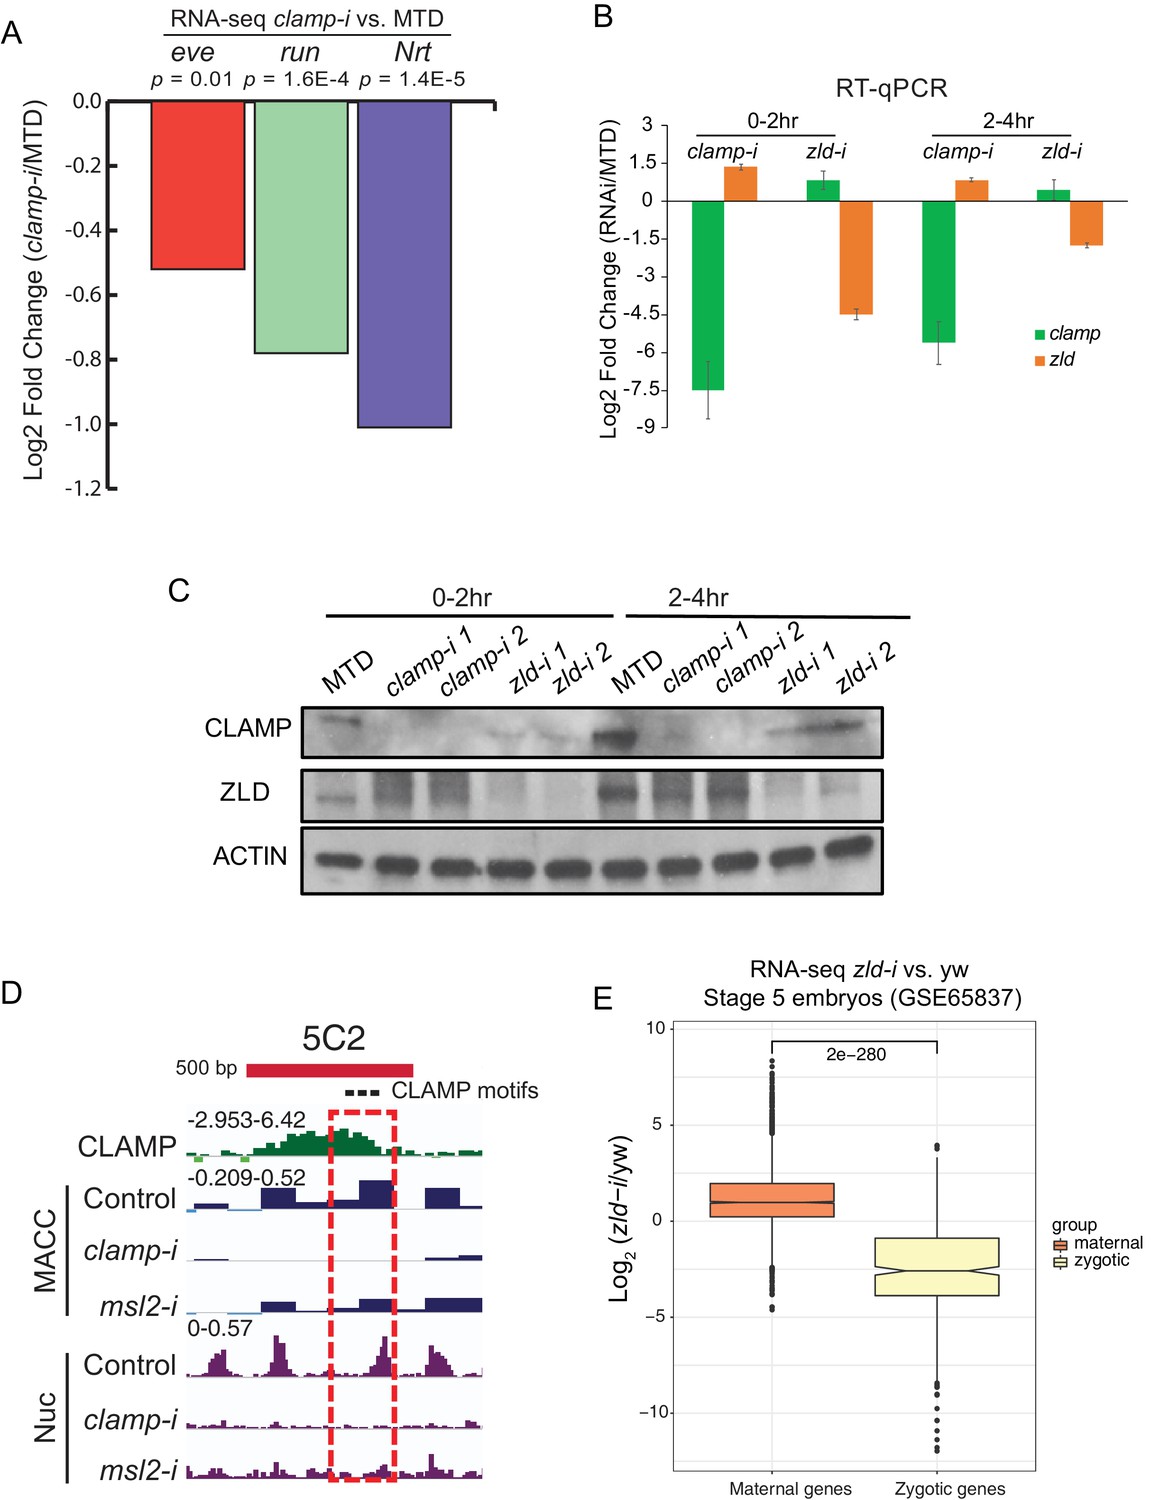
Novel pioneer factor CLAMP is essential for early embryonic development.
(A) Expression of early zygotic genes (even-skipped, runt, and neurotactin) in MTD and clamp-i embryos measured by RNA-seq (Rieder et al., 2017). Log2fold change and p-value were calculated using DESeq2. (B) Expression of mRNAs (clamp and zld) in MTD, clamp-i, and zld-i embryos in 0–2 hr and 2–4 hr embryos measured by RT-qPCR. Log2fold change was calculated using the ΔΔCt method (Rao et al., 2013) and normalized to reference gene pka. (C) Western blot of CLAMP, ZLD, and reference control Actin in MTD, clamp-i, and zld-i embryos in 0–2 hr and 2–4 hr embryos. MTD: MTD-Gal4 line. clamp-i: MTD-Gal4-clamp mRNAi line, zld-i: MTD-Gal4-zld mRNAi line. (D) Genome browser tracks for a region of the CES 5C2 locus (red bar is 500 bp) used to make in vitro reconstituted nucleosomes (Urban et al., 2017a). Locations of three CLAMP binding motifs are marked as black dots. CLAMP chromatin immunoprecipitation-sequencing (ChIP-seq) normalized sequencing reads are shown in green. MNase-seq MACC scores (dark blue) show chromatin accessibility in S2 cells in control (egfp-i), clamp, and msl2 RNAi treatment. The nucleosome (Nuc) profile is shown in purple. The dashed red rectangle highlights the genomic region (240 bp) used to reconstitute nucleosomes in vitro. (E) Effect of maternal zld RNAi (Schulz et al., 2015) on maternally deposited (orange) or zygotically transcribed (yellow) gene expression log2 (clamp-i/MTD) in 0–2 hr (left) or 2–4 hr (right) measured by RNA-seq. Maternal versus zygotic gene categories were as defined in Lott et al., 2011. p-values of significant expression changes between maternal and zygotic genes were calculated by Mann-Whitney U-test and noted on the plot. CLAMP, chromatin-linked adaptor for male-specific lethal (MSL) proteins; MBP, maltose-binding protein.
Figure 2 with 1 supplement
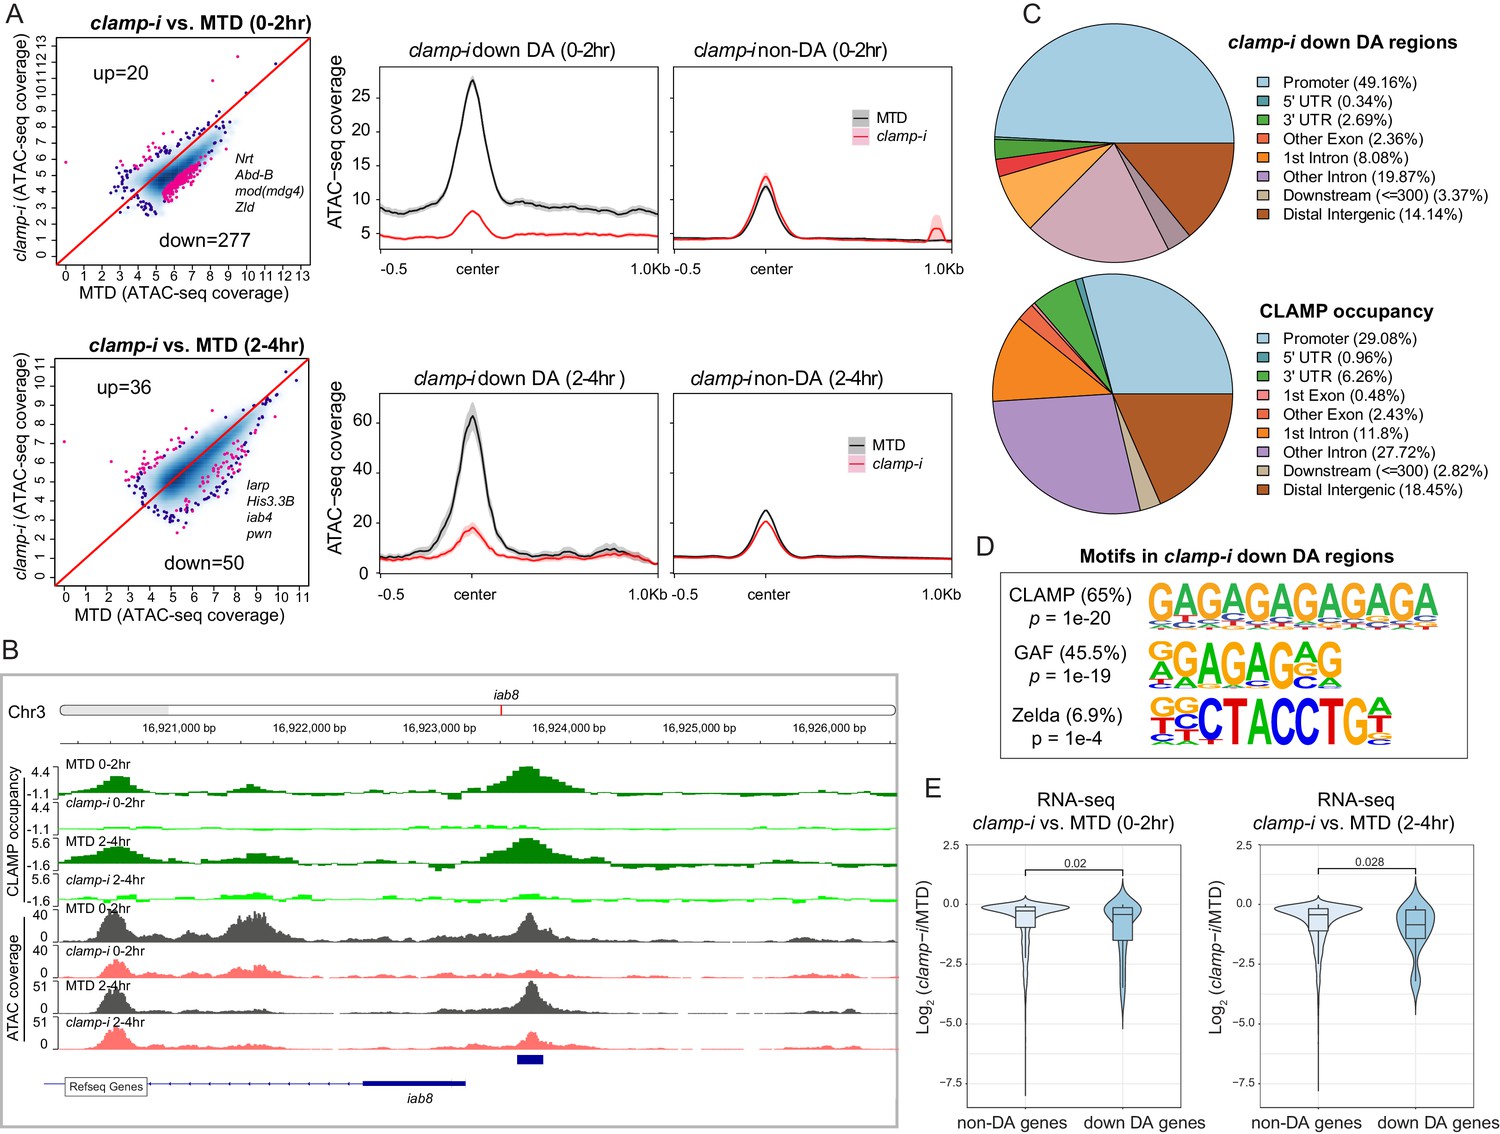
CLAMP regulates chromatin accessibility of a subset of the early zygotic genome.
(A) Differential accessibility (DA) analysis (left) of ATAC-seq from MTD embryos versus clamp-i embryos in 0–2 hr or 2–4 hr. Blue dots indicate non-DA sites. Pink dots indicate significant (FDR<0.1) differential peaks after maternal clamp RNAi, identified by DiffBind (DESeq2) (DA peaks). The number of peaks and representative genes in each class is noted on the plot. Average ATAC-seq signal (right) in reads per genome coverage (RPGC) 1× normalization in 0–2 hr or 2–4 hr embryos after maternal clamp RNAi centered on open chromatin (≤100 bp) peaks identified significant changes upon maternal clamp RNAi. (B) Example of IGV views of genomic locus iab-8 bound by CLAMP (ChIP-seq) which shows significantly decreased CLAMP binding and ATAC-seq signal after clamp RNAi. (C) Genomic features of regions that require CLAMP for chromatin accessibility (clamp-i down DA regions, ATAC-seq) compared with all CLAMP binding sites (ChIP-seq occupancy). (D) Top motifs enriched in regions that require CLAMP for chromatin accessibility (clamp-i down DA regions, ATAC-seq). Enrichment p-value and percentage of sequences are noted. (E) Violin plot comparing gene expression (RNA-seq data) in CLAMP-mediated changes and unchanged differential accessibility regions in 0–2 hr or 2–4 hr embryos after maternal clamp RNAi. p-values of significant expression changes of CLAMP down-DA and non-DA were calculated by Mann-Whitney U-test and noted on the plot. ChIP-seq, chromatin immunoprecipitation-sequencing; CLAMP, chromatin-linked adaptor for male-specific lethal (MSL) proteins; FDR, false discovery rate.
-
Figure 2—source data 1
ATAC-seq read counts in peak region in replicates of MTD and RNAi samples (DiffBind analysis).
Page 1. clamp-i versus MTD in 0–2 hr embryos. Page 2. clamp-i versus MTD in 2–4 hr embryos.
- https://cdn.elifesciences.org/articles/69937/elife-69937-fig2-data1-v2.xls
Figure 2—figure supplement 1
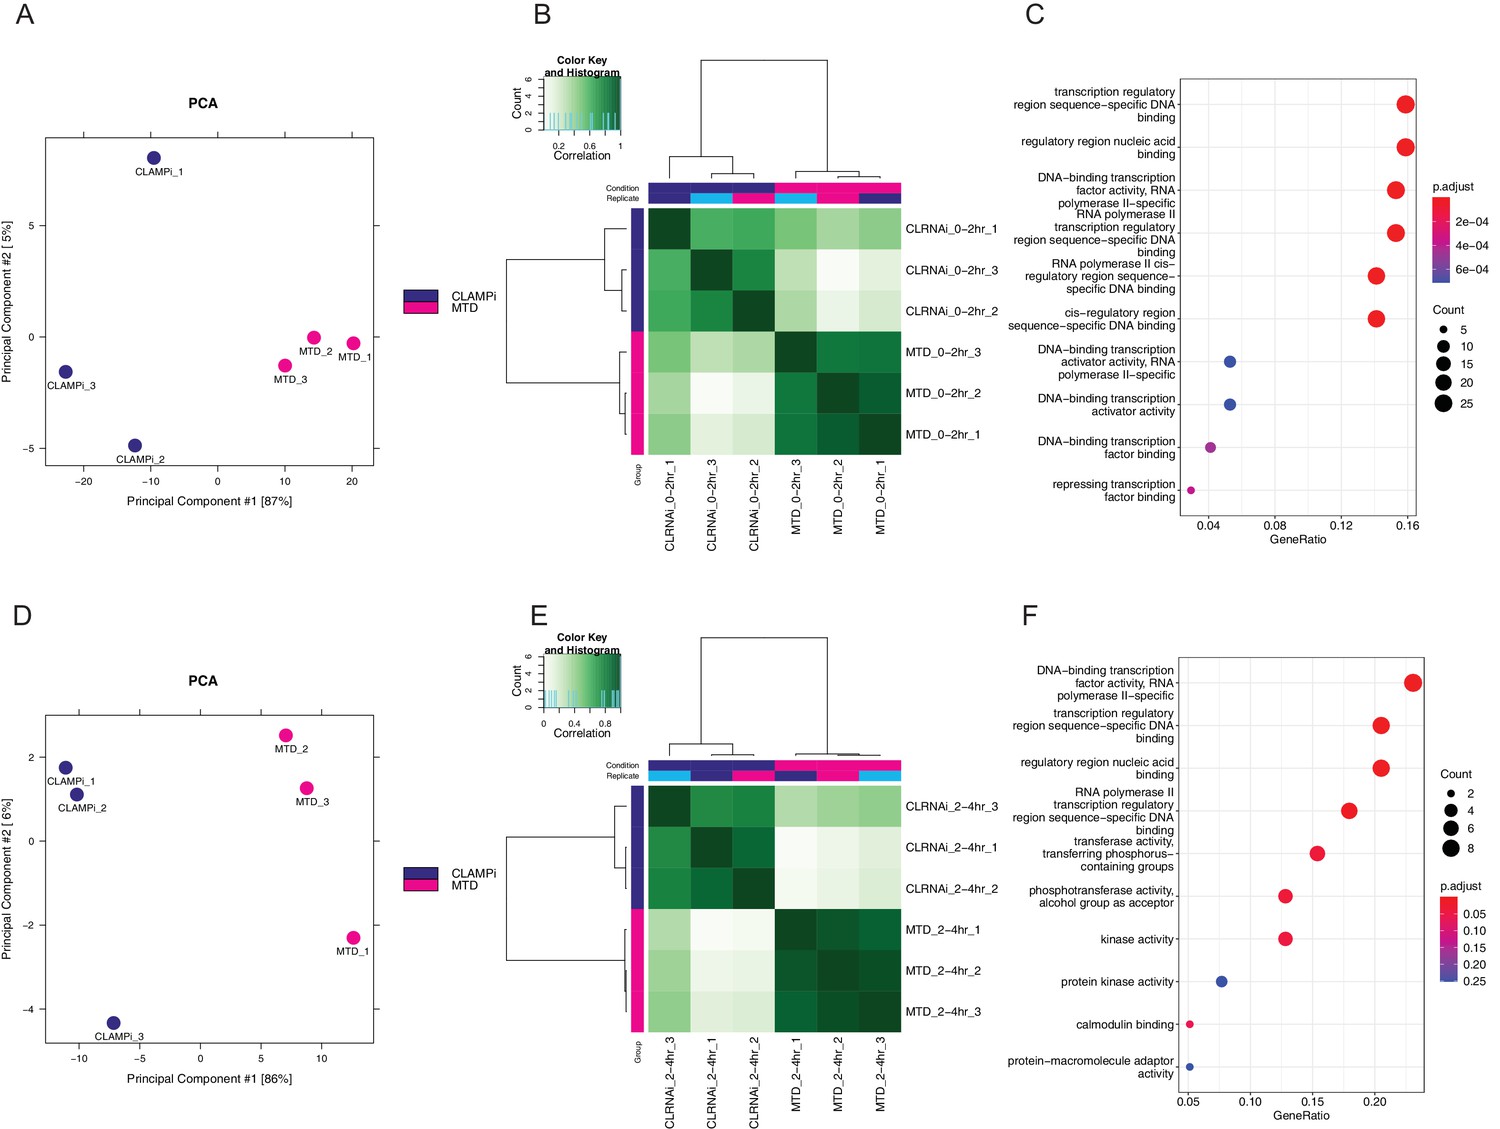
CLAMP regulates chromatin accessibility throughout ZGA.
(A) PCA plot for sample replicates in MTD and clamp-i embryos at 0–2 hr time point. (B) Pearson correlation heatmap of peaks dependent on CLAMP in MTD versus clamp-i embryos at 0–2 hr time point. (C) GO terms for genes that require CLAMP for chromatin accessibility at 0–2 hr time point. (D) PCA plots for sample replicates in MTD and clamp-i embryos at 2–4 hr time point. (E) Pearson correlation heatmap of peaks dependent on CLAMP in MTD versus clamp-i embryos at 2–4 hr time point. (F) GO terms for genes that require CLAMP for chromatin accessibility at 2–4 hr time point. CLAMP, chromatin-linked adaptor for male-specific lethal (MSL) proteins; GO, Gene Ontology; PCA, principal component analysis; ZGA, zygotic genome activation.
Figure 3 with 3 supplements
CLAMP and ZLD depend on each other for binding at a subset of sites.
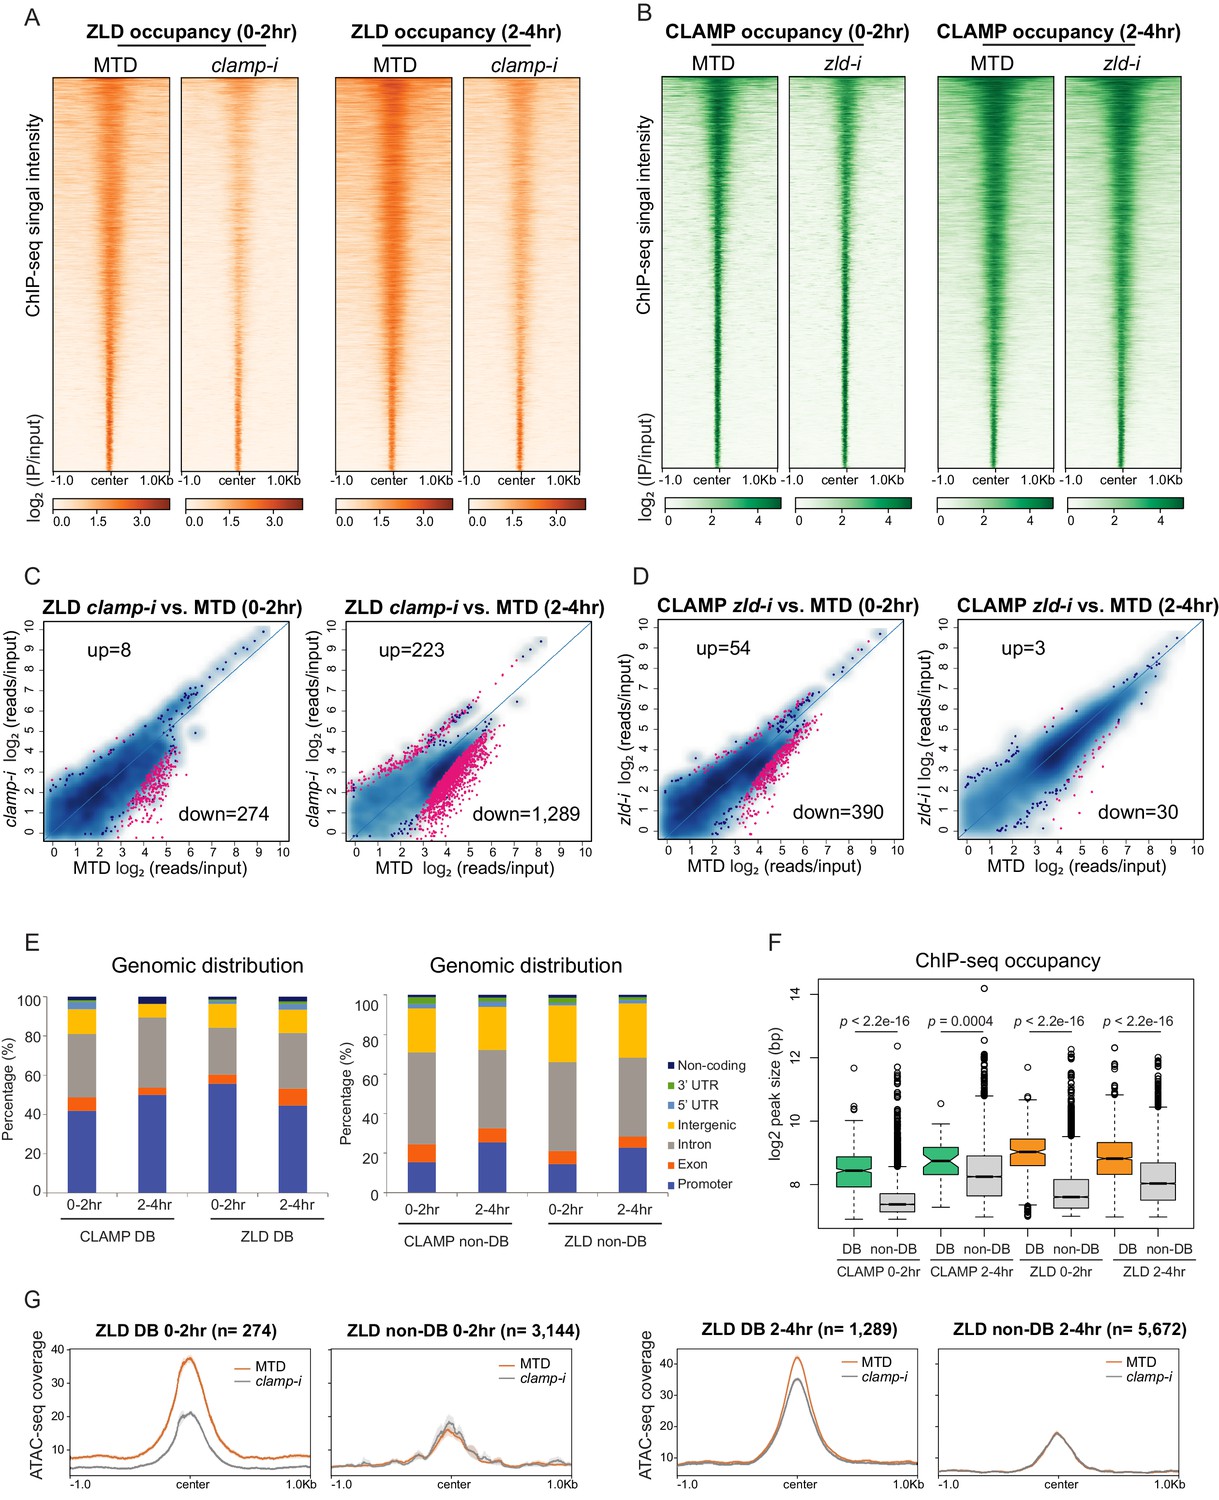
(A) ZLD occupancy in 0–2 hr and 2–4 hr MTD and maternal clamp RNAi embryos. Data is displayed as a heatmap of z-score normalized ChIP-seq (log2 IP/input) reads in a 2-kb region centered at each peak. Peaks in each class are arranged in order of decreasing z-scores in control MTD embryos. (B) CLAMP occupancy in 0–2 hr and 2–4 hr MTD and maternal zld RNAi embryos. Data is displayed as a heatmap of z-score normalized ChIP-seq (log2 IP/input) reads in a 2-kb region centered around each peak. Peaks in each class are arranged in order of decreasing z-scores in control MTD embryos. (C) Differential binding (DB) analysis of ZLD ChIP-seq. Mean difference (MA) plots of ZLD peaks in MTD embryos versus clamp-i embryos in 0–2 hr (left) or 2–4 hr (right). Blue dots indicate non-DB sites. Pink dots indicate significant (FDR<0.05) differential peaks identified by DiffBind (DESeq2). The number of peaks changed in each direction is noted on the plot. (D) DB analysis of CLAMP ChIP-seq. MA plots of CLAMP peaks from MTD embryos versus zld-i embryos in 0–2 hr (left) or 2–4 hr (right). Blue dots indicate non-DB sites. Pink dots indicate significant (FDR<0.05) DB peaks identified by DiffBind (DESeq2). Number of peaks in each direction is noted on the plot. (E) Stacked bar plots of CLAMP and ZLD down-DB (left) and CLAMP and ZLD non-DB peaks (right) distribution fraction in the Drosophila genome (dm6) in 0–2 hr and 2–4 hr embryos. (F) Box plot of the peak sizes in CLAMP and ZLD down-DB and non-DB peaks in 0–2 hr and 2–4 hr embryos. p-values of significant size difference between down-DB and non-DB peaks were calculated by Mann-Whitney U-test and noted on the plot. (G) Average profiles of ATAC-seq signal coverage show chromatin accessibility at ZLD down-DB (orange line) and non-DB (gray line) sites in 0–2 hr (left panel) or 2–4 hr (right panel) MTD and clamp-i embryos. Number of sites is noted on the plot. ChIP-seq, chromatin immunoprecipitation-sequencing; CLAMP, chromatin-linked adaptor for male-specific lethal (MSL) proteins.
Figure 3—figure supplement 1
CLAMP and ZLD depend on each other for chromatin binding.
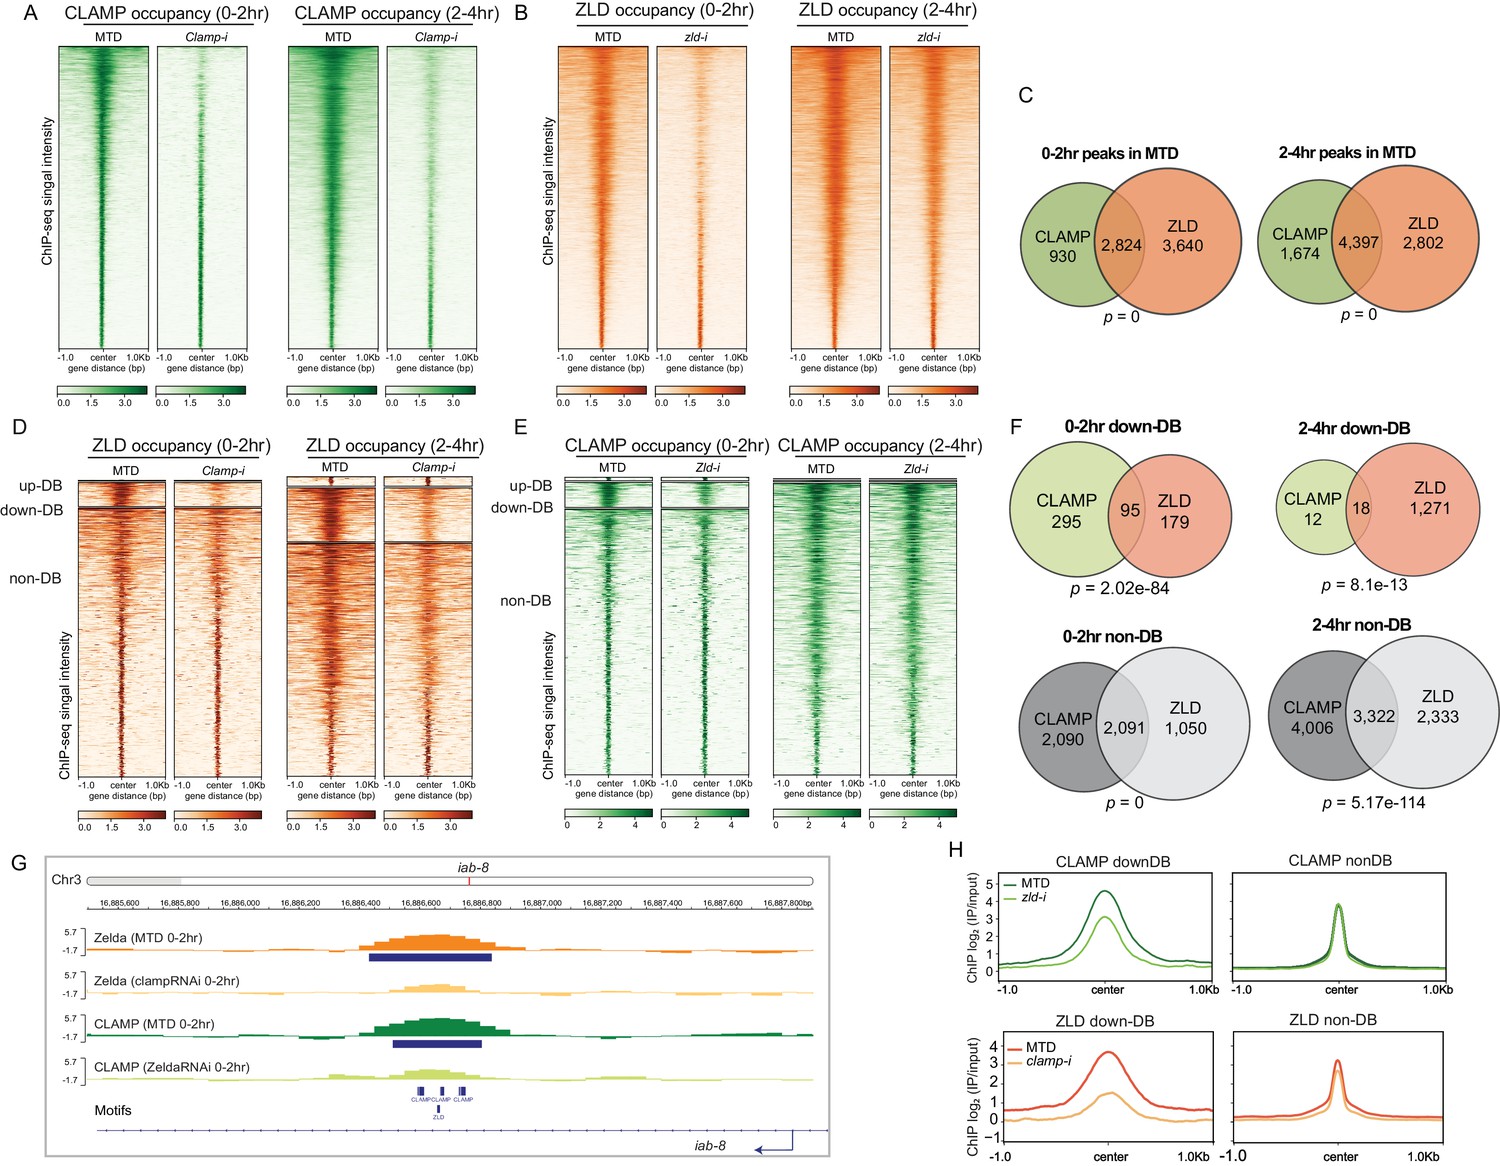
(A) CLAMP occupancy in 0–2 hr and 2–4 hr MTD and maternal clamp RNAi embryos. Data is displayed as a heatmap of z-score normalized ChIP-seq (log2 IP/input) reads, in a 2-kb region centered around each peak called in control MTD embryos. Peaks in each class are arranged in order of decreasing z-scores in control MTD embryos. (B) ZLD occupancy in 0–2 hr and 2–4 hr MTD and maternal zld RNAi embryos. Data is displayed as a heatmap of z-score normalized ChIP-seq (log2 IP/input) reads, in a 2-kb region centered around each peak called in control MTD embryos. Peaks in each class are arranged in order of decreasing z-scores in control MTD embryos. (C) CLAMP (green) and ZLD (orange) peaks and shared peaks where both CLAMP and ZLD are present in 0–2 hr and 2–4 hr embryos. p-values represent the significance (hypergeometric test, N=15,682 total fly genes) of overlap. (D) ZLD up-DB, down-DB, and non-DB peaks in 0–2 hr and 2–4 hr MTD and maternal clamp RNAi embryos. Data is displayed as a heatmap of z-score normalized ChIP-seq (log2 IP/input) reads in a 2-kb region centered around each peak. Peaks in each class are arranged in order of decreasing z-scores in control MTD embryos. (E) CLAMP up-DB, down-DB, and non-DB peaks in 0–2 hr and 2–4 hr MTD and maternal zld RNAi embryos. Data is displayed as a heatmap of z-score normalized ChIP-seq (log2 IP/input) reads in a 2-kb region centered around each peak. Peaks in each class are arranged in order of decreasing z-scores in control MTD embryos. (F) Venn diagram showing the number of overlapping sites between ZLD and CLAMP down-DB or ZLD and CLAMP non-DB sites in 0–2 hr and 2–4 hr. p-values represent the significance (hypergeometric test, N=15,682 total fly genes) of overlap. (G) Example IGV views of genomic loci in iab-8, which CLAMP and ZLD were both down-DBs and dependent on each other to bind. (H) Average profiles of ChIP-seq signal in log2 (IP/input) show the size of down-DB or non-DB peaks of CLAMP in MTD versus zld-i embryos (upper panel) and ZLD in MTD versus clamp-i embryos (lower panel). ChIP-seq, chromatin immunoprecipitation-sequencing; CLAMP, chromatin-linked adaptor for male-specific lethal (MSL) proteins.
Figure 3—figure supplement 2
CLAMP and ZLD depend on each other for chromatin binding.
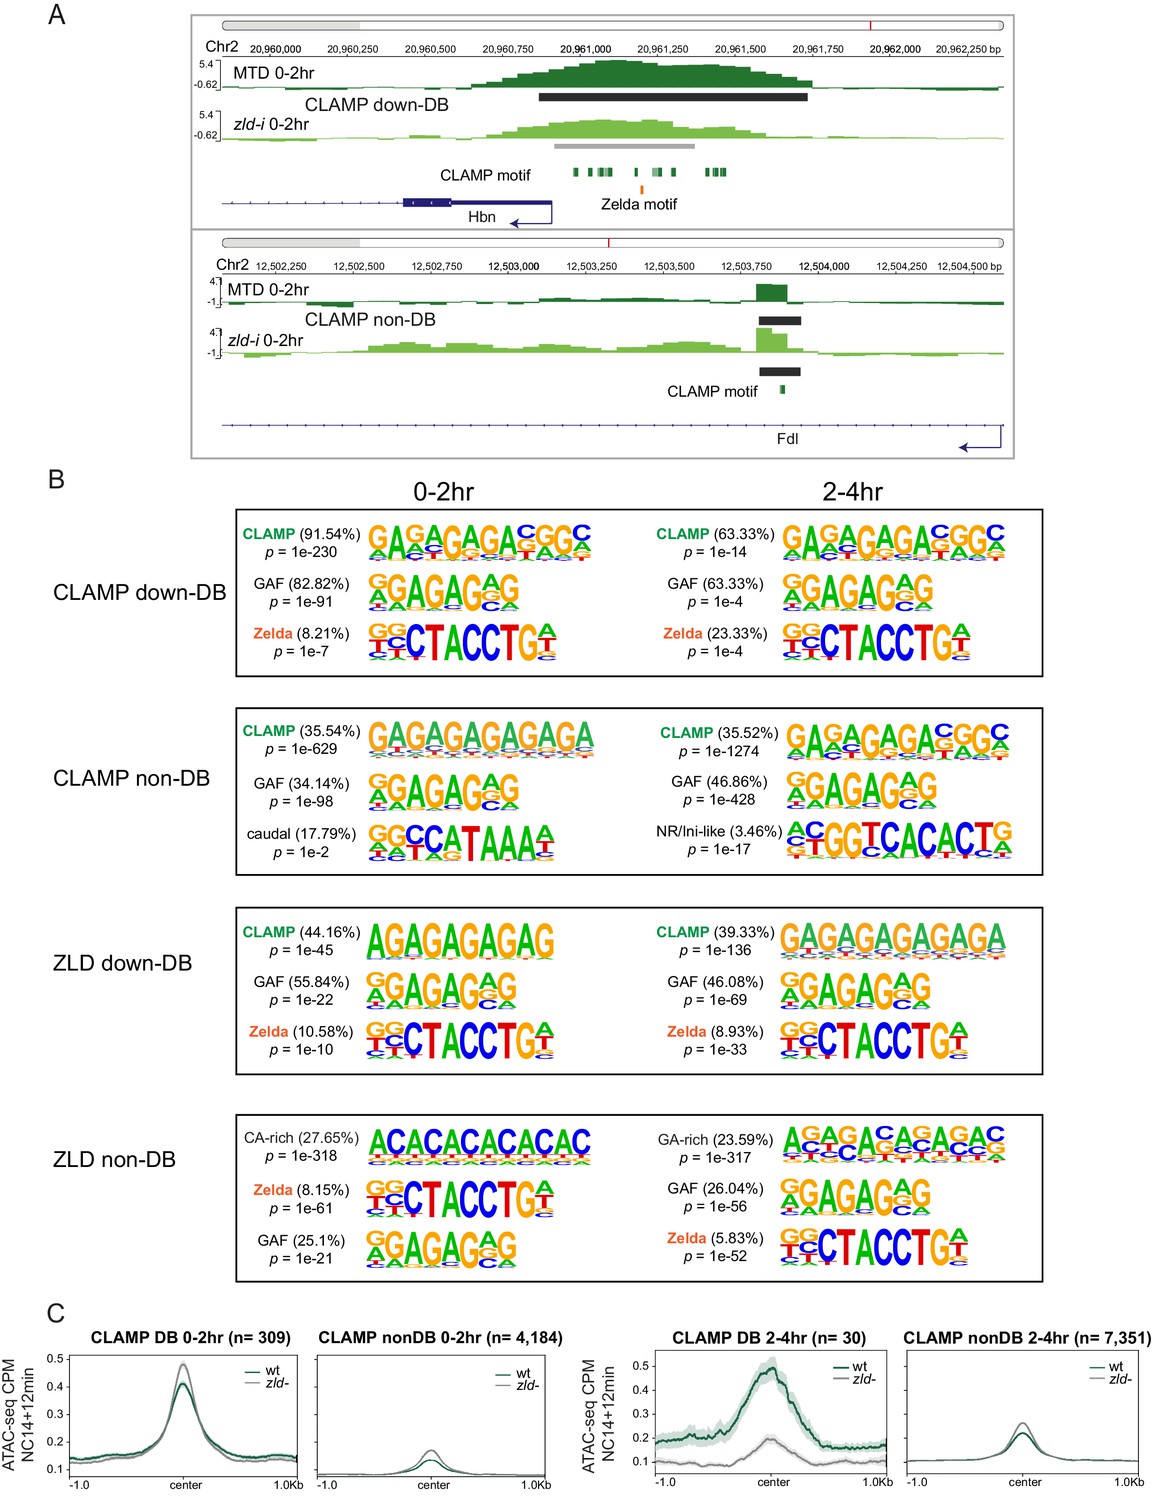
(A) Example IGV views of genomic loci: ChIP-seq in MTD and zld-i embryos at Hbn promoter region (upper panel) with CLAMP differential binding (down-DB) peak; Fdl (lower panel) with CLAMP non-DB peak at an intron. Peaks called by MACS2 are marked in dark gray (non-DB) and gray (down-DB). CLAMP and ZLD motifs are marked in green and orange, respectively. (B) Top three motifs called by Homer for CLAMP down-DB, CLAMP non-DB, ZLD down-DB, and ZLD non-DB peaks sites in 0–2 hr and 2–4 hr embryos. (C) Average profiles of ATAC-seq signal coverage in NC14 +12 min wt and zld- embryos show chromatin accessibility at CLAMP down-DB (green line) and non-DB (gray line) sites defined in 0–2 hr (left panel) or 2–4 hr (right panel) MTD and zld-i embryos. Number of sites is noted on the plot. ChIP-seq, chromatin immunoprecipitation-sequencing; CLAMP, chromatin-linked adaptor for male-specific lethal (MSL) proteins; NC14, nuclear cycle 14; wt, wild-type.
Figure 3—figure supplement 3
CLAMP and ZLD depend on each other for chromatin binding.
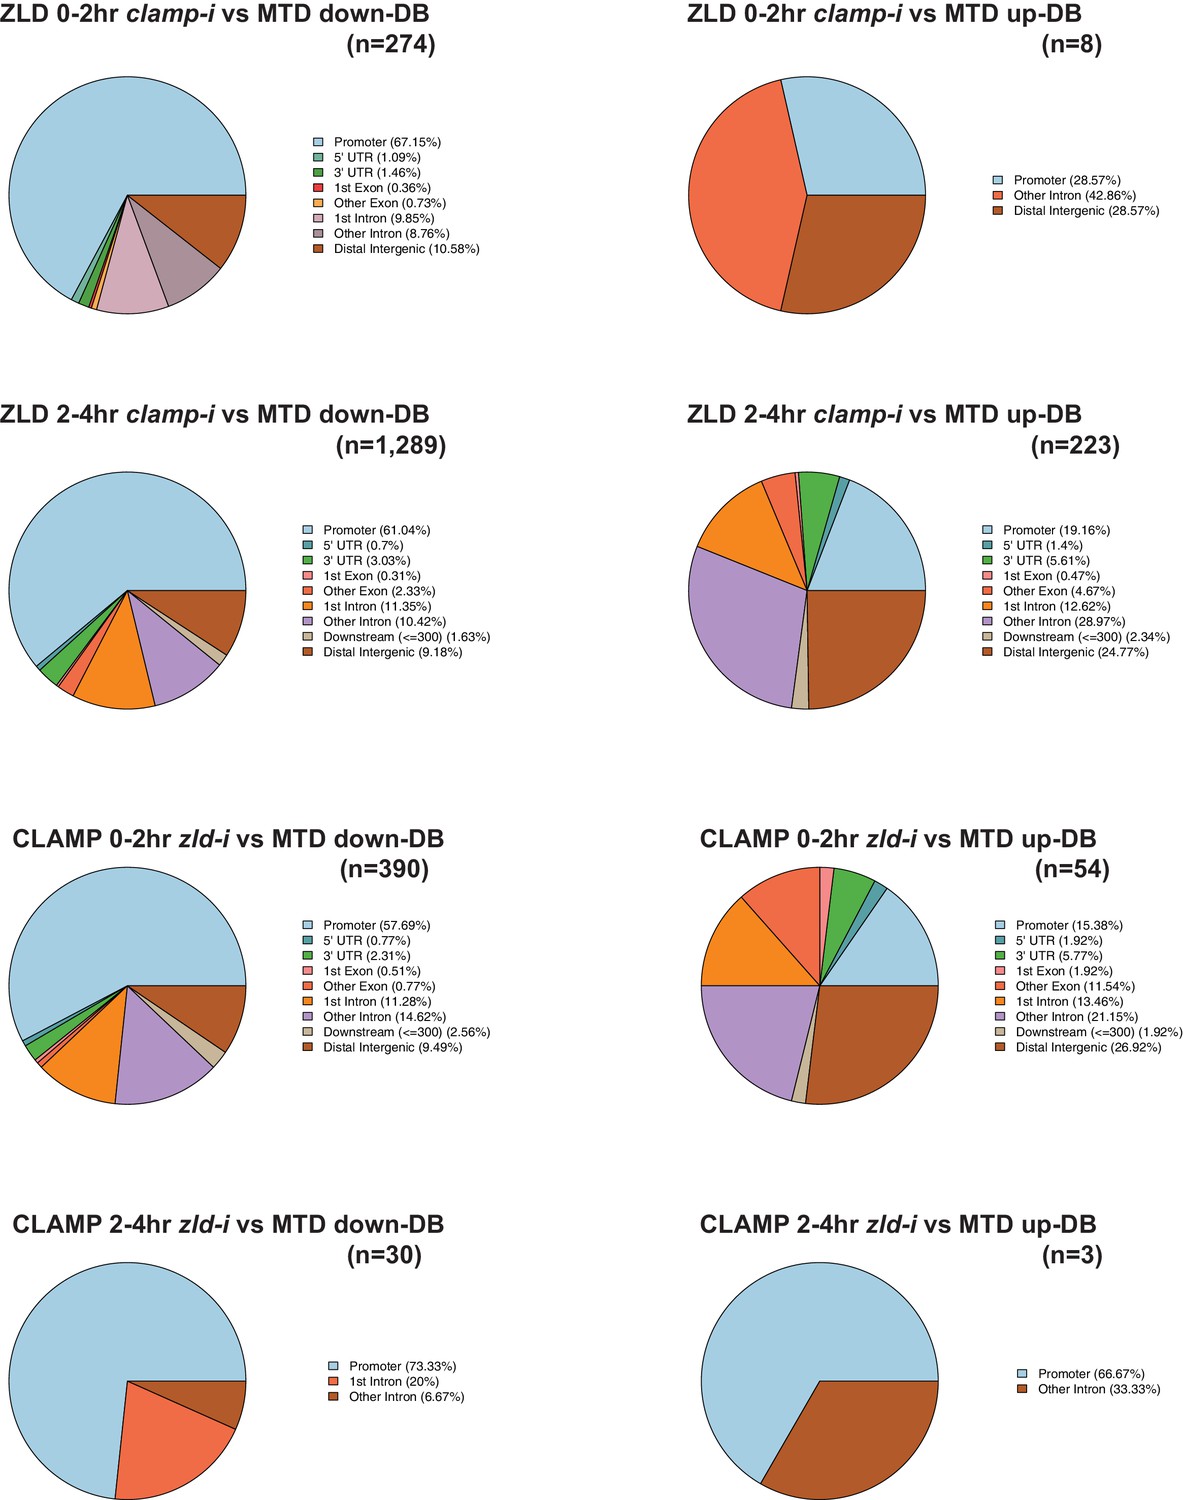
Upper panels: Genomic distribution of ZLD lost (down-DB) or gained (up-DB) binding sites upon maternal clamp RNAi at 0–2 hr and 2–4 hr. Number of sites is noted on the plot. Lower panels: Genomic distribution of CLAMP lost (down-DB) or gained (up-DB) binding sites upon maternal zld RNAi at 0–2 hr and 2–4 hr. Number of sites is noted on the plot. CLAMP, chromatin-linked adaptor for male-specific lethal (MSL) proteins; DB, differential binding.
Figure 4
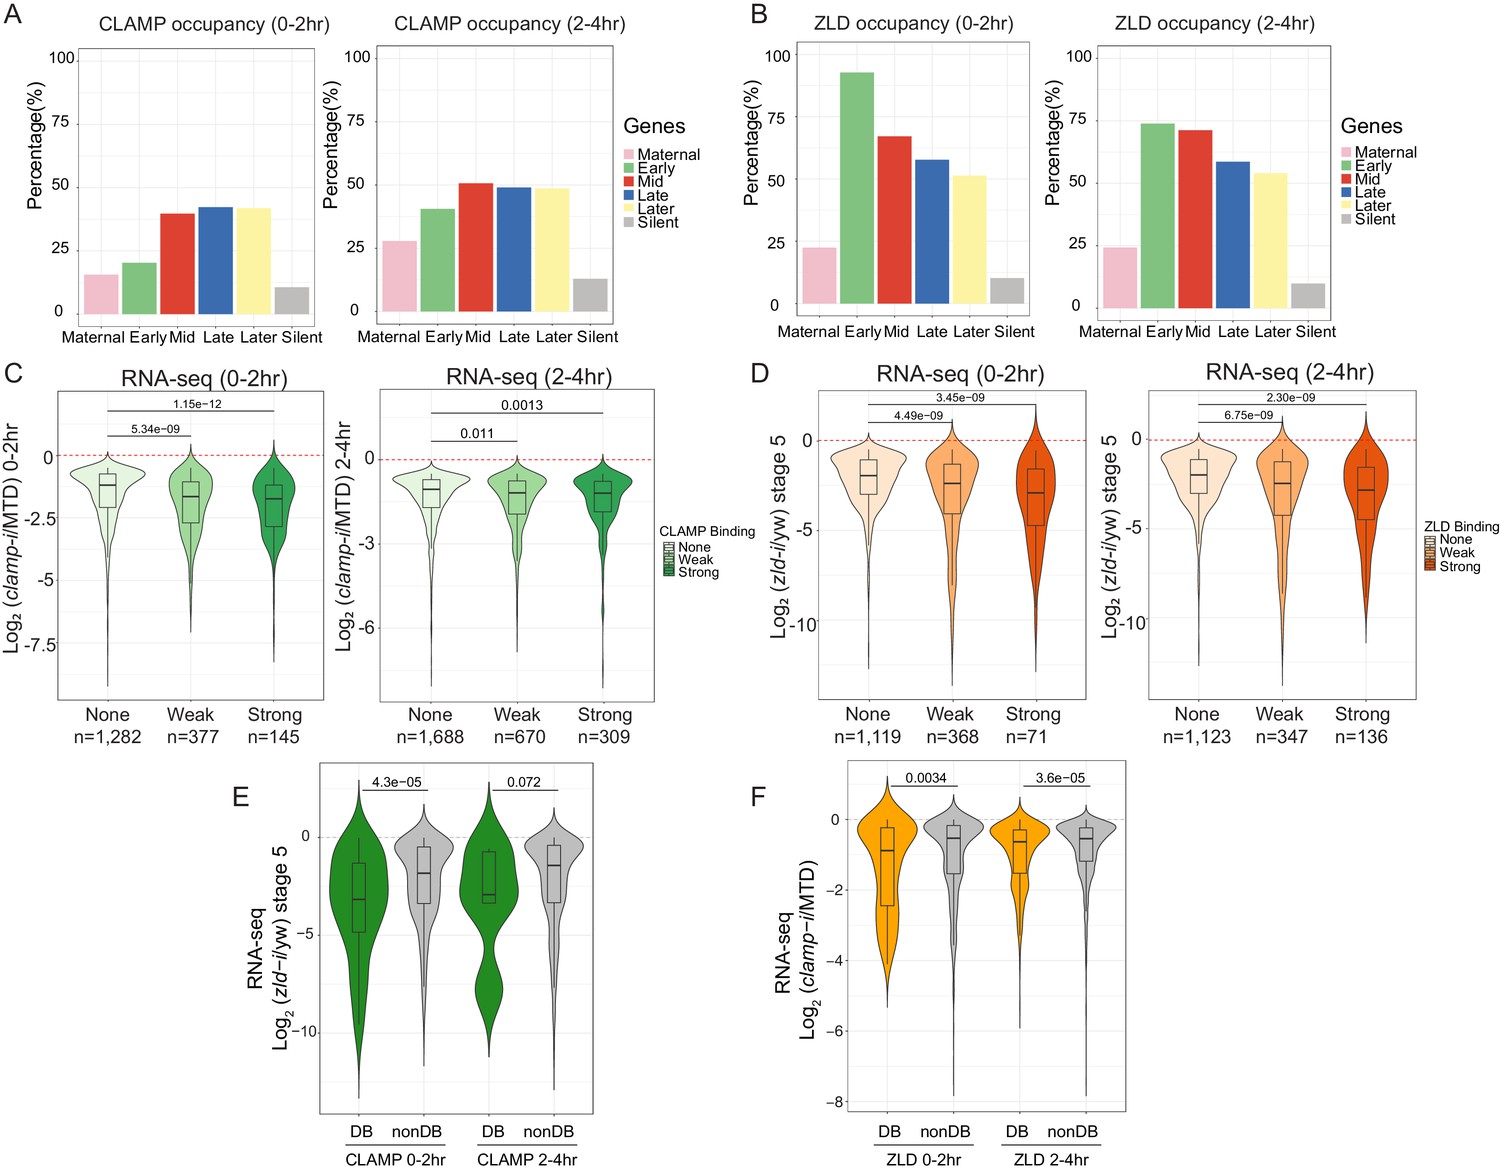
CLAMP and ZLD function together in zygotic genome activation.
(A) Percentage of CLAMP binding sites in 0–2 hr and 2–4 hr embryos distributed in maternal (n=646), early (n=69), mid- (n=73), late- (n=104), later (n=74), and silent (n=921) genes (peaks within a 1-kb promoter region and gene body). Gene categories were defined in Li X-Y et al., 2014. (B) Percentage of ZLD binding sites in 0–2 hr and 2–4 hr embryos distributed in maternal (n=646), early (n=69), mid- (n=73), late- (n=104), later (n=74), and silent (n=921) genes (peaks within a 1-kb promoter region and gene body). Gene categories were defined in Li X-Y et al., 2014. (C) Gene expression changes caused by maternal clamp RNAi (Rieder et al., 2017) at genes with strong, weak, and no CLAMP binding as measured by ChIP-seq in 0–2 hr (left) or 2–4 hr (right) embryos. p-values of significant expression changes of CLAMP bindings were calculated by Mann-Whitney U-test and noted on the plot. (D) Gene expression changes caused by maternal zld RNAi (Schulz et al., 2015) at genes with strong, weak, and no ZLD binding as measured by ChIP-seq in 0–2 hr (left) or 2–4 hr (right) embryos. p-values of significant expression changes of ZLD bindings were calculated by Mann-Whitney U-test and noted on the plot. (E) Gene expression changes caused by maternal zld RNAi (Schulz et al., 2015) at genes with CLAMP down-DB and non-DB that defined in wt versus zld- 0–2 hr and 2–4 hr embryos ChIP-seq. p-values of significant expression changes of CLAMP down-DB and non-DB were calculated by Mann-Whitney U-test and noted on the plot. (F) Gene expression changes caused by maternal clamp RNAi (Rieder et al., 2017) at genes with ZLD down-DB and non-DB that defined in MTD versus clamp-i 0–2 hr and 2–4 hr embryos ChIP-seq. p-values of significant expression changes of ZLD down-DB and non-DB were calculated by Mann-Whitney U-test and noted on the plot. ChIP-seq, chromatin immunoprecipitation-sequencing; CLAMP, chromatin-linked adaptor for male-specific lethal (MSL) proteins; DB, differential binding; wt, wild-type.
Figure 5 with 1 supplement

CLAMP and ZLD regulate gene expression via modulating chromatin accessibility.
(A) Four classes of CLAMP and ZLD co-bound peaks defined by combining ATAC-seq (this study or Hannon et al., 2017; Soluri et al., 2020) and ChIP-seq peaks in 0–2 hr MTD and RNAi embryos. Data is displayed as a heatmap of z-score normalized ATAC-seq and ChIP-seq reads in a 2-kb region centered around each peak. Peaks in each class are arranged in order of decreasing z-scores in control MTD embryos. Type I (n=5): both DA, differentially accessible regions which depend on CLAMP or ZLD; has both proteins bound. Type II (n=23): CLAMP-DA and ZLD non-DA, differentially accessible regions which depend on CLAMP, not on ZLD; has both proteins bound. Type III (n=123): ZLD-DA and CLAMP non-DA, differentially accessible regions which depend on ZLD, not on CLAMP; has both proteins bound. Type IV (n=374): both non-DA, accessibility independent from CLAMP or ZLD; has both proteins bound. (B) Left: Gene expression changes caused by maternal clamp RNAi (Rieder et al., 2017) in 0–2 hr embryos at genes fall into four classes of CLAMP and ZLD co-bound peaks. p-values of significant expression changes among classes were calculated by Mann-Whitney U-test and noted on the plot. Right: Gene expression changes caused by maternal zld RNAi (Schulz et al., 2015) in stage 5 embryos at genes fall into four classes of CLAMP and ZLD co-bound peaks. p-values of significant expression changes among classes were calculated by Mann-Whitney U-test and noted on the plot. (C) Upper panel: Venn diagram showing the number of overlapping sites between GAF-dependent DA sites (Gaskill et al., 2021), ZLD non-DA with ZLD bound, and CLAMP non-DA with CLAMP bound peaks. Lower panel: Venn diagram showing the number of overlapping sites between GAF-dependent DA sites (Gaskill et al., 2021), ZLD non-DA, and CLAMP non-DA peaks. ChIP-seq, chromatin immunoprecipitation-sequencing; CLAMP, chromatin-linked adaptor for male-specific lethal (MSL) proteins.
Figure 5—figure supplement 1
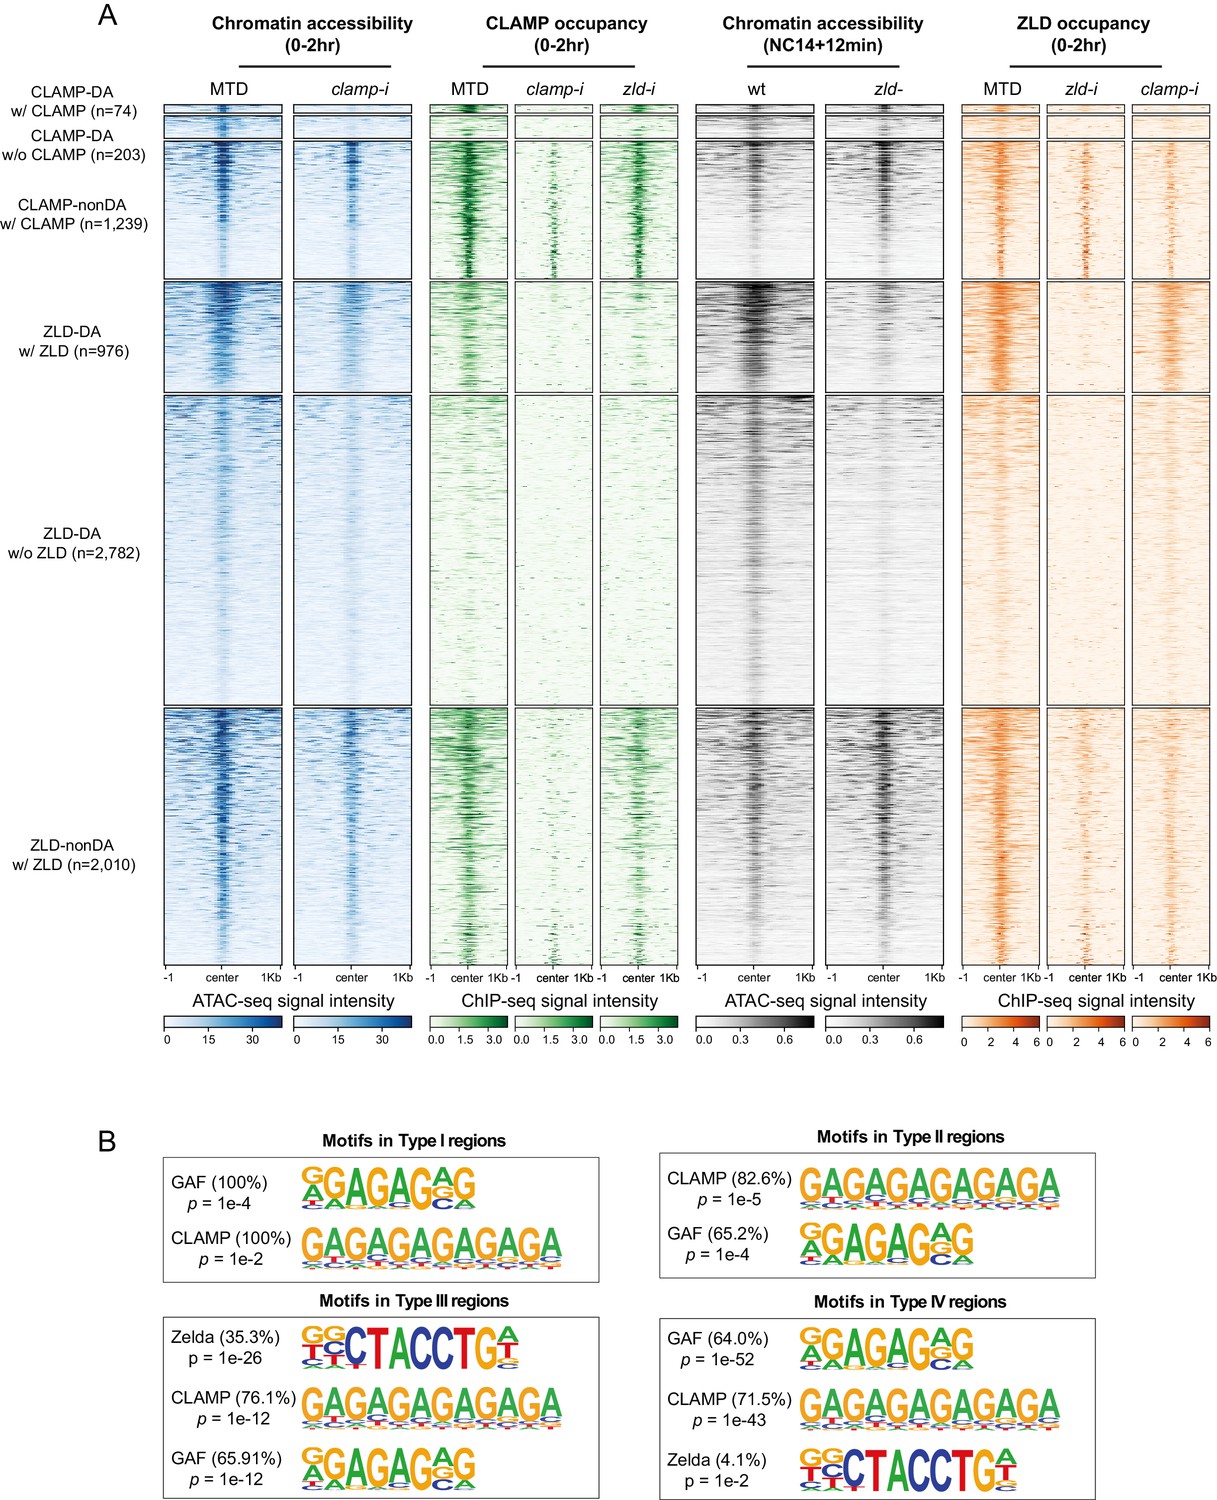
CLAMP-mediated chromatin accessibility is correlated with CLAMP and ZLD binding.
(A) CLAMP-related and ZLD-related peaks defined by combining ATAC-seq (this study or Hannon et al., 2017; Soluri et al., 2020) and ChIP-seq peaks in 0–2 hr MTD and RNAi embryos. Data is displayed as a heatmap of z-score normalized ATAC-seq and ChIP-seq (log2 IP/input) reads, in a 2-kb region centered around each peak. Peaks in each class are arranged in order of decreasing z-scores in control MTD embryos. Peak types and numbers are marked on the plot: DA w/ CLAMP (n=74): differentially accessible regions that depend on CLAMP and has CLAMP binding. DA w/o CLAMP (n=203): differentially accessible regions that depend on CLAMP and has no CLAMP binding. Non-DA w/ CLAMP (n=1238): not differentially accessible regions that have CLAMP binding. DA w/ ZLD (n=986): differentially accessible regions that depends on ZLD and has ZLD binding. DA w/o ZLD (n=2797): differentially accessible regions that depends on ZLD and has no ZLD binding. Non-DA w/ ZLD (n=2301): non-differentially accessible regions which have ZLD binding. Note that non-DA w/o CLAMP (n=15,081) and non-DA w/o ZLD (n=17,758) peaks are omitted from this plot. (B) Top motifs enriched in each type of CLAMP and ZLD co-bound regions. Enrichment p-value and percentage of sequences are noted. ChIP-seq, chromatin immunoprecipitation-sequencing; CLAMP, chromatin-linked adaptor for male-specific lethal (MSL) proteins.
Figure 6

Model for how CLAMP and ZLD pioneer factor function together to define chromatin accessibility in early embryos.
CLAMP and ZLD function together at promoters to regulate each other’s occupancy and gene expression of genes encoding other key TFs. We defined CLAMP and ZLD co-bound peaks in early embryos, which revealed roles for CLAMP and ZLD in defining chromatin accessibility and activating zygotic transcription at a subset of the zygotic genome.CLAMP-dependent regions: CLAMP promotes ZLD enrichment at these sites where CLAMP binding increases chromatin accessibility and regulates target gene expression. These sites are closed and lack binding of ZLD when maternal clamp is depleted, and they remain open and transcription is activated when maternal zld is depleted. ZLD-dependent regions: ZLD modulates chromatin opening and transcription at these sites that are bound by CLAMP but do not depend on CLAMP for chromatin accessibility. These sites are closed and lack binding of CLAMP when maternal zld is depleted, and they remain open and active when maternal clamp is depleted. CLAMP/ZLD-independent regions: GAF or other TFs open chromatin at locations co-bound by CLAMP and ZLD where chromatin accessibility is not altered when each factor is depleted individually. CLAMP and ZLD could also function redundantly at some of these loci. These sites remain accessible and transcriptionally active upon either maternal zld or clamp depletion. CLAMP, chromatin-linked adaptor for male-specific lethal (MSL) proteins; TF, transcription factor.
Tables
Table 1
The number of total and differentially bound peaks for CLAMP and ZLD in control MTD, clamp-i, and zld-i embryos.
| ChIP-seq peaks | CLAMP | ZLD | ||||
|---|---|---|---|---|---|---|
| MTD | clamp-i | zld-i | MTD | clamp-i | zld-i | |
| 0–2 hr | 4962 | 3488 | 4746 | 6974 | 3687 | 4650 |
| 2–4 hr | 7564 | 4064 | 8279 | 8035 | 4687 | 6420 |
| Differential binding (DiffBind, DEseq2) | MTD versus zld-i | MTD versus clamp-i | ||||
| Up-DB | Down-DB | Non-DB | Up-DB | Down-DB | Non-DB | |
| 0–2 hr | 54 | 390 | 4184 | 8 | 274 | 3144 |
| 2–4 hr | 3 | 30 | 7351 | 223 | 1289 | 5672 |
-
Table 1—source data 1
ChIP-seq read counts in peak regions in replicates of MTD and RNAi samples (DiffBind analysis).
Page 1. ZLD ChIP-seq in clamp-i versus MTD in 0–2 hr embryos. Page 2. ZLD ChIP-seq in clamp-i versus MTD in 2–4 hr embryos. Page 3. CLAMP ChIP-seq in zld-i versus MTD in 0–2 hr embryos. Page 4. CLAMP ChIP-seq in zld-i versus MTD in 2–4 hr embryos.
- https://cdn.elifesciences.org/articles/69937/elife-69937-table1-data1-v2.xlsx
Table 2
The number of peaks in four types of CLAMP or ZLD mediated regions.
| ATAC-seq peaks (0–2 hr) | DA w/ CLAMP | DA w/o CLAMP | Non-DA w/ CLAMP | Non-DA w/o CLAMP |
|---|---|---|---|---|
| 16,597 | 74 | 203 | 1239 | 15,081 |
| ATAC-seq peaks (Hannon et al., 2017) (NC14 +12 min) | DA w/ ZLD | DA w/o ZLD | Non-DA w/ ZLD | Non-DA w/o ZLD |
| 19,146 | 976 | 2782 | 2010 | 13,378 |
| CLAMP ZLD co-bound open chromatin regions | Type I (Both DA) | Type II (CLAMP DA) | Type III (ZLD DA) | Type IV (Both non-DA) |
| 525 | 5 | 23 | 123 | 374 |
-
Table 2—source data 1
Peaks locations in each CLAMP or ZLD-related category.
Page 1 Type I (n=5): both DA, CLAMP ZLD co-bound Page 2 Type II (n=23): CLAMP DA and ZLD non-DA, CLAMP ZLD co-bound Page 3 Type III (n=88): ZLD DA and CLAMP non-DA, CLAMP ZLD co-bound Page 4 Type IV (n=434): both non-DA, CLAMP ZLD co-bound Page 5 DA with CLAMP 0–2 hr; Page 6 DA without CLAMP 0–2 hr; Page 7 non-DA with CLAMP 0–2 hr; Page 8 non-DA without CLAMP 0–2 hr; Page 9 DA with ZLD NC14 +12 min; Page 10 DA without ZLD NC14 +12 min; Page 11 non-DA with ZLD NC14 +12 min; Page 12 non-DA, without ZLD NC14 +12 min.
- https://cdn.elifesciences.org/articles/69937/elife-69937-table2-data1-v2.xlsx
Additional files
Download links
A two-part list of links to download the article, or parts of the article, in various formats.
Downloads (link to download the article as PDF)
Open citations (links to open the citations from this article in various online reference manager services)
Cite this article (links to download the citations from this article in formats compatible with various reference manager tools)
CLAMP and Zelda function together to promote Drosophila zygotic genome activation
eLife 10:e69937.
https://doi.org/10.7554/eLife.69937


