Modulation of fracture healing by the transient accumulation of senescent cells
- Division of Endocrinology, Mayo Clinic, United States
- Robert and Arlene Kogod Center on Aging, Mayo Clinic, United States
- Department of Trauma, Orthopedics and Reconstructive Surgery, Georg-August-University of Goettingen, Germany
- Division of Physiology and Biomedical Engineering, Mayo Clinic College of Medicine, Mayo Clinic, United States
- Division of Gastroenterology and Hepatology, Mayo Clinic, United States
Figures
Figure 1
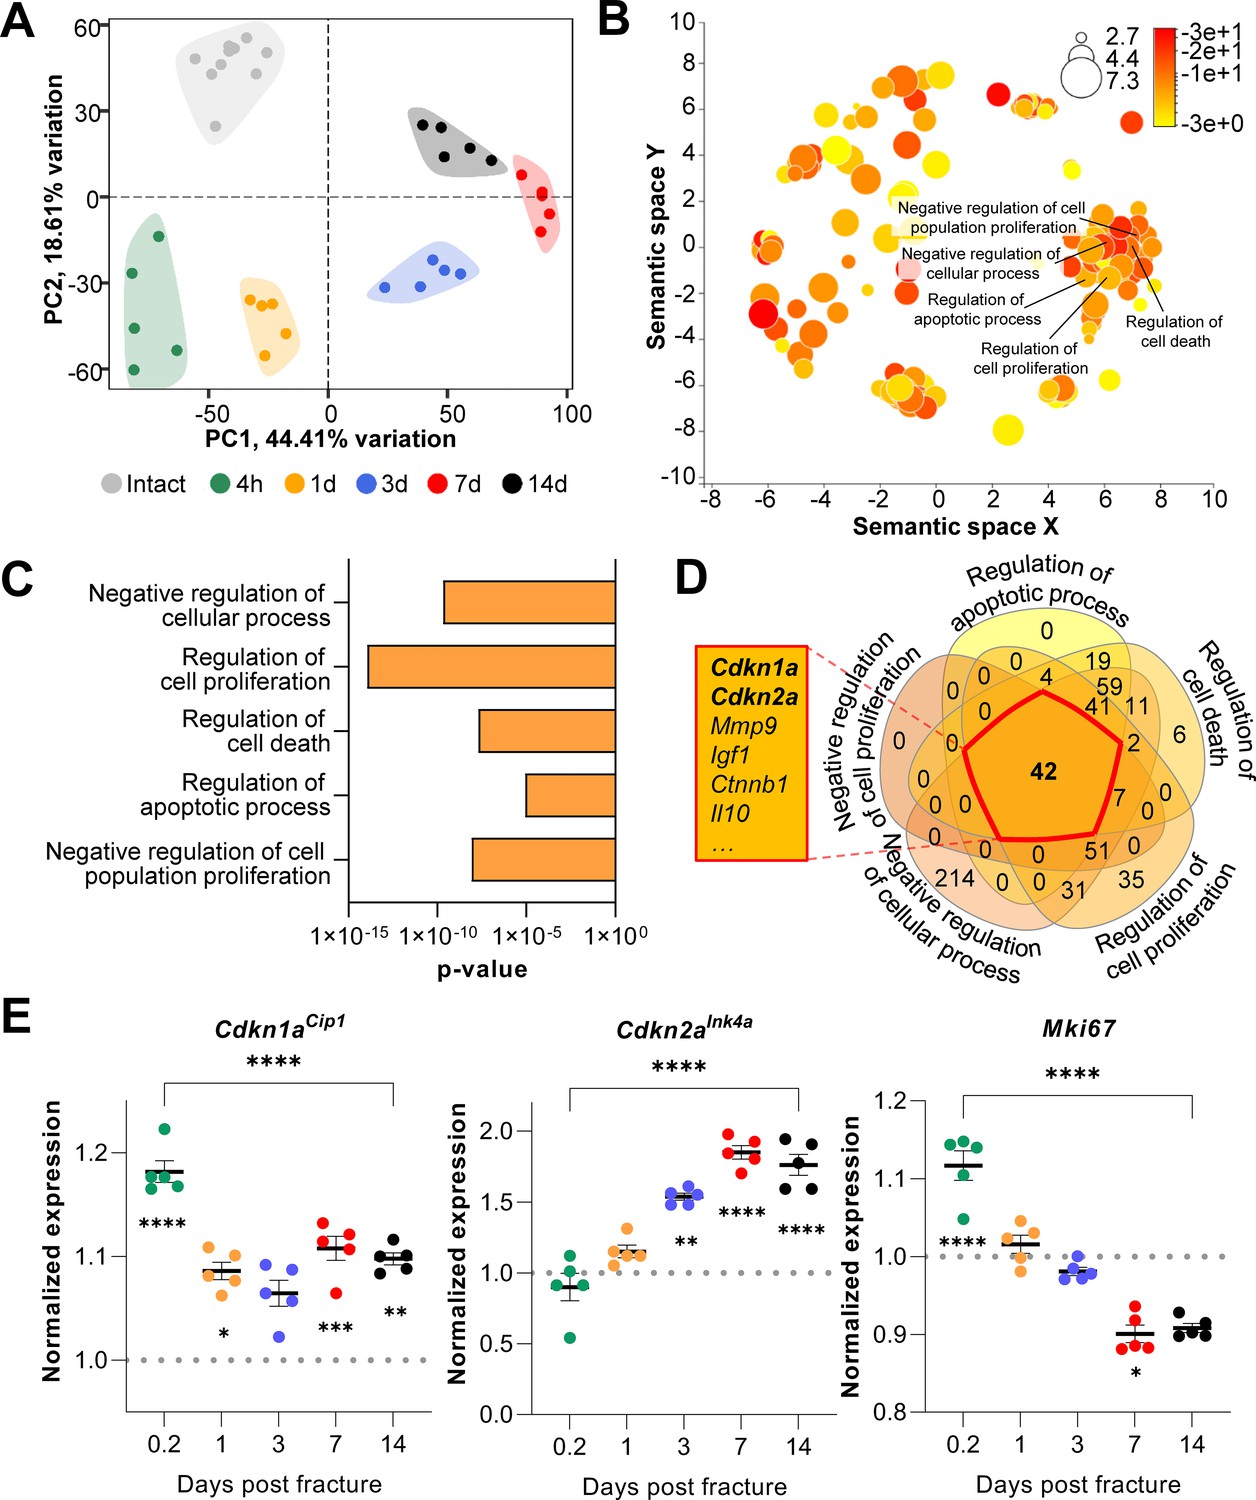
Cdkn1aCip1 and Cdkn2aInk4a are upregulated after the induction of femoral fractures in mice.
Transcriptome-wide changes during femoral fracture healing in mice were analyzed using publicly available mRNA-seq data (GSE152677 Coates et al., 2019). (A) Principal component analysis (PCA) illustrates the variance of gene expression profiles when comparing intact controls to fractured femora (0.2, 1, 3, 7, and 14 days post fracture; n = 5 per time point). (B) Cellular pathways affected by gene expression changes 14 days after fracture compared to intact controls were detected using gene ontology (REVIGO; Supek et al., 2011). (C) REVIGO revealed that pathways associated with cell proliferation and cell death (GO:0048523, GO:0042127, GO:0010941, GO:0042981, GO: 0008285) were significantly affected 14 days after a mid-diaphyseal stabilized femoral fracture. (D) When overlapping these pathways, 42 genes were found to be present in all gene sets, including Cdkn1aCip1 and Cdkn2aInk4a. (E) Normalized mRNA expression kinetics reveal an upregulation of Cdkn1aCip1 and Cdkn2aInk4a during fracture healing while Mki67 levels decreased. The dotted line represents the normalized baseline expression of intact control femora. The small asterisks indicate differences from the control. A-E: n = 35, all female. Mean ± SEM. One-way ANOVA; *p < 0.05, **p < 0.01, ***p < 0.001, ****p < 0.0001.
-
Figure 1—source data 1
Source data (normalized counts, REVIGO results, DE genes) for Figure 1, panels A-E.
- https://cdn.elifesciences.org/articles/69958/elife-69958-fig1-data1-v2.xlsx
Figure 2
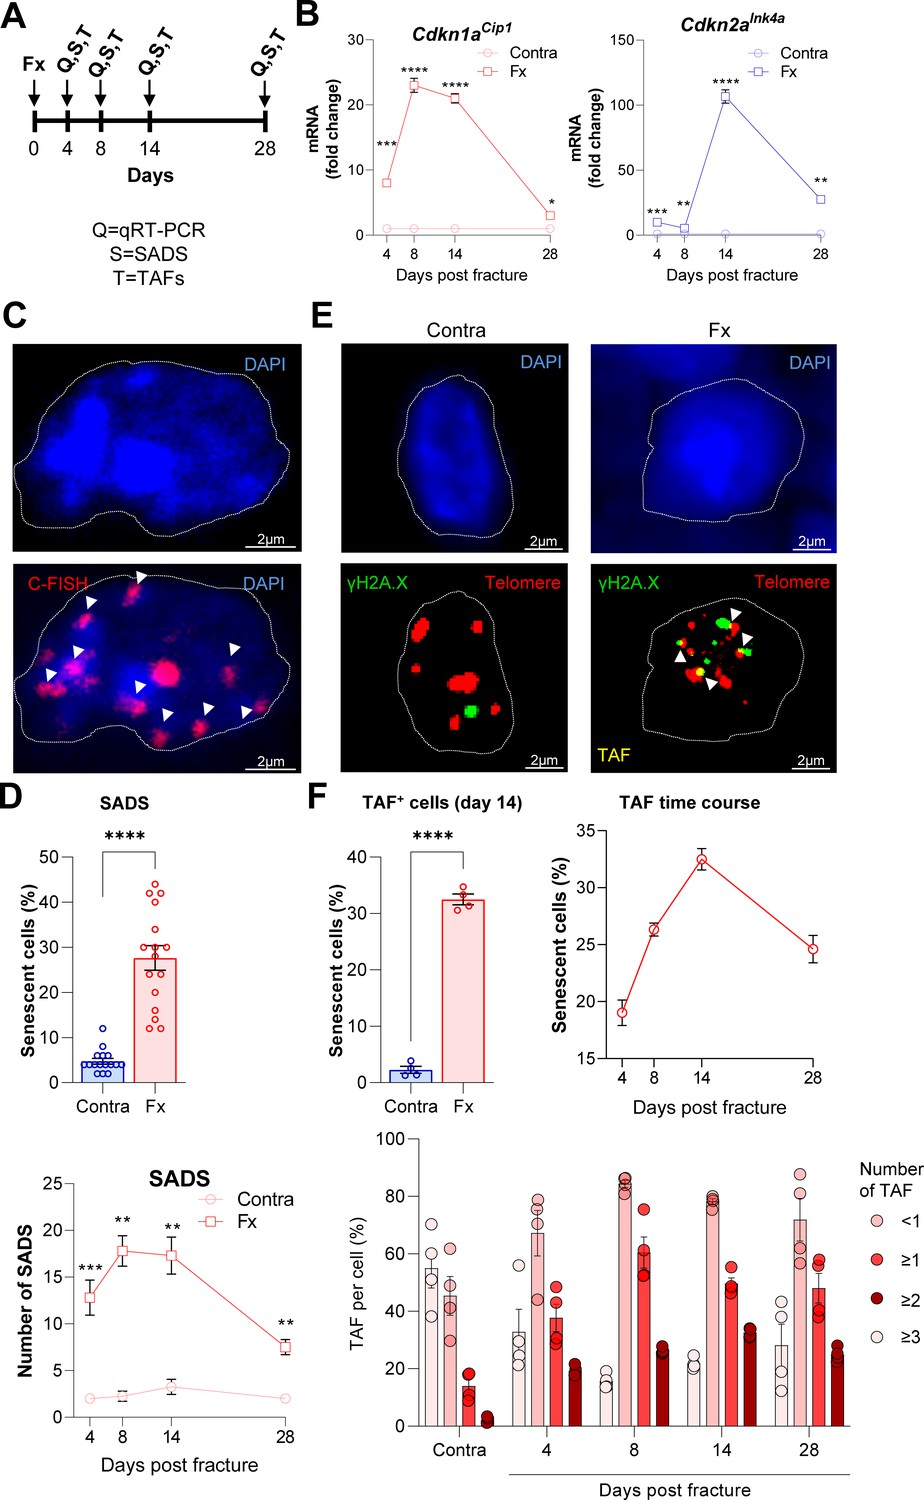
Cellular senescence is induced during femoral fracture healing.
(A) Femoral fractures (Fx) were induced in male C57BL/6 mice with contralateral (Contra), intact control femora. Callus and controls were analyzed 4, 8, 14, and 28 days after fracture (n = 4 per time point). (B) Cdkn1aCip1 and Cdkn2aInk4a mRNA expression levels during fracture healing were determined at each time point using rt-qPCR. Cdkn1aCip1 was strongly induced 8–14 days and Cdkn2aInk4a 14 days post fracture. (C) Senescence-associated distension of satellites (SADS) were detected using immune-fluorescent in situ hybridization (FISH) Top: representative image of the contralateral side. Below: fractured side with four SADS. (D) The total number of SADS as well as percentage of SADS-positive cells ( ≥ 4 SADS/cell) at all time points was increased in the callus compared to the contralateral control femur. (E) Telomere-associated foci (TAF) were determined using FISH to detect telomeres (red) and immunofluorescent staining for γH2A.X (green). TAF (yellow, see arrowheads) were defined as sites of γH2A.X-associated DNA damage co-localized with telomeres (n = 70 cells were analyzed per bone). (F) The highest percentage of TAF were detected on day 14 of fracture healing. The number of TAF-positive senescent cells ( ≥ 3 TAF/cell) was increased in fractured bones throughout the entire healing period. B: n = 24 (n = 24 in Contra, n = 24 in Fx, n = 6 per timepoint), all male. C-D: n = 16 (n = 16 in Contra, n = 16 in Fx), all male. E-F: n = 20 (n = 4 per time point and n = 4 in contra on day 14), all male. Mean ± SEM. One-way ANOVA or Student’s t-test for pairwise comparisons; *p < 0.05, **p < 0.01, ***p < 0.001, ****p < 0.0001.
-
Figure 2—source data 1
Source data (raw ct values, for Figure 2, panel B), raw numbers for SADS (panel D) and TAF (panel F).
- https://cdn.elifesciences.org/articles/69958/elife-69958-fig2-data1-v2.xlsx
Figure 3

Cdkn2aInk4a-positive cells are present at the fracture site and negatively affect callus formation.
The involvement of Cdkn2aInk4a-expressing cells in callus was evaluated in Cdkn2aLUC or wild type (WT) mice. (A) Tibial fractures (Fx) were induced and Cdkn2aInk4a-dependent luminescence was analyzed between 2 and 23 days after fracture using Xenogen. X-rays were performed weekly and callus was isolated at day 28 for subsequent rt-qPCR. (B) Representative Xenogen images of Cdkn2aInk4a-associated luminescence at fracture sites in Cdkn2aLUC mice. (C) Luminescence corresponding to Cdkn2aInk4a-expression after tibial fracture in WT and Cdkn2aLUC mice as detected using Xenogen. Cdkn2aInk4a-associated luminescence reached its maximum 15 days after fracture while no signal was detected in WT controls. (D) Bone healing was scored based on X-ray analysis according to Wehrle and colleagues (Wehrle et al., 2019). Healing kinetics were similar among genotypes. (E) Relative callus area was quantified after X-ray analysis using FIJI. (F) Cdkn2aLUC mice displayed an increase in callus area as determined by calculating the area under the curve (AUC, p = 0.036). (G) Callus bone volume (BV) was measured and visualized postmortem using micro-CT. The depletion of Cdkn2aInk4a-expressing cells resulted in significantly elevated callus BV. B-C: 6 WT (3 males, 3 females), 8 Cdkn2aLuc (4 males, 4 females), D-F: 6 WT (3 males, 3 females), 6 Cdkn2aLuc (3 males, 3 females), G: 6 WT (3 males, 3 females), 6 Cdkn2aLuc (3 males, 3 females). Mean ± SEM. One-way ANOVA or Student’s t-test for pairwise comparisons; *p < 0.05, **p < 0.01.
-
Figure 3—source data 1
Source data (raw AU values, for Figure 3, panel B, C), raw scores (panel D), area (panel E), AUC (panel F), and BV (panel G).
- https://cdn.elifesciences.org/articles/69958/elife-69958-fig3-data1-v2.xlsx
Figure 4 with 2 supplements
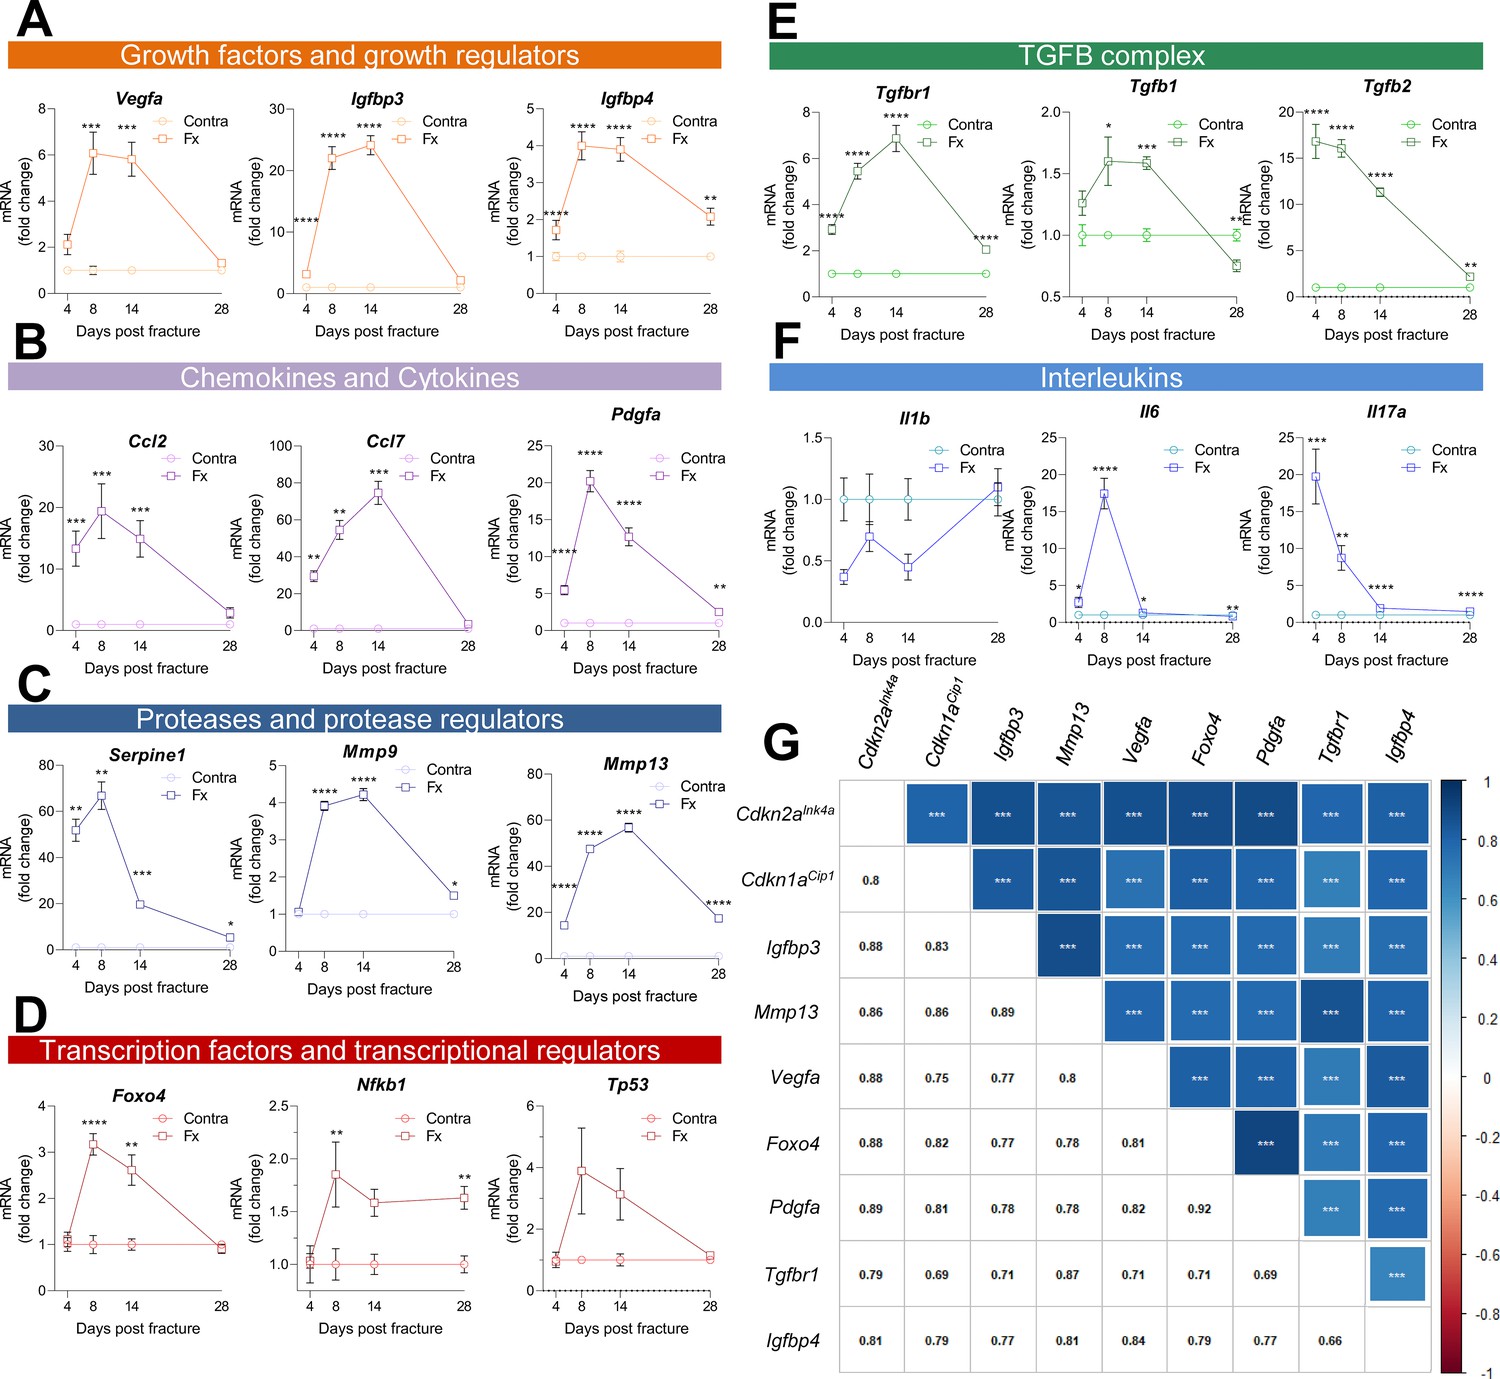
Multiple SASP factors show a marked increase in the healing callus, while distinct genes form similarly behaving clusters.
SASP-associated factors can be subdivided into functional subunits. (A) mRNA expression of the growth factors Vegfa, Igfbp3, and Igfbp4 substantially increased during the callus forming phase (days 2–15). (B) The chemokines Ccl2 and Pdgfa more profoundly rose in gene expression levels in the soft callus (days 2–7) but not in the hard callus (days 8–14) phase, while Ccl7 was more than 70-fold increased on day 14. (C) Expression of the protease Serpine1 was elevated in the soft callus phase, similar to Pdgfa, while Mmp9 and Mmp13 peaked on day 14. (D) The transcription factors Foxo4, Nfkb1, and Tp53 peaked on day 8, marking the beginning of hard callus formation. (E) TGFβ-associated genes displayed heterogeneous expression patterns. While Tgfbr1 peaked on day 14, Tgfb1 reached a plateau on days 8 and 14, and Tgfb2 gradually declined after an initial peak on day 4. (F) Among the interleukins, Il1b was negatively regulated in the beginning of the healing phase, while Il6 shortly peaked in the inflammatory and soft callus phase. Il17a showed a gradually decline, comparable to Tgfb2. (G) The largest cluster displaying similar gene expression patterns among all senescence-associated and SASP-gene markers included the key cell cycle regulators Cdkn2aInk4a and Cdkn1aCip1. The square size is proportional to the correlation coefficient, which is also depicted in the left bottom corner. Significant results were indicated with asterisks. A-G: n = 24 (n = 24 in Contra, n = 24 in Fx, 6 per time point per group), all male. Mean ± SEM. Multiple t-test (FDR); *p < 0.05, **p < 0.01, ***p < 0.001, ****p < 0.0001.
-
Figure 4—source data 1
Source data (raw ct values, for Figure 4, panel A-F), raw matrix (panel G).
- https://cdn.elifesciences.org/articles/69958/elife-69958-fig4-data1-v2.xlsx
Figure 4—figure supplement 1
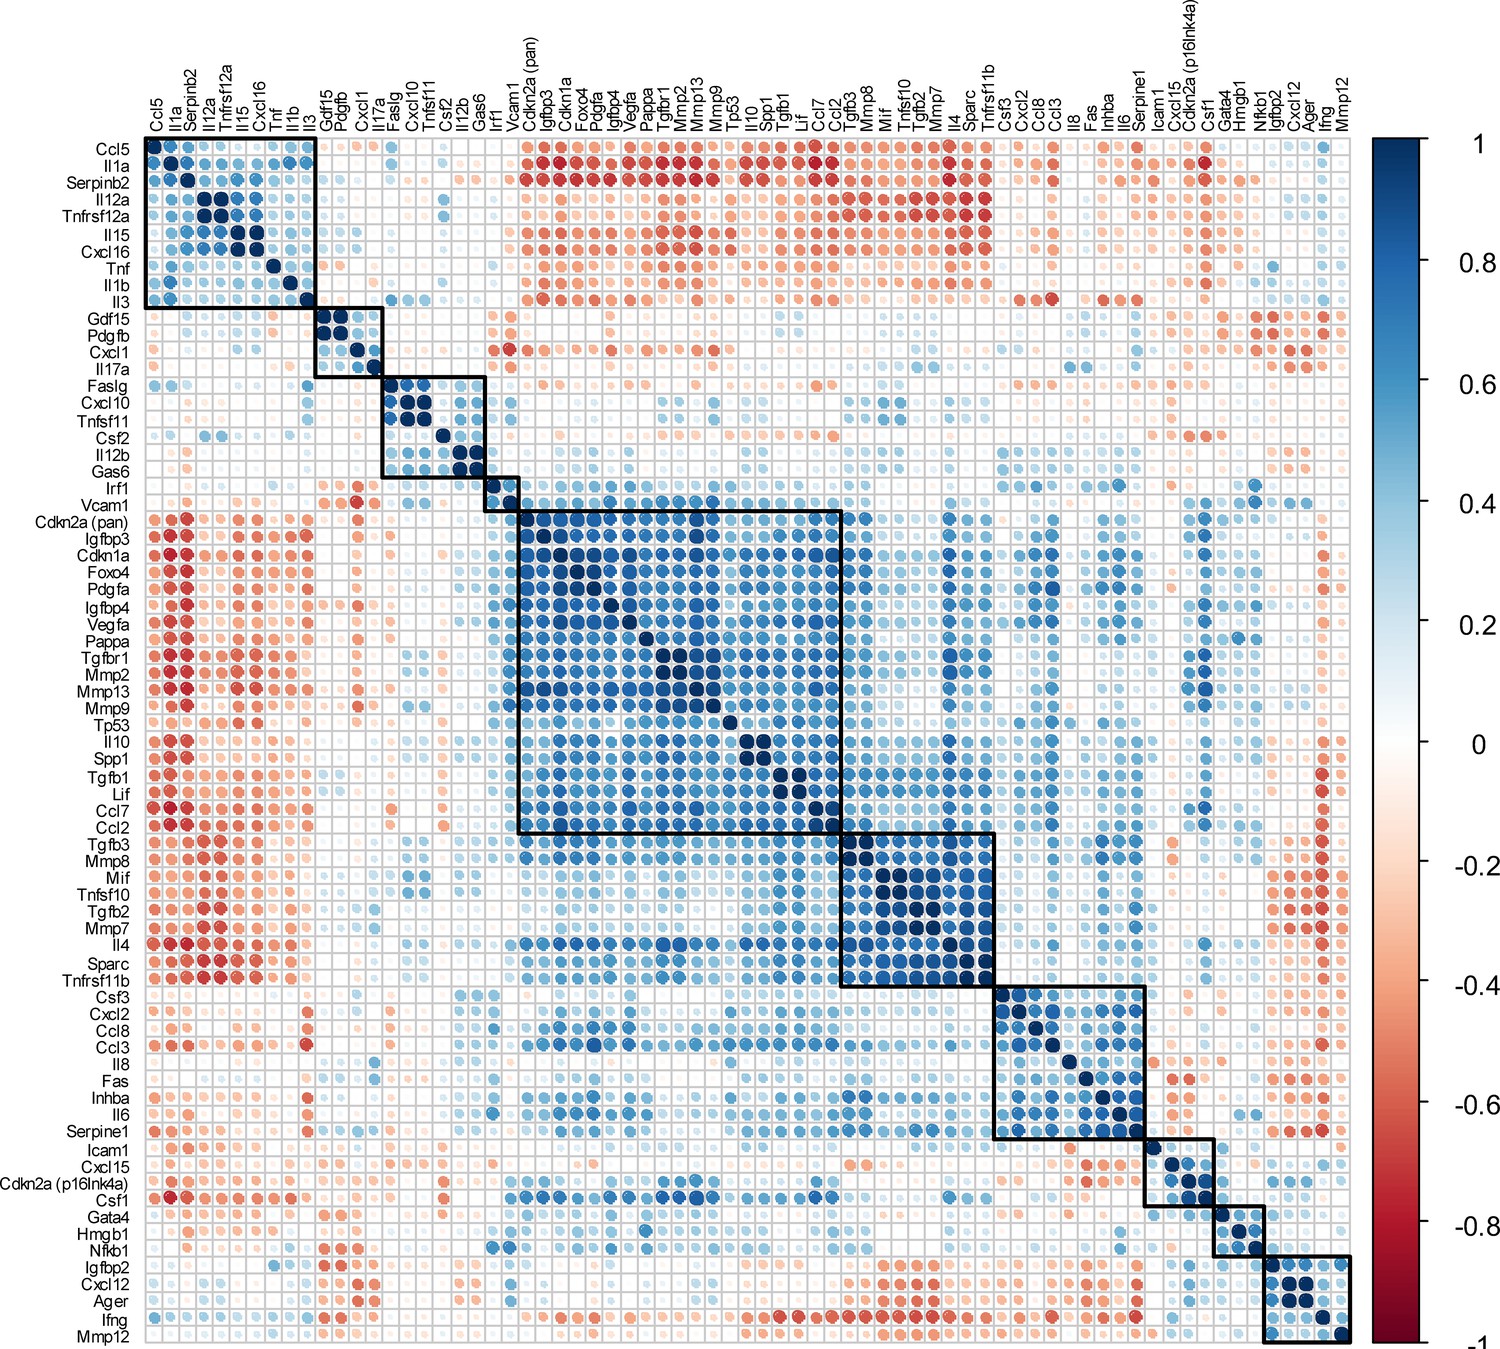
Matrix of all SASP-associated genes and the two senescence key regulators Cdkn2aInk4a and Cdkn1aCip1.
(A) All SASP-associated genes and the two senescence key regulators Cdkn2aInk4a and Cdkn1aCip1 are displayed. The color of each dot and its size represent the correlation coefficient (blue: positively regulated, red: negatively regulated). Automated clustering led to ten clusters, out of which the largest central cluster was depicted in Figure 4G. A: n = 48 (n = 24 in Contra, n = 24 in Fx, n = 6 per timepoint), all male.
-
Figure 4—figure supplement 1—source data 1
Raw matrix of the calculated matrix.
- https://cdn.elifesciences.org/articles/69958/elife-69958-fig4-figsupp1-data1-v2.xlsx
Figure 4—figure supplement 2
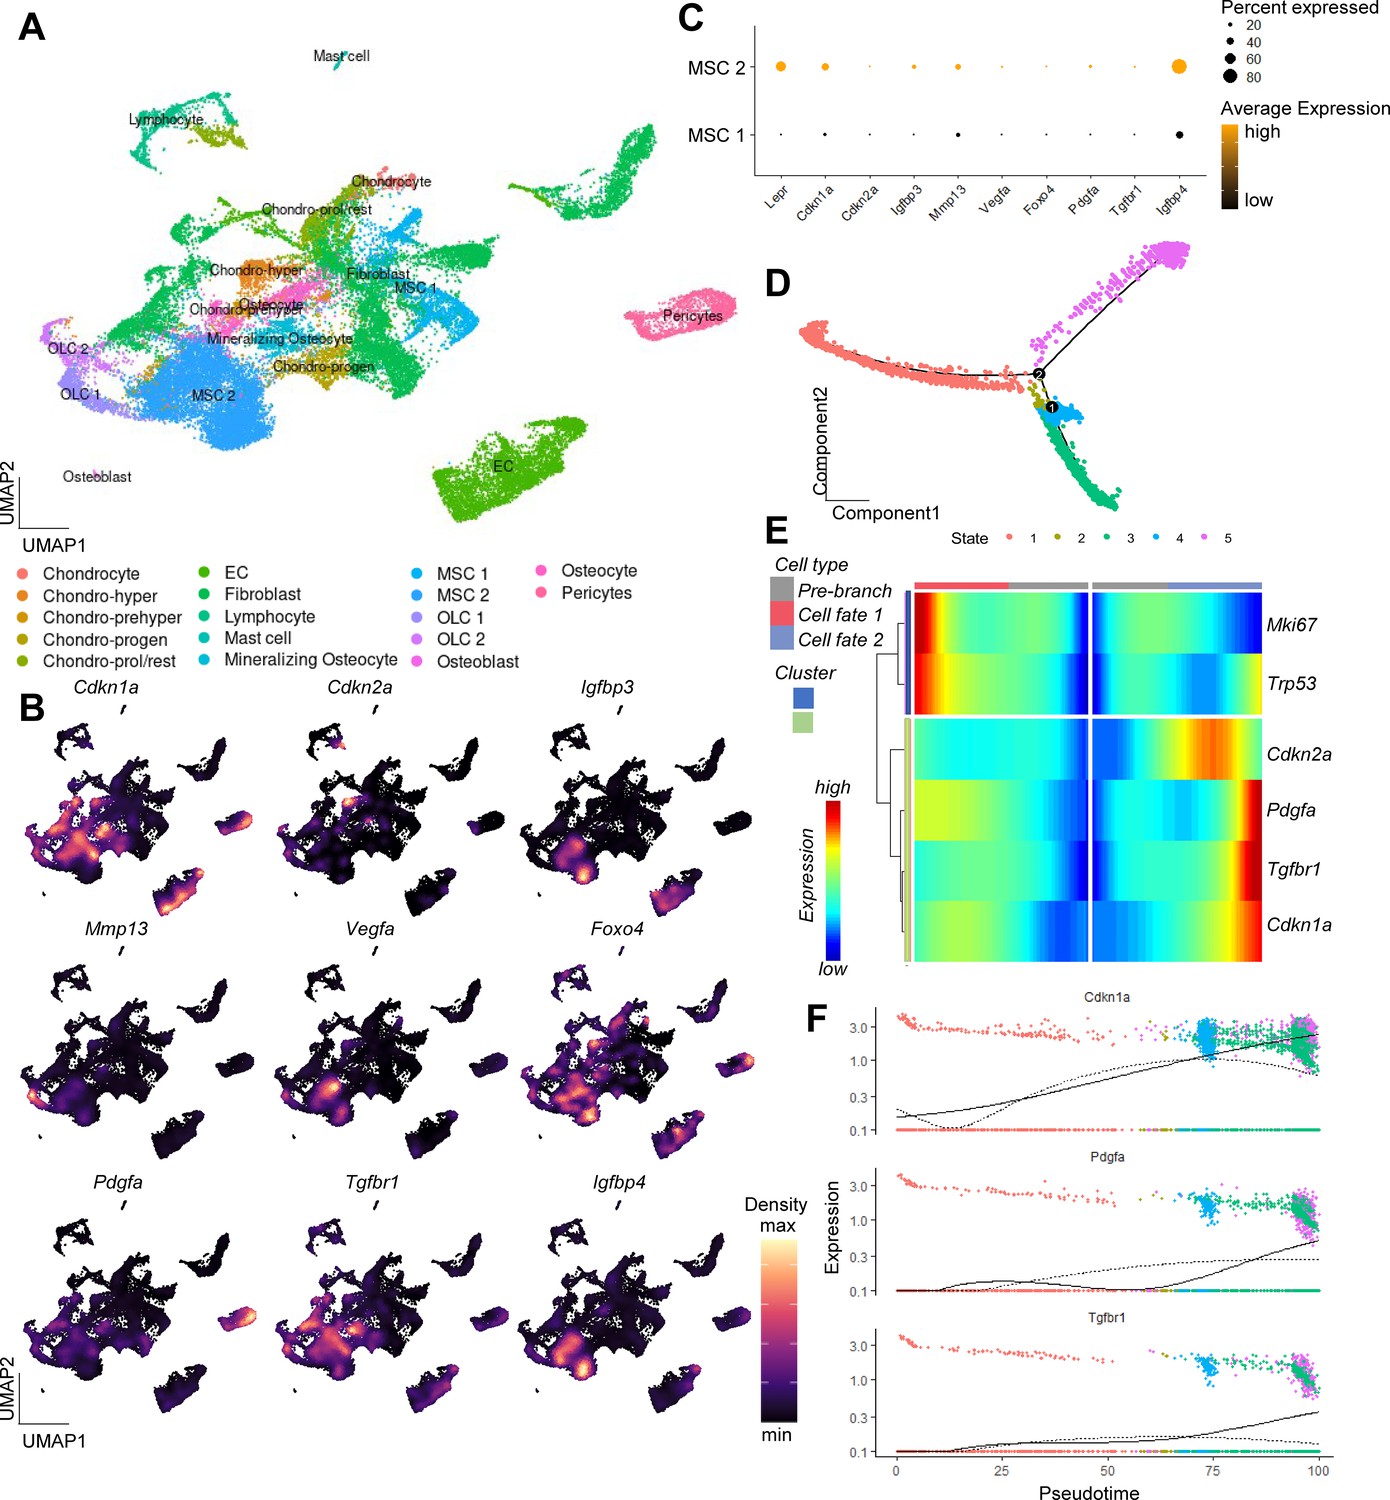
Single-cell analysis of murine bone and bone marrow unveiling a potential origin of SASP secreting cells.
(A) A Uniform Manifold Approximation and Projection (UMAP) representation of murine bone and bone marrow (Baryawno et al., 2019, GSE128423), after unsupervised clustering using the Seurat package (Butler et al., 2018). Distinct cellular populations were clustered based on their expression patterns. (B) Applying the expression pattern of the experimentally verified central senescence-associated and SASP genes, the highest overlap was found within the MSC cluster, specifically in the MSC two cluster (C), which was used for the subsequent pseudotime analysis. The density of each population’s expression is estimated using Kernel Gene-Weighted Density with Nebulosa (Alquicira-Hernandez and Powell, 2021) (D) Pseudotime of MSCs showed divergent cell fates (branch point 2), out of which (E) oone fate is characterized by increased Pdgfa, Tgfbr1, and Cdkn1aCip1 and reduction of Mki67, pointing at a senescent state. (F) The longitudinal pseudotime expression pattern depicts a marked increase of Cdkn1aCip1 in the late cellular fate along with certain SASP markers like Pdgfa and Tgfbr1. A-E: n = 8, all male.
Figure 5
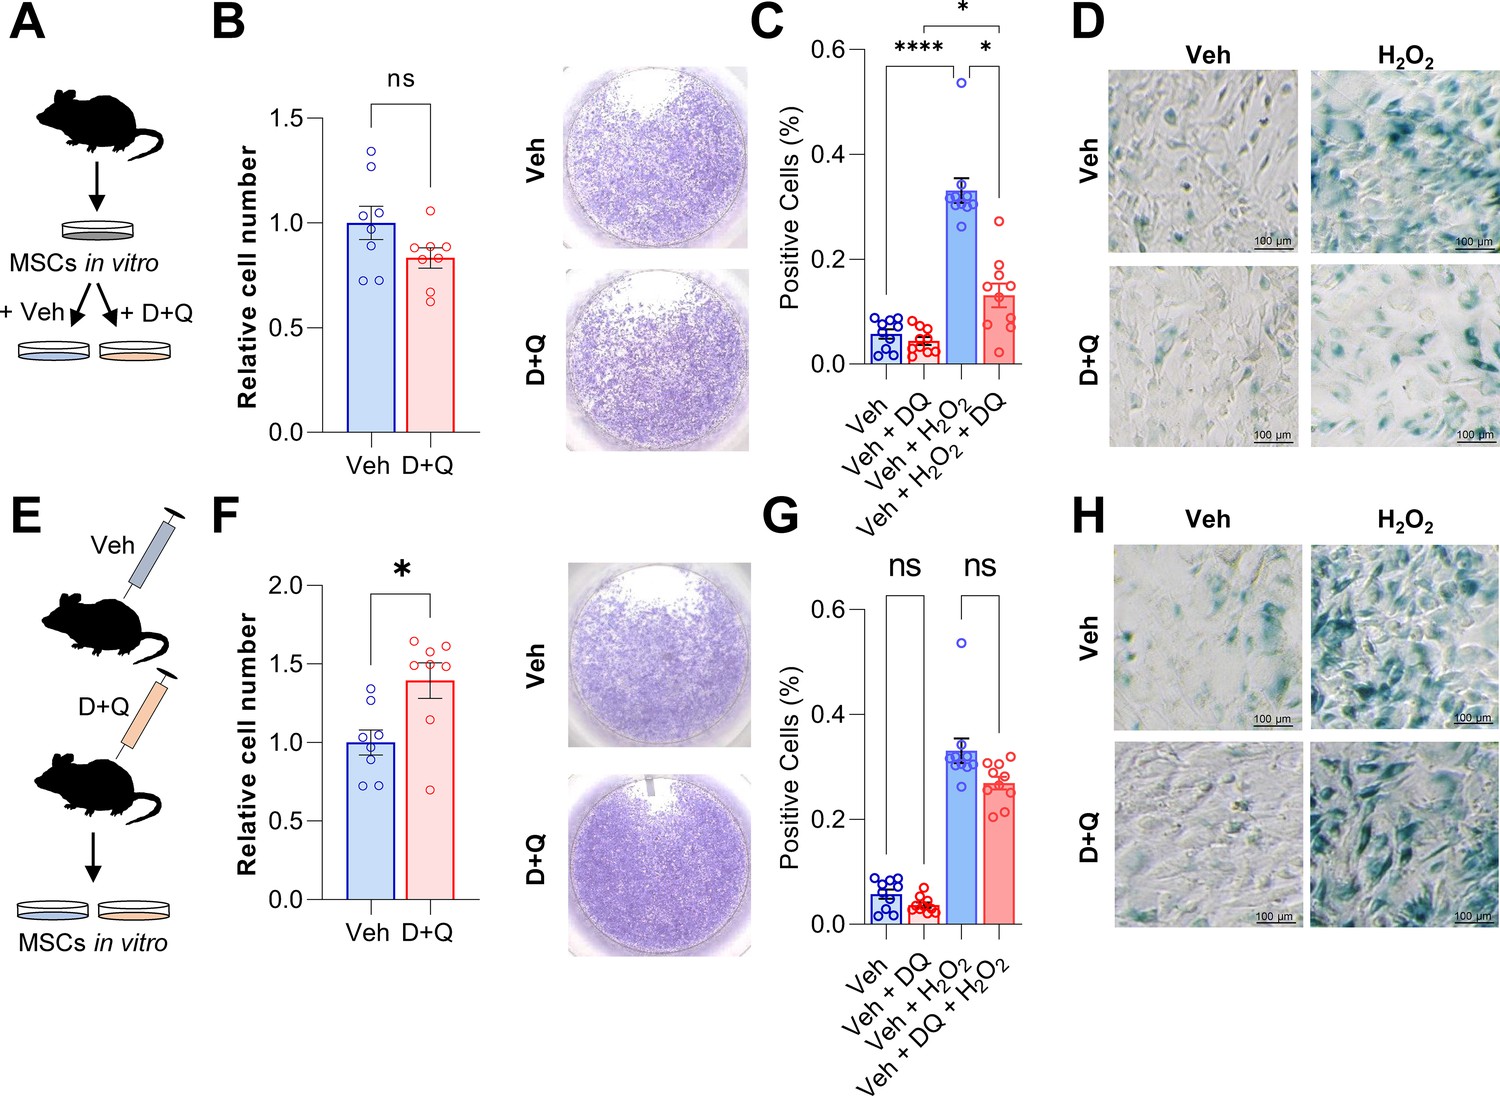
D + Q treatment can partially rescue senescence in MSCs in vitro.
(A) Bone marrow MSCs were isolated from wild-type mice and grown in vitro until a confluence of approximately 70 % was observed. (B) After seeding the same cell numbers, MSCs were incubated with 200 nM Dasatinib and 50 µM Quercetin (D + Q) or vehicle solution for 24 hr. Relative cell numbers were evaluated 24 hr after D + Q or vehicle treatment (n = 6 per treatment). Besides using an automated cell counter, cells were stained using crystal violet to visualize cell densities. D + Q treatment did not change relative cell numbers. (C) MSCs were treated with 100 µM H2O2 for 4 hr to induce senescence, washed with PBS and cultured for another three days. Afterwards, cells were treated with D + Q or vehicle solution for 24 hr. After fixation, senescent cells were visualized using SA-β-Gal staining and quantified using FIJI (n = 4). (D) Representative images of SA-β-Gal staining. While H2O2-induced senescence, this effect was rescued by subsequent D + Q treatment. (E) Wild type mice were treated with 5 mg/kg BW Dasatinib and 50 mg/kg body weight Quercetin or vehicle via oral gavage weekly for 5 weeks. Bone marrow MSCs were isolated and cultured in vitro. (F) Relative cell number of D + Q-treated mice was increased 48 hr after seeding the same cell numbers (n = 6). Cell confluence was visualized using crystal violet staining. (G) In vivo treatment with D + Q resulted in a minor reduction in the number on senescent cells. H2O2 treatment induced cellular senescence in a comparable manner to the previous approach (C). (H) Representative images of SA-β-Gal staining. An a priori in vivo treatment with D + Q did not significantly reduce the proportion of cells becoming senescent after H2O2 treatment. A-H: n = 16, all male (n = 8 in Veh, n = 8 in D + Q). Mean ± SEM. One-way ANOVA or Student’s t-test for pairwise comparisons; *p < 0.05, **p < 0.01, ***p < 0.001, ****p < 0.0001.
-
Figure 5—source data 1
Raw cell numbers for Figure 5, panel B, F, raw cell numbers (panel C, G).
- https://cdn.elifesciences.org/articles/69958/elife-69958-fig5-data1-v2.xlsx
Figure 6 with 1 supplement
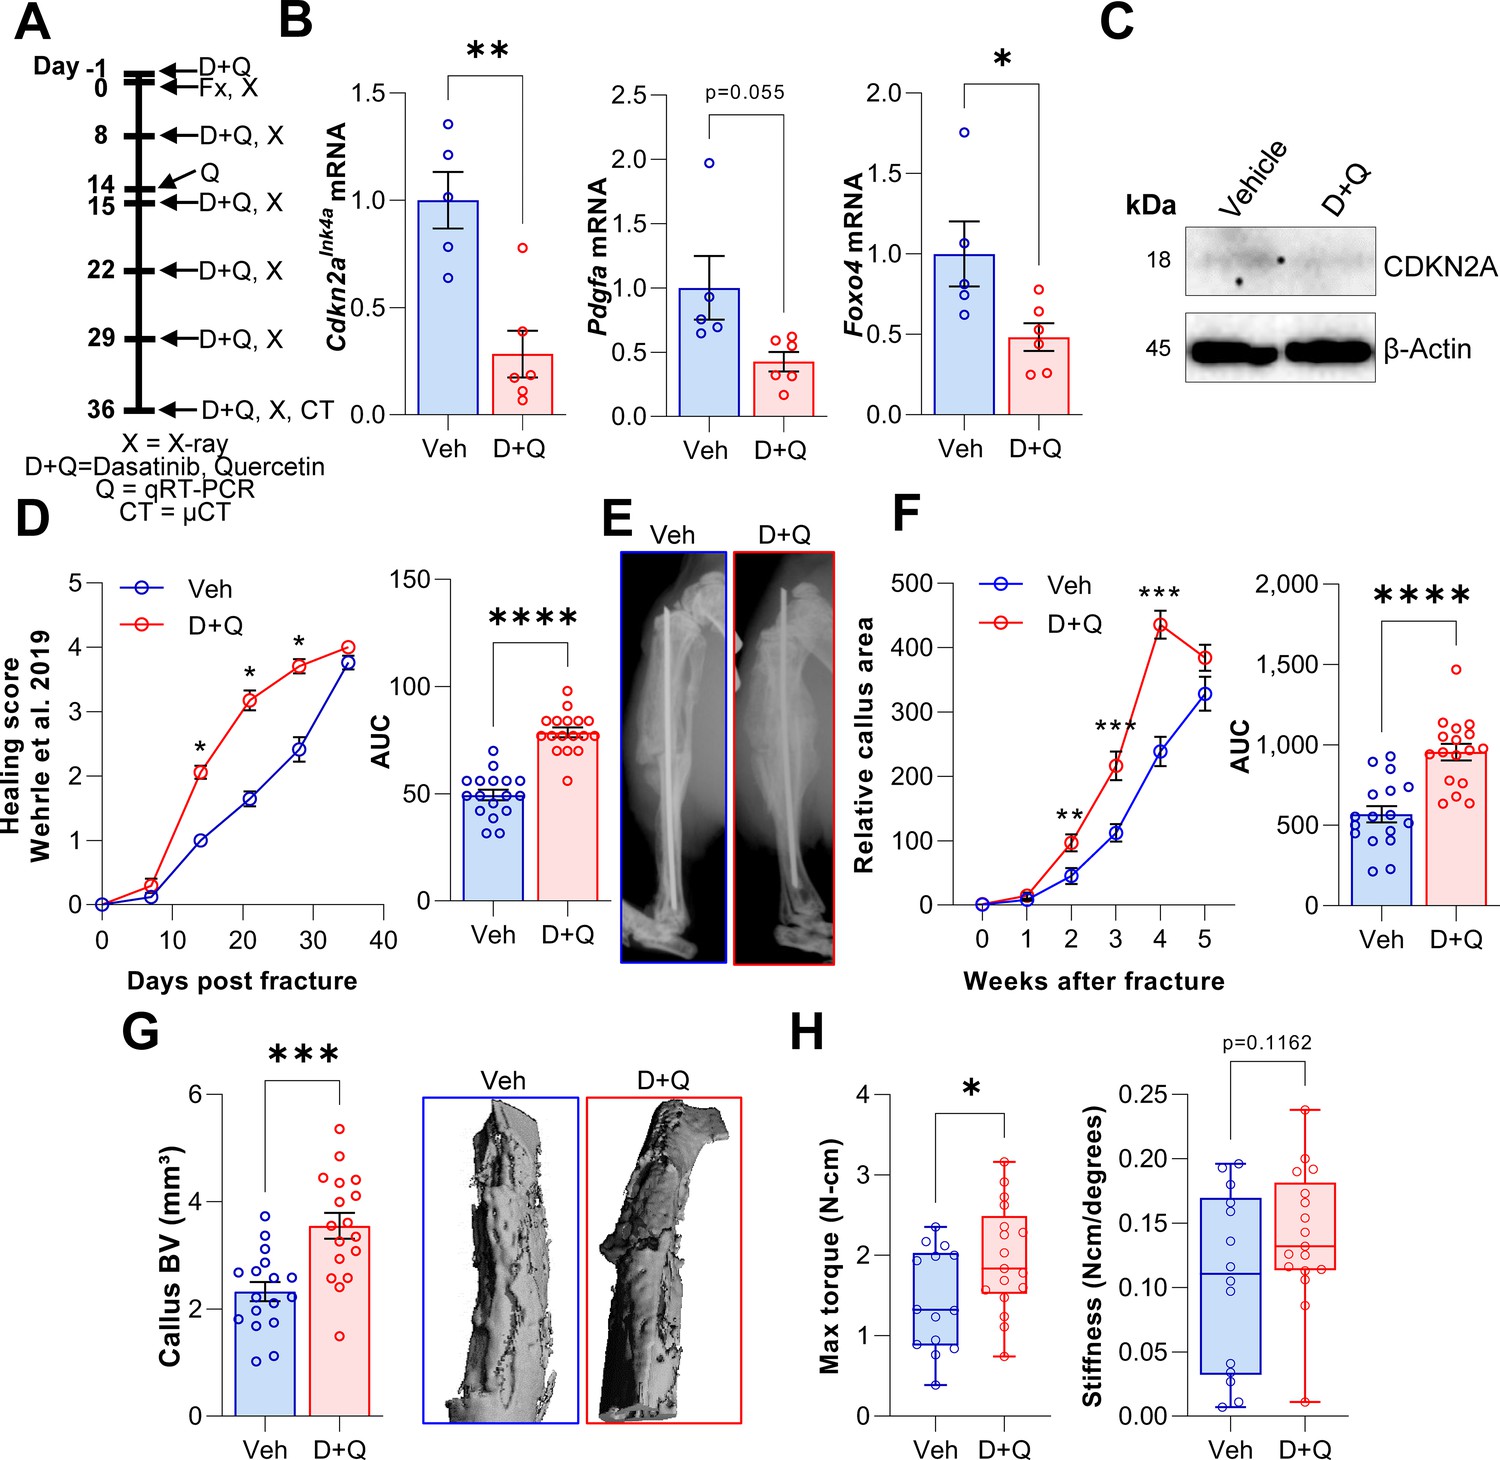
D + Q treatment accelerates the time course of fracture healing.
(A) Senescent cells were cleared by oral gavage of wild type mice one day before tibial fracture and weekly with 5 mg/kg BW Dasatinib plus 50 mg/kg BW Quercetin or vehicle solution(B) mRNA levels of the senescence and SASP markers Cdkn2aInk4a, Pdgfa and Foxo4 were reduced by D + Q treatment 14 days after fracture induction as detected using rt-qPCR. (C) Western blot analysis of callus material revealed reduction of Cdkn2aINK4A protein level in response to D + Q. (D) Bone healing was assessed using X-ray analysis according to Wehrle et al., 2019. Bone healing was significantly improved with D + Q. (E) Representative X-ray images of vehicle- and D + Q-treated mice 14 days after tibial fracture. Callus volume appeared to be increased with D + Q. (F) Relative callus area was detected after X-ray analysis and quantification using FIJI, showing an acceleration in the time course of callus formation. (G) Callus bone volume at 5 weeks determined using μCT was increased in D + Q-treated mice. (H) Biomechanical analysis of the tibiae revealed a significant increase in maximum torque upon senolytic treatment and a non-significant increase in bone stiffness. Mean ± SEM. B, C: n = 11 (5 Veh [3 males, 2 females], 6 DQ [3 males, 3 females]), D-G: n = 34, all females (17 Veh, 17 DQ), H: n = 31, all females (14 Veh, 17 DQ; note that three bones from the Veh group could not be analyzed due to technical issues in preparing these bones for torsional testing). For B: Univariate linear model with the covariate ‘sex’, D-H: One-way ANOVA or Student’s t-test for pairwise comparisons; *p < 0.05, **p < 0.01, ***p < 0.001, ****p < 0.0001.
-
Figure 6—source data 1
Raw ct values for Figure 6, panel B.
- https://cdn.elifesciences.org/articles/69958/elife-69958-fig6-data1-v2.xlsx
-
Figure 6—source data 2
Raw uncropped and annotated blot images for Figure 6, panel C.
- https://cdn.elifesciences.org/articles/69958/elife-69958-fig6-data2-v2.zip
Figure 6—figure supplement 1
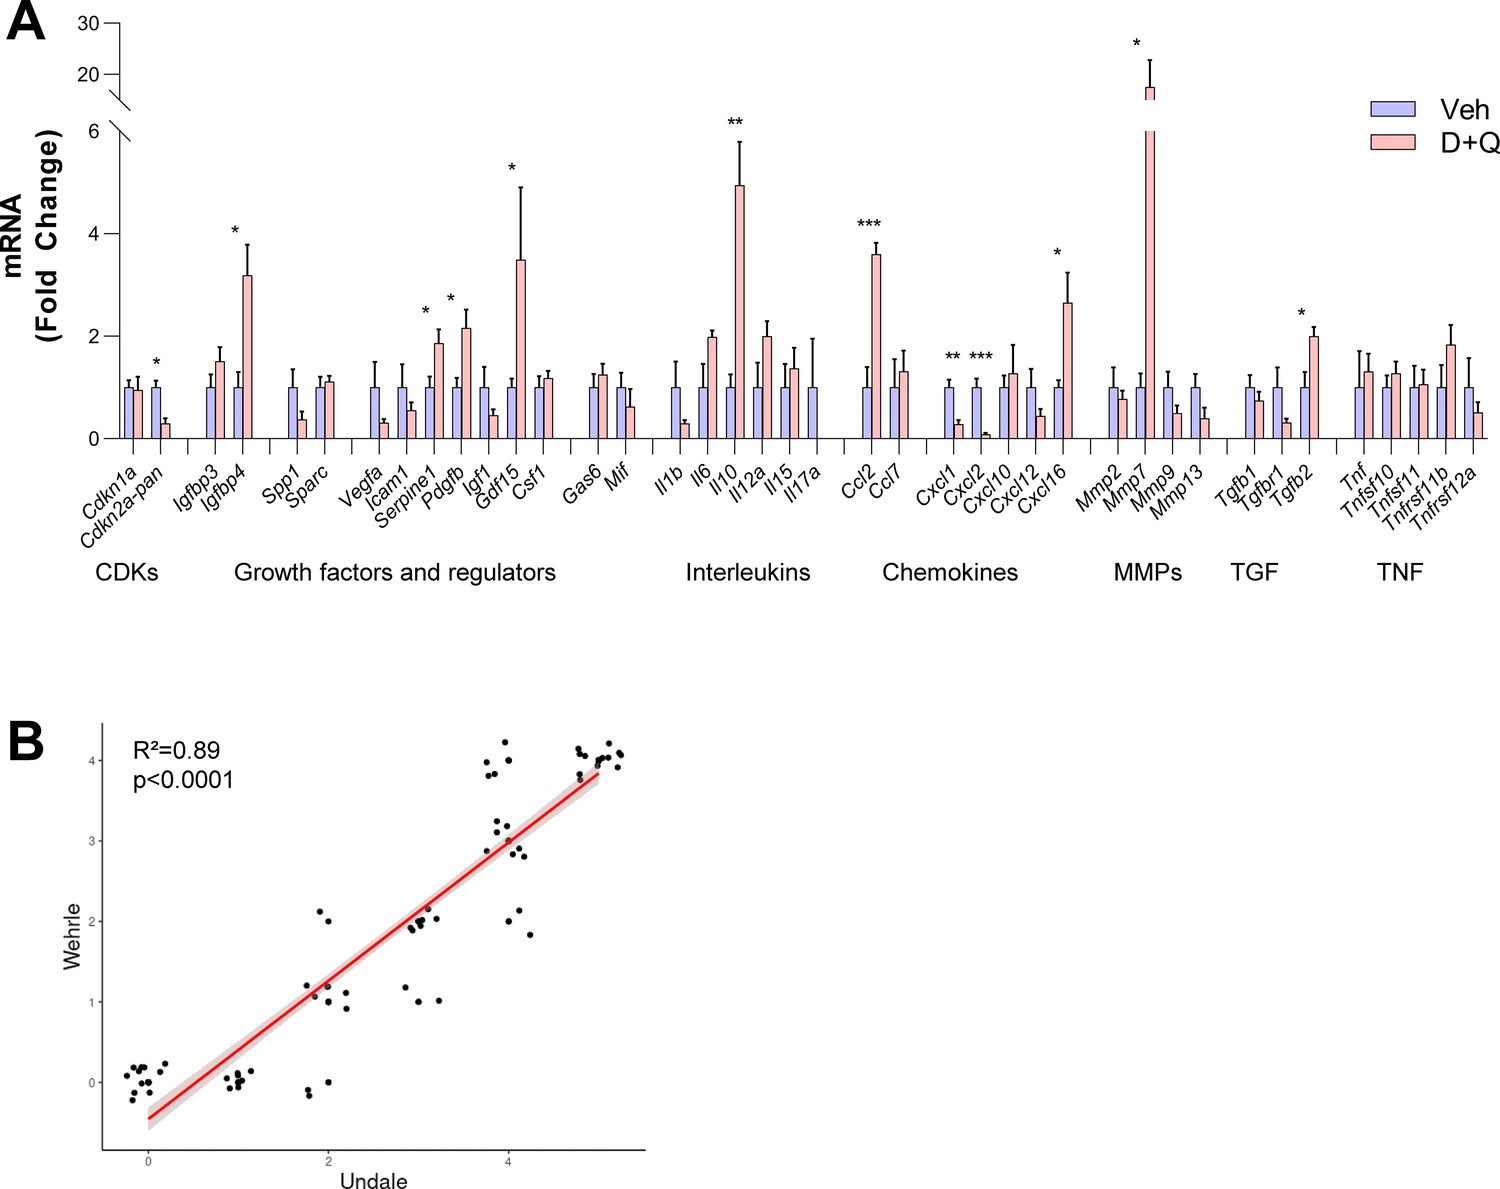
Changes of SASP factors in the fracture callus.
(A) Changes after D + Q treatment on day 14 compared to vehicle treatment. Among the two Cyclin-dependent kinases (CDKs), Cdkn2aPan, like Cdkn2aInk4a (Figure 6B) was significantly downregulated after D + Q treatment. Among growth factors, Igfbp4, Serpine1, Pdgfb, and Gdf15 were significantly upregulated, indicating higher proliferative potential. In the interleukin panel, Il10 displayed a significantly higher expression after D + Q treatment. The chemokines Ccl2 and Cxcl16 showed a substantial increase, while Cxcl1 and Cxcl2 were significantly downregulated. Mmp9 were substantially (17-fold) increased after treatment with D + Q, while Tgfb2 was the only TGF-associated gene with a significant upregulation. (B) Correlation of Undale and Wehrle scores of X-ray analyses. The two fracture healing courses show reliable agreement (R² = 0.89, p˂0.0001). Mean ± SEM. A: n = 11 (5 Veh [3 males, 2 females], 6 DQ [3 males, 3 females]), B: n = 120 (n = 60 in Wehrle [n = 10 per timepoint, 5 male and five female], n = 60 in Undale [n = 10 per timepoint, 5 male and five female]). Mann-Whitney U test or Student’s t-test for pairwise comparisons; p > 0.05, *p < 0.05, **p < 0.01, ***p < 0.001, ****p < 0.0001.
-
Figure 6—figure supplement 1—source data 1
Raw ct values for Figure 6—figure supplement 1, panel A.
Raw scores for Figure 6—figure supplement 1, panel B.
- https://cdn.elifesciences.org/articles/69958/elife-69958-fig6-figsupp1-data1-v2.xlsx
Tables
Key resources table
| Reagent type (species) or resource | Designation | Source or reference | Identifiers | Additional information |
|---|---|---|---|---|
| Strain, strain background (Mus musculus) | C57BL/6 | Charles River Laboratories | RRID:IMSR_CRL:027 | |
| Strain, strain background (Mus musculus) | Alb.B6.Cdkn2a-Luciferase | Sharpless Lab, North Carolina, USA | RRID:IMSR_NCIMR:01XBT | |
| Cell line (Mus musculus) | MSC (normal, adult) | This paper | - | freshly isolated from C57BL/6 mice |
| Antibody | γ-H2A.X, anti-rabbit antibody | Cell Signaling | RRID:AB_2118009 | “(1:200)” |
| Antibody | goat, anti-rabbit antibody | Vector Laboratories | RRID:AB_2313606 | “(1:200)” |
| Antibody | Cy5 Streptavidin, anti-rabbit antibody | Vector Laboratories | RRID:AB_2868518 | “(1:500)” |
| Other | TelC-Cy3 | PNA Bio | RRID:AB_2893285 | (PNA) probe |
| Other | CENPB-Cy3 | PNA Bio | RRID:AB_2893286 | (PNA) probe |
| Antibody (WB) | Cdkn2aINK4A | Abcam | RRID:AB_2891084 | (“1:1,000”) |
| Antibody (WB) | Beta-Actin | Cell Signaling | RRID:AB_2223172 | (“1:1,000”) |
| Chemical compound, drug | Xenolight RediJect Coelentarazine h | Calipers | #760,506 | |
| Software, algorithm | GraphPad Prism software | San Diego, CA | RRID:SCR_002798 | |
| Software, algorithm | R 4.0.3 | San Diego, CA | RRID:SCR_001905 | |
| Other | DAPI stain | Life Technologies | RRID:AB_2629482 |
Additional files
-
Supplementary file 1
Mouse primer sequences.
- https://cdn.elifesciences.org/articles/69958/elife-69958-supp1-v2.docx
-
Transparent reporting form
- https://cdn.elifesciences.org/articles/69958/elife-69958-transrepform1-v2.pdf
Download links
A two-part list of links to download the article, or parts of the article, in various formats.
Downloads (link to download the article as PDF)
Open citations (links to open the citations from this article in various online reference manager services)
Cite this article (links to download the citations from this article in formats compatible with various reference manager tools)
Modulation of fracture healing by the transient accumulation of senescent cells
eLife 10:e69958.
https://doi.org/10.7554/eLife.69958


