A 3D adult zebrafish brain atlas (AZBA) for the digital age
- Department of Biological Sciences, Wayne State University, United States
- Program in Neurosciences and Mental Health, The Hospital for Sick Children, Canada
- Division of Biology, Kansas State University, United States
- Department of Physiology, University of Toronto, Canada
- Institute of Medical Sciences, University of Toronto, Canada
- Department of Psychology, University of Toronto, Canada
Figures
Figure 1
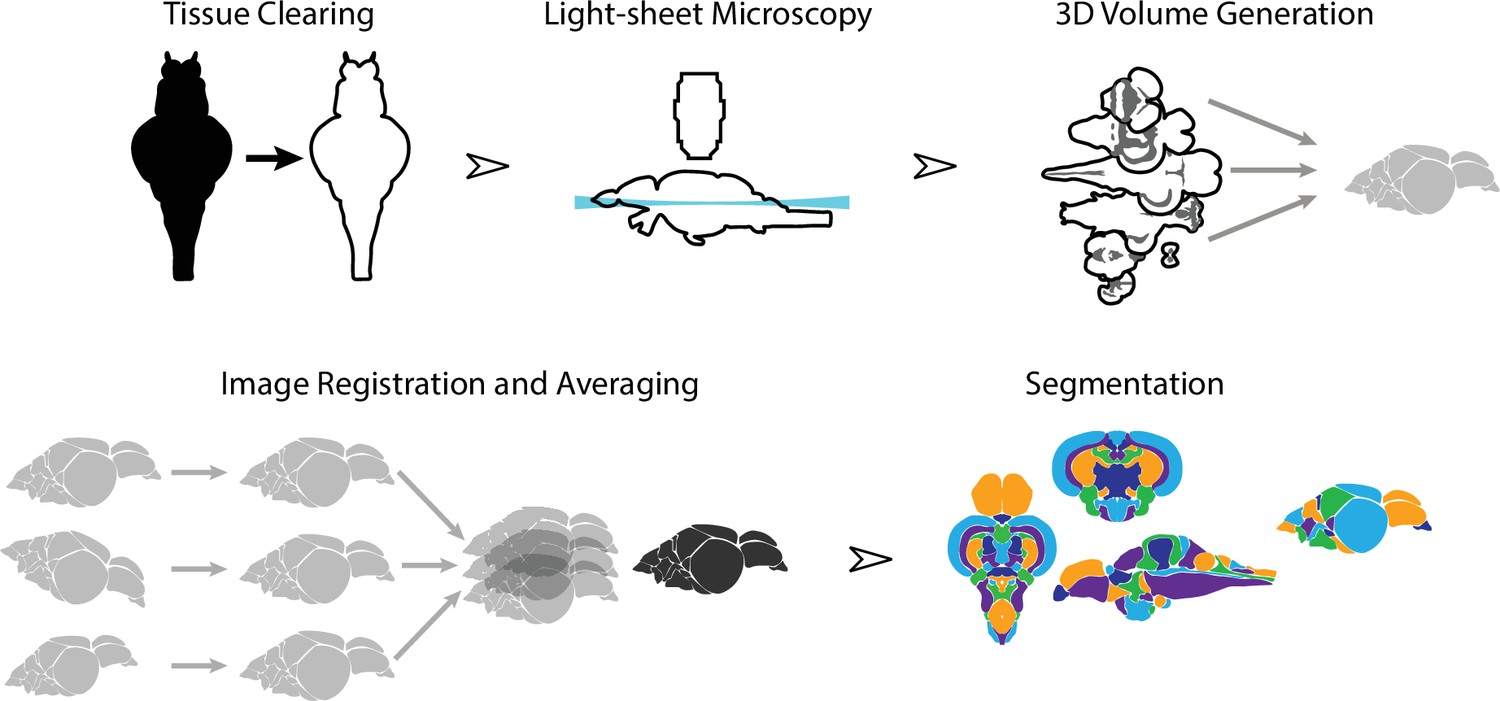
Overview of the strategy for generating the adult zebrafish brain atlas (AZBA).
Dissected brain samples were first subject to staining and tissue clearing. This was followed by whole-mount imaging using light-sheet fluorescence microscopy. Three-dimensional volumes were created from individual image sets, and then registered into the same anatomical space prior to averaging to generate a representative image. Finally, volumes were segmented into over 200 neuroanatomical regions.
Figure 2
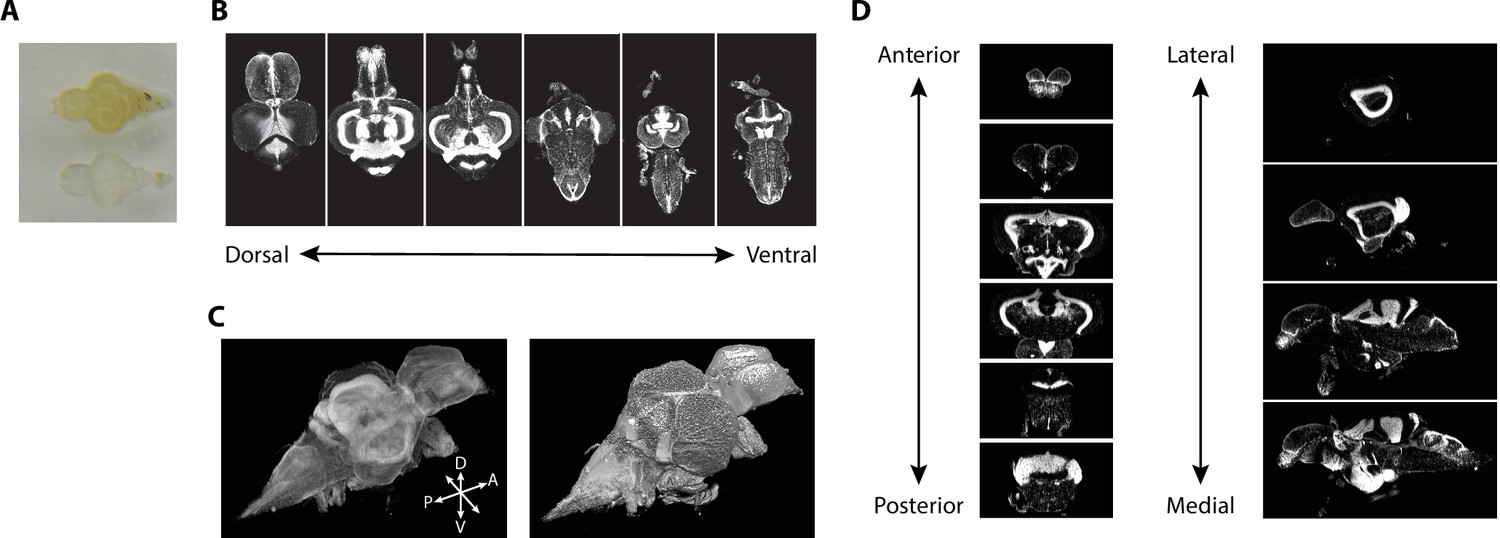
Imaging of nuclear-stained tissue-cleared samples.
(A) Image of adult zebrafish brain samples before (top) and after (bottom) clearing using iDISCO+. (B) Example TO-PRO-stained images from a single sample acquired in the horizontal plane during light-sheet imaging. (C) Three-dimensional volumes generated from a set of light-sheet images from an individual brain visualized using a maximum intensity projection (left) and exterior volume (right). (D) Coronal (left) and sagittal (right) views of an individual brain generated from a single three-dimensional volume.
Figure 3

Image registration pipeline.
(A) Raw TO-PRO images from 17 fish were first aligned using linear transformations (LSQ6 and LSQ12) followed by a final nonlinear transformation (right). Deformation grids at each stage are overlaid. Consensus average images at each stage of the pipeline are given below. (B) Raw autofluorescence images (top) acquired at the same time as the TO-PRO images were registered into the same space using the transformations derived from TO-PRO registration (middle). Images were then averaged together to generate a corresponding autofluorescence average in the same anatomical space as the TO-PRO images (bottom).
Figure 4 with 1 supplement
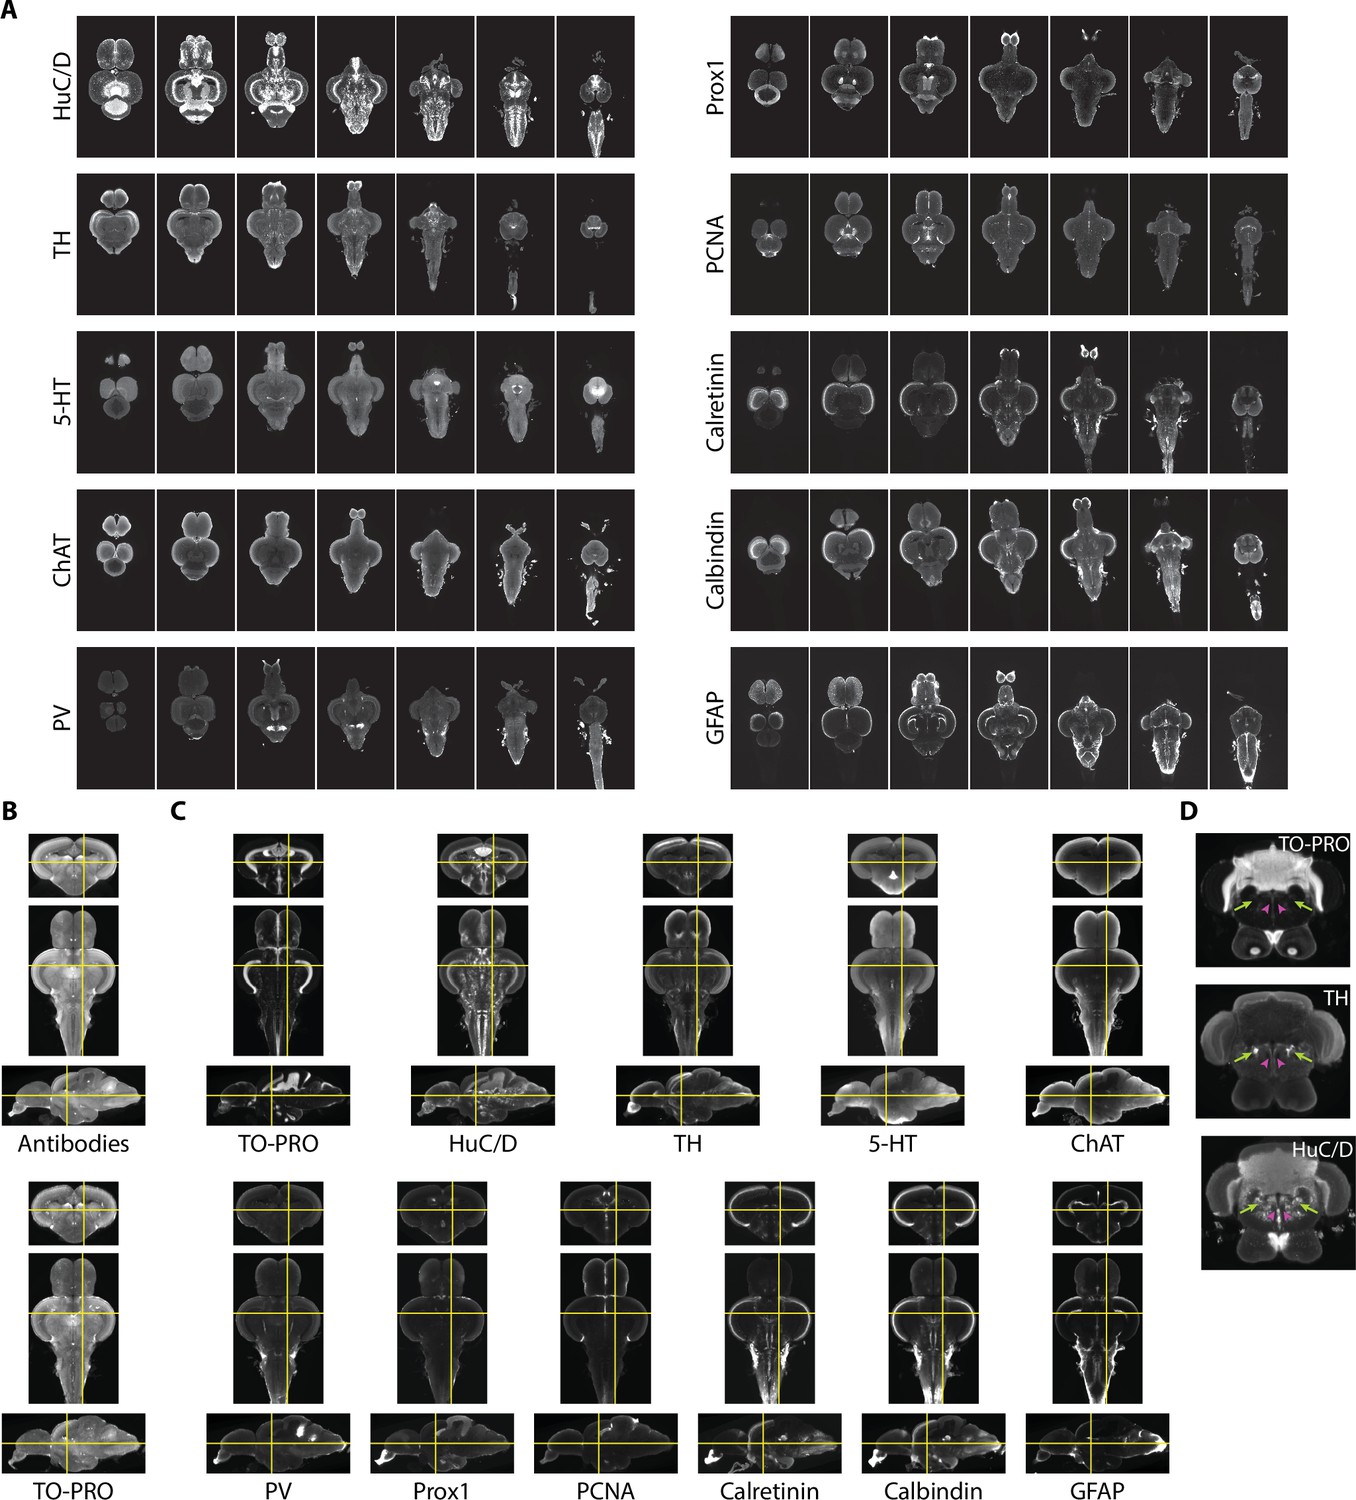
Imaging and registration of antibody stains.
(A) Representative light-sheet images taken in the horizontal plane from individual brains stained with indicated antibodies. (B) Autofluorescence images acquired during antibody staining (top) were registered into the same space as autofluorescence images acquired during TO-PRO staining (bottom). (C) Transformations from autofluorescence registration were applied to antibody images to bring antibody stains into the same anatomical space as the TO-PRO stain. Yellow crosshairs are in the same place on each image. (D) Example of correspondence between TO-PRO and antibody images and how stains can be used to identify the boundaries of specific nuclei (green arrow: locus coeruleus) and white matter tracts by a lack of staining (pink arrowhead: medial longitudinal fascicle).
Figure 4—figure supplement 1
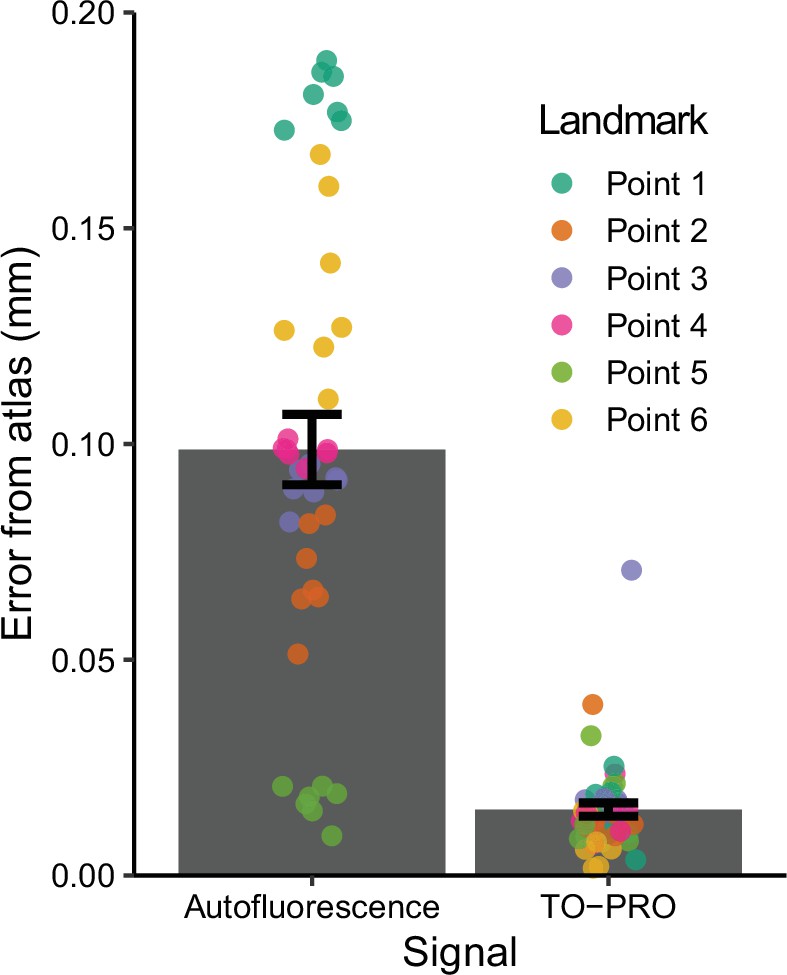
Registration precision between six different landmarks in the autofluorescence and TO-PRO images and their respective atlas images.
Data are mean ± SEM.
Figure 5 with 3 supplements

Segmentation of the adult zebrafish brain atlas (AZBA).
(A) Averaged and registered TO-PRO images alongside the atlas segmentation. For sagittal (top), horizontal (middle), and coronal (bottom) planes, numbers are distance (in mm) from the midline, top, and anterior-most portion of the brain, respectively. (B, C) Averaged and registered TH and 5-HT-stained images where hotter colors indicate a stronger signal. Numbers same as in (A). Slices in each plane were chosen to show regions containing high levels of staining (see Results for description). (D) Three-dimensional representation of the segmentation with a sagittal and horizontal cutaway overlaid with the TO-PRO stain of the atlas.
Figure 5—figure supplement 1
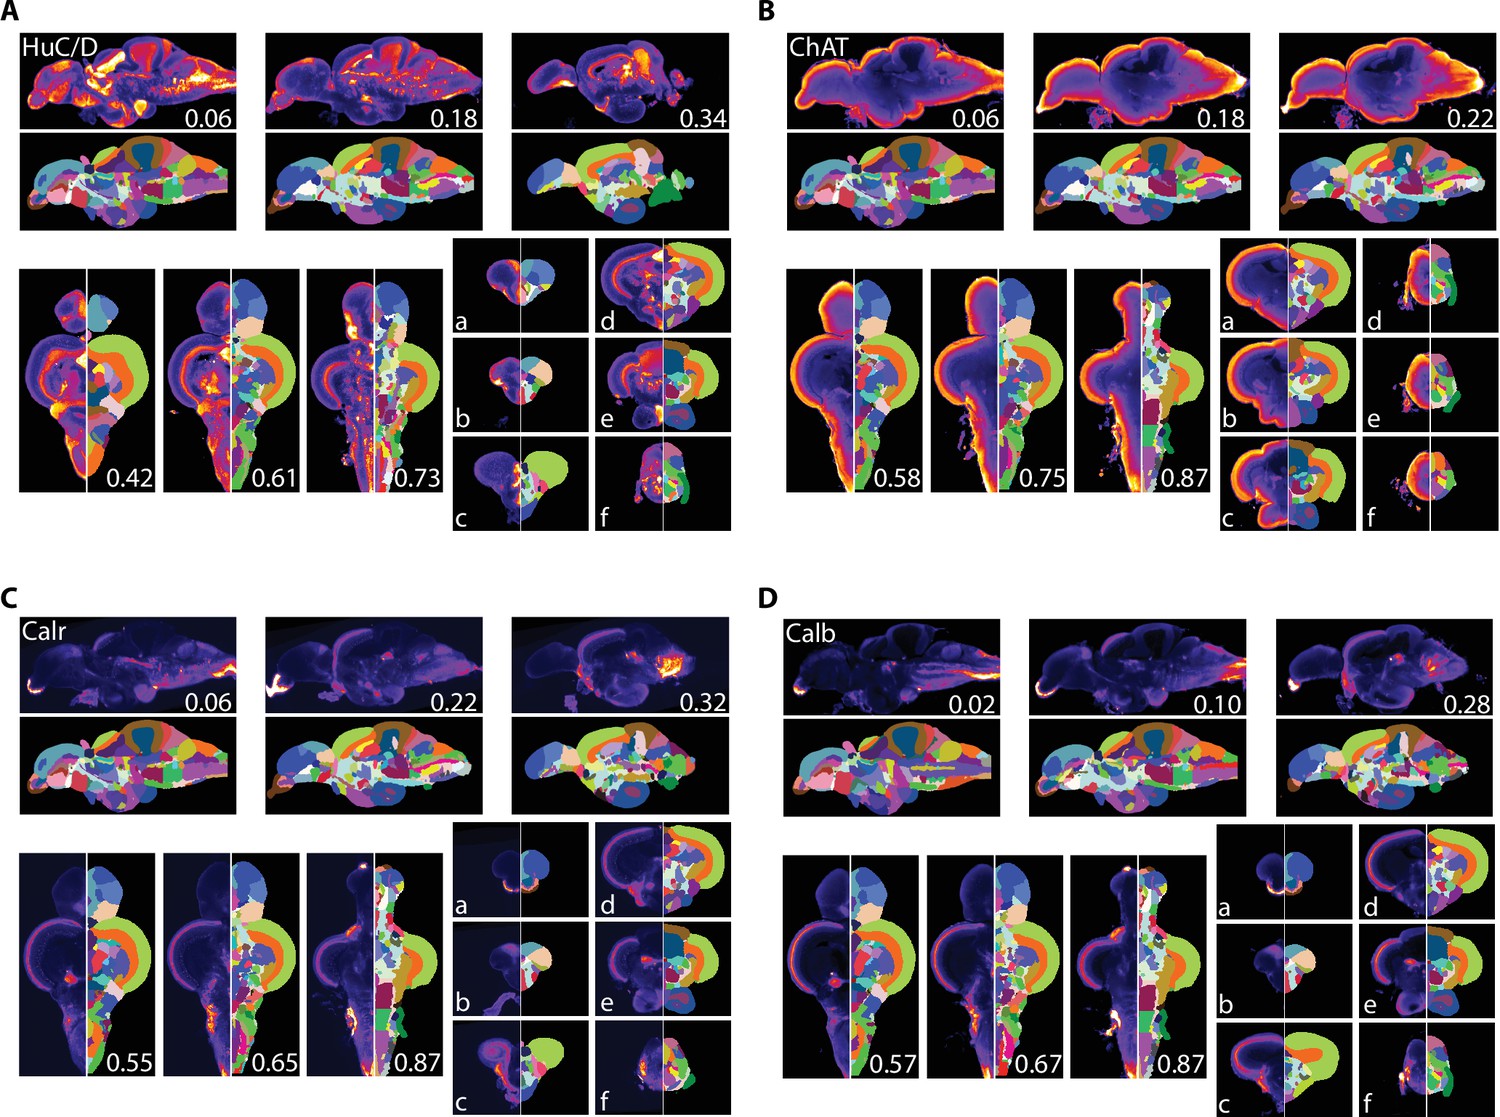
Averaged and registered antibody stains with corresponding segmentation for antibody stains.
(A) HuC/D, (B) ChAT, (C) calretinin (Calr), and (D) calbindin (Calb) where hotter colors indicate greater staining. For sagittal (top) and horizontal (left, bottom), numbers represent distance (in mm) from midline or top of the brain, respectively. Slices for each plane were chosen based on the presence of staining (see Results for description).
Figure 5—figure supplement 2
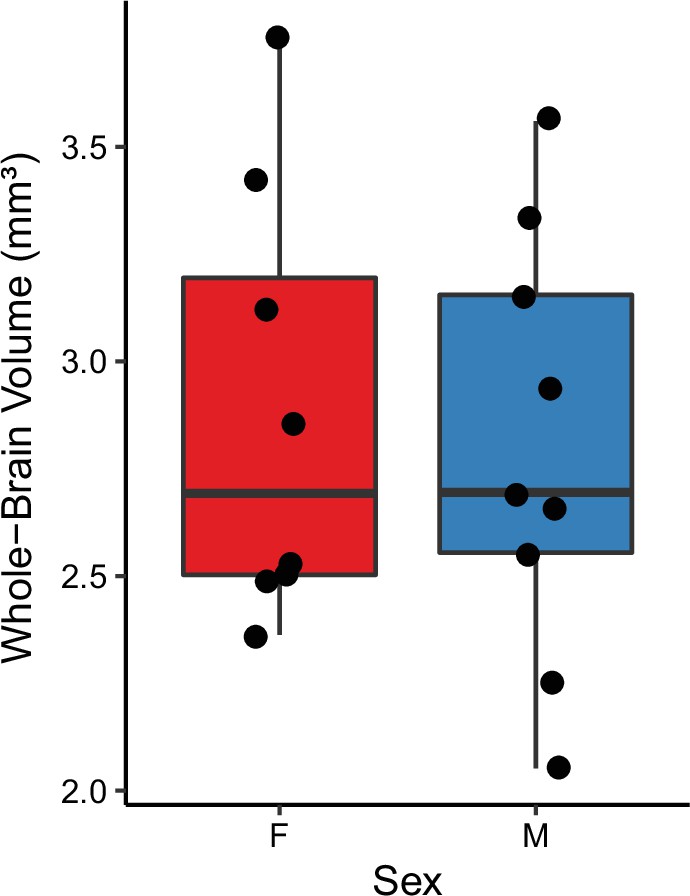
Whole-brain volumes of female and male fish used in the TO-PRO registration.
Boxes represent interquartile range, and whiskers are minimum/maximum.
Figure 5—figure supplement 3
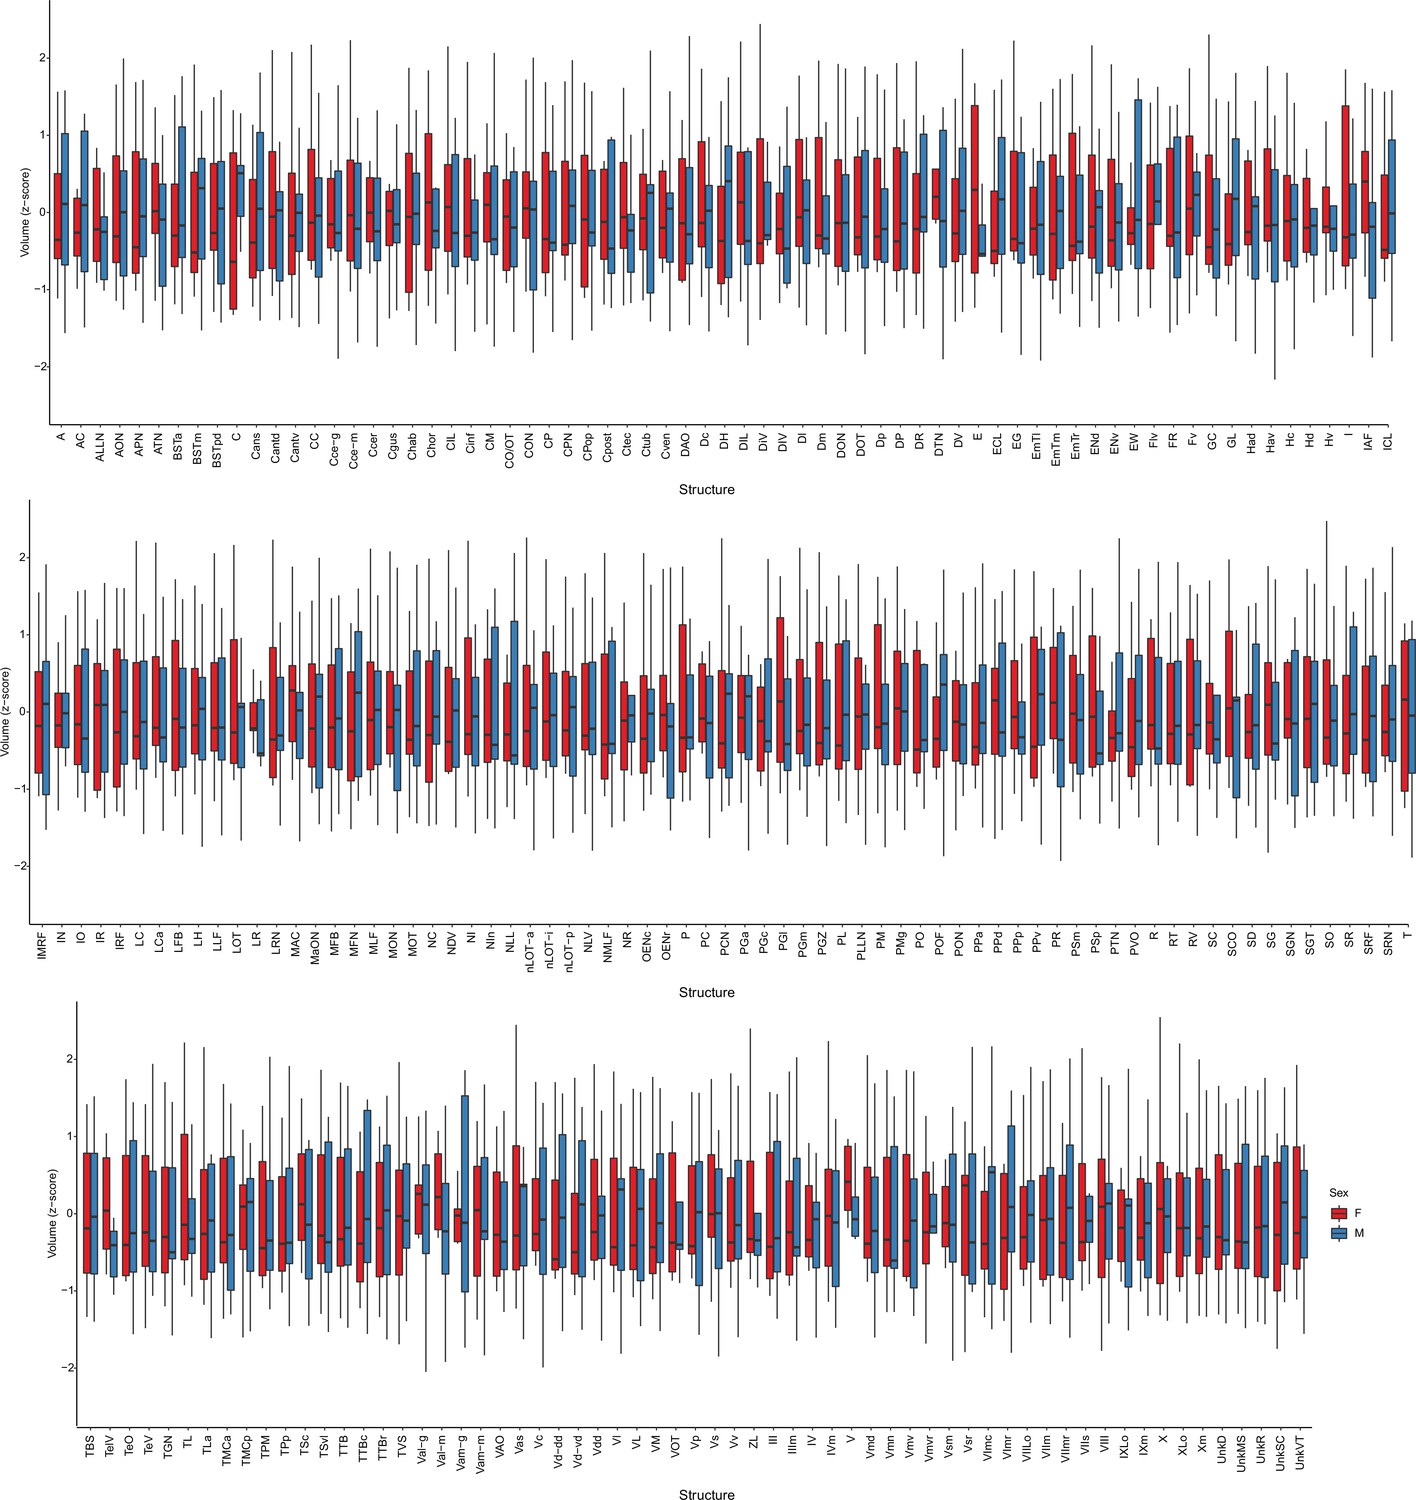
Brain structure volumes of female and male fish used in the TO-PRO registration.
Boxes represent interquartile range, and whiskers are minimum/maximum.
Figure 6
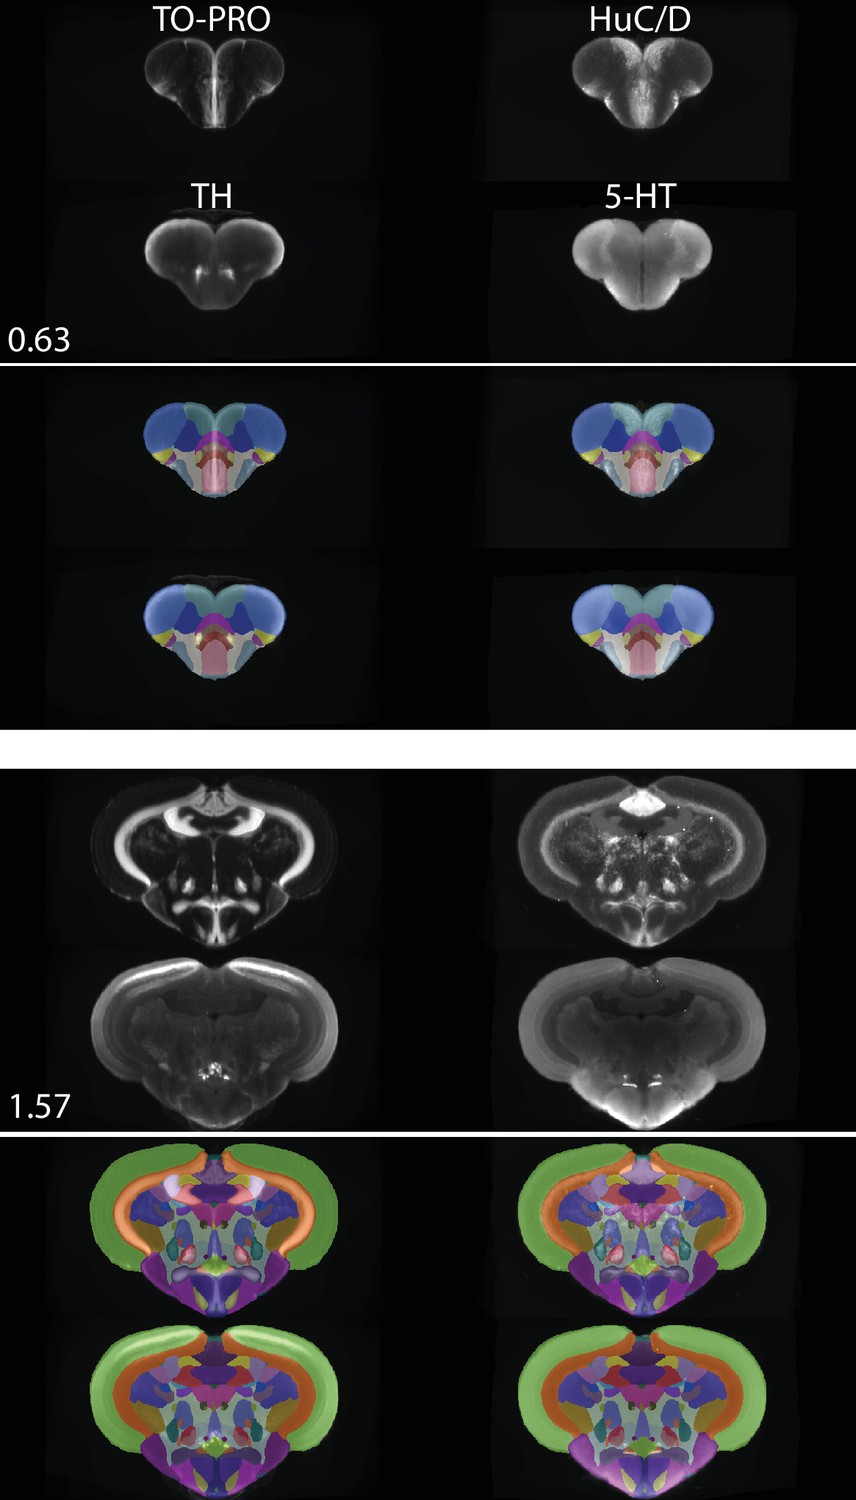
Registered and averaged TO-PRO, HuC/D, TH, and 5-HT images in the coronal plane alongside atlas segmentation at 50% opacity and visualized using ITK-SNAP.
Numbers are distance (in mm) from the anterior-most portion of the brain.
Figure 7
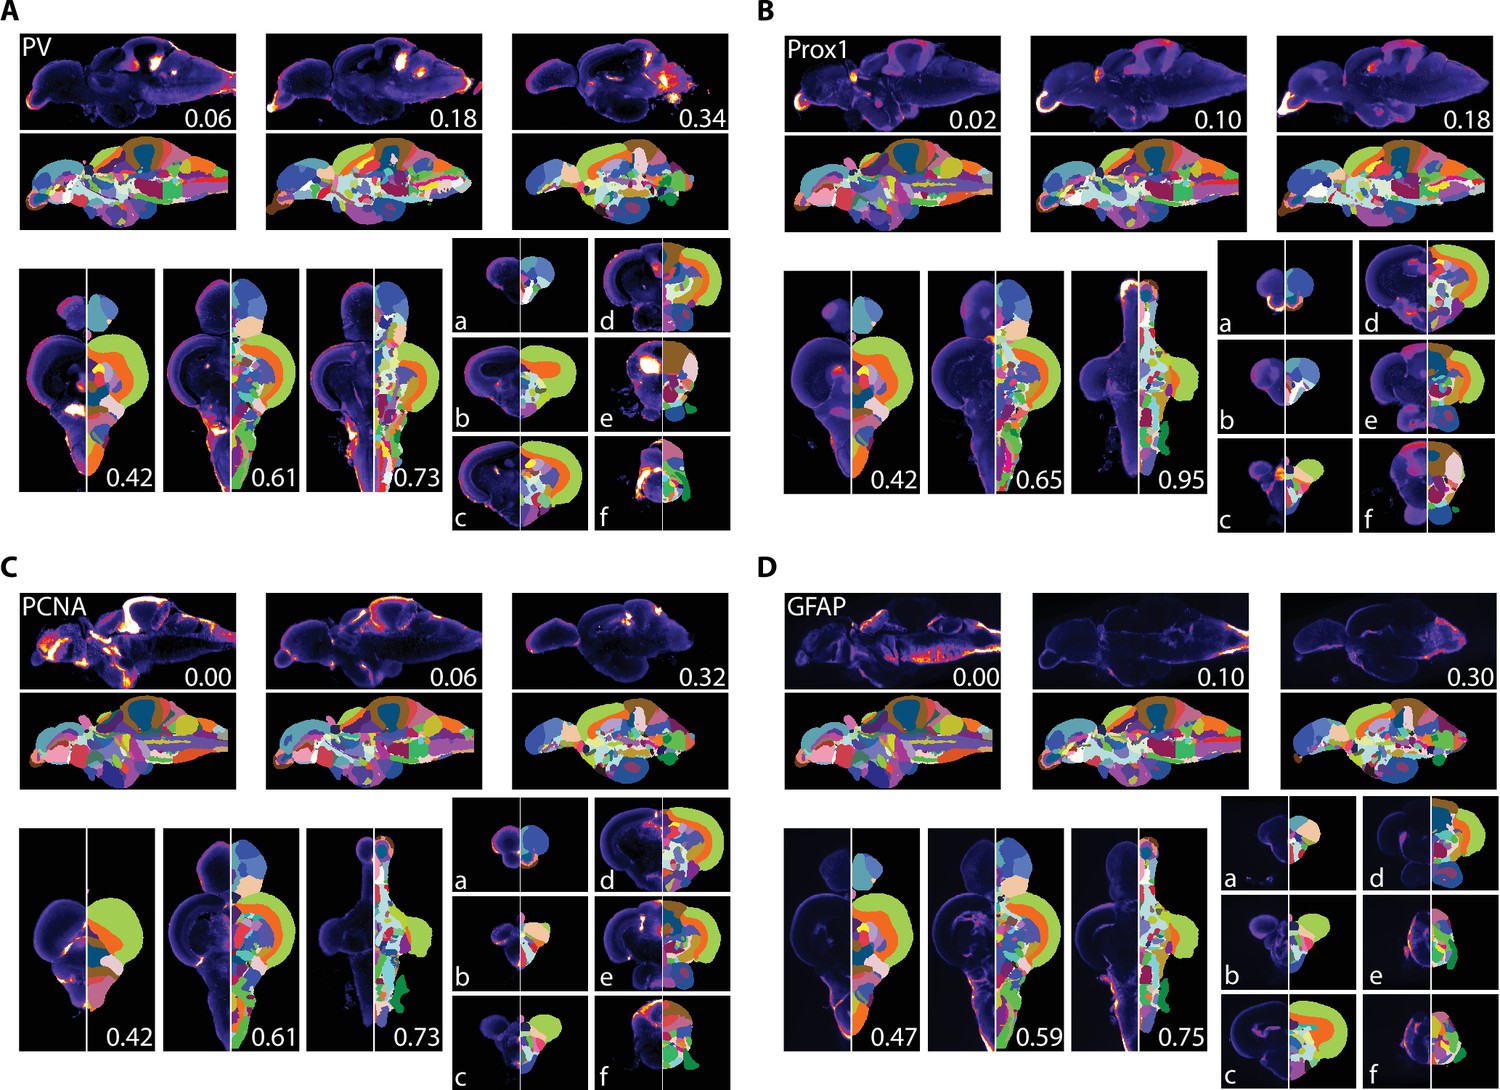
Averaged and registered antibody stains with corresponding segmentation for (A) PV, (B) Prox1, (C) PCNA, and (D) GFAP where hotter colors indicate greater staining.
For sagittal (top) and horizontal (left, bottom), numbers represent distance (in mm) from midline or top of the brain, respectively. Slices for each plane were chosen based on the presence of staining (see Results for description).
Tables
Key resources table
| Reagent type (species) or resource | Designation | Source or reference | Identifiers | Additional information |
|---|---|---|---|---|
| Strain, strain background(Danio rerio) | Zebrafish (AB strain) | The Hospital for Sick Children | ||
| Other | TO-PRO3 stain | Invitrogen | Cat#: T3605 | iDISCO (1:10,000) |
| Antibody | Anti-TH(chicken polyclonal) | Aves | Cat#: TYH;RRID:AB_10013440 | iDISCO (1:200) |
| Antibody | Anti-GFAP(mouse monoclonal) | ZIRC (Zebrafish International Resource Center) | Cat#: Zrf-1 | iDISCO (1:200) |
| Antibody | Anti-ChAT(goat polyclonal) | Millipore | Cat#: AB144;RRID:AB_11212843 | iDISCO (1:400) |
| Antibody | Anti-5-HT(rabbit polyclonal) | Sigma | Cat#: S5545;RRID:AB_477522 | iDISCO (1:100) |
| Antibody | Anti-calbindin(rabbit polyclonal) | SWANT | Cat#: CB38;RRID:AB_10000340 | iDISCO (1:200) |
| Antibody | Anti-calretinin(mouse monoclonal) | SWANT | Cat#: 6B3;RRID:AB_10000320 | iDISCO (1:400) |
| Antibody | Anti-PCNA(mouse monoclonal) | Dako | Cat#: M0879;RRID:AB_2160651 | iDISCO (1:1000) |
| Antibody | Anti-HuC/D(mouse monoclonal) | Invitrogen | Cat#: A21271;RRID:AB_221448 | iDISCO (3.75 μg/mL) |
| Antibody | Anti-Prox1(rabbit polyclonal) | Millipore | Cat#: AB5475;RRID:AB_177485 | iDISCO (1:400) |
| Antibody | Anti-parvalbumin(rabbit polyclonal) | SWANT | Cat#: PV27;RRID:AB_2631173 | iDISCO (1: 400) |
| Antibody | Anti-mouse IgG-Alexa Flour 647(donkey polyclonal) | Invitrogen | A31571RRID:AB_162542 | iDISCO (1:200) |
| Antibody | Anti-rabbit IgG-Alexa Flour 647(donkey polyclonal) | Invitrogen | A31573RRID:AB_2536183 | iDISCO (1:200) |
| Antibody | Anti-goat IgG-Alexa Flour 647(donkey polyclonal) | Invitrogen | A21447RRID:AB_2535864 | iDISCO (1:200) |
| Antibody | Anti-chicken-Alexa Flour 633 (goat polyclonal) | Invitrogen | A21103RRID:AB_2535756 | iDISCO (1:200) |
| Other | AZBA | This paper | RRID:SCR_021732 | Brain atlas maintained by J.W. Kenney labAvailable at azba.wayne.edu |
Additional files
-
Supplementary file 1
Table of brain region abbreviations, full names, and colors.
- https://cdn.elifesciences.org/articles/69988/elife-69988-supp1-v2.docx
-
Supplementary file 2
Excel file of brain region label numbers, abbreviations, full names, colors, volume, hierarchy, and location.
- https://cdn.elifesciences.org/articles/69988/elife-69988-supp2-v2.xlsx
-
Supplementary file 3
Structure tree of brain region hierarchies.
- https://cdn.elifesciences.org/articles/69988/elife-69988-supp3-v2.txt
-
Supplementary file 4
Python script for converting image stacks to three-dimensional volumes.
- https://cdn.elifesciences.org/articles/69988/elife-69988-supp4-v2.py
-
Transparent reporting form
- https://cdn.elifesciences.org/articles/69988/elife-69988-transrepform1-v2.docx
Download links
A two-part list of links to download the article, or parts of the article, in various formats.
Downloads (link to download the article as PDF)
Open citations (links to open the citations from this article in various online reference manager services)
Cite this article (links to download the citations from this article in formats compatible with various reference manager tools)
A 3D adult zebrafish brain atlas (AZBA) for the digital age
eLife 10:e69988.
https://doi.org/10.7554/eLife.69988


