Directed evolution of the rRNA methylating enzyme Cfr reveals molecular basis of antibiotic resistance
- Department of Cellular and Molecular Pharmacology, University of California San Francisco, United States
- Department of Biomolecular Sciences, Weizmann Institute of Science, Israel
- Department of Bioengineering and Therapeutic Sciences, University of California San Francisco, United States
- Department of Biochemistry and Biophysics, University of California San Francisco, United States
- Helen Diller Family Comprehensive Cancer Center, University of California San Francisco, United States
- Department of Cell and Tissue Biology, University of California San Francisco, United States
- Quantitative Biosciences Institute, University of California San Francisco, United States
- Department of Pharmaceutical Chemistry, University of California San Francisco, United States
Figures
Figure 1 with 2 supplements
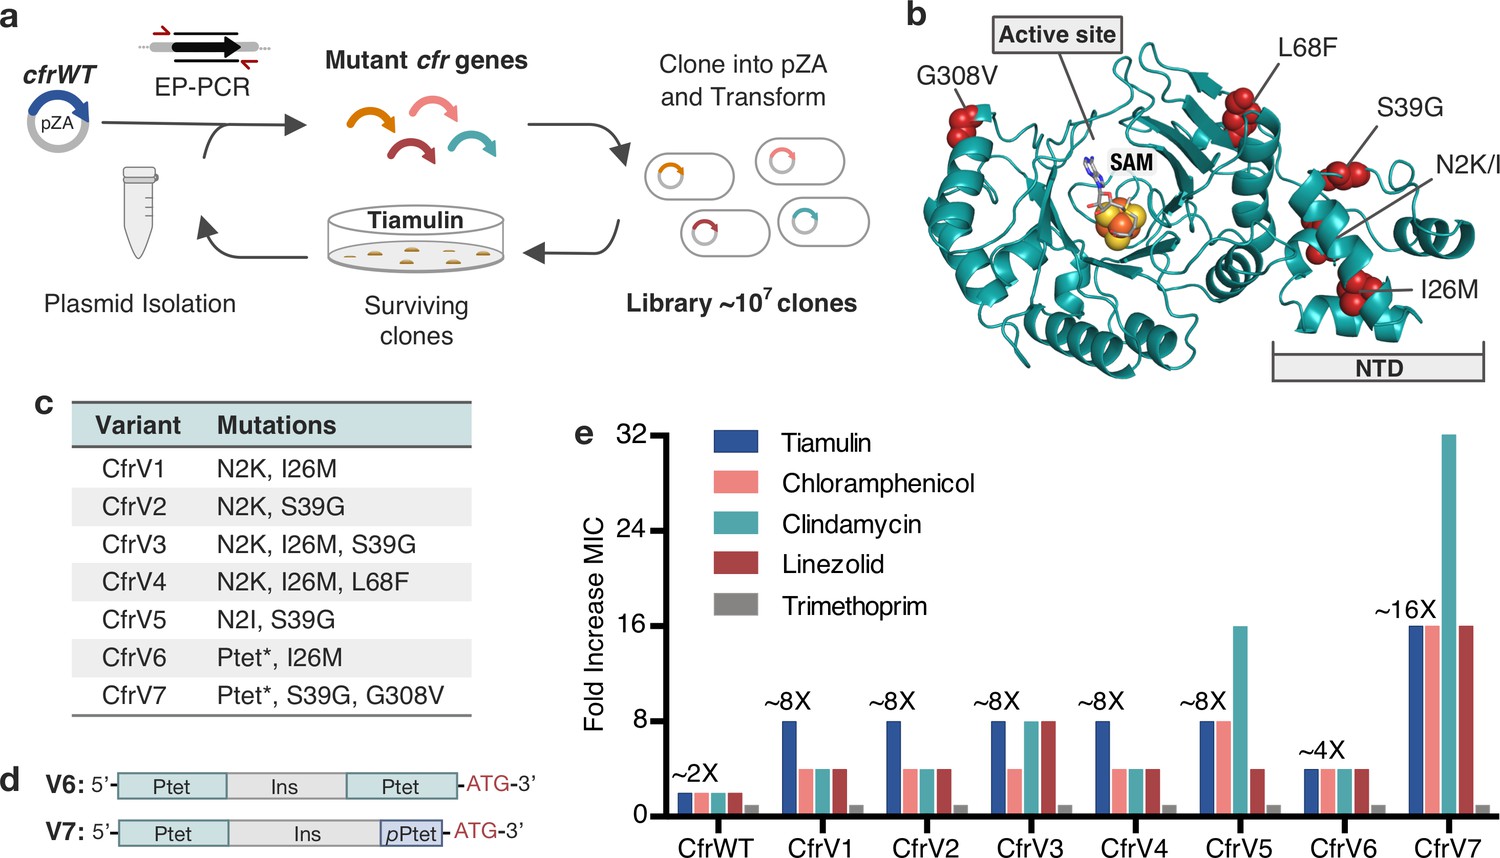
Evolved variants of Cfr exhibit improved resistance to PhLOPSA ribosome antibiotics.
(a) Evolution of Cfr under selection by the PTC-targeting antibiotic tiamulin. (b) Cfr homology model based on RlmN generated by I-TASSER server (Yang and Zhang, 2015) with mutagenic hotspots in red. N-terminal domain (NTD) is labeled. Active site denoted by S-adenosylmethionine (SAM, gray) and [4Fe-4S] cluster (orange). (c) Evolved variants containing Cfr mutations were selected for further study. Ptet* indicates alterations to promoter sequence. (d) Promoter architecture of CfrV6 and CfrV7 where pPtet designates a partial Ptet promoter sequence and Ins designates a variable insertion sequence. (e) Fold improvement in MIC resistance value for PhLOPSA antibiotics and trimethoprim compared to empty pZA vector control determined from three biological replicates by microbroth dilution method. Trimethoprim is a negative control antibiotic that does not target the ribosome. LZD testing was performed against Escherichia coli BW25113 lacking efflux pump, acrB. Numerical MIC values are displayed in Figure 1—source data 1.
-
Figure 1—source data 1
MIC numerical data.
- https://cdn.elifesciences.org/articles/70017/elife-70017-fig1-data1-v1.xlsx
-
Figure 1—source data 2
Blot images.
- https://cdn.elifesciences.org/articles/70017/elife-70017-fig1-data2-v1.zip
Figure 1—figure supplement 1
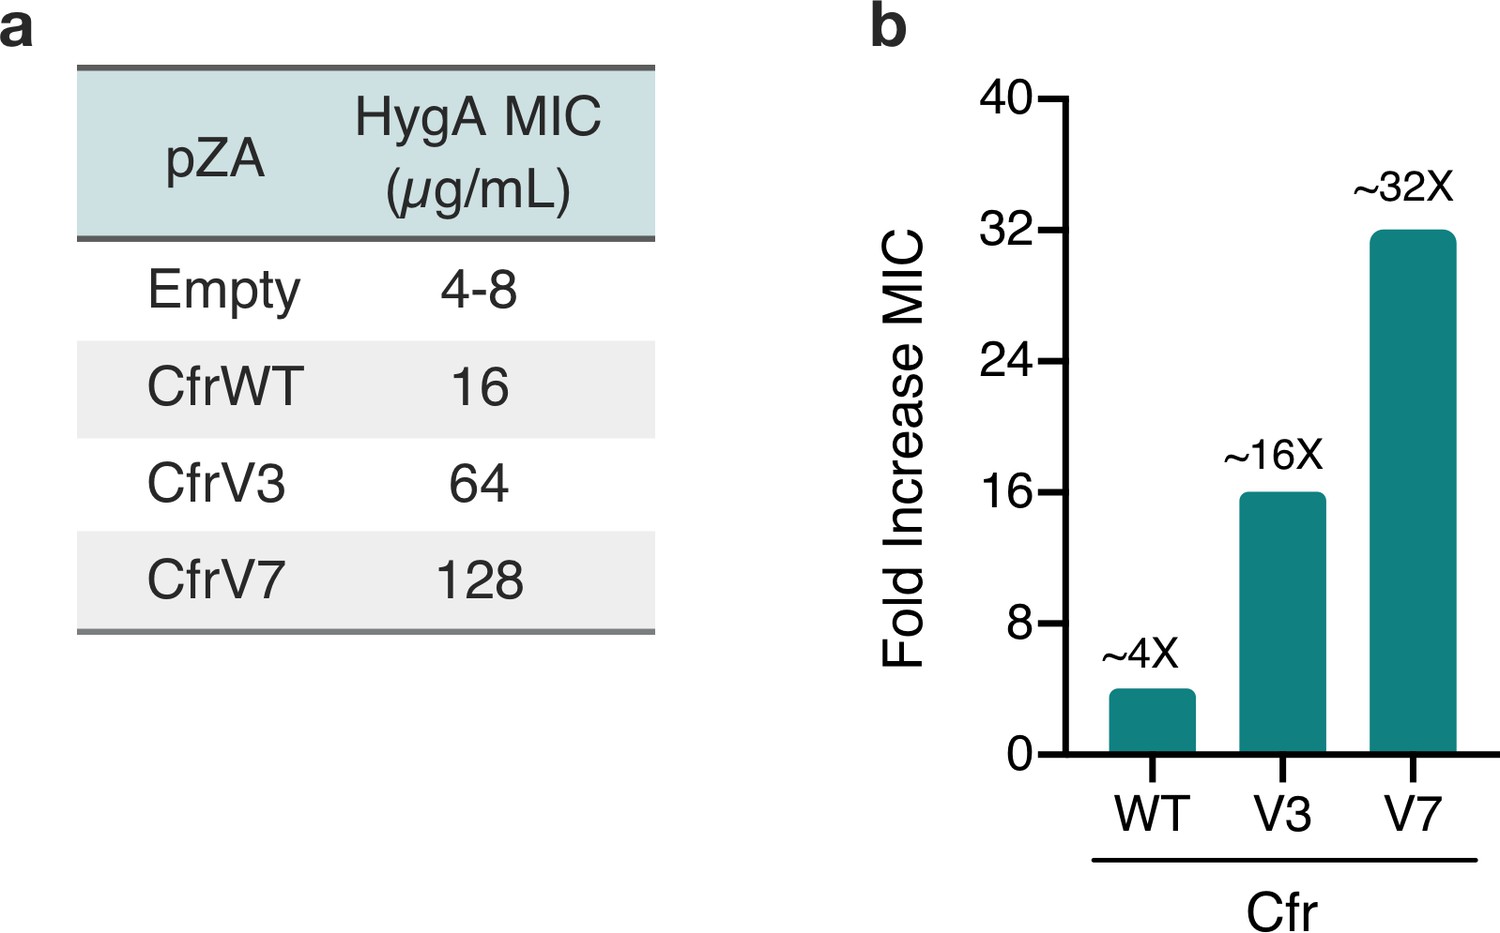
Cfr variants confer increased resistance to hygromycin A.
(a) Antibiotic susceptibility testing of hygromycin A (HygA) against Escherichia coli BW25113 lacking efflux pump acrB transformed with pZA plasmid encoding Cfr variants. Results were determined from three biological replicates by microbroth dilution method. (b) Approximate fold improvement in MIC resistance value for HygA compared to empty pZA vector control derived from source data presented in panel (a).
Figure 1—figure supplement 2
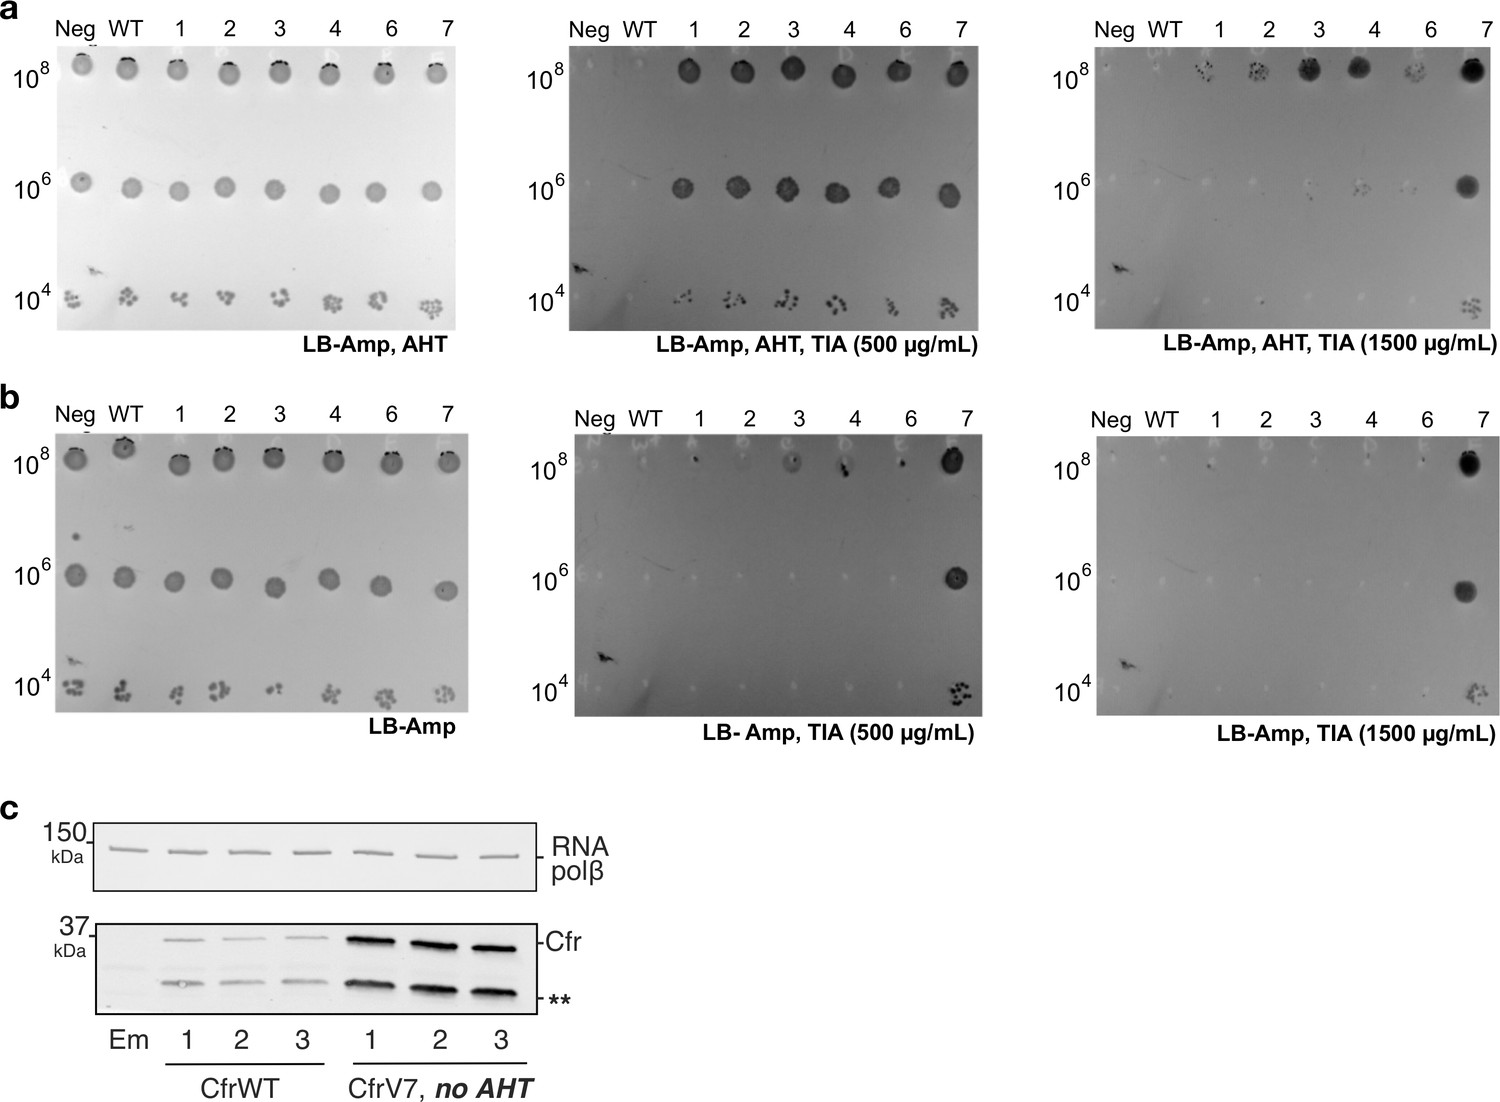
CfrV7 does not require an inducer for resistance or expression.
(a) Antibiotic susceptibility testing of Escherichia coli transformed with pZA plasmid encoding Cfr variants. Dose-dependent susceptibility testing toward tiamulin (TIA) with plates containing ampicillin (Amp, 100 µg/ml) and anhydrotetracycline (AHT, 20 ng/ml) to induce Cfr expression. (b) Dose-dependent susceptibility testing toward TIA with plates containing Amp but lacking AHT. Neg designates empty pZA plasmid. WT and 1–7 designate pZA encoding CfrWT-His6 or Cfr variants 1–7. For panels (a) and (b), results are representative of three biological replicates. (c) Protein expression of full-length CfrV7 without AHT inducer compared to CfrWT with AHT inducer detected by immunoblotting against a C-terminal FLAG tag. Em = empty vector control. Original uncropped blot images are shown in Figure 1—source data 2.
Figure 2 with 4 supplements
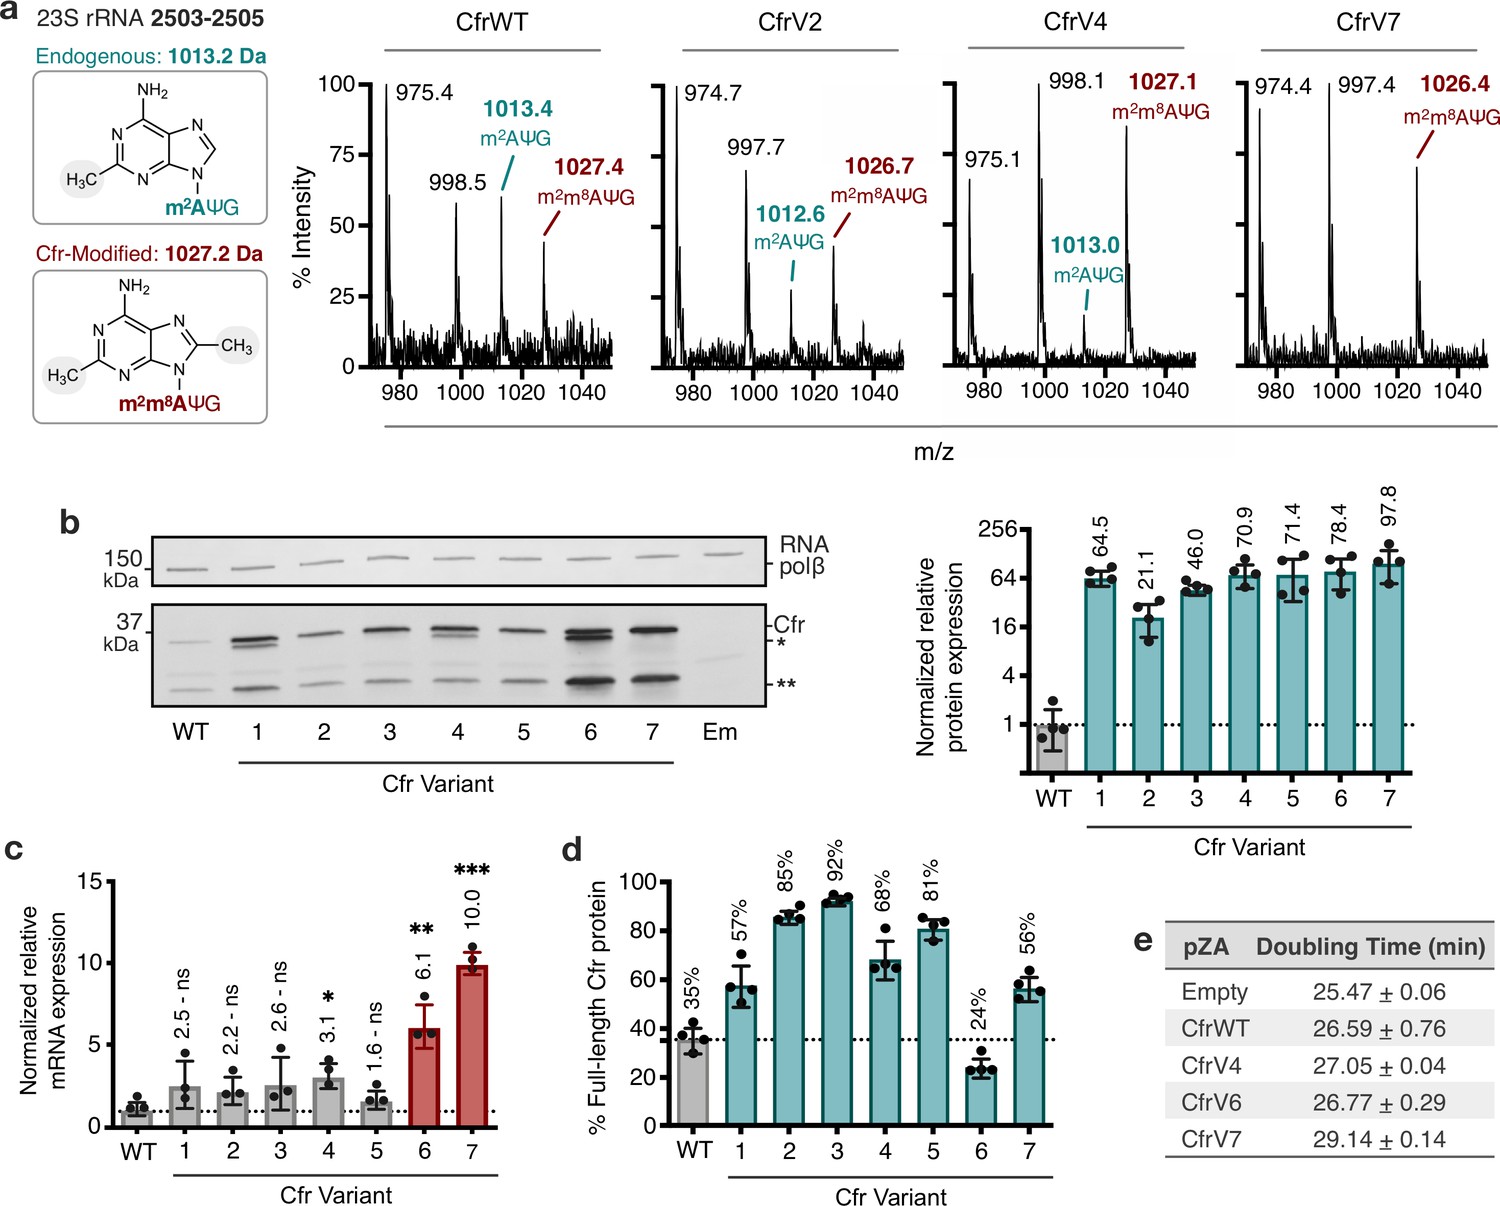
Cfr variants cause increased methylation of 23S rRNA at A2503, correlating with enhanced production of Cfr protein.
(a) Endogenously modified (m2A2503) and Cfr-hypermodified (m2m8A2503) rRNA fragments correspond to m/z values of 1013 and 1027, respectively. MALDI-TOF mass spectra of 23S rRNA fragments isolated from Escherichia coli expressing CfrWT, and evolved Cfr variants V2, V4, and V7. Ψ is pseudouridine, m2A is 2-methyladenosine, is m2m8A is 2,8-dimethyladenosine. (b) Relative protein expression of full-length Cfr variants compared to full-length CfrWT detected by immunoblotting against a C-terminal FLAG tag and quantification of top Cfr bands. Signal was normalized to housekeeping protein RNA polymerase β-subunit. Data are presented as the average of four biological replicates with standard deviation on a log2 axis. Asterisks denote N-terminally truncated versions of Cfr that do not contribute to resistance. Em = empty vector control. Original uncropped blot images are provided in Figure 2—source data 1. (c) Relative transcript levels for variants compared to CfrWT determined from three biological replicates with standard deviation. Statistical analysis was performed using a two-tailed t-test on log2 transformed data. (d) Percentage of total Cfr expression attributed to the production of full-length Cfr protein, presented as the average of four biological replicates with standard deviation. (e) Doubling times for E. coli expressing empty plasmid, CfrWT, or Cfr variants were determined from three biological replicates with standard error. Numerical data and exact p values where relevant for panels (b–d) are provided in Figure 2—source data 2.
-
Figure 2—source data 1
Blot images.
- https://cdn.elifesciences.org/articles/70017/elife-70017-fig2-data1-v1.zip
-
Figure 2—source data 2
Numerical and statistical data.
- https://cdn.elifesciences.org/articles/70017/elife-70017-fig2-data2-v1.xlsx
-
Figure 2—source data 3
Numerical data.
- https://cdn.elifesciences.org/articles/70017/elife-70017-fig2-data3-v1.xlsx
-
Figure 2—source data 4
Blot images.
- https://cdn.elifesciences.org/articles/70017/elife-70017-fig2-data4-v1.zip
-
Figure 2—source data 5
Blot images.
- https://cdn.elifesciences.org/articles/70017/elife-70017-fig2-data5-v1.zip
-
Figure 2—source data 6
Numerical data.
- https://cdn.elifesciences.org/articles/70017/elife-70017-fig2-data6-v1.xlsx
-
Figure 2—source data 7
Numerical data.
- https://cdn.elifesciences.org/articles/70017/elife-70017-fig2-data7-v1.xlsx
Figure 2—figure supplement 1

MALDI-TOF mass spectra of 23S rRNA fragments produced by oligo-protection and RNase T1 digestion.
(a) RNA isolated from Escherichia coli with empty pZA vector or expressing CfrWT and evolved Cfr variants CfrV1–V7. Spectra are representative of 2–3 biological replicates. Endogenously modified (m2A) and Cfr-modified rRNA fragments (m2m8A) correspond to m/z values of 1013 and 1027, respectively. (b) Expected rRNA fragments and m/z values produced by RNase T1 digestion of C2480–C2520 23S rRNA nucleotides after oligo-protection. Peaks ~1264 m/z corresponds to the cyclic phosphate of the UUUG rRNA fragment. Cm is methylated cytosine, Ψ is pseudouridine, m2A is 2-methyladenosine, and m2m8A is 2,8-dimethyladenosine.
Figure 2—figure supplement 2

In vitro characterization of CfrWT and CfrV4.
(a) Schematic representation of 23S rRNA domain V secondary structure highlighting the rRNA fragment 2447–2625 used in the kinetic assay. Position of the Cfr substrate nucleotide A2503 is indicated by a red circle. (b) Time-dependent formation of methylated rRNA product by CfrWT or evolved CfrV4 in reactions containing 5 µM apo-reconstituted Cfr enzyme, 100 µM 23S rRNA fragment 2447–2625, and 2 mM [3H-methyl] S-adenosylmethionine. Values are presented as the average and standard error of two replicates. Turnover numbers for CfrWT and CfrV4 are 3.45×10⁻²±3.2×10⁻³ min–1 and 2.25×10⁻²±1.3×10⁻³ min–1, respectively. Numerical data are provided in Figure 2—source data 3.
Figure 2—figure supplement 3
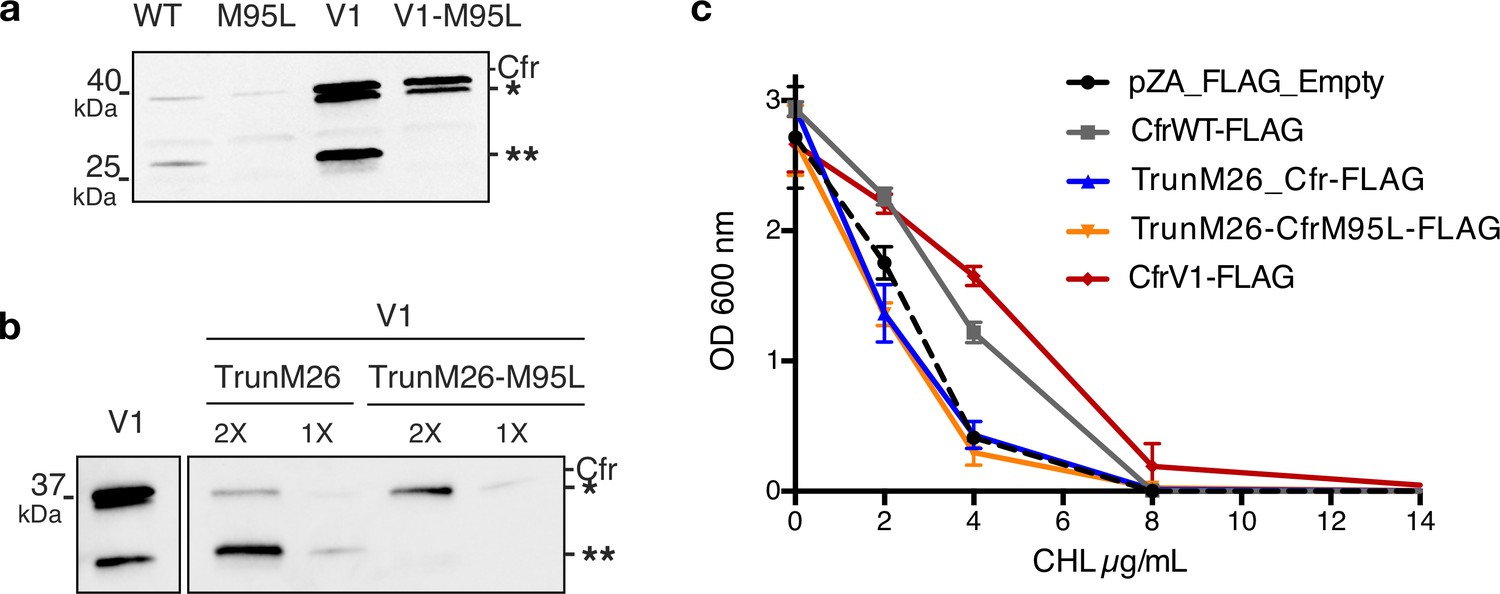
N-terminally truncated Cfr products arise from internal Met translation start sites and do not contribute to resistance.
(a) Detection of Cfr protein products by immunoblotting against C-terminal FLAG tag. Directed evolution mutation I26M is sufficient to produce the higher-molecular weight truncated species (denoted by *). Mutation of M95L (AUG -> CUG) abolishes the production of smaller truncated species (denoted by **). Blot is representative of two biological replicates. Original uncropped blot images are shown in Figure 2—source data 4. (b) Detection of Cfr protein products by immunoblotting against C-terminal FLAG tag with ANTI-FLAG M2-Peroxidase antibody (Sigma). TrunM26 refers to a Cfr construct where amino acids 1–25 have been eliminated. This construct yields predominately species **, with * as the minor expressed protein. TrunM26-M95L eliminates amino acids 1–25 and also removes the internal Met start site through M95L mutations, yielding species *. Original uncropped blot images are shown in Figure 2—source data 5. (c) Dose-dependent growth inhibition of Escherichia coli expressing N-terminally truncated Cfrs in the presence of chloramphenicol (CHL). Results presented as the average of two biological replicates with standard error. Numerical data are provided in Figure 2—source data 6.
Figure 2—figure supplement 4
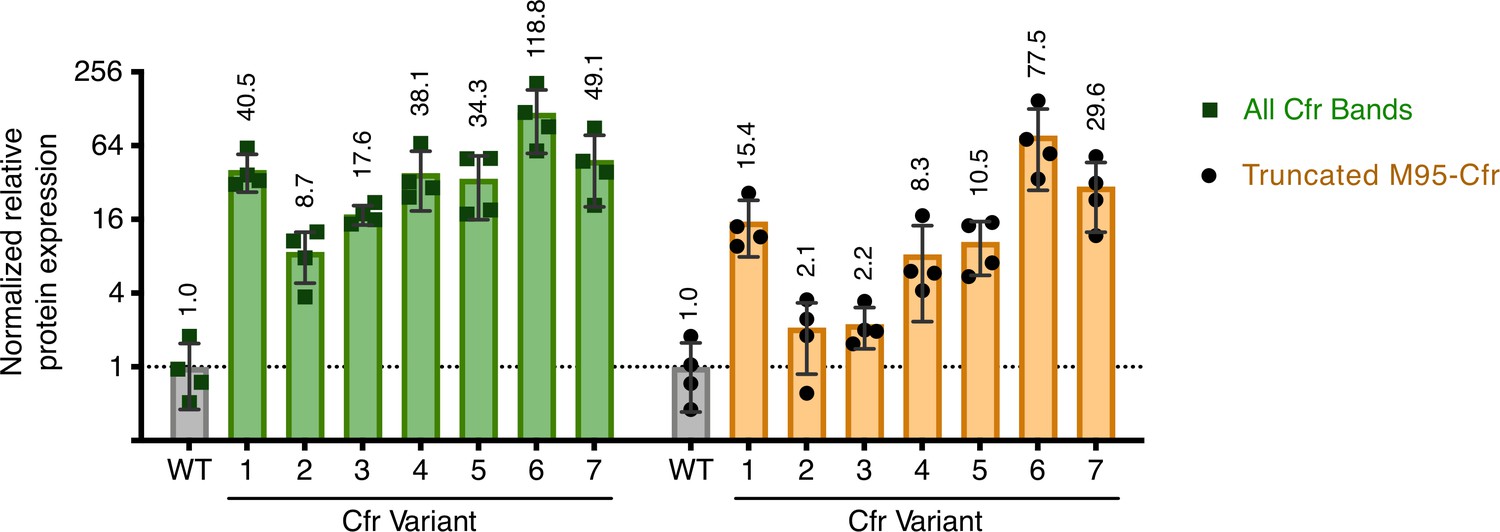
Quantification of Cfr bands observed upon expression of Cfr variants.
Relative protein expression of all Cfr-FLAG bands (green) or band corresponding to the N-terminal truncation at Met95 (yellow) for Cfr variants compared to CfrWT detected by immunoblotting against a C-terminal FLAG tag. Signal was normalized to housekeeping protein RNA polymerase β-subunit. A representative western blot is presented in Figure 2b. Data are presented as the average of four biological replicates with standard deviation on a log2 axis. Original uncropped blot images are shown in Figure 2—source data 1. Numerical data are provided in Figure 2—source data 7.
Figure 3 with 2 supplements
Mutations to the second amino acid and promoter are the largest contributors to Cfr expression and resistance.
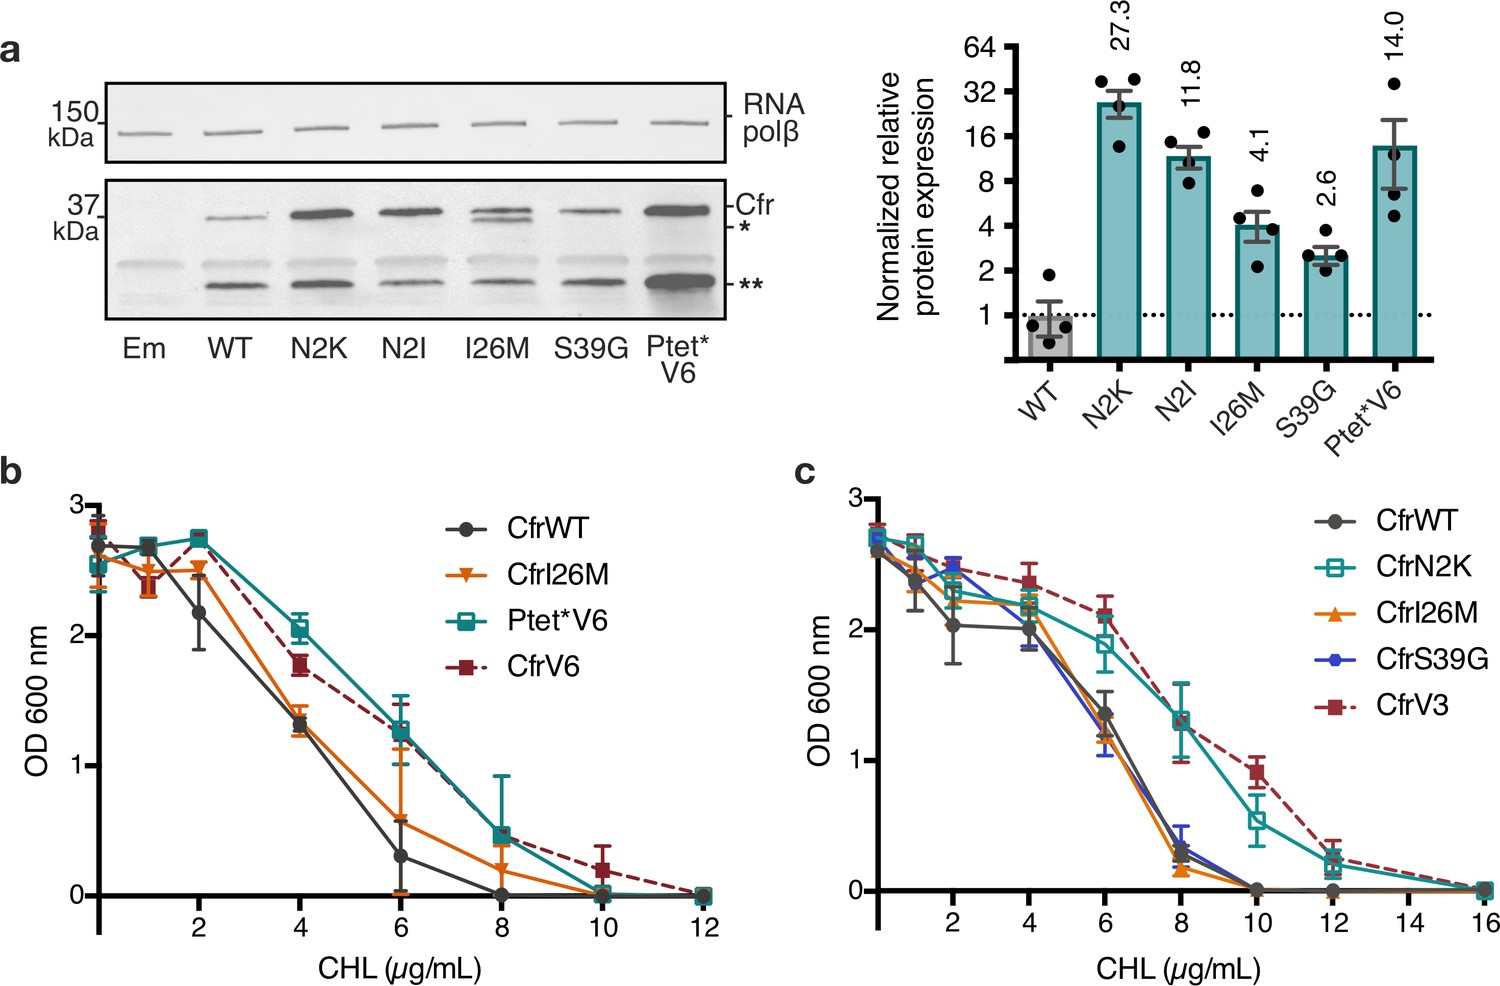
(a) Effect of Cfr mutations and promoter alteration on relative Cfr protein expression was assessed by immunoblotting against a C-terminal FLAG tag. Quantification was performed for full-length Cfr protein normalized to housekeeping protein RNA polymerase β-subunit. Data are presented as the average of four biological replicates with standard deviation on a log2 axis. Asterisks denote N-terminally truncated Cfr protein products that do not contribute to resistance and were not included in quantification. Em = empty vector control. Original uncropped blot images are shown in Figure 3—source data 1. (b) and (c) Dose-dependent growth inhibition of Escherichia coli expressing pZA-encoded CfrWT, CfrV6 (panel (b)), CfrV3 (panel (c)), and individual mutants that comprise these variants toward chloramphenicol (CHL) presented as an average of three biological replicates with standard error. Numerical data for all figure panels are provided in Figure 3—source data 2.
-
Figure 3—source data 1
Blot images.
- https://cdn.elifesciences.org/articles/70017/elife-70017-fig3-data1-v1.zip
-
Figure 3—source data 2
Numerical data.
- https://cdn.elifesciences.org/articles/70017/elife-70017-fig3-data2-v1.xlsx
-
Figure 3—source data 3
Numerical data.
- https://cdn.elifesciences.org/articles/70017/elife-70017-fig3-data3-v1.xlsx
-
Figure 3—source data 4
Blot images.
- https://cdn.elifesciences.org/articles/70017/elife-70017-fig3-data4-v1.zip
-
Figure 3—source data 5
Numerical data.
- https://cdn.elifesciences.org/articles/70017/elife-70017-fig3-data5-v1.xlsx
Figure 3—figure supplement 1
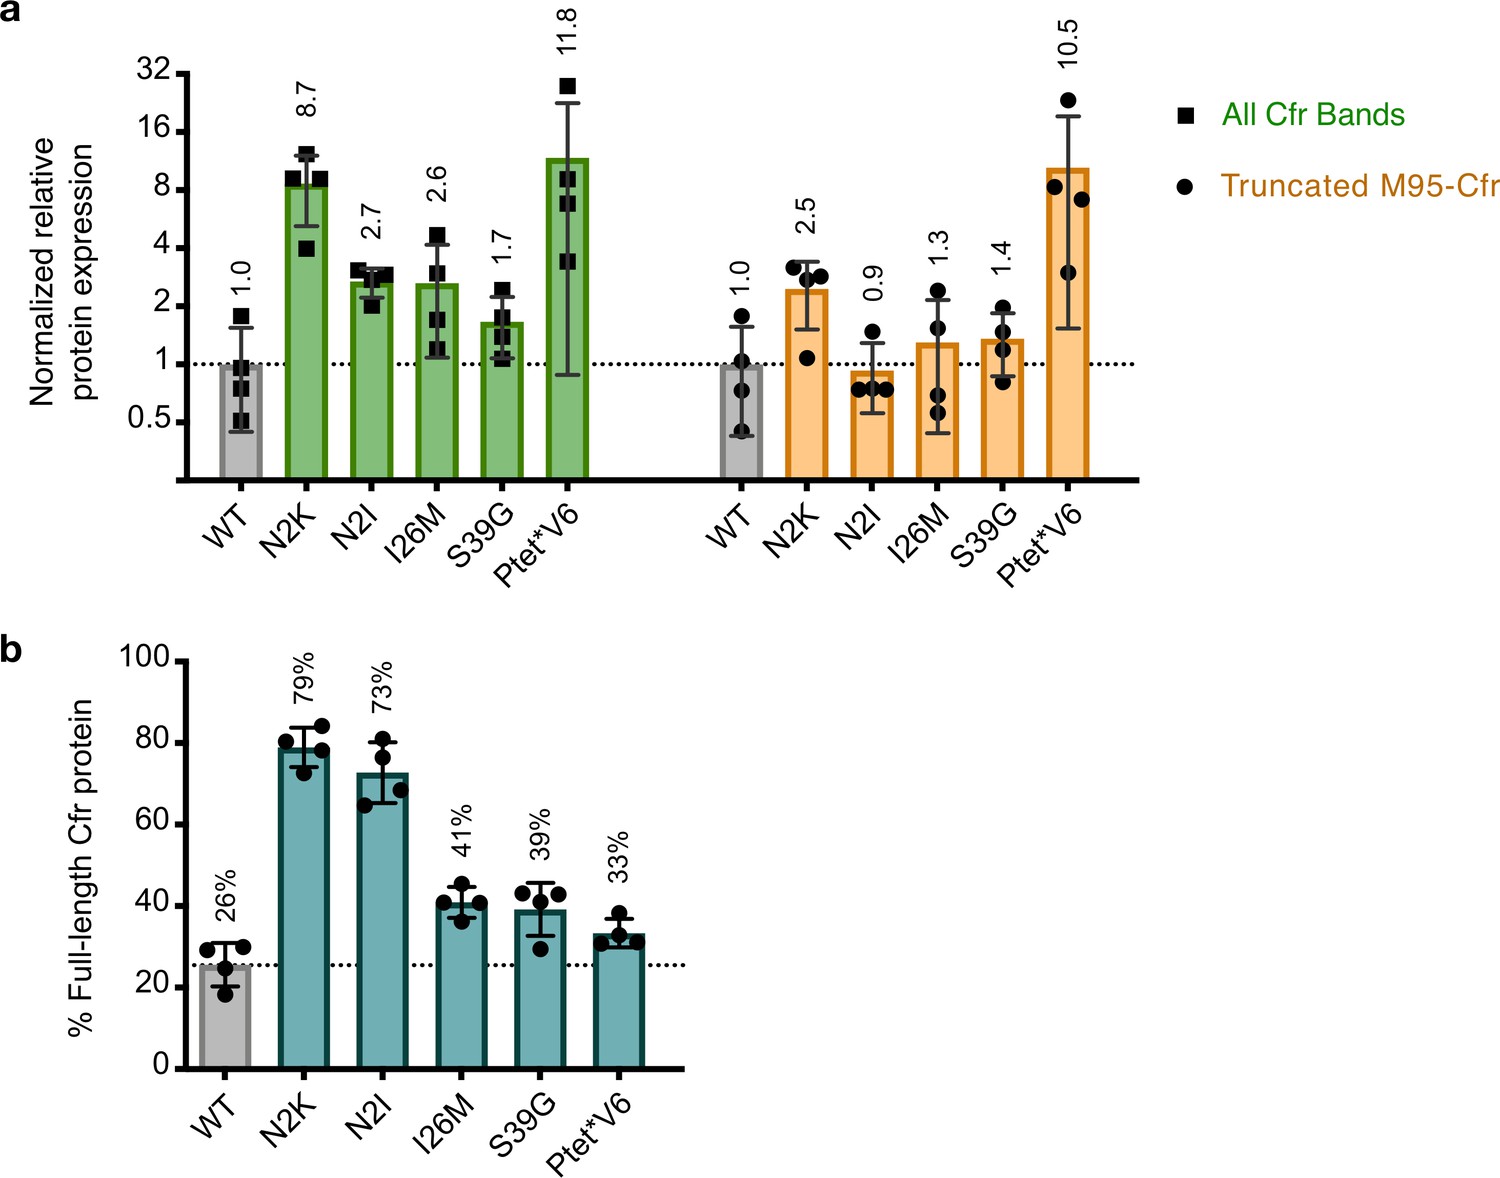
Quantification of Cfr bands observed upon expression of Cfr Ptet*V6 or single mutations.
(a) Relative protein expression of all Cfr-FLAG bands (green) or band corresponding to the N-terminal truncation at Met95 (yellow) for Cfr mutants compared to CfrWT detected by immunoblotting against a C-terminal FLAG tag. Signal was normalized to housekeeping protein RNA polymerase β-subunit. A representative western blot is presented in Figure 3a. Data are presented as the average of four biological replicates with standard deviation on a log2 axis. (b) Percentage of total Cfr expression attributed to production of full-length Cfr protein, presented as the average of four biological replicates with standard deviation. Original uncropped blot images are shown in Figure 3—source data 1. Numerical data for panels in this figure are provided in Figure 3—source data 3.
Figure 3—figure supplement 2
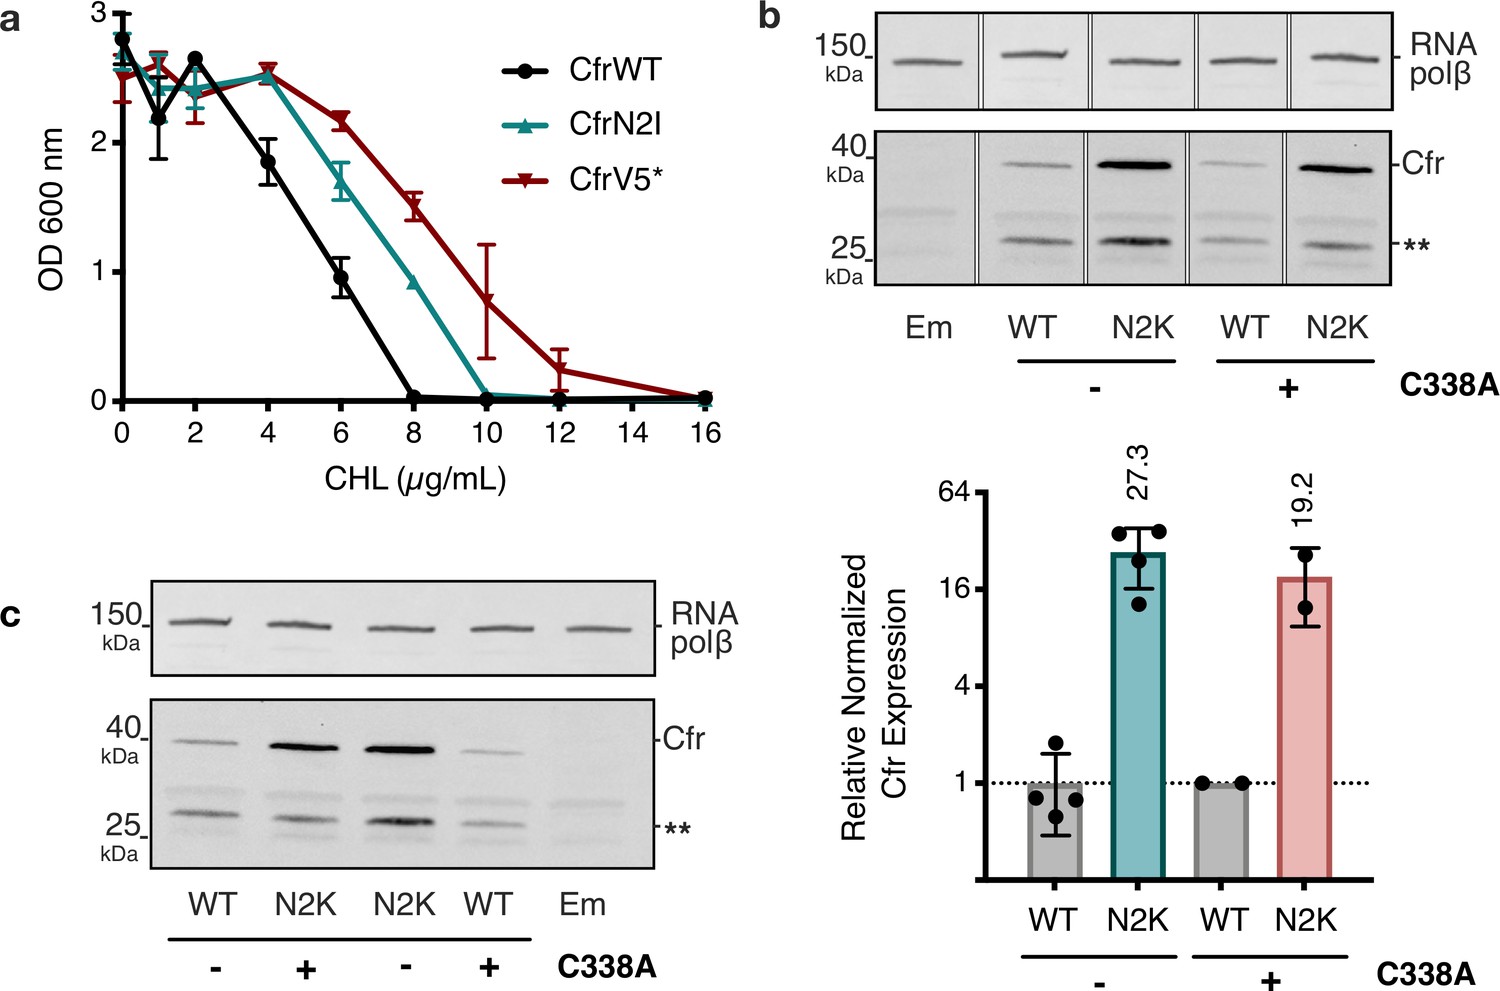
Investigations into second position Cfr mutations N2I and N2K.
(a) Dose-dependent growth inhibition of Escherichia coli expressing CfrN2I compared to CfrV5 toward chloramphenicol (CHL). Results presented as an average of three biological replicates with standard error. (b) Relative expression of CfrN2K compared to CfrWT, in the presence or absence of an additional C338A mutation that renders Cfr catalytically inactive. Therefore, in constructs carrying the C338A mutation, Cfr constructs are produced by ribosomes that lack the m8A2503 modification. Signal of full-length Cfr protein was normalized to housekeeping protein RNA polymerase β-subunit, presenting the average of two biological replicates and standard deviation on a log2 axis. Asterisks denote truncated Cfr products that do not contribute to resistance and were not included in quantification. (c) Original, uncropped image of panel (a). Em = empty vector control. Original uncropped blot images are shown in Figure 3—source data 4. Numerical data for panels in this figure are provided in Figure 3—source data 5.
Figure 4 with 5 supplements

Directed evolution mutations impact Cfr translation and degradation.
(a) Sucrose gradient fractionation of polysomes from Escherichia coli expressing empty vector or CfrWT/N2K/V4 denoting fractions corresponding to low- and high-density polysomes. (b) mRNA distribution of well-translated, housekeeping gene recA across polysome profiles. (c) mRNA distribution of Cfr transcripts expressing CfrWT or CfrN2K. (d) mRNA distribution of Cfr transcripts expressing CfrWT or CfrV4. For (b–d), transcript levels for each fraction were determined by RT-qPCR and normalized by a luciferase mRNA control spike-in. Values presented as the average of three biological replicates with standard error. (e) Protein degradation kinetics of CfrWT, single mutations CfrN2K/N2I/S39G/I26M, and evolved variant CfrV3 in E. coli after halting expression by rifampicin treatment. Percentage of Cfr protein remaining over time was determined by immunoblotting against C-terminal FLAG tag and presented as the average of three biological replicates with standard error. Original uncropped blot images are shown in Figure 4—source data 1. Numerical data for all figure panels are provided in Figure 4—source data 2.
-
Figure 4—source data 1
Blot images.
- https://cdn.elifesciences.org/articles/70017/elife-70017-fig4-data1-v1.zip
-
Figure 4—source data 2
Numerical data.
- https://cdn.elifesciences.org/articles/70017/elife-70017-fig4-data2-v1.xlsx
-
Figure 4—source data 3
Numerical data.
- https://cdn.elifesciences.org/articles/70017/elife-70017-fig4-data3-v1.xlsx
-
Figure 4—source data 4
Blot images.
- https://cdn.elifesciences.org/articles/70017/elife-70017-fig4-data4-v1.zip
-
Figure 4—source data 5
Numerical data.
- https://cdn.elifesciences.org/articles/70017/elife-70017-fig4-data5-v1.xlsx
Figure 4—figure supplement 1
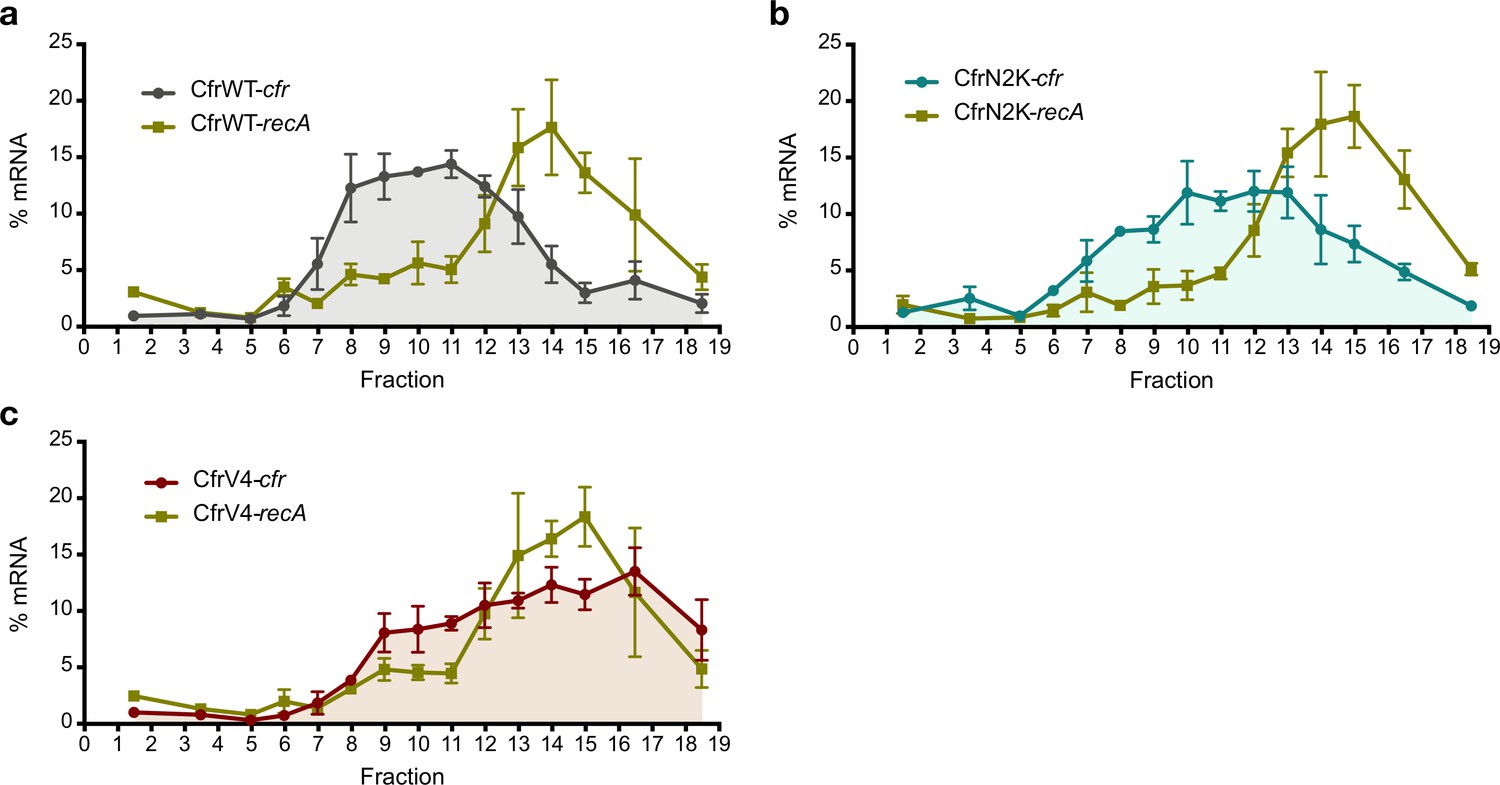
Investigating translation of Cfr mutants.
Distribution of Cfr and recA transcripts across polysome profiles from Escherichia coli expressing (a) pZA-encoded CfrWT, (b) CfrN2K, and (c) CfrV4. Transcript levels for each fraction isolated from a 10–55% sucrose gradient were determined by RT-qPCR and normalized by a luciferase mRNA control spike-in. Values are presented as the average of three biological replicates with standard error. Numerical data for panels in this figure are provided in Figure 4—source data 3.
Figure 4—figure supplement 2
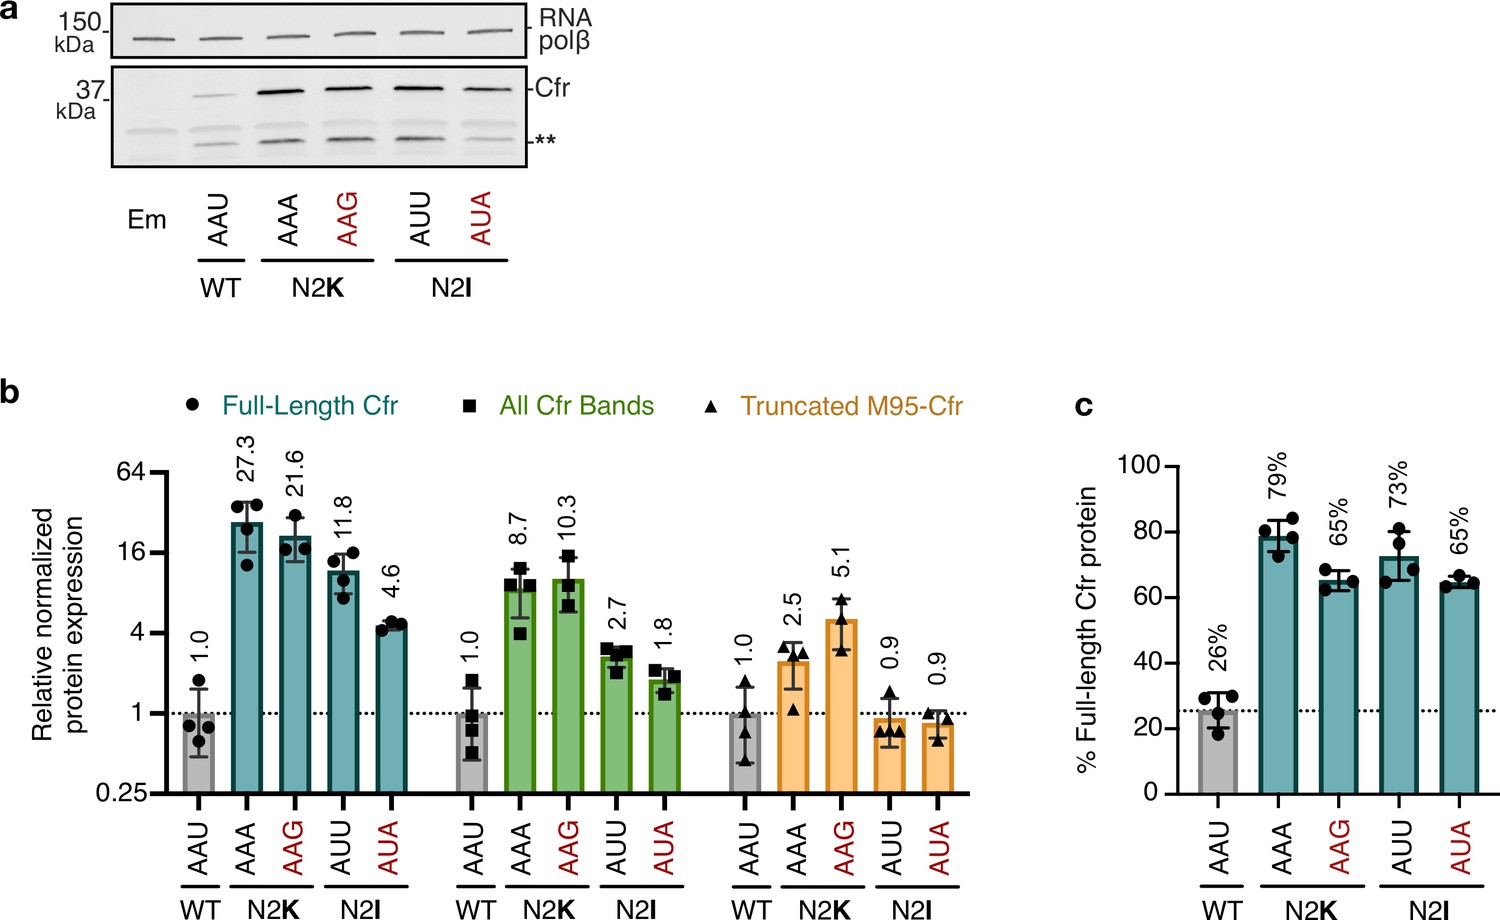
Impact of second codon identity on Cfr expression.
(a) Cfr protein levels were assessed by immunoblotting against a C-terminal FLAG tag. Mutations away from the directed evolution mutation are in red lettering. Asterisks denote the truncated Cfr products that do not contribute to resistance. Em = empty vector control. (b) Relative protein expression of full-length Cfr (teal), all Cfr bands (green), and the truncation corresponding to translation initiation at Met95 (yellow) for second codon mutants compared to CfrWT. Signal was normalized to housekeeping protein RNA polymerase β-subunit. Data are presented as the average of three or four biological replicates with standard deviation on a log2 axis. Original uncropped blot images are shown in Figure 4—source data 4. (c) Percentage of total Cfr expression attributed to the production of full-length Cfr protein, presented as the average of three or four biological replicates with standard deviation. Numerical data for panels in this figure are provided in Figure 4—source data 5.
Figure 4—figure supplement 3
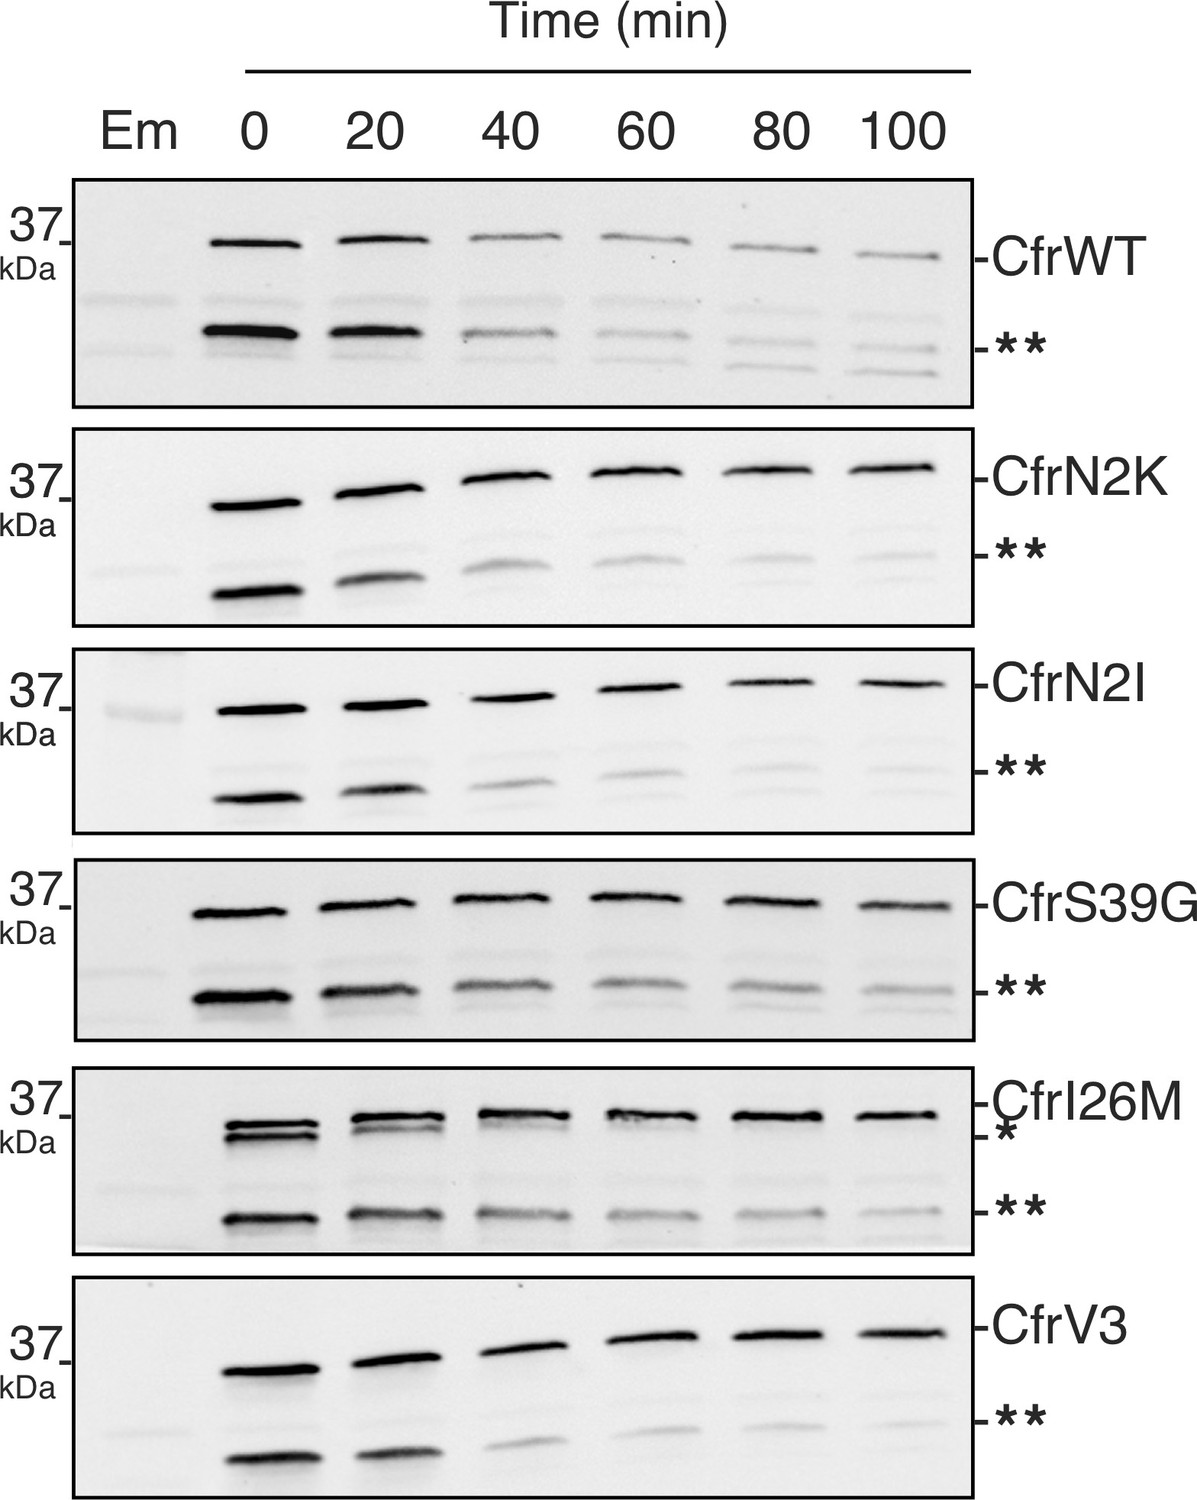
Degradation of Cfr protein products.
Protein degradation kinetics of CfrWT, single mutations CfrN2K/N2I/S39G/I26M, and evolved variant CfrV3 in Escherichia coli after halting expression by rifampicin and immunoblotting against the C-terminal FLAG tag. Presented western blots are expanded images of those presented in Figure 4 to display degradation of the Cfr truncation denoted by two asterisks (**). Em = empty vector control. Original uncropped blot images are shown in Figure 4—source data 1.
Figure 4—figure supplement 4
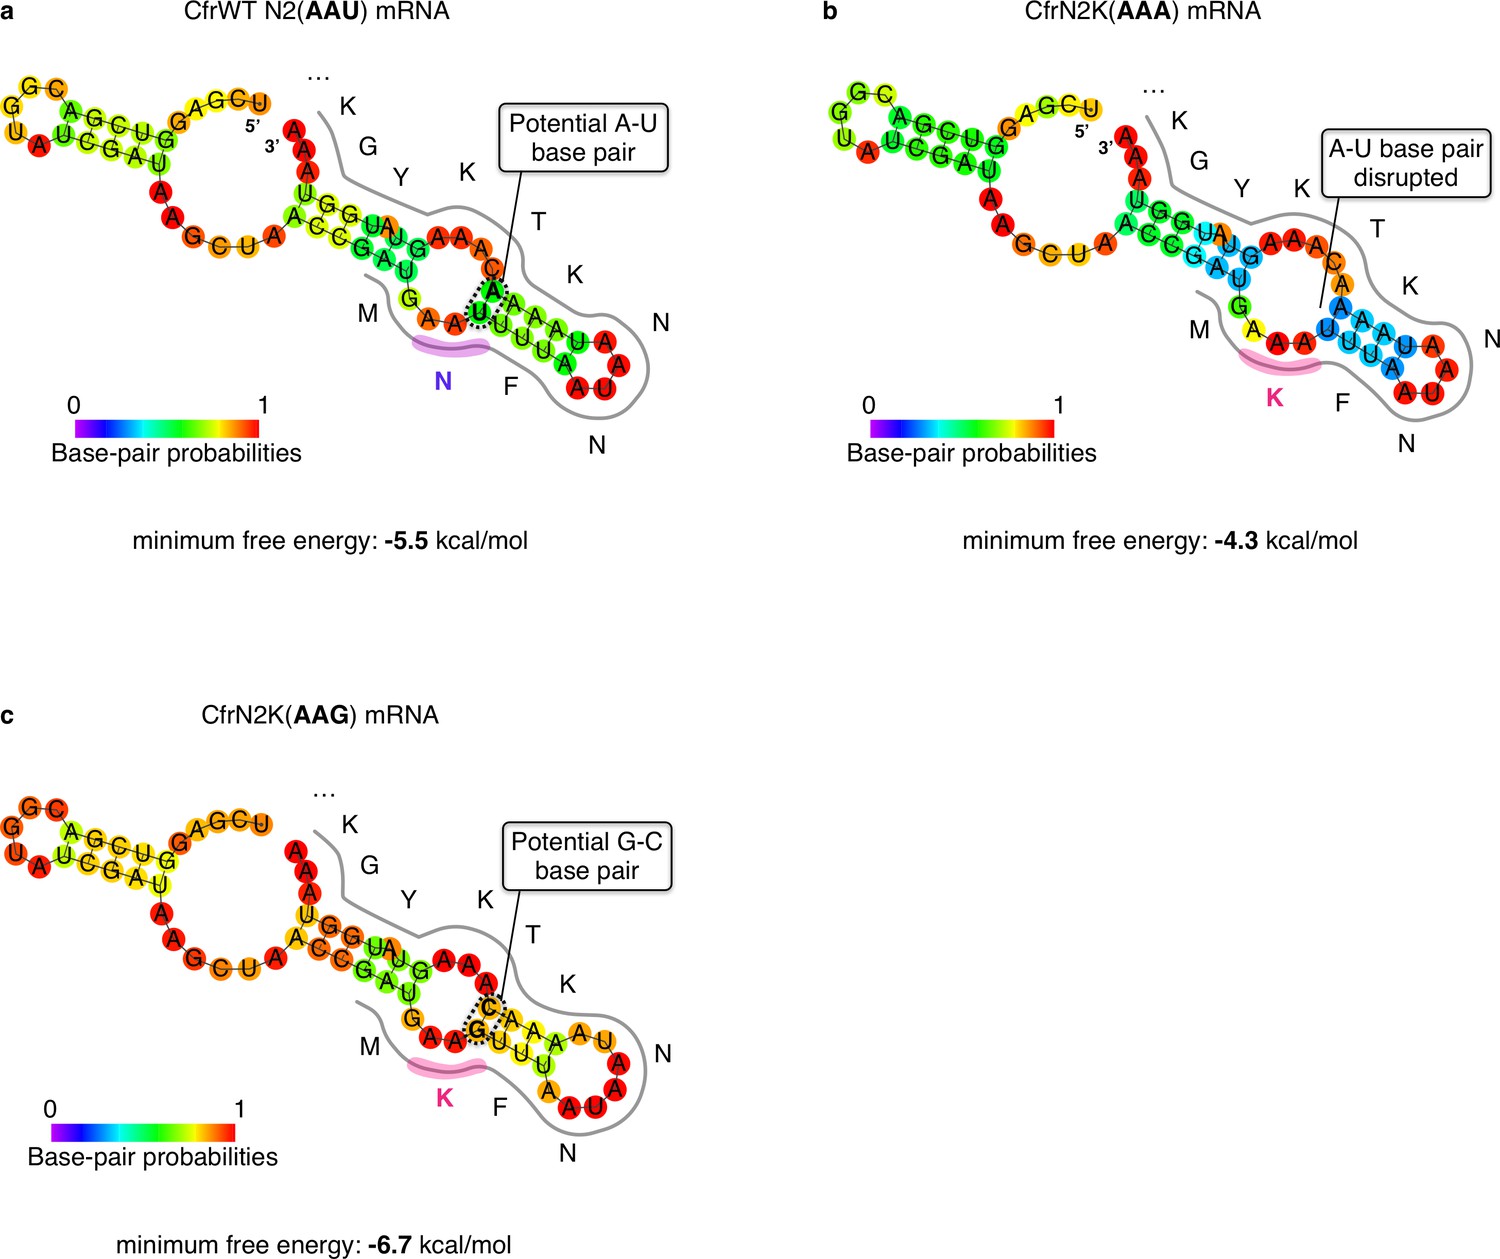
RNA secondary structure predictions of the sequence region proximal to the Cfr start codon.
Minimum free energy secondary structure prediction by RNAfold v2.4.8 (Lorenz et al., 2011) of the 30 mRNA nucleotides upstream and downstream of the Cfr AUG start codon for (a) CfrWT, (b) CfrN2K(AAA), and (c) CfrN2K(AAG). Bases are colored according to their base-pair probabilities.
Figure 4—figure supplement 5
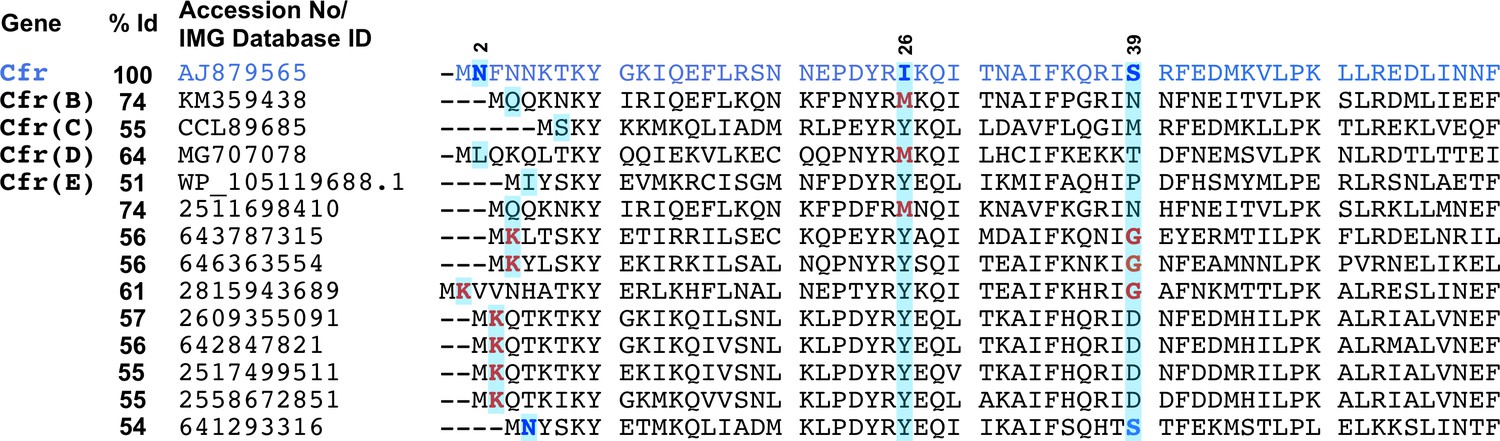
Protein sequence alignment of Cfr and Cfr homologs.
CfrWT used for the starting point for directed evolution is displayed as the top sequence (Cfr) in blue. Cfr(B), Cfr(C), Cfr(D), and Cfr(E) are Cfr homologs that have been functionally characterized, reviewed here (Schwarz et al., 2021). Remaining sequences are Cfr homologs that clade with Cfr or Cfr-like genes as described previously (Stojković et al., 2019). Percent shared amino acid identity (% Id) with Cfr is noted. Directed evolution mutations N2K, I26M, and S39G are highlighted with red lettering. Alignment was performed using MUSCLE (Edgar, 2004) and the first ~60 residues are displayed. Cfr homologous sequences were derived from the following organisms: Staphylococcus aureus (AJ879565), Clostridioides difficile (KM359438), Clostridioides difficile T10 (CCL89685), Enterococcus faecium (MG707078), Firmicutes (WP_105119688.1), Bacillus amyloliquefaciens (2511698410), Brevibacillus brevis (643787315), Geobacillus sp. Y412MC10 (646363554), Bacillus clausii (2815943689), Clostridium saccharoperbutylacetonicum (2609355091), Clostridium sporogenes (642847821), Clostridium acidurici (2517499511), Clostridium mangenotii (2558672851), and Clostridium phytofermentans (641293316).
Figure 5 with 5 supplements
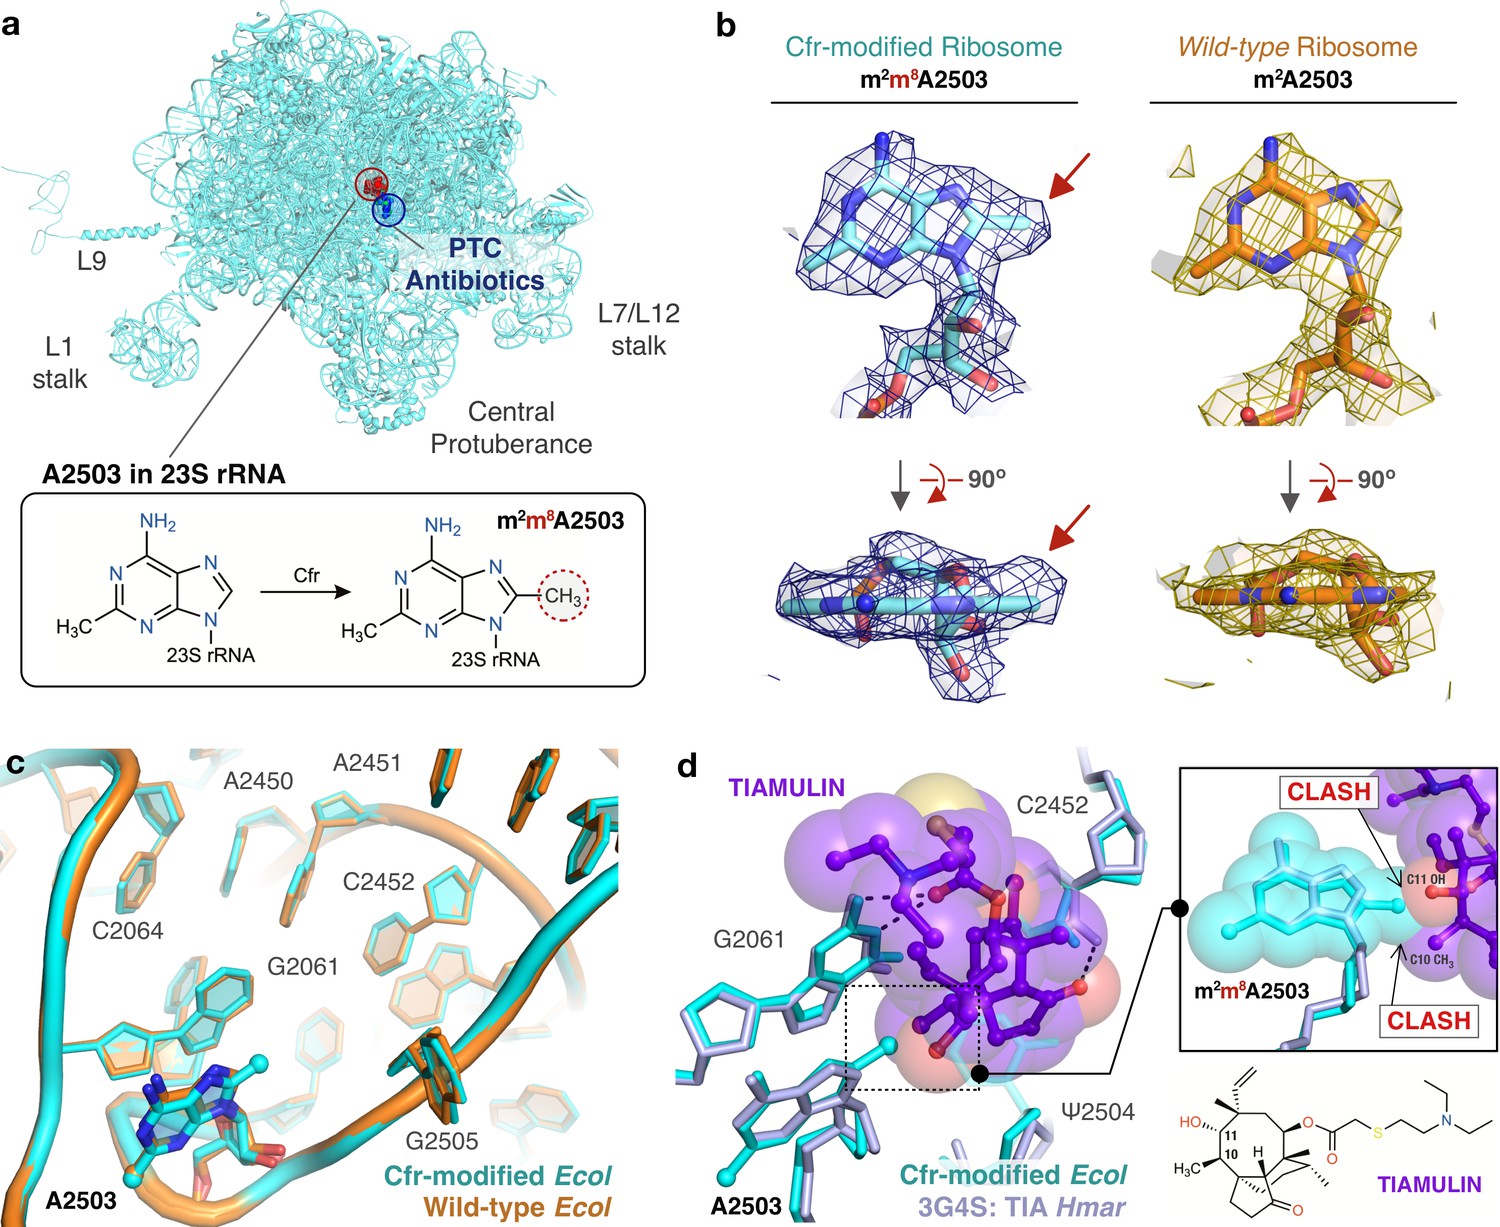
Near-stoichiometric ribosome methylation by CfrV7 enables structural understanding of Cfr-mediated resistance to antibiotics.
(a) Cfr-modified 50S ribosomal subunit highlighting adenosine 2503 (A2503) within 23S rRNA and the binding site of PTC-targeting antibiotics. Cfr methylates A2503 at the C8 carbon to produce m2m8A2503. (b) Cryo-EM density maps of adenosine 2503 in 23S rRNA contoured to 3σ. Cfr-modified (m2m8A2503) in cyan. Wild-type (m2A2503) in orange; PDB 6PJ6. (c) Close-up view of 23S rRNA nucleotides in the 50S ribosomal subunit. Cfr-modified Escherichia coli ribosome in cyan. Wild-type E. coli ribosome in orange; PDB 6PJ6. (d) Structural overlay of Cfr-modified E. coli ribosome (cyan) and Haloarcula marismortui 50S ribosome in complex with pleuromutilin antibiotic tiamulin (purple, PDB 3G4S) highlighting steric clashes between m8A2503 and the antibiotic. EM, electron microscopy.
Figure 5—figure supplement 1
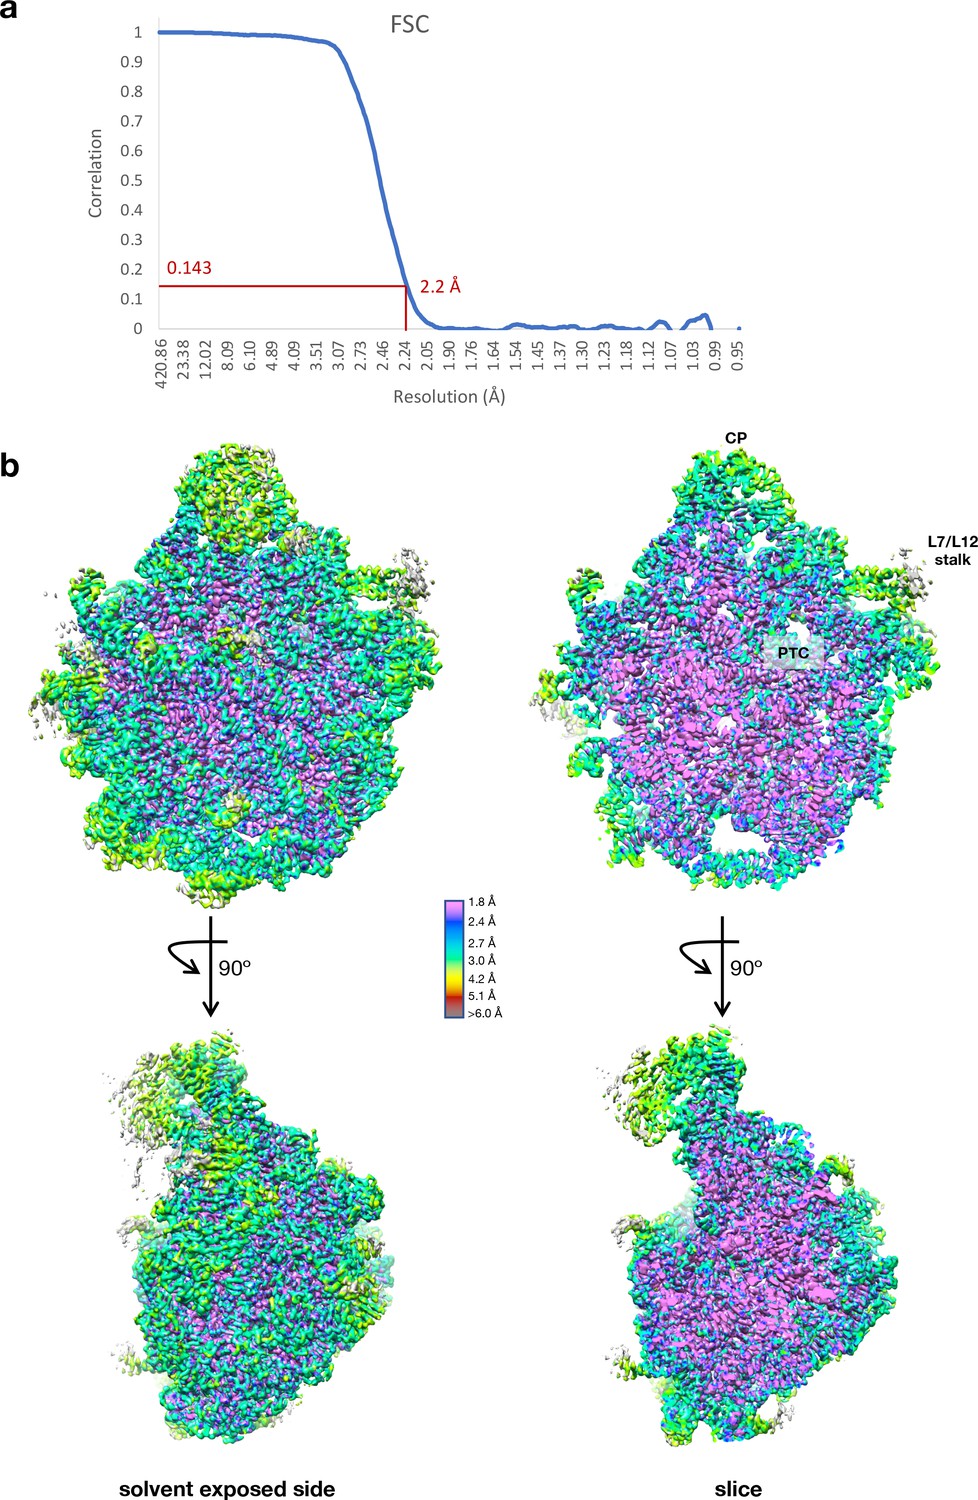
Cryo-EM data collection and processing of the Cfr-modified ribosome.
(a) Fourier shell correlation (FSC) curve indicating the overall resolution of the Escherichia coli 50S subunit using the FSC=0.143 gold standard. (b) 3D cryo-EM map of the E. coli 50S subunit colored according to local resolution, highlighting the L7/L12 stalk and peptidyl transferase center (PTC). Local resolution map was calculated with ResMap. Figure was prepared using UCSF Chimera 1.13 (Pettersen et al., 2004). EM, electron microscopy.
Figure 5—figure supplement 2
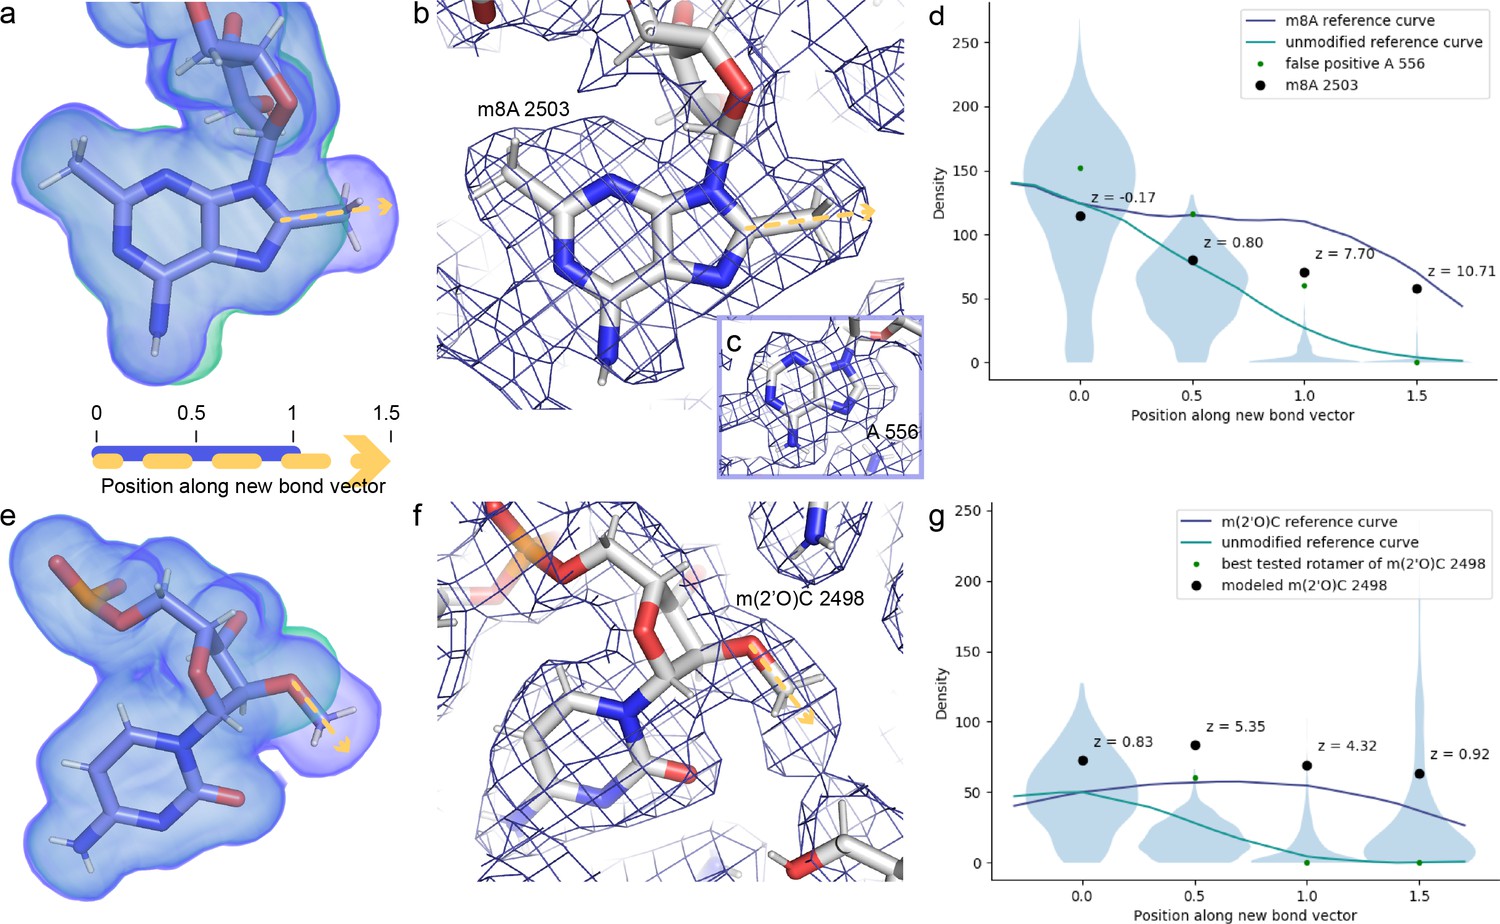
Cross-validation of methylations on C8 of A2503 and 2′O of C2498 from the cryo-EM density map.
Ideal, noise-free densities were calculated for the post-transcriptionally modified (purple) and unmodified (green) nucleotides (a, e). We can distinguish which of these maps better matches the experimental map by examining the dropoff in density when moving from the reference atom (C8 or 2′O) toward and beyond the methyl group. To this end, the noise-free calculated densities were used to generate reference curves for these two modifications (d, g). These curves were scaled to match the mean density at the reference atom for all instances of adenosines (d) or cytosines (g) in the experimental structure, and for those same nucleotides, densities at four selected positions along the vector are also shown in violin plots (d, g). Based on these four densities as well as calculated difference density at the 1.0 position and the correlation coefficient between the calculated and experimental map for the entire nucleotide, the program qPTxM for detection of posttranscriptional modifications identified two adenosines where the map supported C8 methylation: A2503 and a false positive A556 (b–d). Investigation of the densities at these two sites confirmed that the shape of the density dropoff curve for A2503 more closely matched the methylated reference curve while that of A556 more closely matched the unmethylated reference curve, and that the latter site was identified as a strong candidate primarily due to the strong density at all atoms. qPTxM identified no cytosines where the map supported 2′O methylation (g). The densities along the methylation bond vector more closely match the unmodified than the methylated reference curve at C2498 (f) when the methyl group is placed at any of the rotameric positions (green dots), but along the modeled O-Me bond (black dots), the dropoff closely matches the shape of the methylated reference curve (g). Plots are annotated with Z-scores for the A2503 and C2498 densities relative to all adenosines and cytosines in the map. EM, electron microscopy.
Figure 5—figure supplement 3
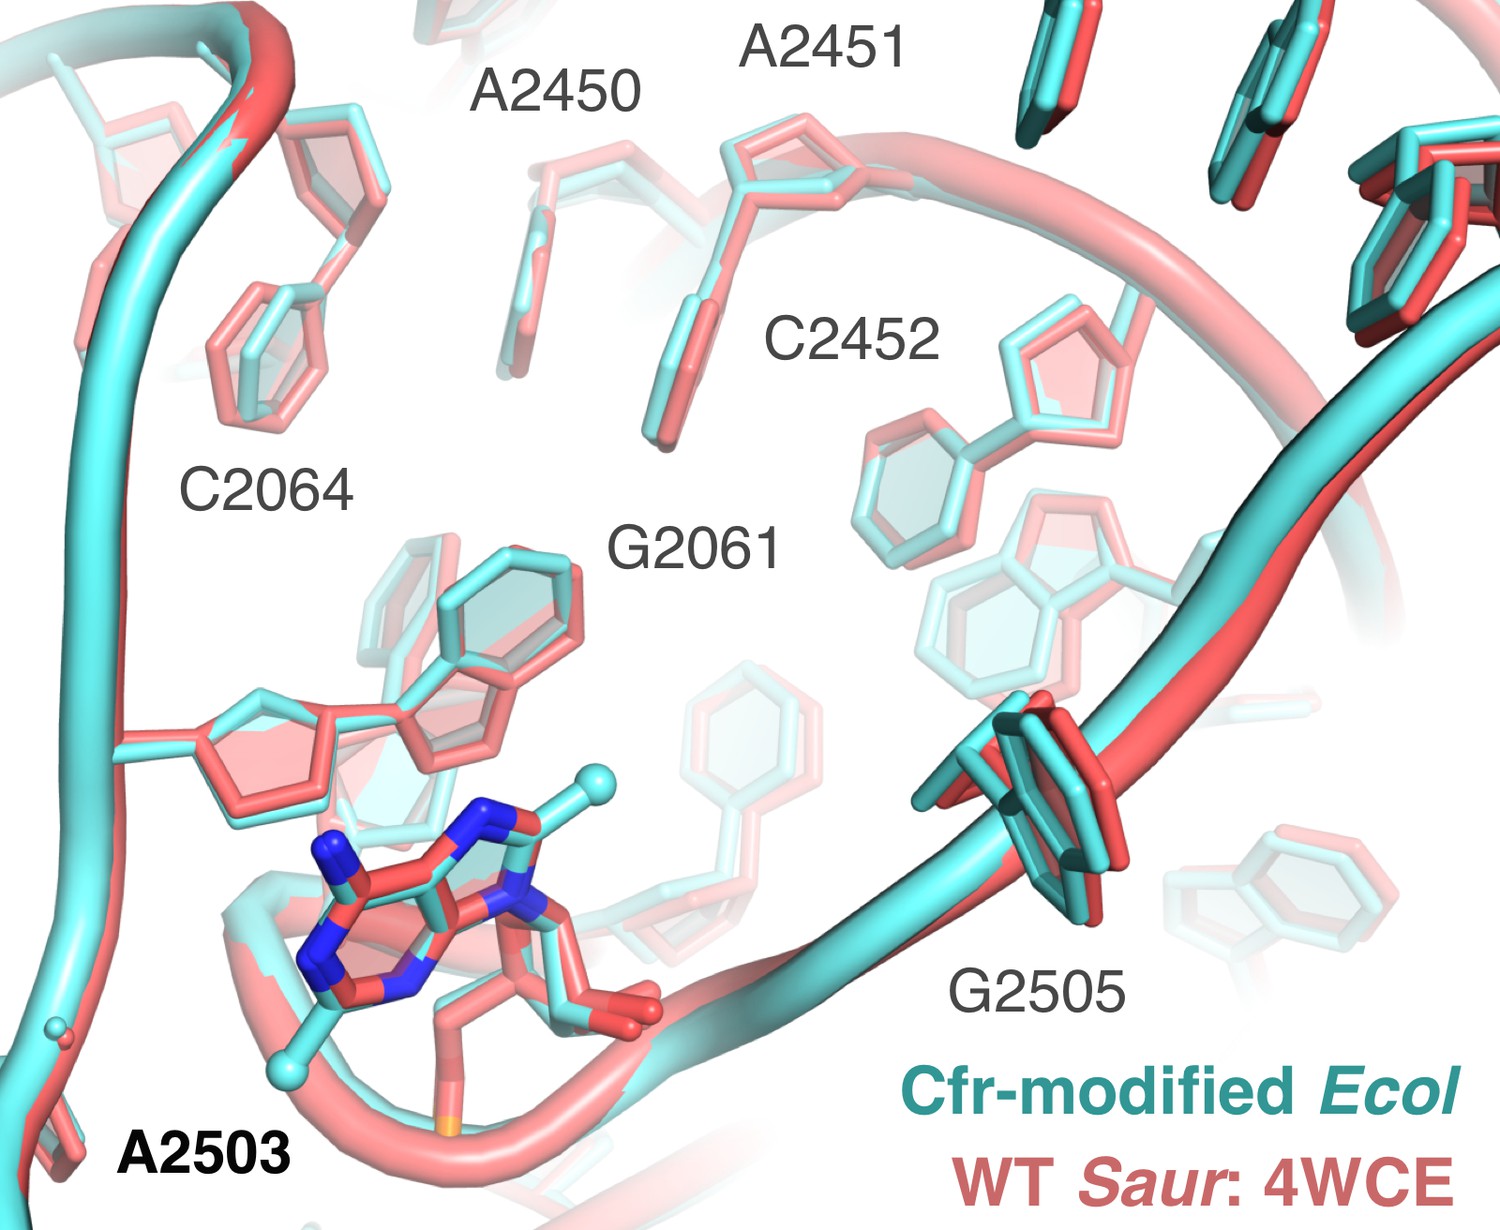
Overlay of Cfr-modified Escherichia coli ribosome and WT Staphylococcus aureus ribosome.
Close-up view of 23S rRNA nucleotides in the 50S ribosomal subunit, highlighting the PTC region. Cfr-modified ribosome in cyan. Wild-type S. aureus ribosome in salmon; PDB 4WCE. PTC, peptidyl transferase center.
Figure 5—figure supplement 4
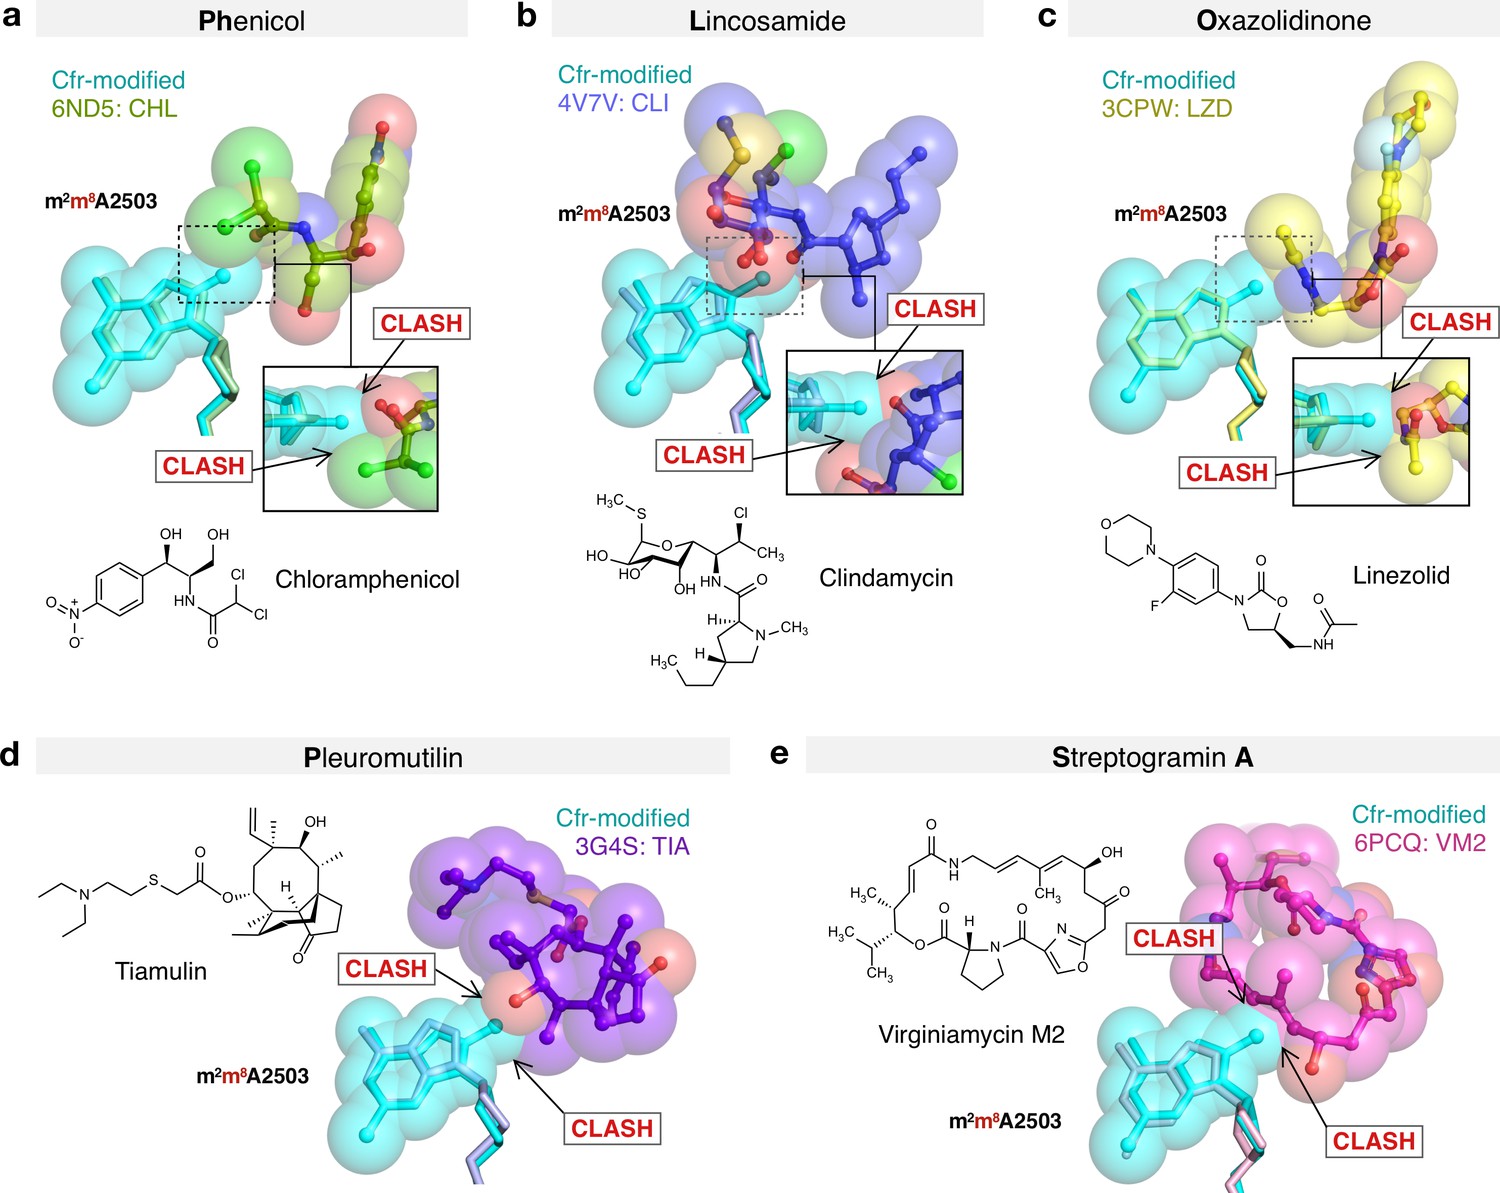
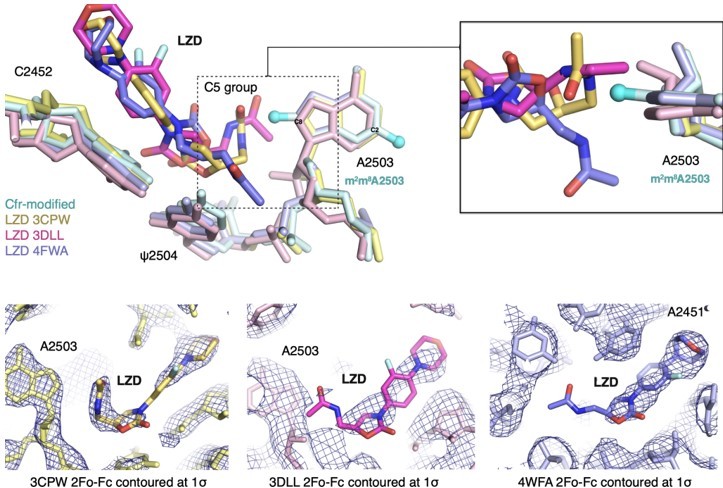
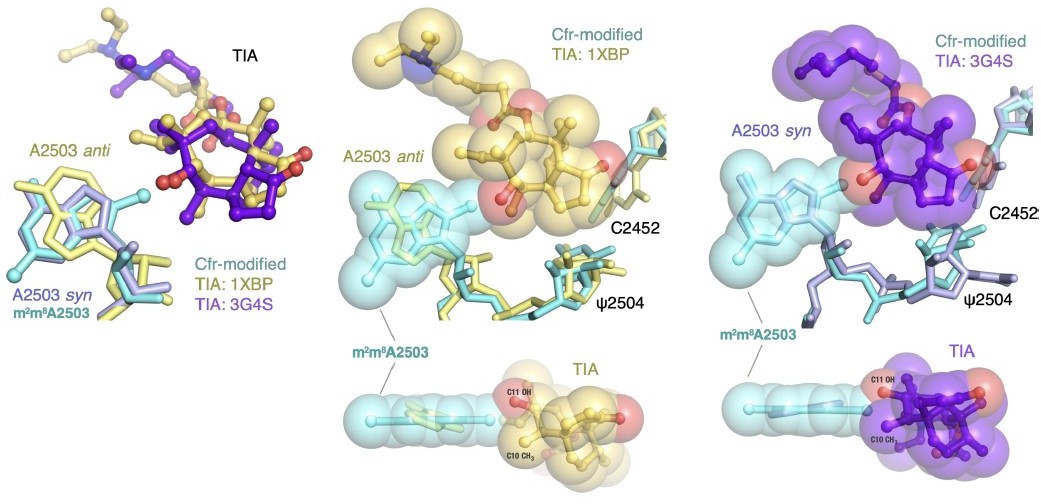
Molecular basis of Cfr-mediated resistance to PhLOPSA antibiotics.
Structural overlay of Cfr-modified Escherichia coli 50S ribosome (cyan) and ribosomes in complex with (a) chloramphenicol (CHL); PDB 6ND5, (b) clindamycin (CLI); PDB 4V7V, (c) linezolid (LZD); PDB 3CPW, (d) tiamulin (TIA) PDB 3G4S, and (e) virginiamycin M2 (VM2); PDB 6PCQ. Inserts are close-up views of the steric clashes between m8A2503 and corresponding PTC-targeting antibiotics. PTC, peptidyl transferase center.
Figure 5—figure supplement 5
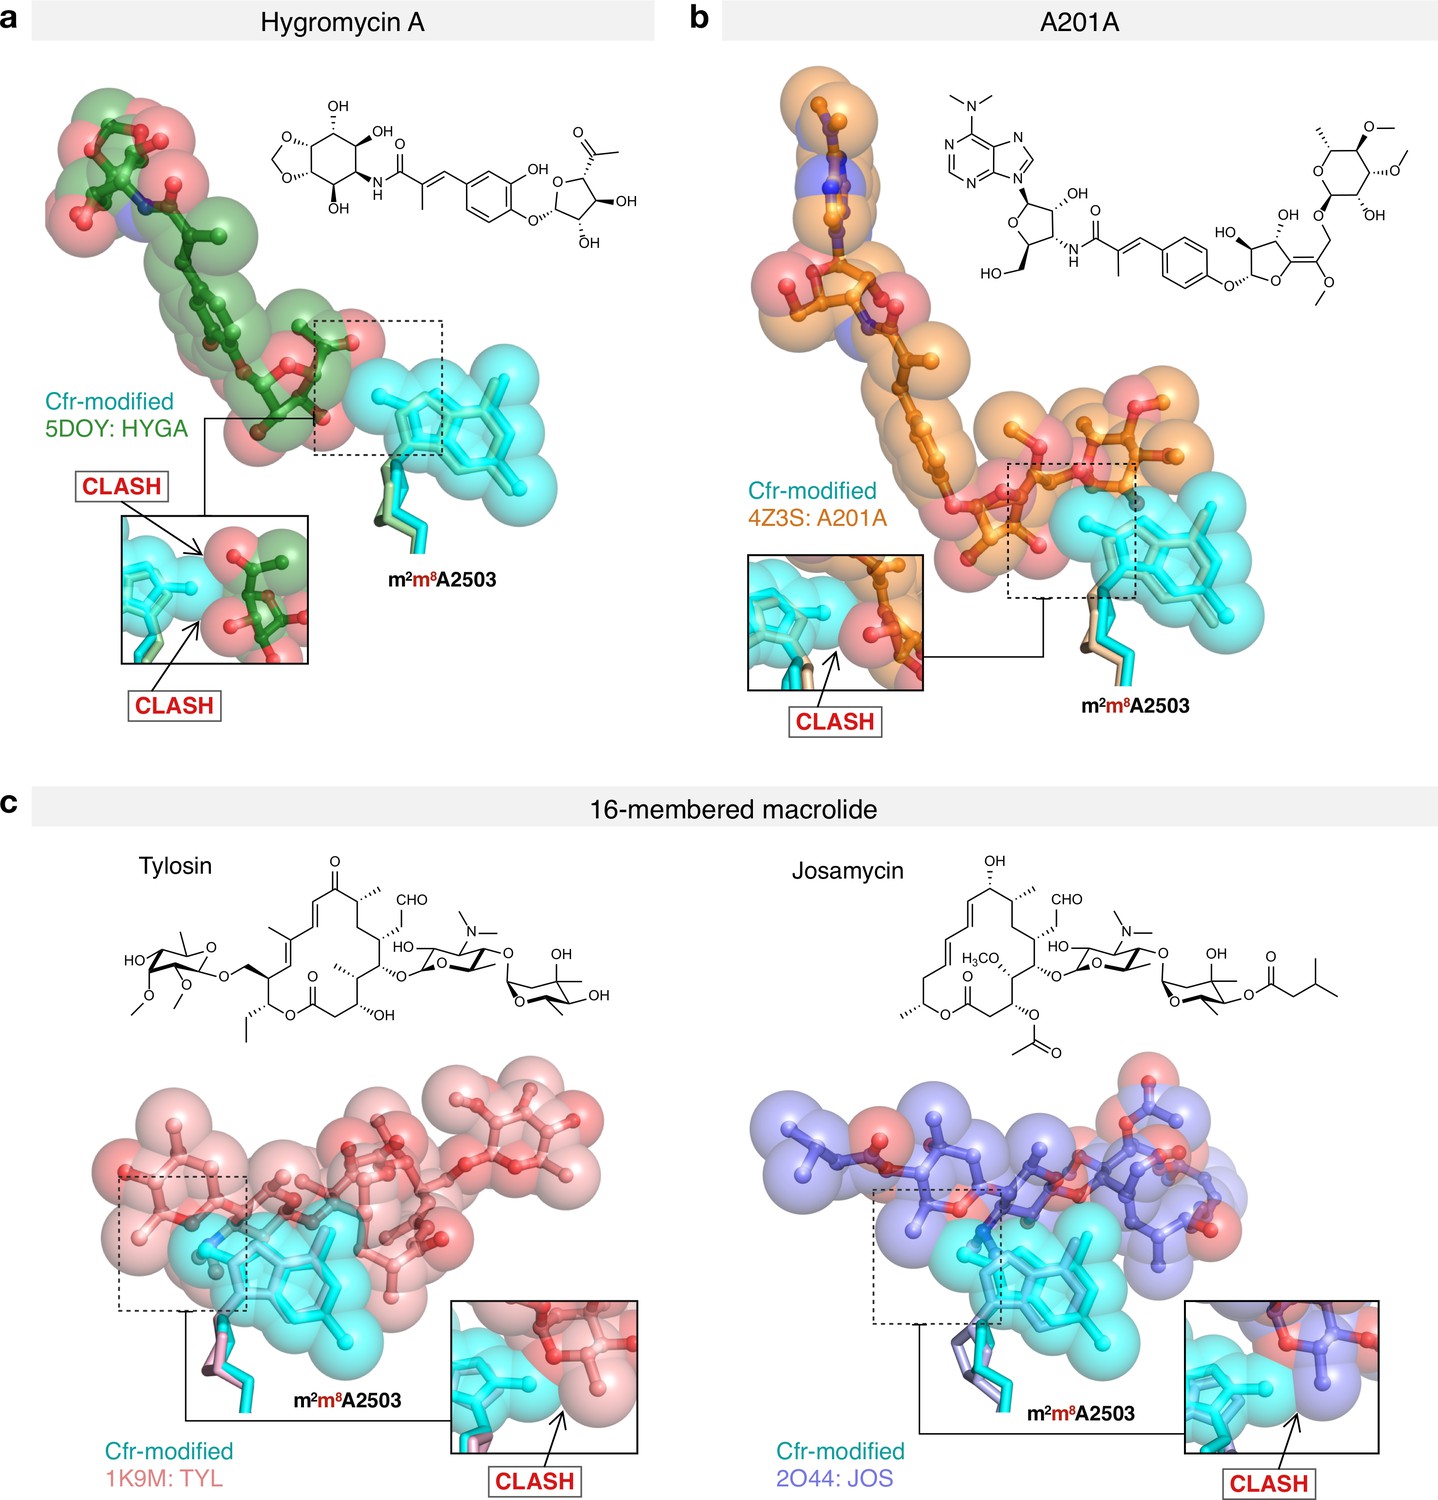
Molecular basis of Cfr-mediated resistance to hygromycin A, A201A, and 16-membered macrolide antibiotics.
Structural overlay of Cfr-modified Escherichia coli 50S ribosome (cyan) and ribosomes in complex with (a) hygromycin A (HYGA); PDB 5DOY, (b) nucleoside analog A201A; PDB 4Z3S, (c) 16-membered macrolides tylosin (TYL); PDB 1K9M and josamycin (JOS); PDB 2O44. Inserts are close-up views of the steric clashes between m8A2503 and corresponding PTC-targeting antibiotics. PTC, peptidyl transferase center.
Figure 6 with 1 supplement
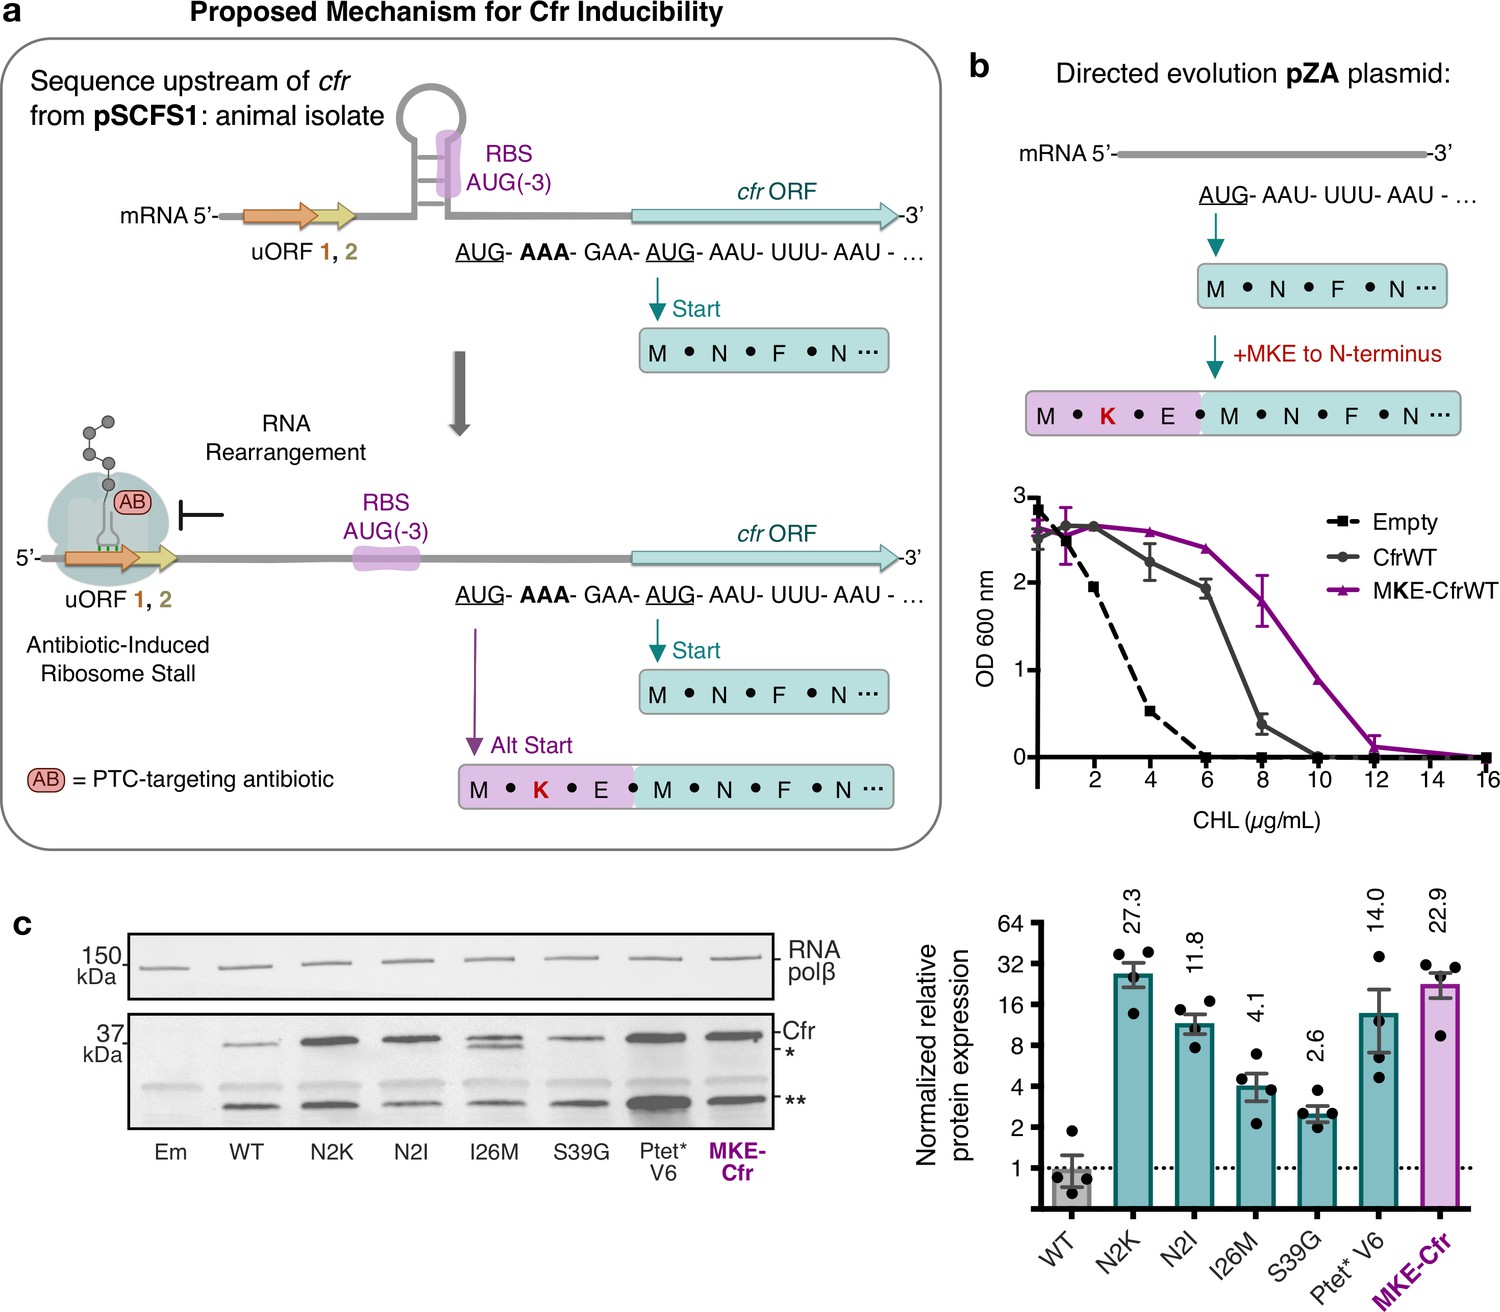
Start codon selection as a proposed mechanism of Cfr inducibility.
(a) Sequence upstream of cfr from pSCFS1 (Accession: AJ579365) resistance plasmid from an animal-derived Staphylococcus sciuri isolate. The upstream region contains two overlapping upstream ORFs (uORFs) followed by an RNA structural element. Proposed antibiotic-induced ribosome stalling at uORF1/2 and RNA rearrangement could reveal the occluded RBS, allowing translation to initiate at AUG(–3), adding an MKE polypeptide to the N-terminus of Cfr. (b) Addition of an N-terminal MKE peptide to Cfr in the context of the pZA plasmid where expression is controlled by the non-native tetracycline-inducible promoter, Ptet. Growth inhibition of Escherichia coli with pZA-encoded MKE-Cfr in the presence of CHL was determined from two biological replicates with standard error. (c) Relative protein expression of full-length MKE-Cfr compared to full-length CfrWT detected by immunoblotting against a C-terminal FLAG tag and quantification of top Cfr bands. Signal was normalized to housekeeping protein RNA polymerase β-subunit. Data are presented as the average of four biological replicates with standard deviation on a log2 axis. Em = empty vector control. Numerical data for figure panels are provided in Figure 6—source data 1.
-
Figure 6—source data 1
Numerical data.
- https://cdn.elifesciences.org/articles/70017/elife-70017-fig6-data1-v1.xlsx
-
Figure 6—source data 2
Blot images.
- https://cdn.elifesciences.org/articles/70017/elife-70017-fig6-data2-v1.zip
-
Figure 6—source data 3
Numerical data.
- https://cdn.elifesciences.org/articles/70017/elife-70017-fig6-data3-v1.xlsx
Figure 6—figure supplement 1

Investigations into Cfr translation start sites in the pSCFS1 sequence context.
(a) Schematic of the SCFS1_CfrWT construct which includes the upstream ORF sequence from pSCFS1 and native Pcfr promoter (Accession: AJ579365). Expression of CfrWT from Ptet compared to SCFS1_CfrWT and corresponding methionine mutants without inducer. Cfr protein products were detected by immunoblotting against the C-terminal FLAG tag. M(–3)I corresponds to AUG -> AUC mutation of the MKE upstream methionine; M1I corresponds to AUG -> AUC mutation of the annotated start site; M95L corresponds to AUG -> CUG mutation of the M95 internal start site. Mutation of the annotated start site M1I, but not the upstream start site M(–3)I, abolishes detectable expression of full-length Cfr. Asterisks denote the truncated Cfr product from internal translation initiation at M95 that does not contribute to resistance. Presented blot is representative of two biological replicates. Em = empty vector control. Original uncropped blot images are shown in Figure 6—source data 2. (b) Dose-dependent growth inhibition of Escherichia coli expressing SCFS1_CfrWT and corresponding methionine mutants toward chloramphenicol (CHL) determined from two biological replicates with standard error. Mutation of the annotated start site M1I, but not the upstream start site M(–3)I, impacts antibiotic resistance under these experimental conditions. Numerical data are provided in Figure 6—source data 3.
Author response image 1

pBSTNAV_tRNAAsn construct.
Author response image 2
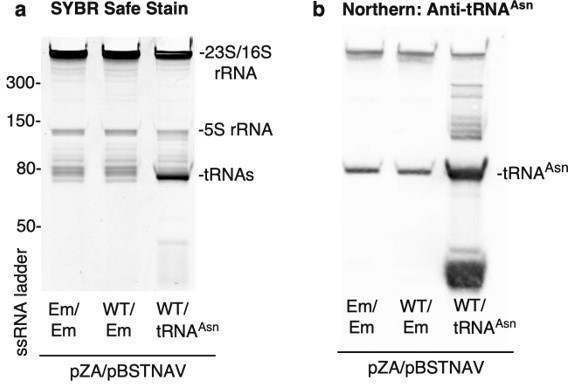
Confirmation of tRNAAsn overexpression.
Trizol-extracted total RNA was extracted from bacterial lysates and separated on a denaturing 10% acrylamide 8M TBE-Urea gel. Em = empty vector and WT = CfrWT-FLAG. (a) RNA was stained with SYBR-safe. (b) For detection of tRNAAsn by northern blot, RNA was transferred onto a Hybond N+ nylon membrane (GE Healthcare) and crosslinked to the membrane using a Stratalink 1800 UV Crosslinker. After blocking for 2.5 h at 40oC in hybridization buffer (250 mM sodium phosphate buffer-pH 7.0, 1 mM EDTA, 7% (w/v) SDS, 0.5% (w/v) BSA, 4 µg/mL salmon sperm DNA), the membrane was incubated with denatured tRNA probe overnight at 40oC in hybridization buffer. After washing the membrane 3 X 15 min in 1X SSC, 0.1% SDS, tRNAAsn was detected using the Thermo Chemiluminescent Nucleic Acid Detection Module following manufacturer’s instructions.
Author response image 3
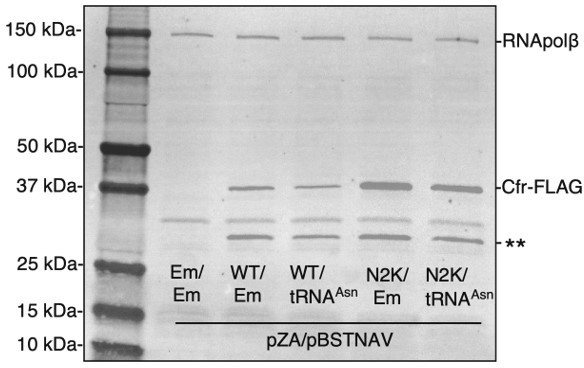
Overexpression of tRNAAsn decreases Cfr protein levels.
Cfr protein was detected by immunoblotting against the FLAG tag and RNA polymerase β subunit was used as the loading control. Em = empty vector, WT = CfrWT-FLAG, and N2K = CfrN2K-FLAG.
Author response image 4

Impact of antibiotics on expression of full-length and truncated Cfr protein.
E. coli BW25113 were transformed with pZA constructs containing either CfrWT expressed using the Ptet (WT) or native Pcfr promoter (SCFS1) and plated on LB agar plates containing selection antibiotic and either 0, 0.5, 1, or 2 µg/mL of chloramphenicol (CHL). Overnight cultures were diluted into fresh media containing the respective concentration of CHL and grown to mid-log phase. (a) Cfr protein levels were assessed by immunoblotting against a C-terminal FLAG tag. Asterisks denote the truncated Cfr product. Em = empty vector control. (b) Relative protein expression of full-length Cfr (teal) and the truncation corresponding to translation initiation at Met95 (yellow) compared to CfrWT expression with no CHL. Signal was normalized to housekeeping protein RNA polymerase β-subunit. (c) Minimum inhibitory concentration of CHL required to inhibit bacterial growth of E. coli BW25113 transformants that had been pre-incubated with either 0, 0.5, 1, or 2 µg/mL of CHL.
Author response image 5
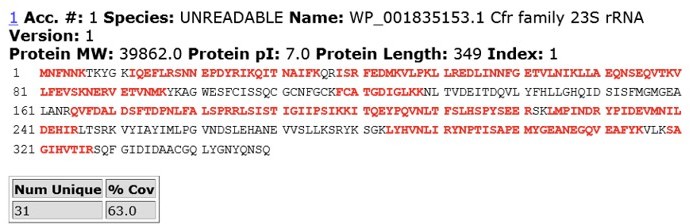
MS/MS peptide coverage for CfrWT.
Author response image 6
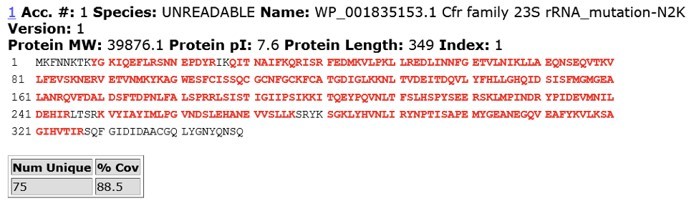
MS/MS peptide coverage for CfrV4.
Author response image 7
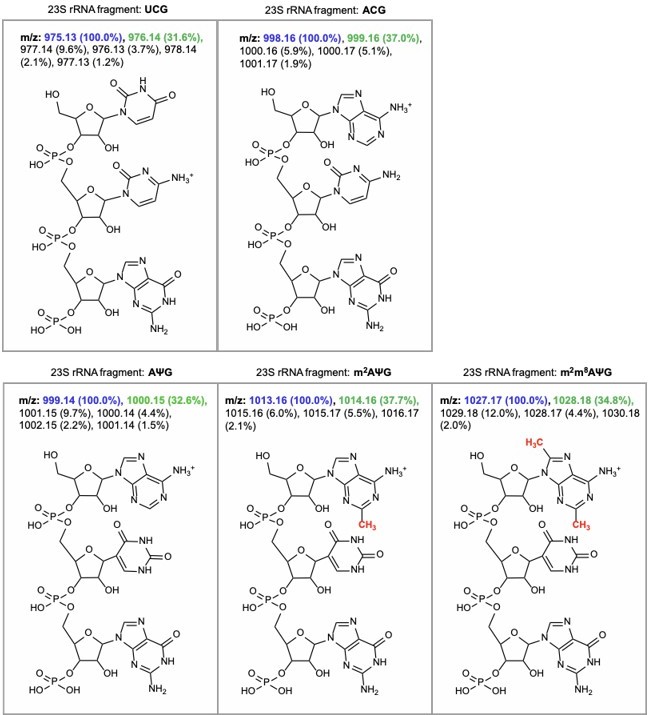
m/z predictions obtained from ChemDraw for rRNA fragments derived from oligo-protection MALDI-TOF mass spectrometry.
The predicted m/z and abundance for the mass + 1 isotope peak is labeled in green.
Author response image 8
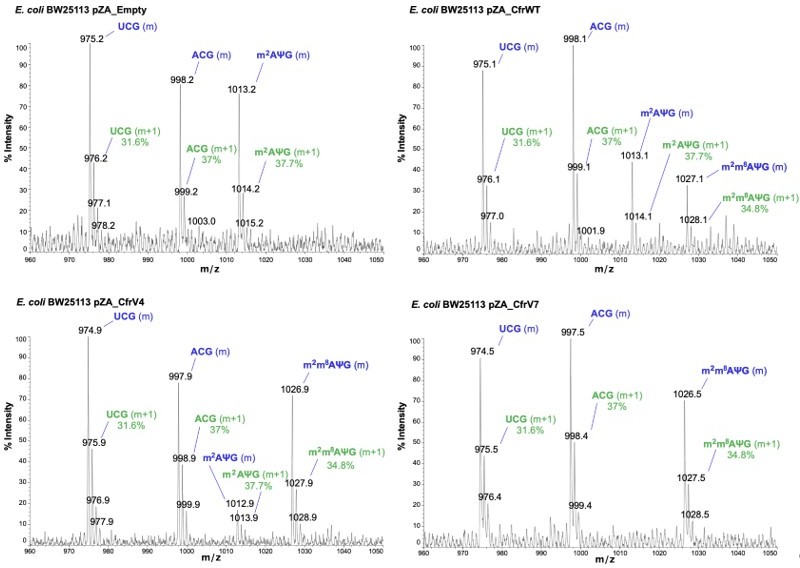
Annotated MALDI spectra for empty vector control, CfrWT/V4/V7.
The mass peak (m) is labeled in blue, while the isotope peak (m+1) and predicted relative abundance derived from ChemDraw is labeled in green.
Author response image 9
Author response image 10
Tables
Table 1
Cryo-EM data collection, refinement, and validation statistics.
| Data collection and processing | |
|---|---|
| Electron microscope | Krios |
| Magnification | 29,000 |
| Number of micrographs | 2055 |
| Number of particles picked from good micrographs | 162,713 |
| Number of particles used in final reconstruction | 141,549 |
| Pixel size (Å) | 0.822 |
| Defocus range (μm) | –0.2 to –1.5 |
| Voltage (kV) | 300 |
| Electron dose (e-/Å2) | 80 |
| Map refinement | |
| Model resolution (Å) | 2.2 |
| FSC threshold | 0.143 |
| Model resolution range (Å) | 2.2–20 |
| Map sharpening B-factor (Å2) | –55.86 |
| Refinement and model statistics | |
| Clashscore, all atoms | 2.23 |
| Protein geometry | |
| MolProbity score | 1.29 |
| Rotamer outliers (%) | 0.92 |
| Cβ deviations > 0.25 Å (%) | 0.32 |
| Ramachandran (%) | |
| - Favored | 95.79 |
| - Allowed | 4.01 |
| - Outliers | 0.2 |
| Deviations from ideal geometry | |
| - Bonds (%) | 0.03 |
| - Angles (%) | 0.08 |
| Nucleic acid geometry | |
| Probably wrong sugar puckers (%) | 0.84 |
| Bad backbone conformations (%) | 12.86 |
| Bad bonds (%) | 0.07 |
| Bad angles (%) | 0.08 |
Key resources table
| Reagent type (species) or resource | Designation | Source or reference | Identifiers | Additional information |
|---|---|---|---|---|
| Strain, strain background (E. coli) | ER2267 | Tawfik lab stock | ||
| Strain, strain background (E. coli) | BW25113 | Keio collection | ||
| Strain, strain background (E. coli) | BW25113 acrB::Kan | Keio collection | ||
| Strain, strain background (E. coli) | Rosetta2 BL21(DE3) pLysS | Novagen | ||
| Strain, strain background (E. coli) | MRE600 | ATCC | ||
| Gene(Staphylococcus aureus) | cfr gene | Accession: EF450709.1 | ||
| Gene(Staphylococcus sciuri) | Sequence upstream cfr gene | Genscript | Accession: AJ579365 | |
| Recombinant DNA reagent | pZA (plasmid) | Wellner et al., 2013; Stojković et al., 2016 | ||
| Recombinant DNA reagent | pET28a (plasmid) | Fujimori lab stock | ||
| Recombinant DNA reagent | pKK3535 (plasmid) | Fujimori lab stock | ||
| Chemical compound, drug | Anhydrotetracycline hydrochloride | Sigma-Aldrich | 37919 | |
| Chemical compound, drug | Tiamulin | Wako Chemicals | 328-34002 | |
| Chemical compound, drug | Clindamycin | TCI America | C2256 | |
| Chemical compound, drug | Chloramphenicol | Allstar Scientific | 480-045 | |
| Chemical compound, drug | Linezolid | Acros | 460592500 | |
| Chemical compound, drug | Hygromycin A | Dr. Kim Lewis | ||
| Chemical compound, drug | Trimethoprim | Sigma-Aldrich | 92131 | |
| Chemical compound, drug | [3H-methyl] S-adenosylmethionine | PerkinElmer | NET 155 H001MC | |
| Chemical compound, drug | Rifampicin | Sigma-Aldrich | R3501 | |
| Antibody | Anti-FLAG(mouse monoclonal) | Sigma-Aldrich | F3165 | 1:2000 |
| Antibody | Anti-RNA polymerase beta(rabbit monoclonal) | Abcam | ab191598 | 1:2000 |
| Antibody | Anti-rabbit IgG cross-absorbed DyLight 680 (goat polyclonal) | Thermo Fisher Scientific | 35567 | 1:10,000 |
| Antibody | Anti-mouse IgG cross-absorbed IRDye 800CW(goat polyclonal) | Abcam | ab216772 | 1:10,000 |
| Antibody | Anti-GAPDH(mouse monoclonal) | Abcam | ab125247 | 1:2000 |
| Sequence-based reagent | cfr | Integrated DNA Technologies | For RT-qPCR. The sequence of this oligonucleotide can be found in Supplementary file 1 | |
| Sequence-based reagent | recA | Integrated DNA Technologies | For RT-qPCR. The sequence of this oligonucleotide can be found in Supplementary file 1 | |
| Sequence-based reagent | luc | Integrated DNA Technologies | For RT-qPCR. The sequence of this oligonucleotide can be found in Supplementary file 1 | |
| Sequence-based reagent | Luciferase control RNA | Promega | L456A | Control RNA-spike in for polysome analysis |
| Commercial assay or kit | RNAprotect Bacteria Reagent | QIAGEN | 76506 | |
| Commercial assay or kit | RNeasy Mini Kit | QIAGEN | 74104 | |
| Commercial assay or kit | iScript cDNA Synthesis Kit | Bio-Rad | 170-8891 | |
| Commercial assay or kit | SsoAdvanced Universal SYBRGreen Supermix | Bio-Rad | 172-5721 | |
| Peptide, recombinant protein | RNaseT1 | Thermo Fisher Scientific | EN0541 | |
| Peptide, recombinant protein | RQ1 RNase-free DNase I | Promega | M610A | |
| Software, algorithm | Image Lab Software | Bio-Rad | ||
| Software, algorithm | MotionCor2 | Zheng et al., 2017 | ||
| Software, algorithm | GCTF | Zhang, 2016 | ||
| Software, algorithm | CryoSPARC v2.0 | Punjani et al., 2017 | ||
| Software, algorithm | Relion 3.0 | Scheres, 2012 | ||
| Software, algorithm | cisTEM | Grant et al., 2018 | ||
| Software, algorithm | Sharpen3D | Grant et al., 2018 | ||
| Software, algorithm | PHENIX | Adams et al., 2010 | ||
| Software, algorithm | eLBOW | Moriarty et al., 2009 | ||
| Software, algorithm | MolProbity | Chen et al., 2010 | ||
| Software, algorithm | Pymol Molecular Graphics System | Schrödinger, LLC | Version 2.4.1 |
Additional files
-
Transparent reporting form
- https://cdn.elifesciences.org/articles/70017/elife-70017-transrepform1-v1.docx
-
Supplementary file 1
Primer sequences, directed evolution mutants, and MIC values for FLAG constructs.
- https://cdn.elifesciences.org/articles/70017/elife-70017-supp1-v1.pdf
Download links
A two-part list of links to download the article, or parts of the article, in various formats.
Downloads (link to download the article as PDF)
Open citations (links to open the citations from this article in various online reference manager services)
Cite this article (links to download the citations from this article in formats compatible with various reference manager tools)
Directed evolution of the rRNA methylating enzyme Cfr reveals molecular basis of antibiotic resistance
eLife 11:e70017.
https://doi.org/10.7554/eLife.70017


