NMNAT promotes glioma growth through regulating post-translational modifications of P53 to inhibit apoptosis
- School of Pharmacy, Key Laboratory of Molecular Pharmacology and Drug Evaluation (Yantai University), Ministry of Education, Collaborative Innovation Center of Advanced Drug Delivery System and Biotech Drugs in Universities of Shandong, Yantai University, China
- Department of Molecular and Cellular Pharmacology, University of Miami Miller School of Medicine, United States
- Department of Radiation Oncology, University of Miami Miller School of Medicine, United States
- Sylvester Comprehensive Cancer Center, United States
Figures
Figure 1 with 1 supplement
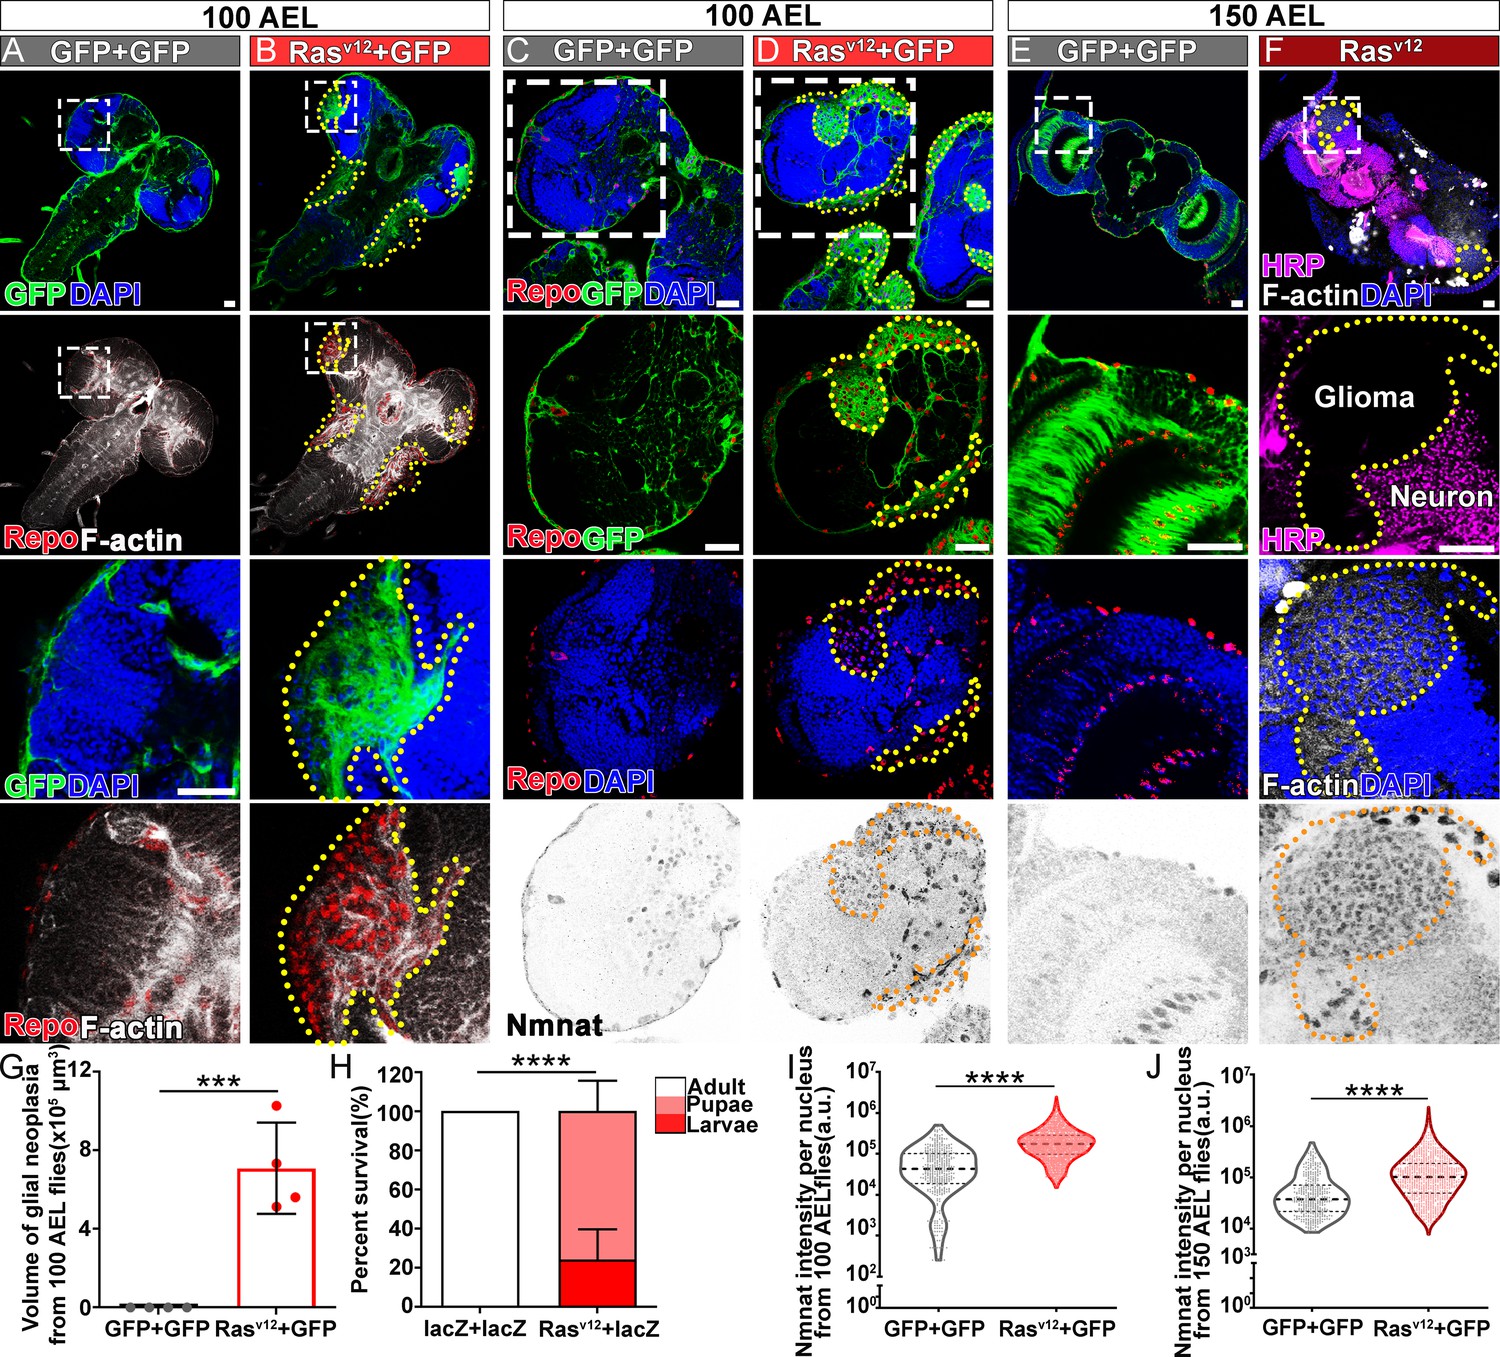
NMNAT is upregulated in Rasv12-induced glial neoplasia in Drosophila.
(A, B) Larval CNS at 100 AEL with glial expression of GFP+ GFP or Rasv12+ GFP was probed for F-actin (white), Repo (red), and DAPI (blue). The yellow dashed lines mark the boundary of glial neoplasia. The third and fourth rows show the boxed area of the first and second rows. (C–F) Larval CNS at 100 (C, D) and 150 (E, F) AEL. The second to fourth rows show the boxed areas in the first row. (C–E) Brains were probed for Nmnat (gray), Repo (red), and DAPI (blue). (F) Brains were probed for HRP (magenta), Nmnat (gray), F-actin (white), and DAPI (blue). Yellow dashed lines mark the glial neoplasia boundaries. (G) Quantification of the total glial neoplasia volumes in each fly. Data are presented as mean ± s.d., n=4. Significance level was established by one-way ANOVA post hoc Bonferroni test. (H) Survival rate. Data are presented as mean ± s.d., n≥3. Significance level was established by Chi-square test. (I–J) Nmnat intensity at 100 and 150 AEL. Data are presented as median ± quartiles, n≥3. Significance level was established by one-way ANOVA post hoc Bonferroni test. ***p≤0.001; ****p≤0.0001. Scale bars, 30 µm. AEL, after egg laying; CNS, central nervous system; NMNAT, nicotinamide mononucleotide adenylyltransferase.
Figure 1—figure supplement 1
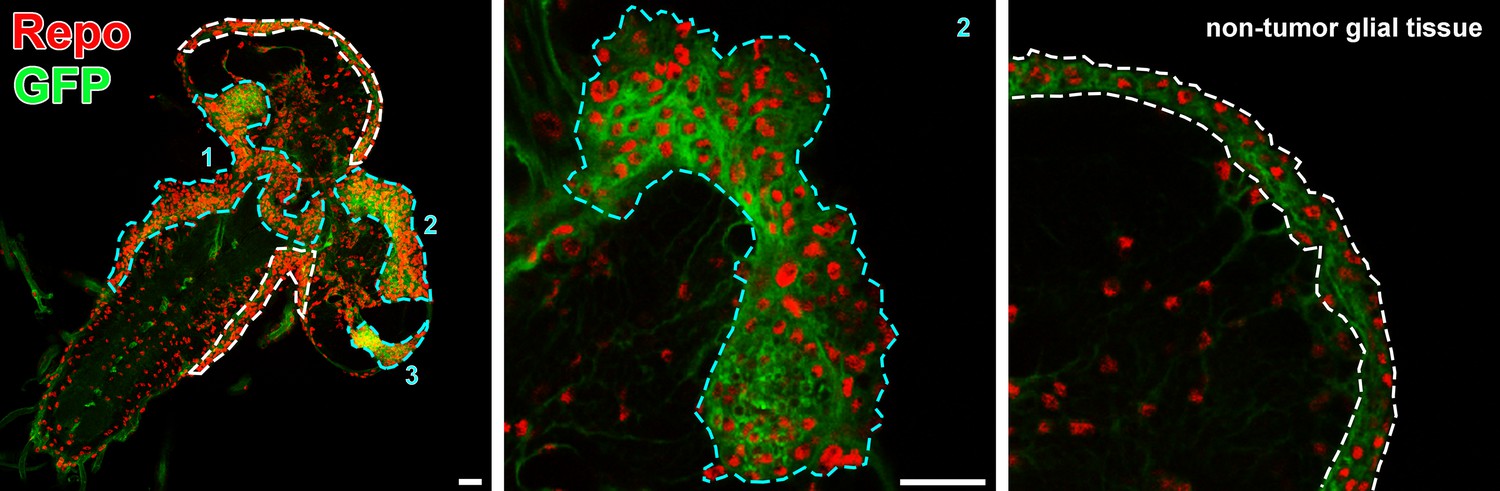
Glial neoplasia tissue area in Drosophila larval CNS.
The Drosophila larval CNS with glial expression of Rasv12+ GFP (green) was probed for Repo (red). The glial neoplasia tissue and non-tumor glial area are marked with cyan and white dashed lines, respectively. Scale bars, 30 µm. CNS, central nervous system.
Figure 2 with 3 supplements

NMNAT is required for glial neoplasia growth in Drosophila.
(A, B) Larval CNS at 100 AEL with glial expression of Rasv12+lacZ, Rasv12+NmnatRNAi, lacZ+Rasv12, PC+Rasv12, PCWR+Rasv12, and PD+Rasv12 was probed for F-actin (green), Repo (red), DAPI (blue), and Nmnat (gray). Each individual glial neoplasia is marked with dashed lines and numbered. The second and third rows show the high magnification of glial neoplasia areas in the first row. Scale bars, 30 µm. (C) Quantification of glial neoplasia volume in each fly. Data are presented as mean ± s.d., n≥7. Significance level was established by one-way ANOVA post hoc Bonferroni test. (D) Quantification of glial neoplasia number in each fly. Data are presented as mean ± s.d., n≥7. Significance level was established by one-way ANOVA post hoc Bonferroni test. (E) Survival rate of flies with glial expression of Rasv12 together with lacZ, PC, PCWR, or PD. Data are presented as mean ± s.d., n≥3. Significance level was established by chi-square test. *p≤0.05; **p≤0.01; ***p≤0.001; ****p≤0.0001. AEL, after egg laying; NMNAT, nicotinamide mononucleotide adenylyltransferase.
Figure 2—figure supplement 1

NMNAT expression is lower in NmnatRNAi fly than wild-type control fly.
Quantification of NMNAT intensity in glial cells or glial neoplasia area. Flies were expressing lacZ+lacZ or Rasv12+NmnatRNAi. Data are presented as median ± quartiles, n≥3. Significance level was established by one-way ANOVA post hoc Bonferroni test. ****p≤0.0001. NMNAT, nicotinamide mononucleotide adenylyltransferase.
Figure 2—figure supplement 2
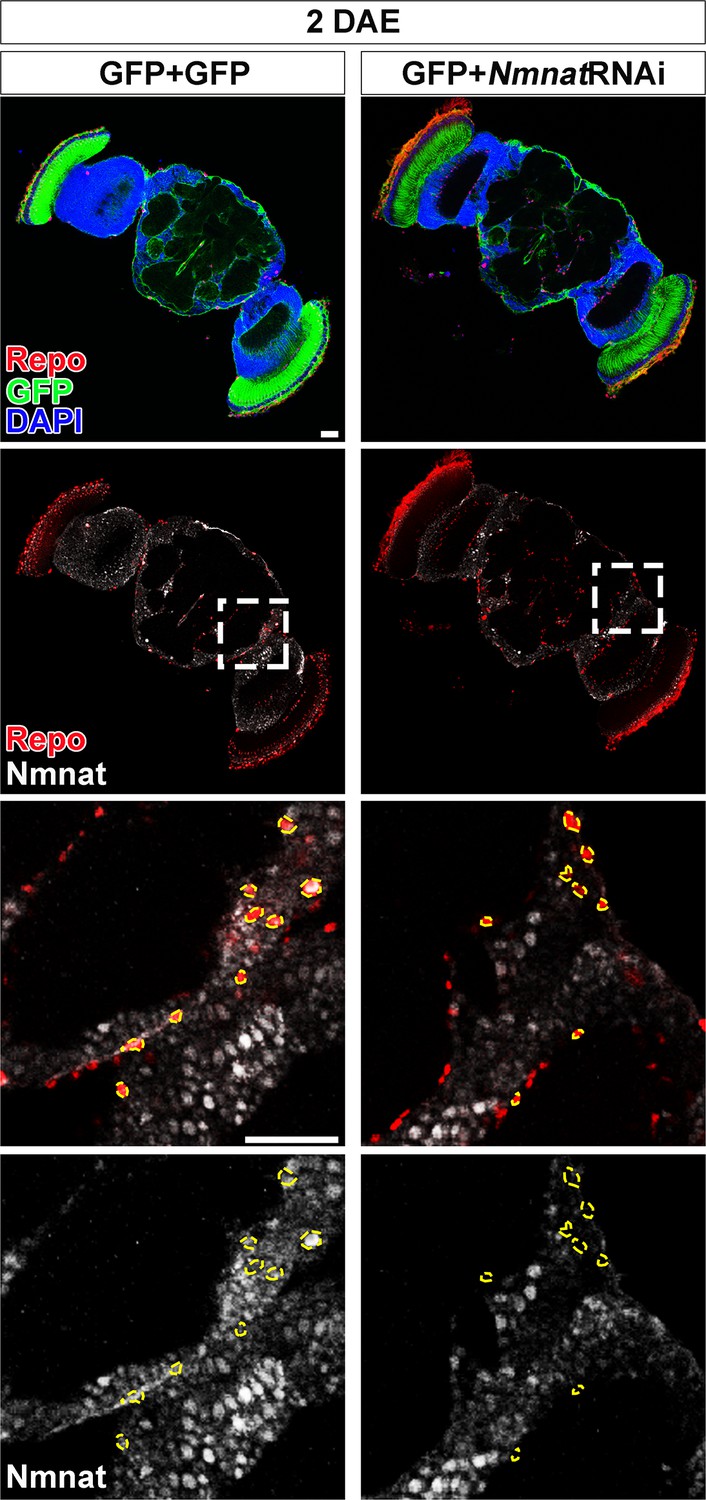
NMNAT downregulation in glial cells does not affect brain morphology in adult fly.
Brains of two DAE flies with glial expression of GFP+GFP or GFP+NmnatRNAi were probed for Repo (red), Nmnat (white), and DAPI (blue). The third and fourth rows are high magnification of the boxed areas in the second row. Scale bars, 30 µm. NMNAT, nicotinamide mononucleotide adenylyltransferase.
Figure 2—figure supplement 3
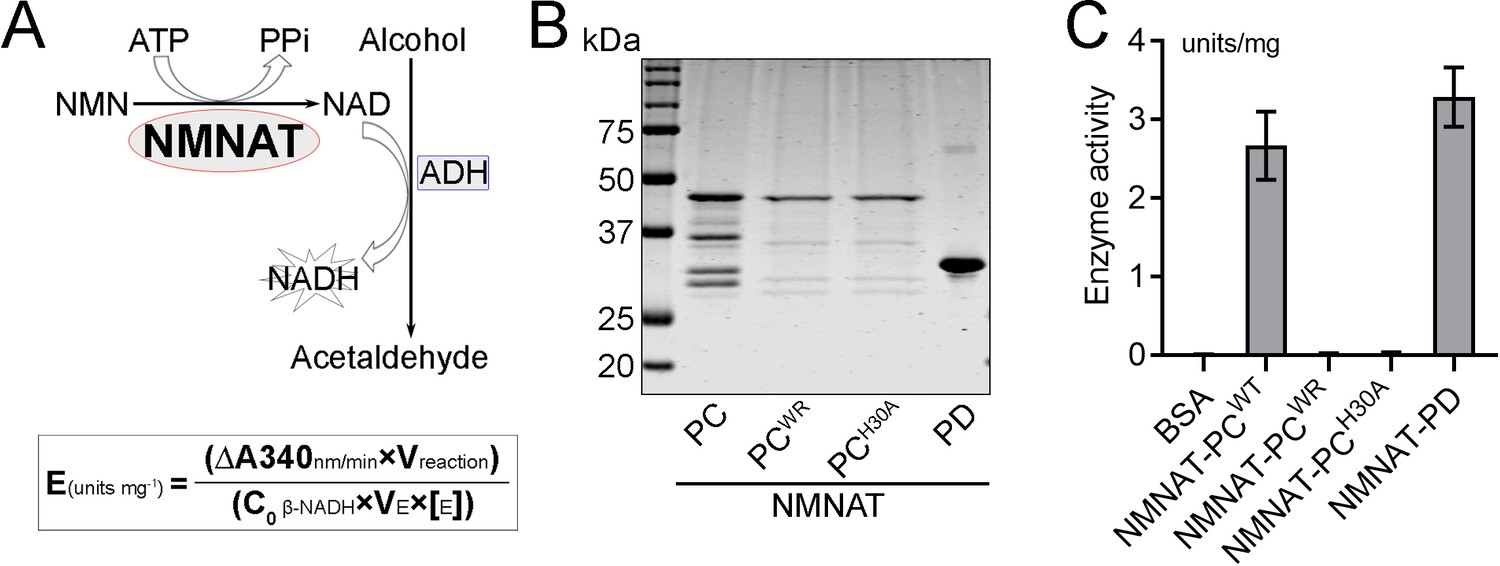
NMNAT-PCWR has no NAD+ synthesis enzyme activity.
(A) Diagram of the continuous coupled enzyme assay where NAD+ synthesized by NMNAT is reduced to NADH by alcohol dehydrogenase (ADH). The production of NADH is measured by absorbance at 340 nm. NMNAT activity (units per milligram of recombinant protein) is calculated from the linear progression curve by the formula at the bottom, where Coβ-NADH, the extinction coefficient of β-NADH at 340 nm, is 6.22. (B, C) NAD+ synthesis activity of recombinant NMNAT-PCWT, NMNAT-PCWR, NMNAT-PCHA, and NMNAT-PD (B) was measured by the continuous coupling assay as shown in (A). Bovine serum albumin (BSA) was used as a negative control. Data are presented as mean ± s.d., n=4. NMNAT, nicotinamide mononucleotide adenylyltransferase.
Figure 3 with 3 supplements
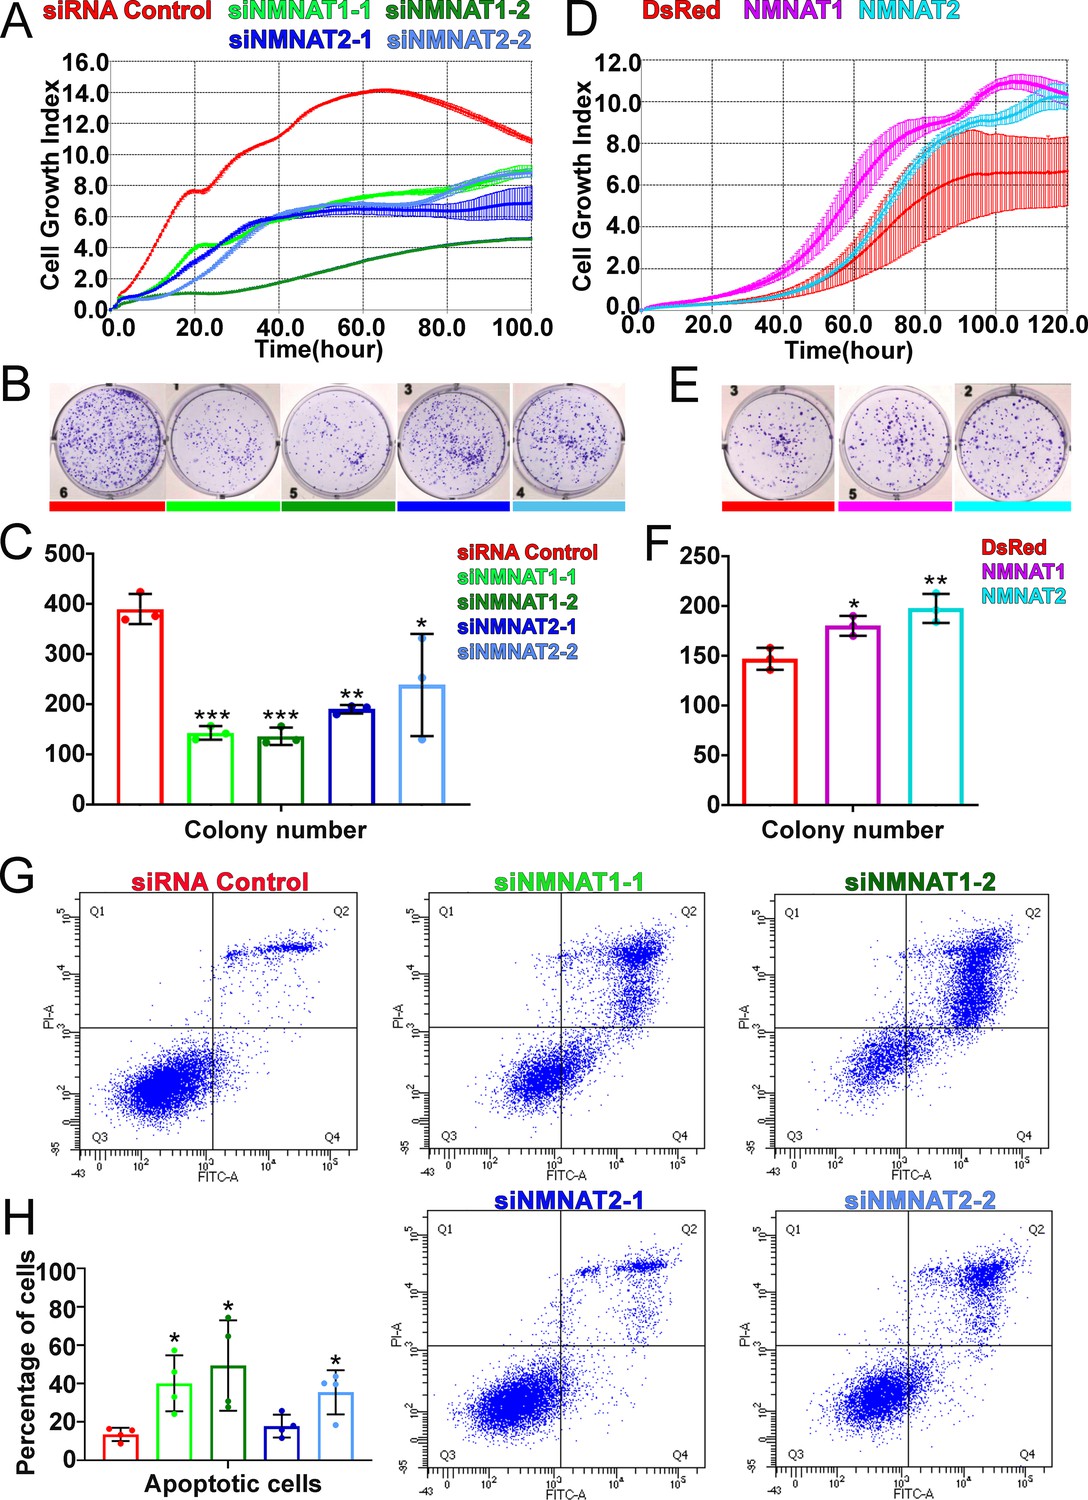
NMNAT expression is essential to the proliferation of human GBM cells.
(A, D) The xCELLigence real-time cell analysis assay was used to monitor the growth index of T98G cells after NMNAT knockdown by transfecting siNMNAT1 or siNMNAT2, or after NMNAT overexpression by transfecting NMNAT1 or NMNAT2 plasmid. Cells transfected with siRNA control or DsRed were used as controls. (B, E) Colony formation assay was used to measure the colony formation capabilities of T98G cells after NMNAT knockdown by transfecting siNMNAT1 or siNMNAT2, or after NMNAT overexpression by transfecting NMNAT1 or NMNAT2. Cells transfected with siRNA control or DsRed were used as controls. (C, F) Quantification of the colony number in (B, E). Data are presented as mean ± s.d. n=3. Significance level was established by one-way ANOVA post hoc Bonferroni test. (G) T98G cell apoptosis was detected by flow cytometry after NMNAT knockdown. (H) Quantification of apoptotic cells rate of siRNA control, siNMNAT1-1, siNMNAT1-2, siNMNAT2-1, and siNMNAT2-2. The sum of Q2 and Q4 was quantified as apoptotic cells. Data are presented as mean ± s.d. n=4. Significance level was established by t-test. *p≤0.05; **p≤0.01; ***p≤ 0.001. GBM, glioblastoma multiforme; NMNAT, nicotinamide mononucleotide adenylyltransferase.
-
Figure 3—source data 1
siRNA sequences for NMNAT1/2 knockdown and primer sequences for PCR.
- https://cdn.elifesciences.org/articles/70046/elife-70046-fig3-data1-v1.doc
Figure 3—figure supplement 1
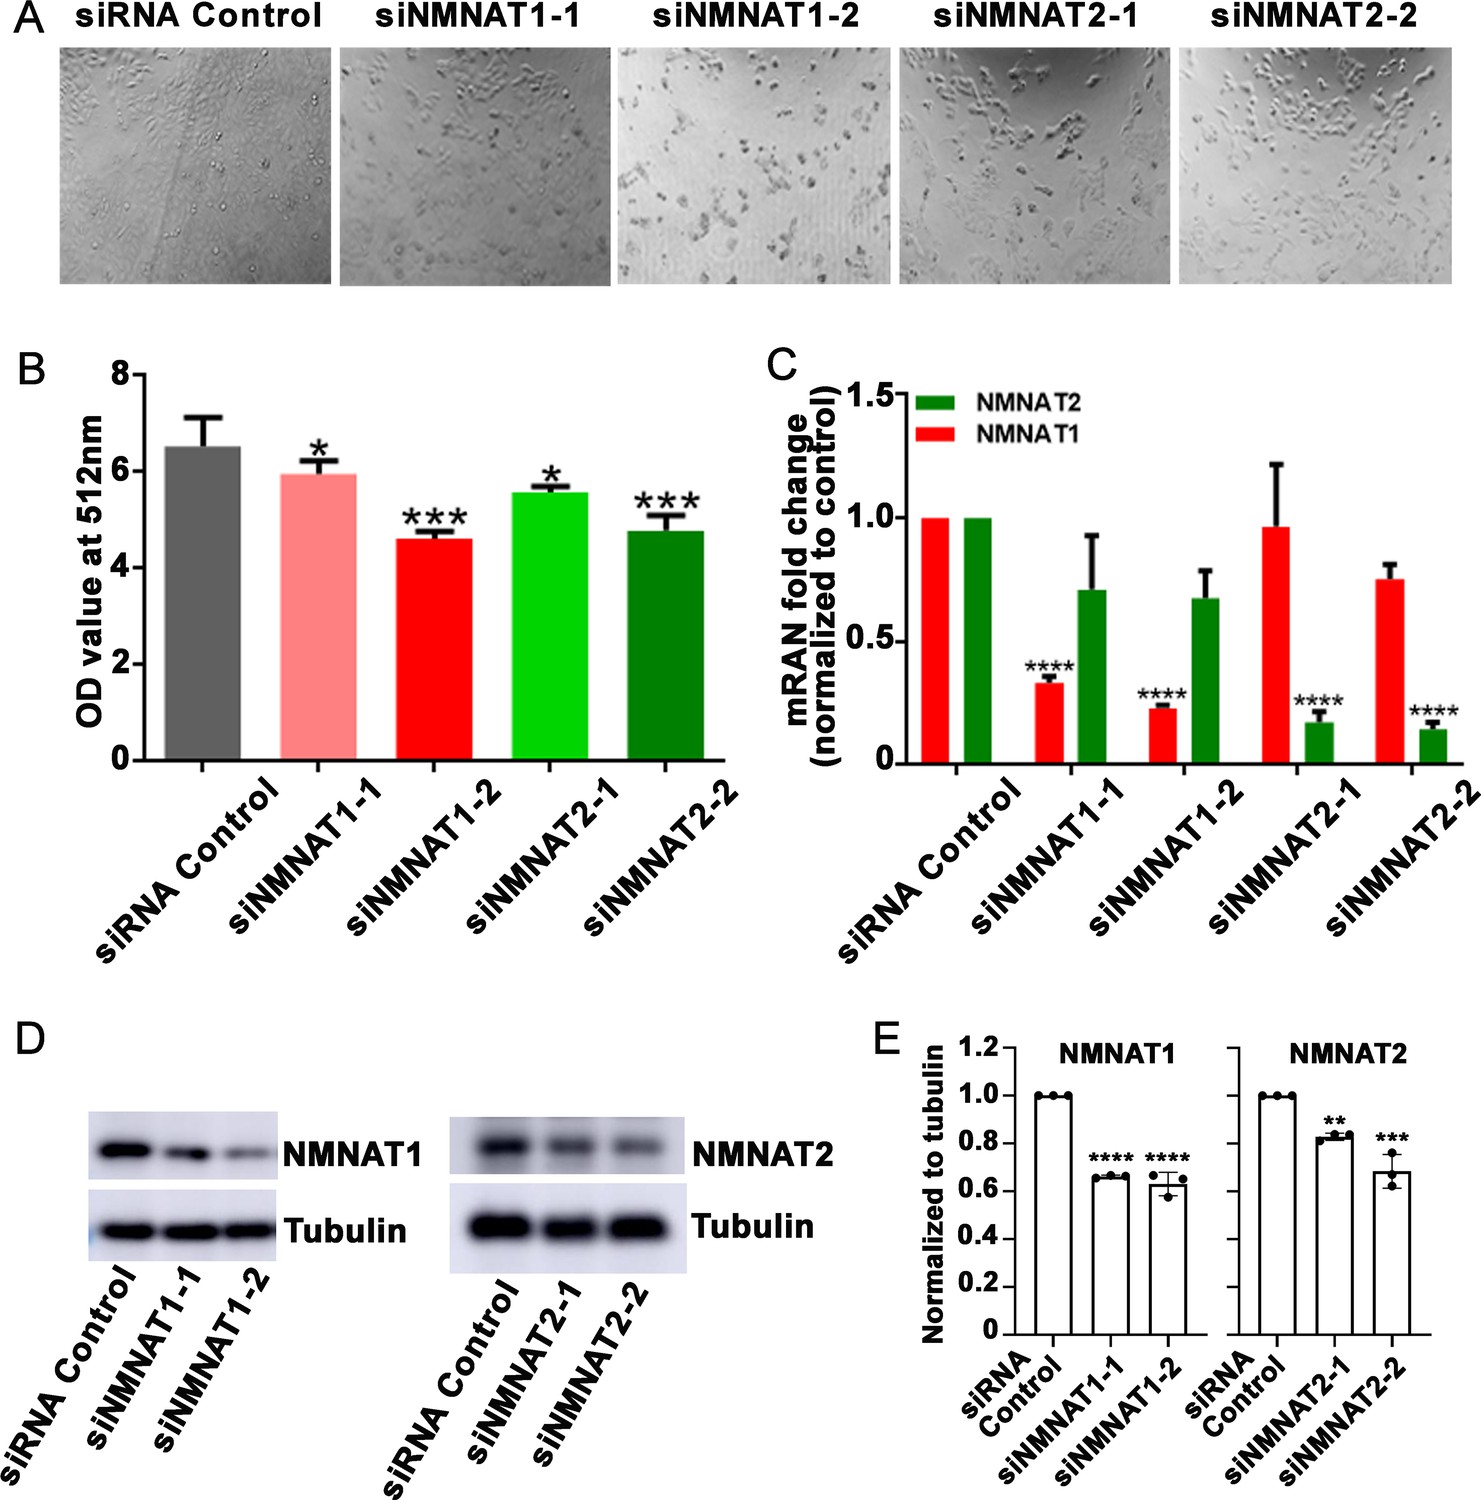
T98G cells viability is inhibited after knockdown NMNAT1 or NMNAT2.
(A) The confluency of T98G cells is decreased after transfected with siNMNAT1 or siNMNAT2 96 hr. (B) Cell viability 96 hr after transfection was measured by an MTT assay. Data are presented as mean ± s.d., n≥3. Significance level was established by one-way ANOVA post hoc Bonferroni test. (C) NMNAT1 and NMNAT2 transcript levels after siRNA transfection 72 hr. Data are normalized to siRNA control group. (D, E) NMNAT1 and NMNAT2 protein levels siRNA transfection 72 hr and quantification. Data are presented as mean ± s.d., n≥3. Significance level was established by one-way ANOVA post hoc Bonferroni test. *p≤0.05; **p≤0.01; ***p≤0.001; ****p≤0.0001.
-
Figure 3—figure supplement 1—source data 1
T98G cell viability was inhibited after knockdown NMNAT1 or NMNAT2.
- https://cdn.elifesciences.org/articles/70046/elife-70046-fig3-figsupp1-data1-v1.doc
Figure 3—figure supplement 2
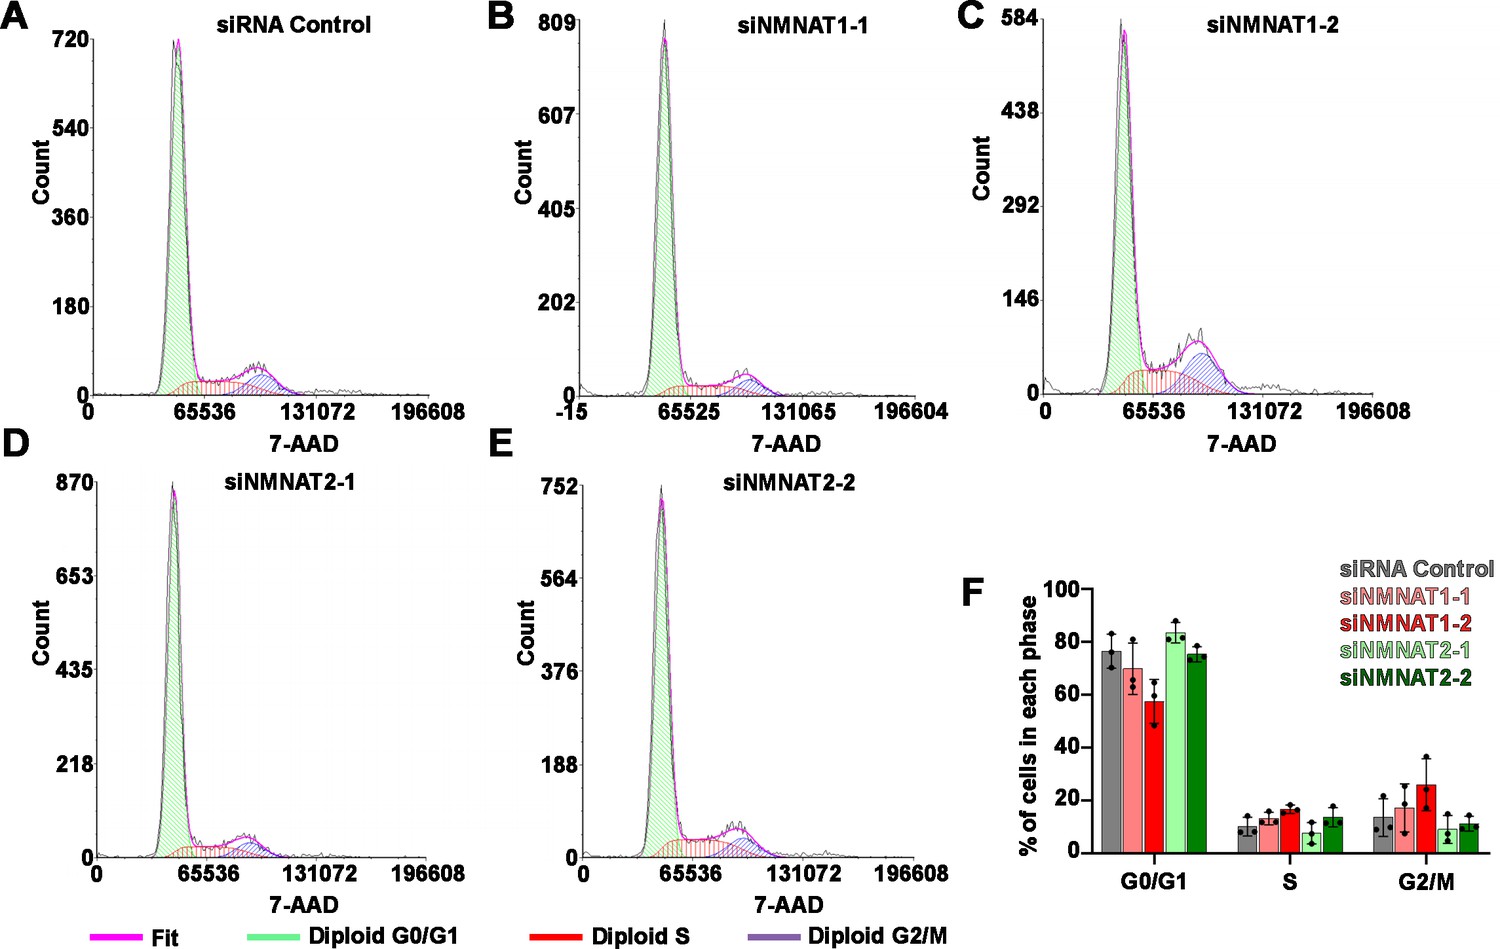
Knockdown of NMNAT does not affect cell cycle.
(A–E) Cell cycle was detected by flow cytometry after T98G cells was transfected with siRNA Control, siNMNAT1-1, siNMNAT1-2, siNMNAT2-1, and siNMNAT2-2, respectively. (F) Quantification of cells in each cell cycle phase. Data are presented as mean ± s.d., n=3. Significance level was established by one-way ANOVA post hoc Bonferroni test. NMNAT, nicotinamide mononucleotide adenylyltransferase.
Figure 3—figure supplement 3

NMNAT protein is upregulated in human glioma cells.
SVG p12 is human glial cells. T98G and U87MG are human glioma cells. Proteins were extracted from cells were probed for NMNAT1, NMNAT2, and β-actin and quantification. NMNAT2 overexpression from U87MG cells was used as positive control. Data are presented as mean ± s.d., n=3. Significance level was established by t-test. *p≤0.05; **p≤0.01; ***p≤0.001. NMNAT, nicotinamide mononucleotide adenylyltransferase.
-
Figure 3—figure supplement 3—source data 1
NMNAT protein was upregulated in human glioma cells.
- https://cdn.elifesciences.org/articles/70046/elife-70046-fig3-figsupp3-data1-v1.doc
Figure 4 with 1 supplement
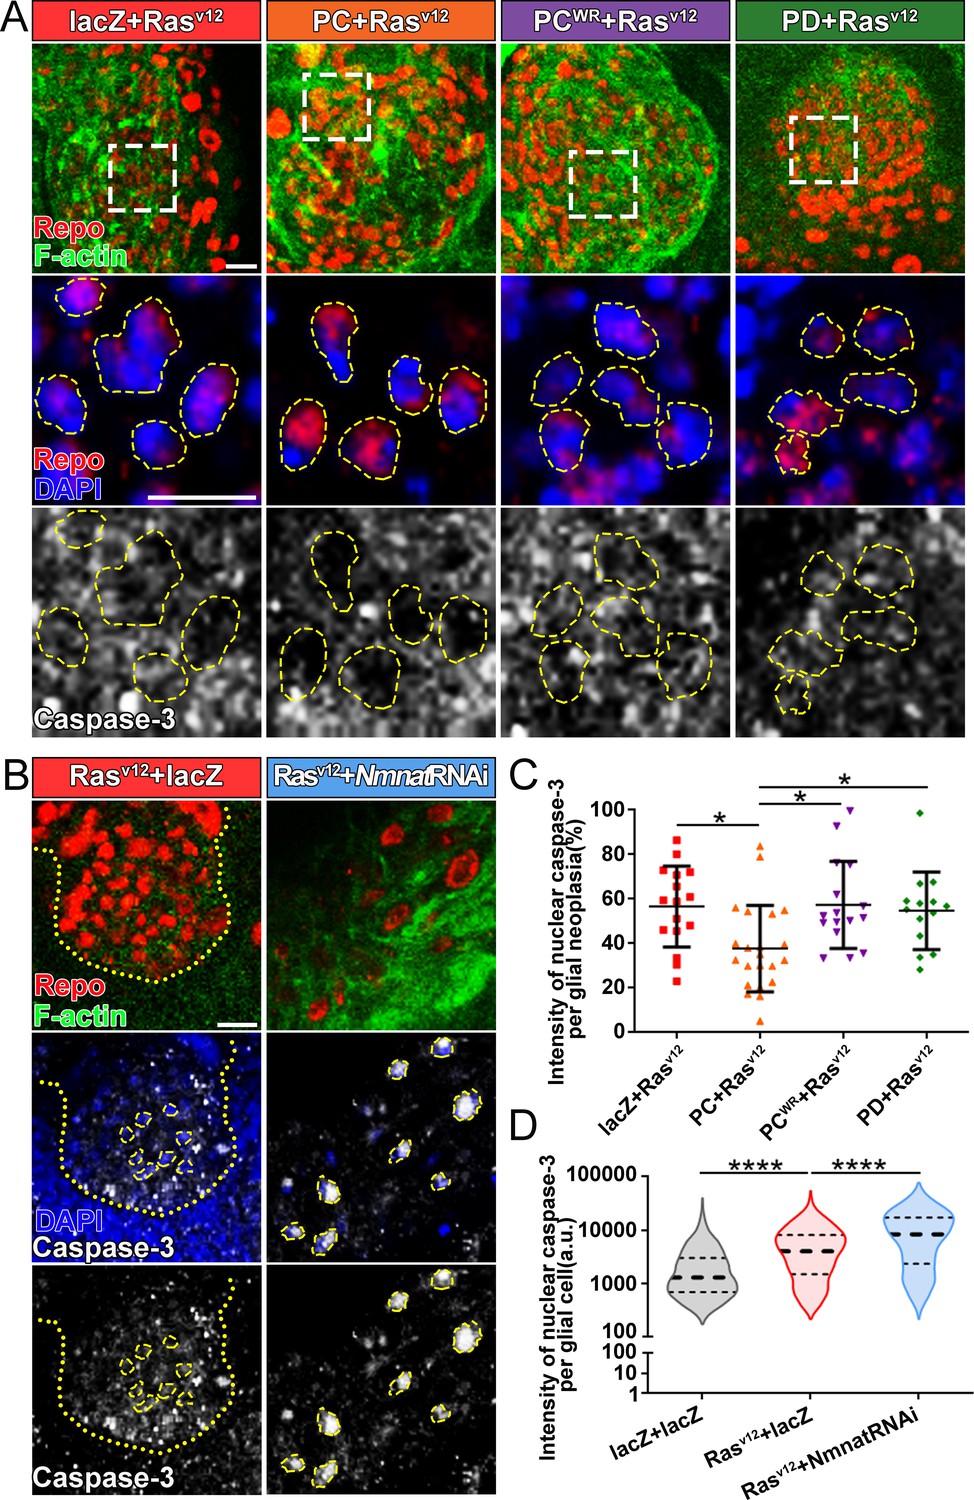
Overexpression of NMNAT decreases caspase-3 activation in glial neoplasia.
(A) Glial neoplasia from files expressing lacZ, PC, PCWR, or PD were probed for Repo (red), F-actin (green), DAPI (blue), and caspase-3 (gray). The top row shows the whole glial neoplasia area. The second and third rows are the high magnification of the boxed areas in the first row. Yellow dashed lines indicate the nuclear area. (B) Glial neoplasia from flies expressing lacZ or Nmnat RNAi were probed for Repo (red), F-actin (green), DAPI (blue), and caspase-3 (gray). Yellow dot lines indicate glial neoplasia boundary in the Rasv12+lacZ group. Yellow dashed lines indicate the boundaries of the nucleus and cytoplasm. Scale bars, 10 µm. (C) Quantification of the percentage of nuclear caspase-3 intensity per glial neoplasia. Data are presented as mean ± s.d. n≥3. Significance level was established by one-way ANOVA post hoc Bonferroni test. (D) Quantification of the nuclear caspase-3 per glial cell. Data are presented as median ± quartiles, n≥3. Significance level was established by one-way ANOVA post hoc Bonferroni test. *p≤0.05. ****p≤0.0001. NMNAT, nicotinamide mononucleotide adenylyltransferase.
Figure 4—figure supplement 1

Blocking caspase pathway in Rasv12 overexpressing fly.
(A) Diagram of caspase pathway in mammalian and Drosophila. (B) Flies with Rasv12+lacZ, Rasv12+Diap1, Rasv12+p35, Rasv12+DCP1 RNAi, and Rasv12+DroncRNAi were probed for Repo (green) and F-actin (red). (C) Quantification of ratio of glial neoplasia volume in CNS. Data are presented as mean ± s.d., n>3. Significance level was established by t-test. *p≤0.05. CNS, central nervous system.
Figure 5 with 2 supplements
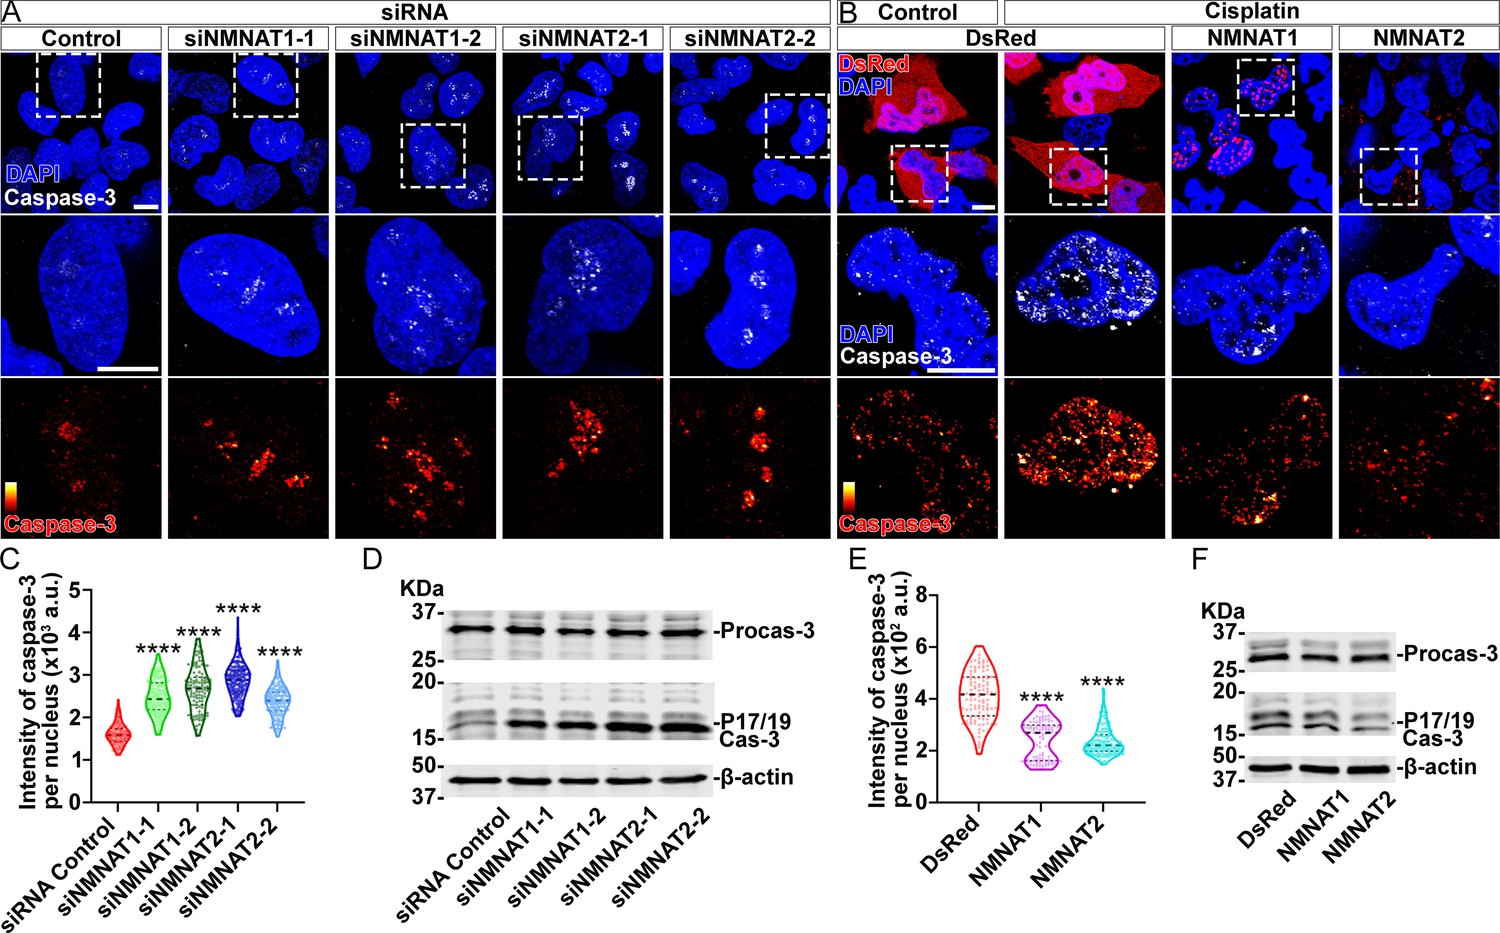
NMNAT decreases caspase-3 activation in human glioma cells.
(A) T98G cells were transfected with siNMNAT1 or siNMNAT2 and stained with DAPI (blue) and caspase-3 (white). (B) T98G cells were transfected with DsRed (red), DsRed-NMNAT1 (red), or DsRed-NMNAT2 (red), treated with cisplatin 8 hr after transfection, and stained with DAPI (blue) and caspase-3 (gray). The second and third rows are the high magnification of the boxed areas in the first row. In the third row, the intensity of caspase-3 is indicated by a heatmap (0–4095). Scale bars, 10 µm. (C) Quantification of nuclear caspase-3 intensity in (A). Data are presented as median ± quartiles, n≥100. Significance level was established by one-way ANOVA post hoc Bonferroni test. (E) Quantification of nuclear caspase-3 intensity in (B). Data are presented as median ± quartiles, n≥100. Significance level was established by one-way ANOVA post hoc Bonferroni test. (D, F) Proteins were extracted from T98G cells transfected with siRNA (D), plasmids and treated with cisplatin for 8 hr (F) for Western blot analysis. P17/19 was considered as cleaved caspase-3. β-actin was used as an internal control. ****p≤0.0001. NMNAT, nicotinamide mononucleotide adenylyltransferase.
-
Figure 5—source data 1
NMNAT decreased caspase-3 activation in human glioma cells.
- https://cdn.elifesciences.org/articles/70046/elife-70046-fig5-data1-v1.doc
Figure 5—figure supplement 1
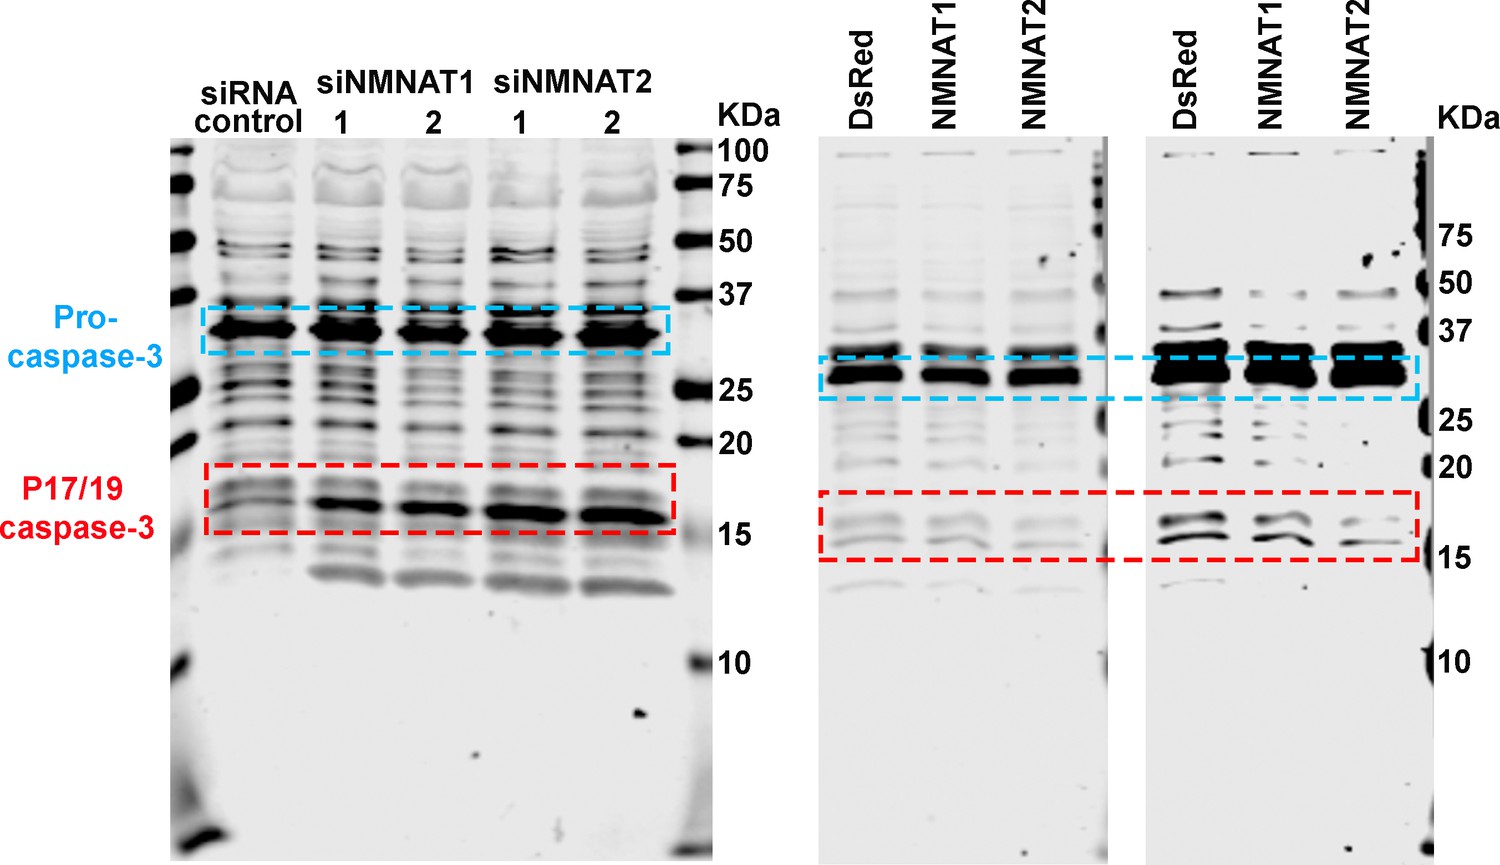
Membrane of Western blot analysis.
Proteins were extracted from T98G cells transfected with siRNA (left), or plasmids and treated with cisplatin for 8 hr (right) for Western blot analysis. P32 was considered as pro-caspase-3. P17/19 was considered as cleaved caspase-3.
Figure 5—figure supplement 2
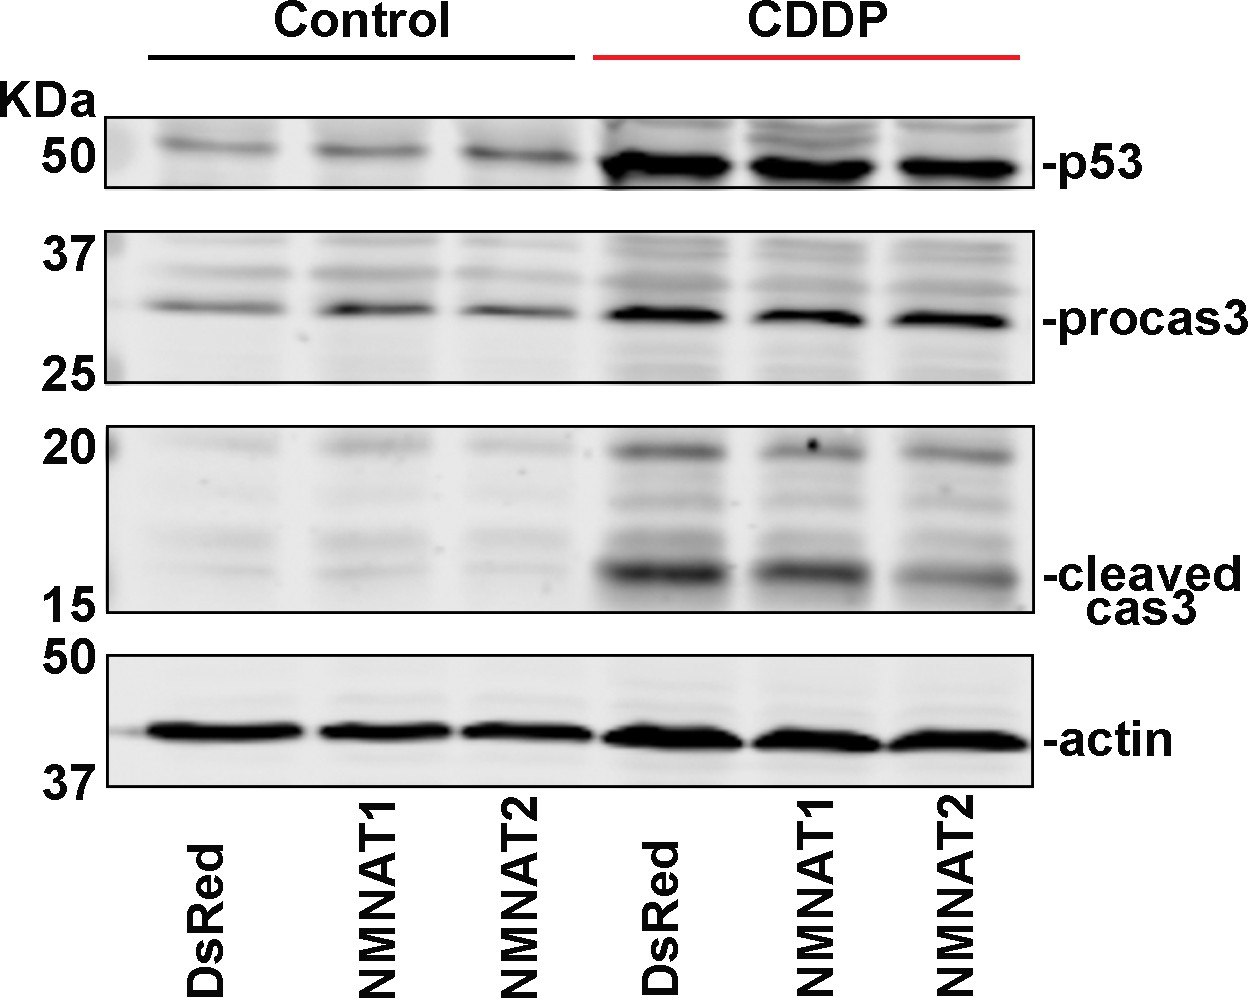
Cleaved caspase-3 is reduced after NMNAT overexpression.
U87MG cells were treated with CDDP and probed for p53, caspase-3, and β-actin. NMNAT, nicotinamide mononucleotide adenylyltransferase.
-
Figure 5—figure supplement 2—source data 1
Cleaved Ccaspase-3 was reduced after NMNAT overexpression.
- https://cdn.elifesciences.org/articles/70046/elife-70046-fig5-figsupp2-data1-v1.doc
Figure 6
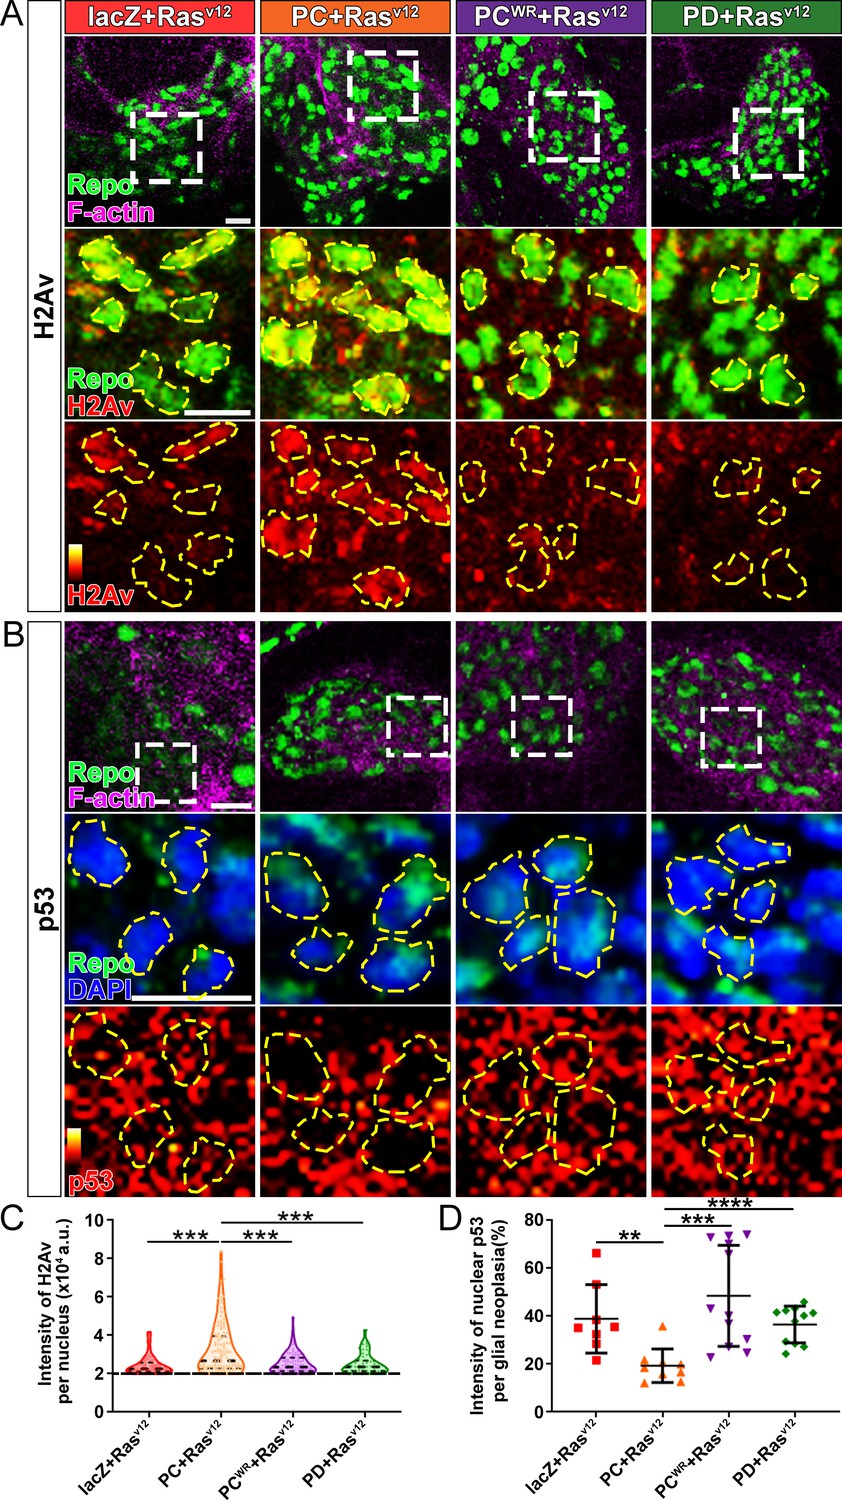
Nmnat-PC inhibits DNA damage-induced p53 activation in glial neoplasia.
(A) Glial neoplasia from flies expressing lacZ, PC, PCWR, or PD were stained with H2Av (red), Repo (green), and F-actin (magenta). The second and third rows are high magnification of the boxed areas in the first row. In the third row, the intensity of H2Av is indicated by a heatmap (0–4095). (B) Glial neoplasia from flies expressing lacZ, PC, PCWR, or PD were stained with p53, Repo (green), F-actin (magenta), and DAPI (blue). The second and third rows are high magnification of the boxed areas in the first row. In the third row, the intensity of p53 is indicated by a heatmap (0–4095). Yellow dashed lines indicate the nuclear areas. Scale bars, 10 µm. (C) Quantification of H2Av intensity in Repo-positive cells. The black dashed line indicates the threshold. According to the lacZ group, value 20,000 is set as the threshold. Data are presented as median ± quartiles, n≥3. Significance level was established by one-way ANOVA post hoc Bonferroni test. (D) Quantification of nuclear p53 intensity. Data are presented as mean ± s.d., n≥3. Significance level was established by t-test. **p≤0.01; ***p≤0.001; ****p≤0.0001.
Figure 7
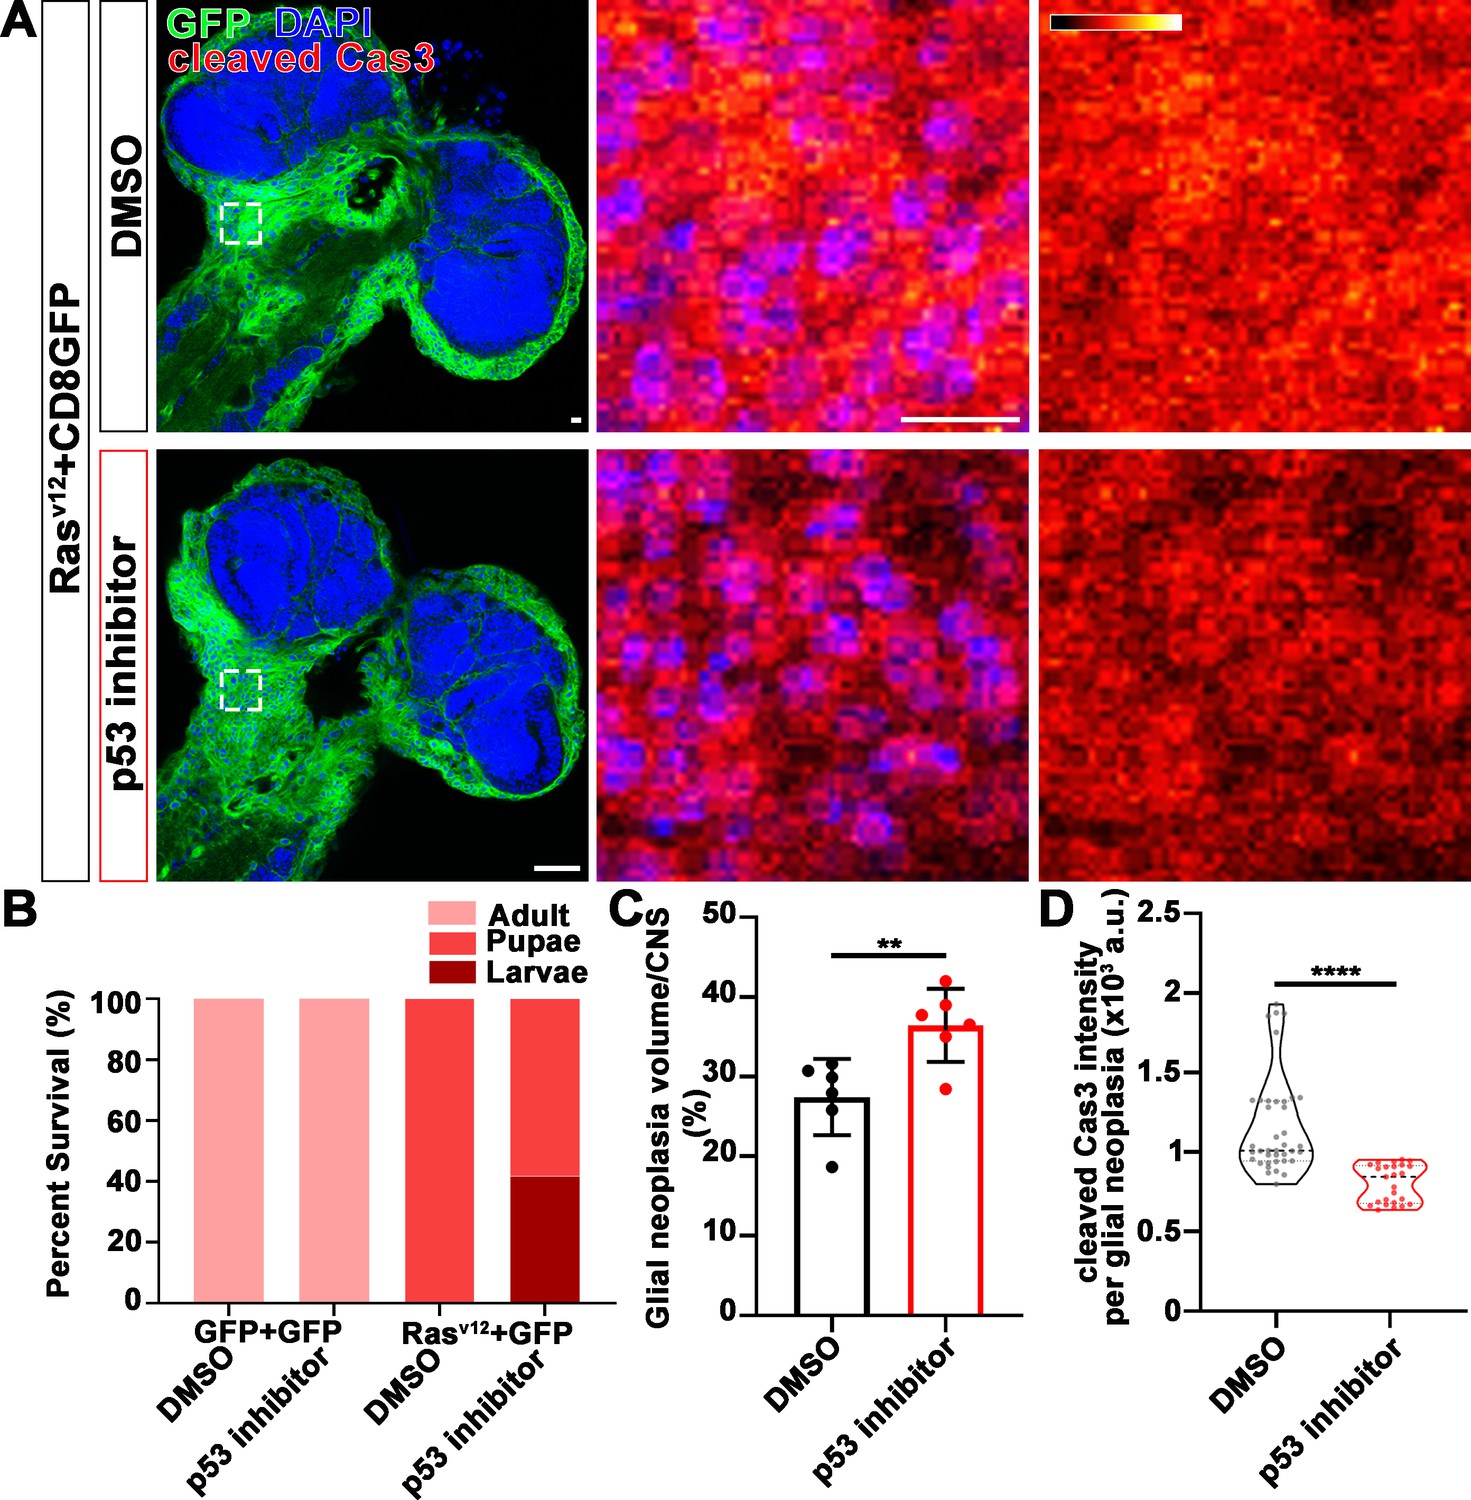
p53 inhibitor increases glial neoplasia volume in CNS and larvae lethality.
(A) Flies expressing Rasv12 and CD8GFP were treated with DMSO or p53 inhibitor, respectively, stained with cleaved caspase-3 (red) and DAPI (blue). The first column is the whole CNS of flies. White dashed lines indicate the glial neoplasia areas. The second and third columns are high magnification of the boxed white areas in the first row. The intensity of cleaved caspase-3 is indicated by a heatmap (0–4095). Scale bars, 10 µm. (B) Survival rate of flies. (C) Quantification of ratio of glial neoplasia volumes in CNS. Data are presented as mean ± s.d., n≥3. Significance level was established by one-way ANOVA post hoc Bonferroni test. (D) Quantification of cleaved caspase-3 intensity. Data are presented as median ± quartiles, n≥3. Significance level was established by one-way ANOVA post hoc Bonferroni test. **p≤0.01; ****p≤0.0001. CNS, central nervous system.
Figure 8 with 1 supplement
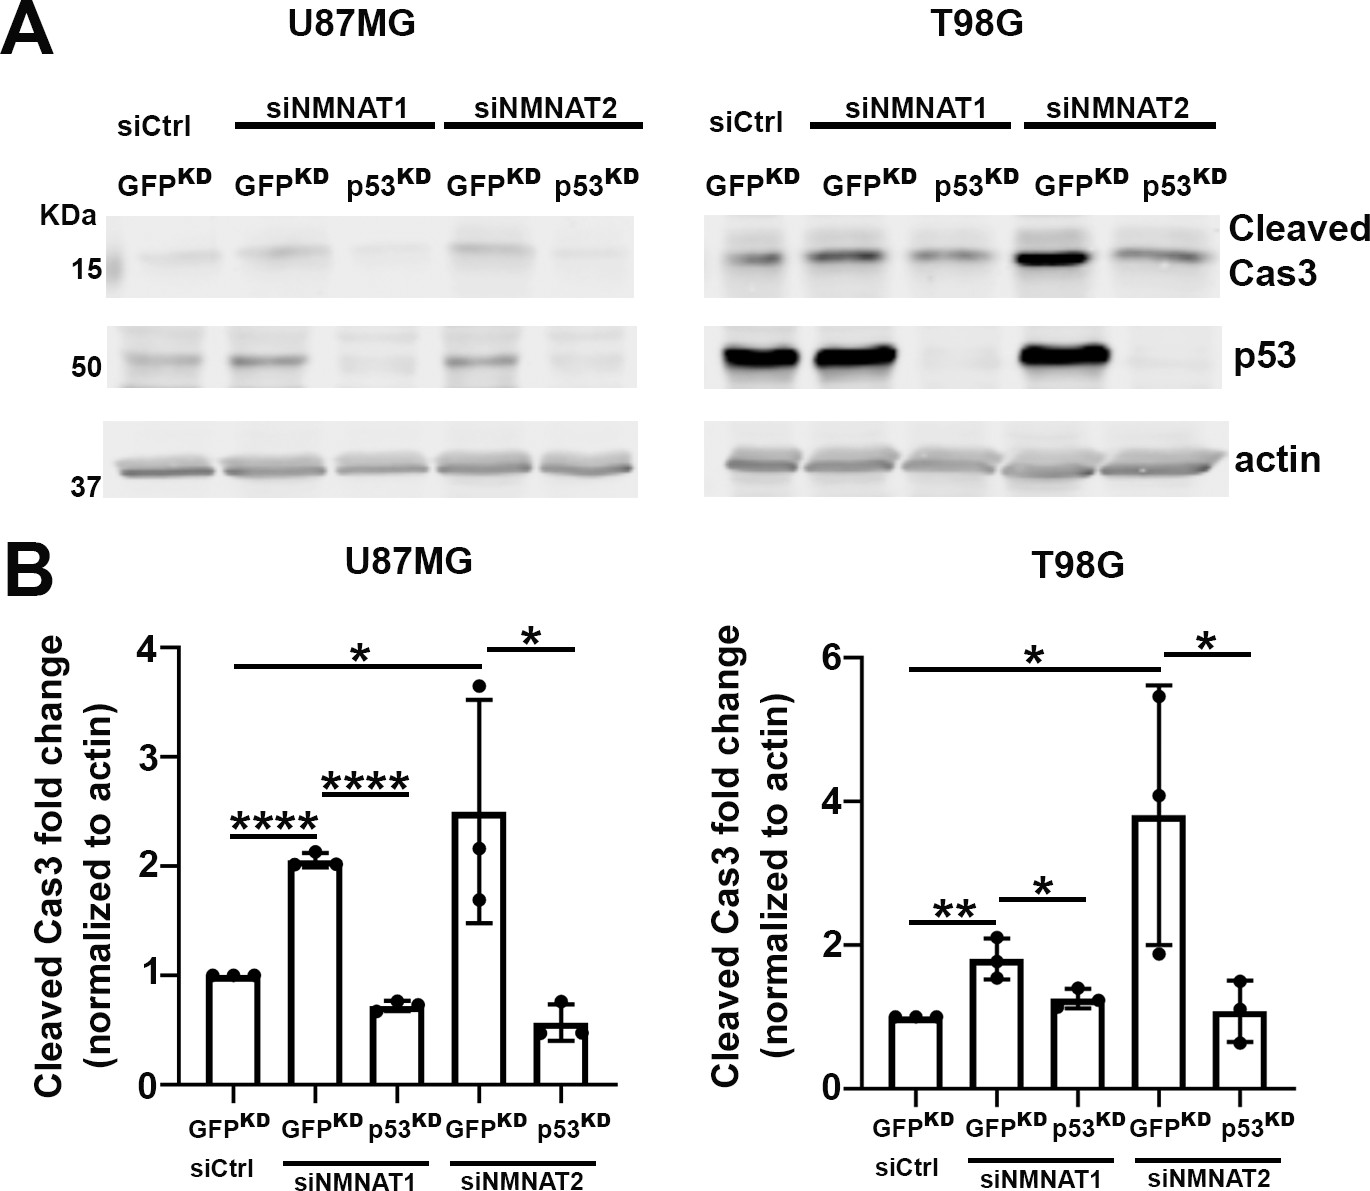
p53 depletion rescues NMNAT knockdown induced caspase-3 activation in glioma.
(A) Proteins were extracted from U87MG and T98G cells transfected with siNMNAT1/2 after knockdown of p53 or GFP by shRNA lentivirus transduction for Western blot analysis. β-actin was used as an internal control. (B) Quantification of cleaved caspase-3 in Western blot analysis. Data are presented as mean ± s.d., n≥4. Significance level was established by t-test. *p≤0.05; **p≤0.01; ****p≤0.0001. NMNAT, nicotinamide mononucleotide adenylyltransferase.
-
Figure 8—source data 1
p53 depletion rescued NMNAT knockdown-induced caspase-3 activation in glioma.
- https://cdn.elifesciences.org/articles/70046/elife-70046-fig8-data1-v1.doc
Figure 8—figure supplement 1

p53 depletion rescues NMNAT knockdown induced caspase-3 activation in glioma.
(A) Proteins were extracted from U87MG and T98G cells transfected with siRNA for Western blot analysis. β-actin was used as an internal control. (B) Quantification of cleaved caspase-3 in Western blot analysis. Data are presented as mean ± s.d., n≥4. Significance level was established by t-test. *p ≤0.05; **p≤0.01. NMNAT, nicotinamide mononucleotide adenylyltransferase.
-
Figure 8—figure supplement 1—source data 1
p53 depletion rescued NMNAT knockdown-induced caspase-3 activation in glioma.
- https://cdn.elifesciences.org/articles/70046/elife-70046-fig8-figsupp1-data1-v1.doc
Figure 9 with 2 supplements
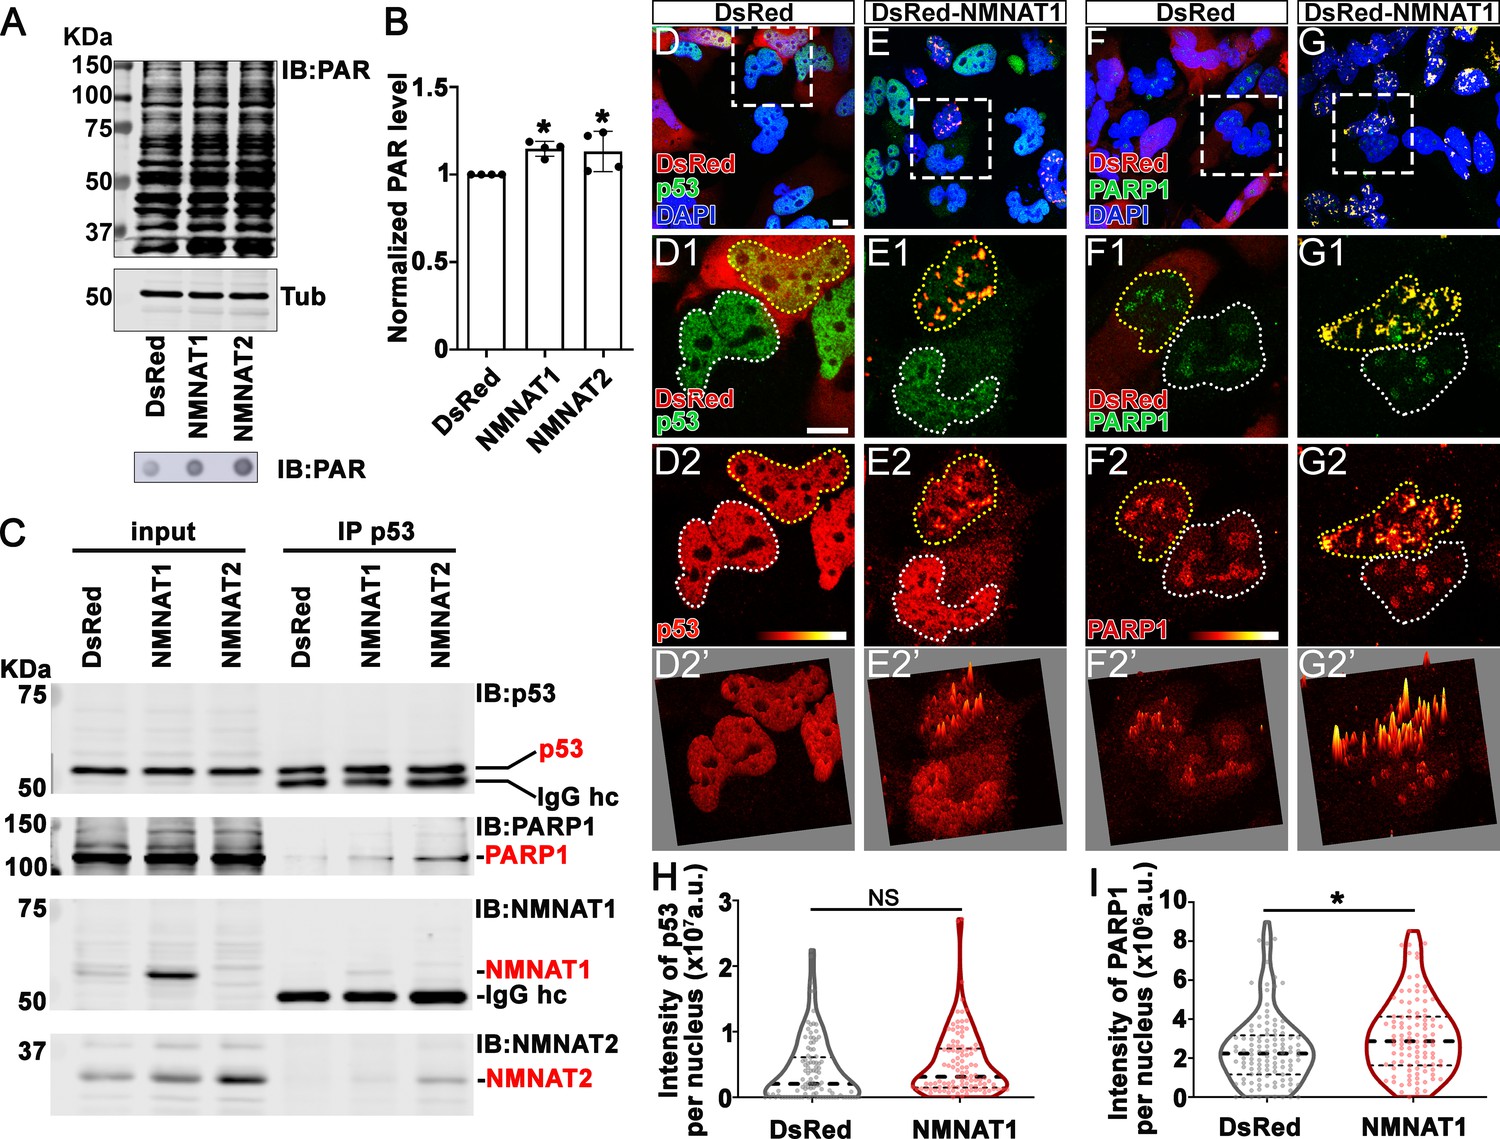
NMNAT interacts with p53 and PARP1 and upregulates PARylation.
(A) Proteins were extracted from T98G cells transfected with plasmids for Western blot and dot blot analyses using anti-PAR antibody. (B) Quantification of PAR in Western blot analysis. Data are presented as mean ± s.d., n=4. Significance level was established by t-test. (C) Protein samples extracted from T98G cells transfected with DsRed, DsRed-NMNAT1, or NMNAT2 were immunoprecipitated (IP) with a p53 antibody and subjected to immunoblot (IB) analysis for p53, PARP1, NMNAT1, and NMNAT2. (D–G) T98G cells transfected with DsRed or DsRed-NMNAT1 were stained for DAPI (blue), p53 (green), or PARP1 (green). The second to the fourth rows are high magnification of the boxed area in the first row. The intensity (0–4095) of p53 or PARP is indicated in a heatmap (D2–G2) or surface plot (D2’–G2’). Scale bars, 10 µm. (H) Quantification of nuclear p53. Data are presented as median ± quartiles, n≥100. Significance level was established by one-way ANOVA post hoc Bonferroni test. (I) Quantification of PARP1 intensity. Data are presented as median ± quartiles, n≥100. Significance level was established by one-way ANOVA post hoc Bonferroni test. *p≤0.05. NS, not significant. NMNAT, nicotinamide mononucleotide adenylyltransferase.
-
Figure 9—source data 1
NMNAT interacts with p53 and PARP1 and upregulates PARylation.
- https://cdn.elifesciences.org/articles/70046/elife-70046-fig9-data1-v1.doc
Figure 9—figure supplement 1
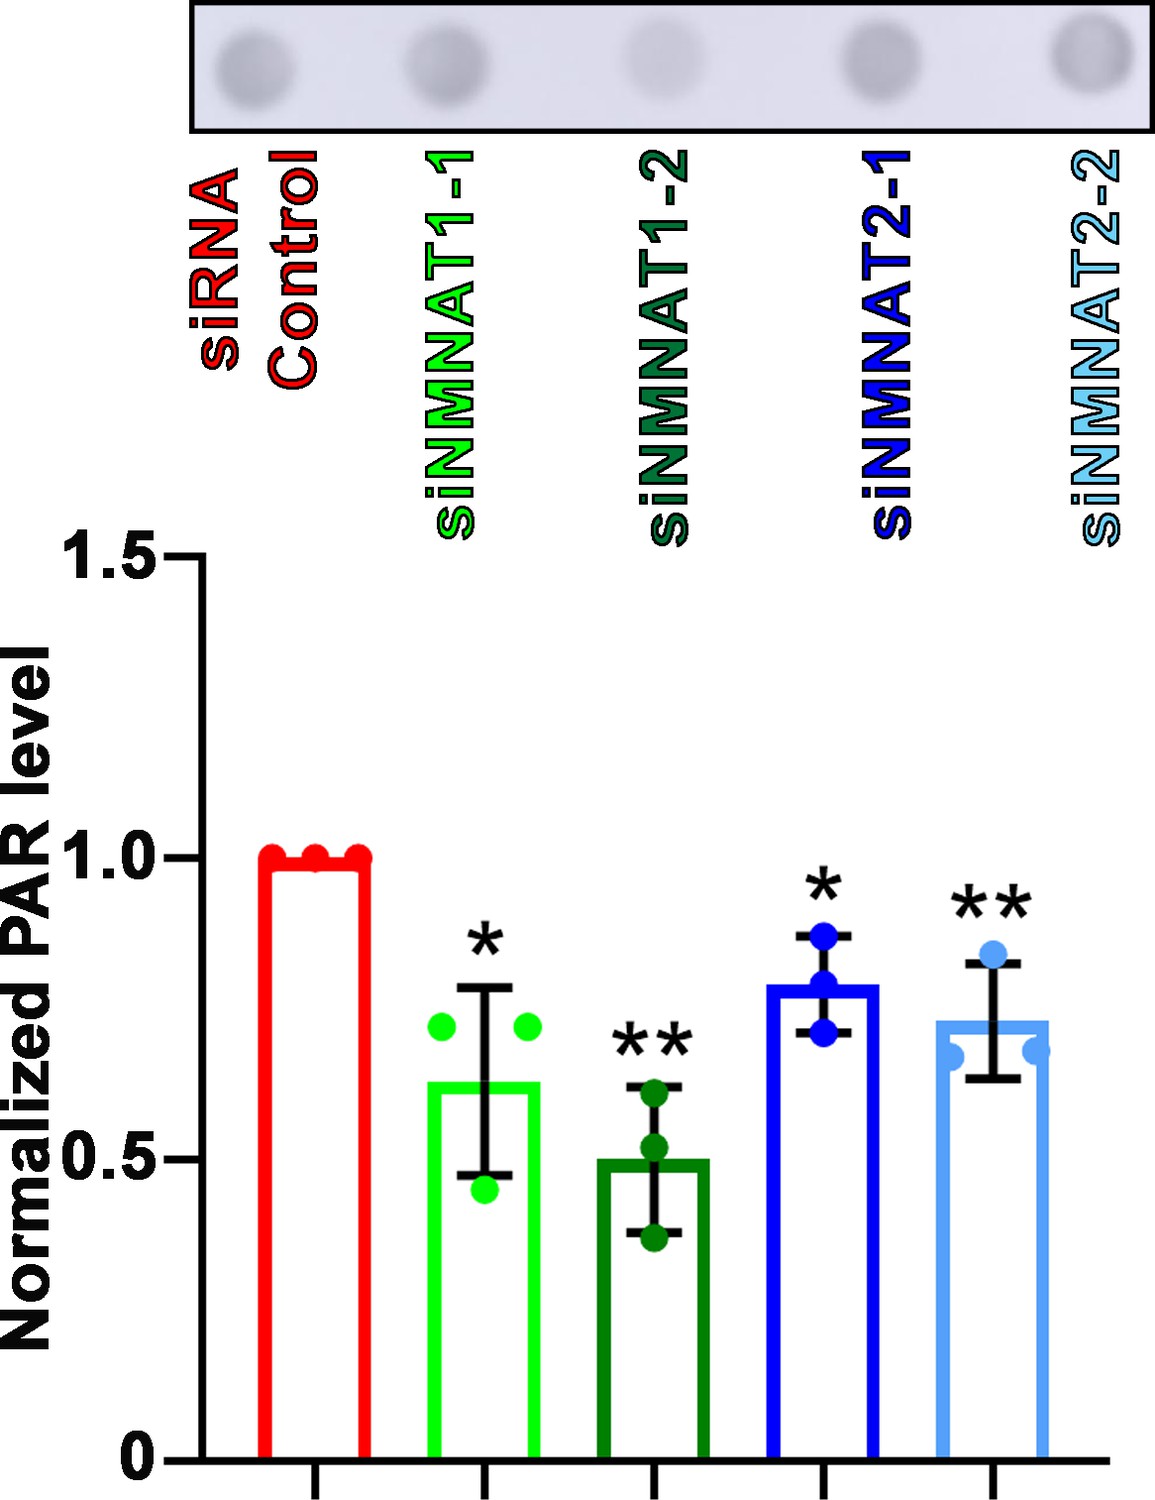
PARylation is reduced after NMNAT knockdown.
Proteins were extracted from T98G cells transfected with siRNA for dot blot analysis using anti-PAR antibody and quantification. Data are presented as mean ± SD, n=3. Significance level was established by t-test. *p≤0.05; **p≤0.01. NMNAT, nicotinamide mononucleotide adenylyltransferase.
Figure 9—figure supplement 2
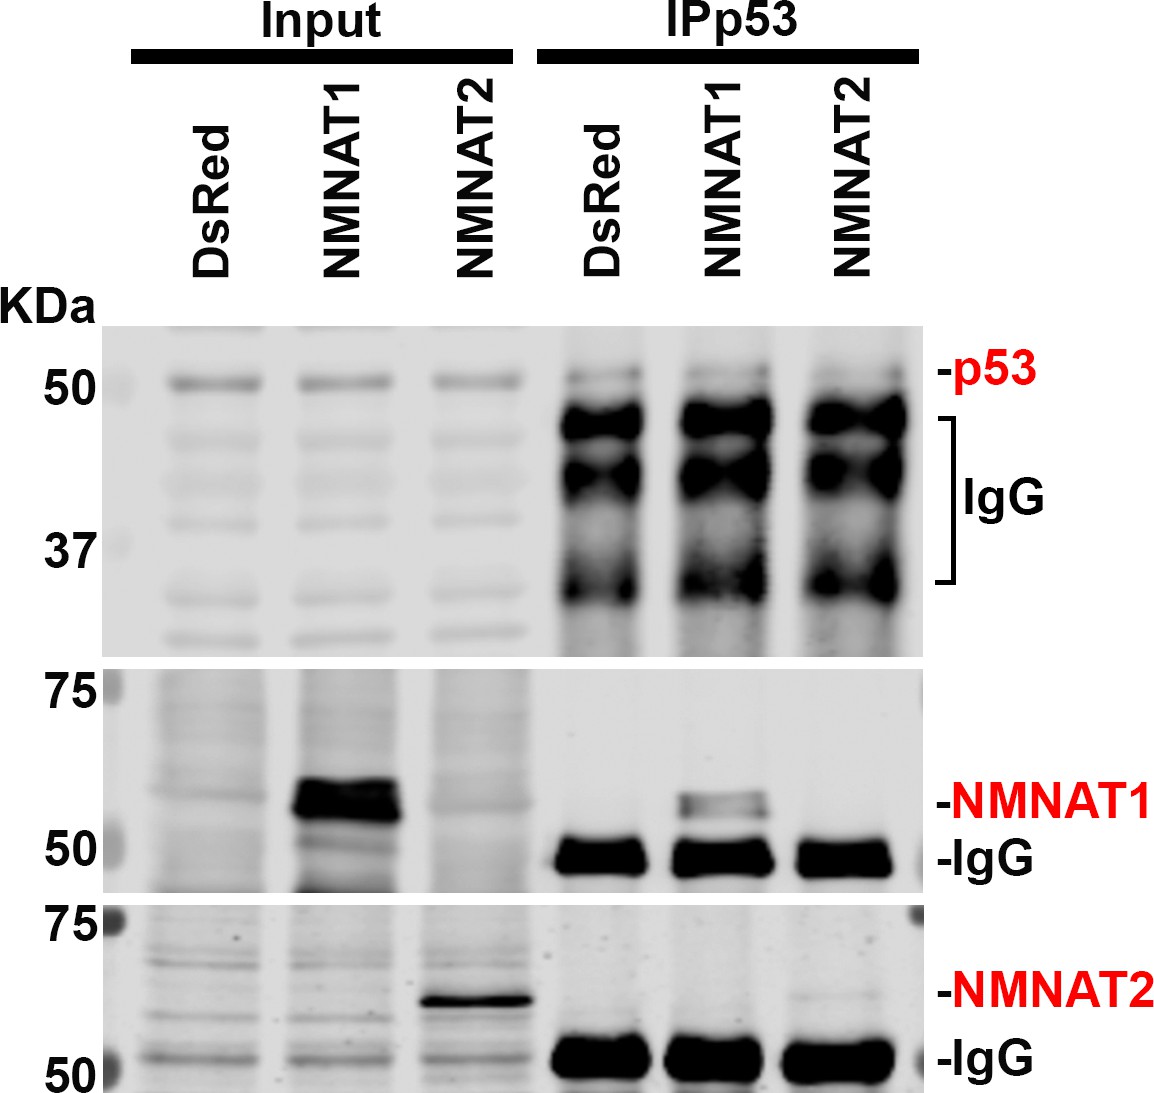
NMNAT interacts with p53 in U87MG.
Protein samples extracted from U87MG cells transfected with DsRed, DsRed-NMNAT1, or DsRed-NMNAT2 were immunoprecipitated (IP) with a p53 antibody and subjected to immunoblot (IB) analysis for p53, PARP1, NMNAT1, and NMNAT2. NMNAT, nicotinamide mononucleotide adenylyltransferase.
-
Figure 9—figure supplement 2—source data 1
NMNAT interacts with p53 in U87MG.
- https://cdn.elifesciences.org/articles/70046/elife-70046-fig9-figsupp2-data1-v1.doc
Figure 10 with 1 supplement
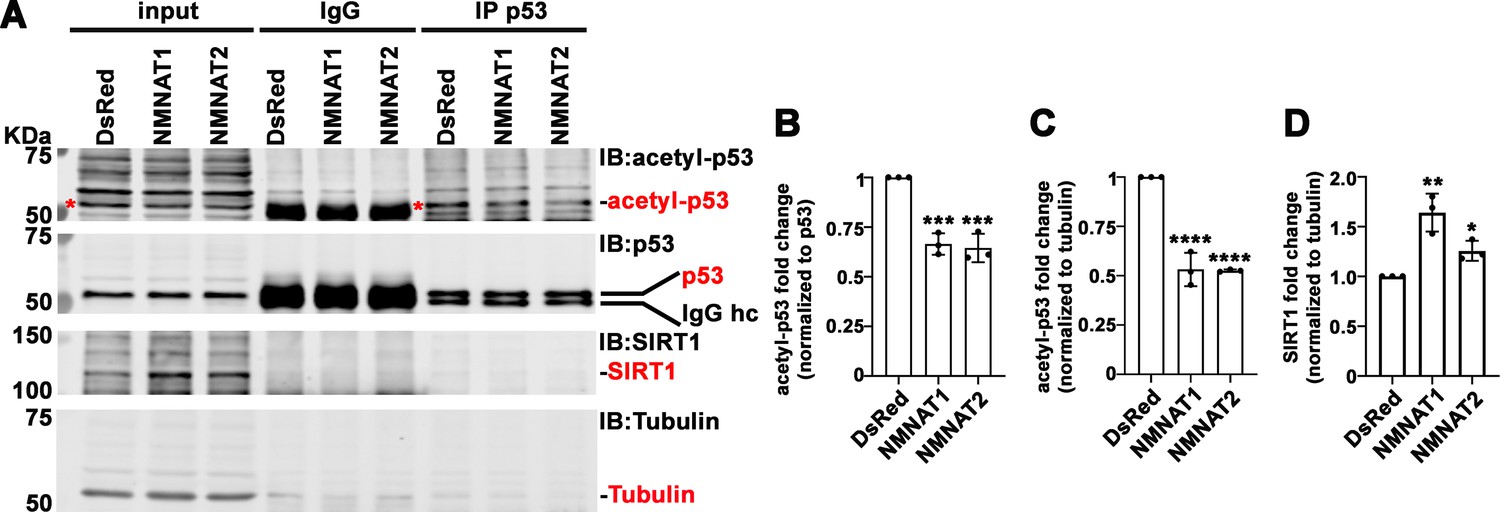
NMNAT upregulates SIRT1 and reduces acetylation of p53.
(A) Protein samples extracted from T98G cells transfected with DsRed, DsRed-NMNAT1, or NMNAT2 were immunoprecipitated (IP) with a p53 antibody and probed for acetyl-p53 and SIRT1. Red asterisks (*) indicate the acetyle-p53 bands in input and IP-ed fractions. (B, C) Quantification of acetyl-p53 in p53-immunoprecipitated fraction (B) and input fraction (C). (D) Quantification of SIRT1. Data are presented as mean ± s.d., n=3. Significance level was established by one-way ANOVA post hoc Bonferroni test. *p≤0.05; **p≤0.01; ***p≤0.001. NMNAT, nicotinamide mononucleotide. adenylyltransferase.
-
Figure 10—source data 1
NMNAT upregulates SIRT1 and reduces acetylation of p53.
- https://cdn.elifesciences.org/articles/70046/elife-70046-fig10-data1-v1.doc
-
Figure 10—source data 2
NMNAT upregulates SIRT1 and reduces acetylation of p53.
- https://cdn.elifesciences.org/articles/70046/elife-70046-fig10-data2-v1.doc
Figure 10—figure supplement 1

Acetyl-p53 is reduced after NMNAT overexpression in U87MG.
U87MG cells were treated with CDDP and probed for p53, acetyl-p53, and tubulin. NMNAT, nicotinamide mononucleotide adenylyltransferase.
-
Figure 10—figure supplement 1—source data 1
Acetyl-p53 was reduced in U87MG cells under NMNAT overexpression conditions.
- https://cdn.elifesciences.org/articles/70046/elife-70046-fig10-figsupp1-data1-v1.doc
Figure 11 with 2 supplements
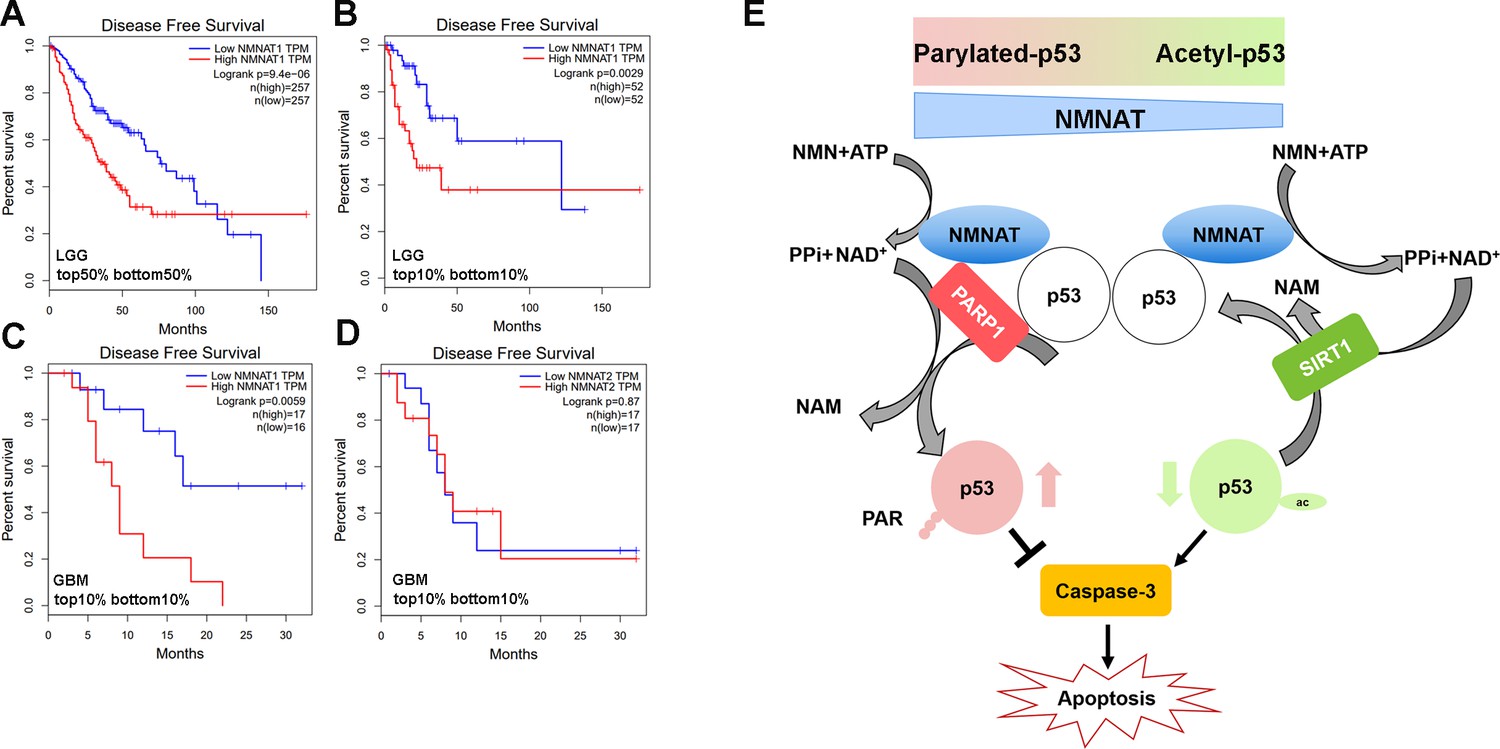
Correlation of tumor NMNAT expression levels with glioma progression.
(A, B) LGG (lower grade glioma) data set (GEPIA). Survival curves for patients with tumors expressing median (top 50% vs. bottom 50%) NMNAT1 levels (A), or top 10% versus bottom 10% levels (B), with associated log-rank p-values shown. Highly significant correlation of high NMNAT1 expression levels with poor patient survival and more aggressive disease. (C, D) GBM (glioblastoma multiform) data set (GEPIA). Survival curves for patients are shown, with tumors expressing top 10% versus bottom 10% NMNAT1 levels (C) and NMNAT2 (D) levels as well as associated log-rank p-values. High NMNAT1-expressing tumors have extremely poor relapse-free rates compared to low NMNAT1-expressing tumors. In contrast, no significant difference in survival is detected for NMNAT2 expression. (E) Model for NMNAT in glioma. In glioma cells, PAPR1 inhibits p53 activity by NAD+ dependent-poly(ADP-ribosyl)ation of p53 during DNA damage repair. NMNAT overexpression replenishes the NAD+ pool to promote poly(ADP-ribosyl)ation and deacetylation of p53, suppressing p53 induced apoptosis, thereby leading to glioma growth. NMNAT, nicotinamide mononucleotide adenylyltransferase.
Figure 11—figure supplement 1

Summary of NMNAT1 and NMNAT2 alteration frequency in cancer types.
Alteration of human NMNAT1 and NMNAT2 was queried in TCGA database (https://www.TCGA.com). 1522 cases with altered NMNAT1 and 931 cases with altered NMNAT2 across 32 projects are shown. NMNAT, nicotinamide mononucleotide adenylyltransferase.
Figure 11—figure supplement 2
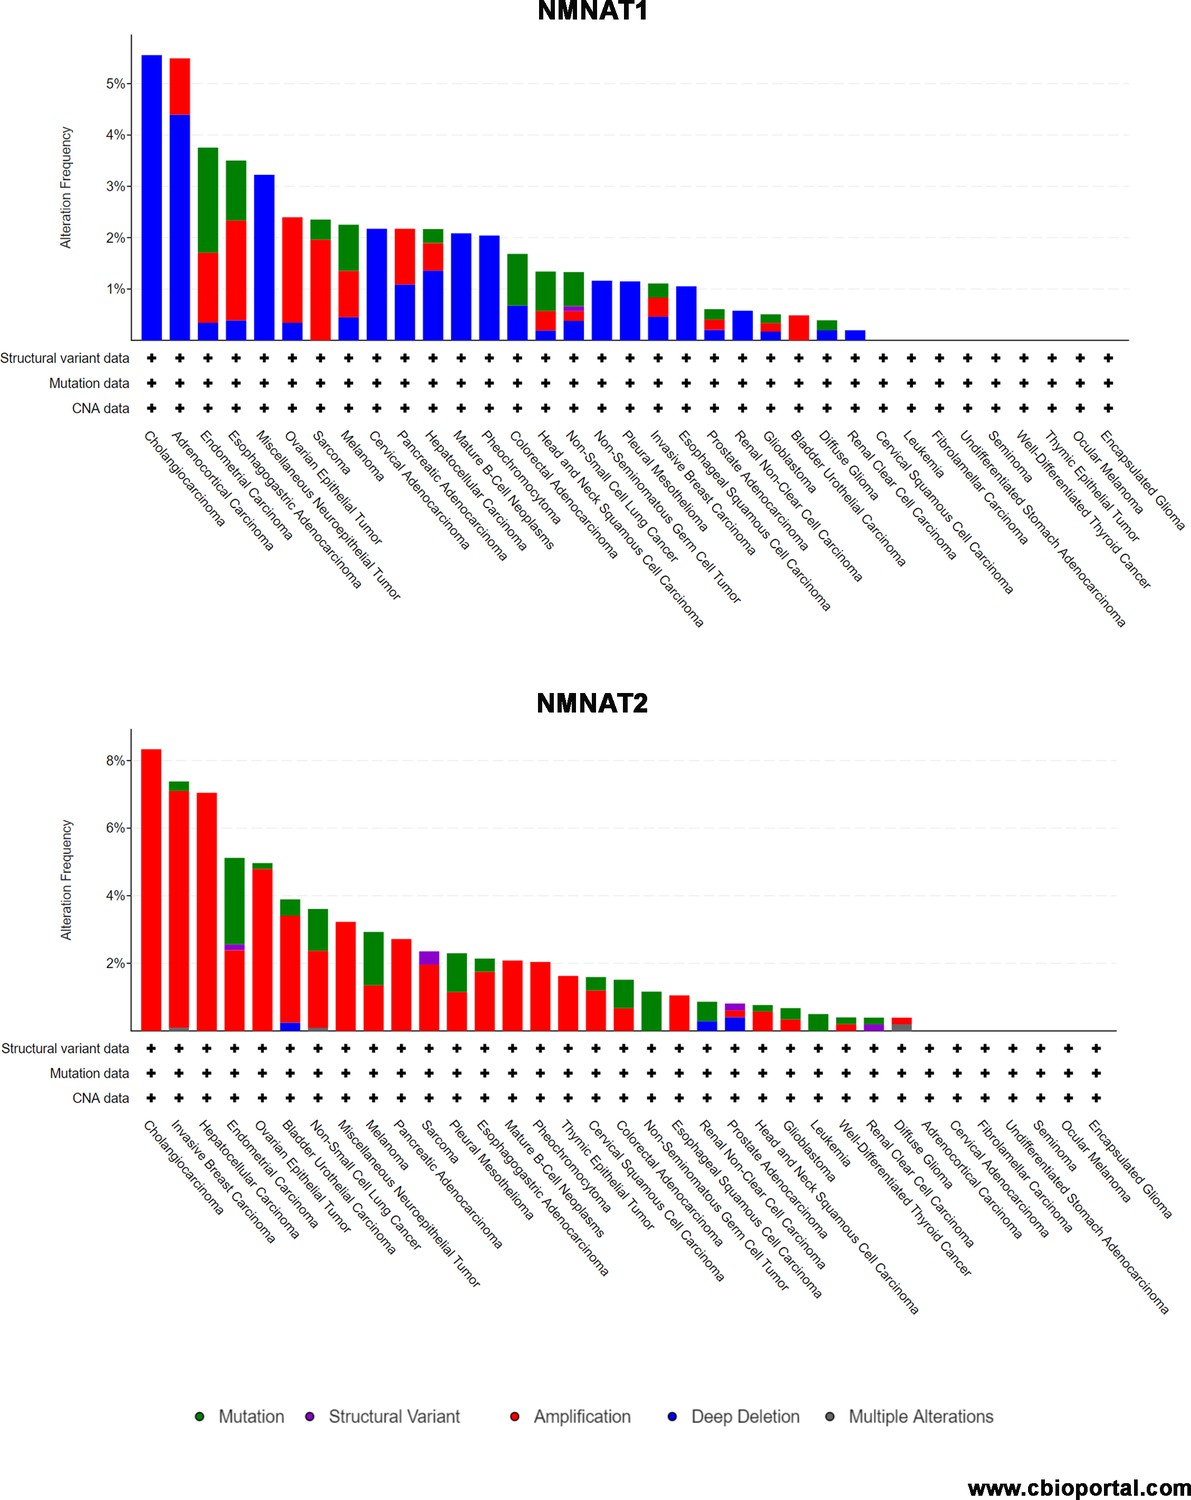
Summary of NMNAT1 and NMNAT2 alteration frequency in cancer types.
Alteration of human NMNAT1 and NMNAT2 was queried in cBioPortal database (https://www.cbioportal.com) separately. 10,967 samples in 35 cancer types are shown. NMNAT, nicotinamide mononucleotide adenylyltransferase.
Tables
Author response table 1
Gene effect analysis using DepMap.
org dataset
| Manuscript | Cancer | Cell Line | Gene | Gene effect (CERES) | Expression (Log2(TPM+1)) |
|---|---|---|---|---|---|
| Liu et al. (2021). bioRxiv.(this manuscript) | Glioma | T98G | NMNAT1NMNAT2 | -0.427-0.0177 | 2.872.29 |
| U87MG | NMNAT1NMNAT2 | -0.1590.156 | 3.15.74 | ||
| Challa et al. (2021). Cell | Ovarian | OVCAR3 | NMNAT1NMNAT2 | -0.2190.0989 | 3.264.18 |
| Shi et al. (2021).Science Advances | Acute myeloid leukaemia | MOLM13 | NMNAT1NMNAT2 | -0.33-0.00213 | 2.310.189 |
| OCIAML2 | NMNAT1NMNAT2 | 0.0588 0.0624 | 0.8881.52 |
Additional files
-
Transparent reporting form
- https://cdn.elifesciences.org/articles/70046/elife-70046-transrepform1-v1.doc
-
Source data 1
Original data file.
- https://cdn.elifesciences.org/articles/70046/elife-70046-supp1-v1.xlsx
Download links
A two-part list of links to download the article, or parts of the article, in various formats.
Downloads (link to download the article as PDF)
Open citations (links to open the citations from this article in various online reference manager services)
Cite this article (links to download the citations from this article in formats compatible with various reference manager tools)
NMNAT promotes glioma growth through regulating post-translational modifications of P53 to inhibit apoptosis
eLife 10:e70046.
https://doi.org/10.7554/eLife.70046


